1. Introduction
Energy, in particular renewable energy, is a fundamental theme when discussing sustainability [
1], encompassing production and transformation, energy use, transport and distribution, storage, and energy flow management [
2,
3]. An integrated model of energy systems moves beyond a sectoral approach, aiming for optimal resource utilization, though this also increases complexity [
4,
5].
In recent years, the penetration of renewable energy sources has become central. Renewables, particularly hydropower, wind, and solar photovoltaics, have seen remarkable growth in electricity generation. According to the International Energy Agency (IEA), IRENA, and other sources [
6,
7,
8], at least 30% of global electricity is now generated from renewable sources, with even higher shares in some countries. For instance, in Italy, over 40% of electricity comes from renewables, such as solar, wind, and hydropower [
9]. However, this shift introduces complexity, aligning production with consumption. The variability and intermittency of sources, such as solar and wind, demand innovative solutions to ensure system stability and reliability, a topic under study since the 2010s, especially in Europe [
10,
11]. The global transition to renewables is a key element in achieving sustainability goals. However, it comes with significant technical and economic challenges that require innovation, infrastructure upgrades, and careful planning [
12,
13]. While many issues are at play, one universally acknowledged as highly significant is forecasting, both of energy final uses and energy production. This topic is particularly critical in the electricity sector, where the complexity of implementing efficient energy storage systems makes accurate forecasting even more essential for maintaining balance and reliability [
14,
15,
16].
One of the primary challenges of renewable energy is its variability. Sources such as wind and solar are inherently intermittent, which can lead to instability in the power grid [
17]. To address this, monitoring systems have advanced, allowing us to optimize energy flows within the grid and ensuring efficient use and allocation of resources and energy storage solutions. Technologies such as batteries and other storage methods can absorb surplus energy during peak production and release it when demand exceeds supply, maintaining grid balance [
18].
The growing share of renewable energy demands a significant upgrade of transmission and distribution networks, so the topic of modernizing transmission and distribution infrastructure is a relevant topic of research. Modernization efforts should focus on upgraded transmission devices designed to handle higher energy loads while ensuring reliability and the development of smart grid technologies. These enable real-time, two-way communication between consumers and the grid, creating a more dynamic and adaptive energy distribution system [
19]. As renewable energy increases in the mix, ensuring continuous balance between energy supply and demand becomes increasingly complex. Effective dispatching requires efficient energy technologies to optimize production and reduce inefficiencies and integrated control systems to enhance the management of production, distribution, and consumption [
20].
Forecasting continues to be a critical tool in ensuring system efficiency and stability. By leveraging advanced techniques, such as machine learning, we can accurately predict energy demand and supply, enabling proactive resource management; anticipating demand patterns ensures optimal production and distribution. Accurate forecasts empower operators to optimize energy flows, plan infrastructure upgrades, and respond effectively to fluctuations in supply and demand. A thorough understanding of energy demand is critical to system efficiency. This allows us to optimize production and distribution by tailoring energy generation to actual needs, reducing inefficiencies. Proactive maintenance and development of resilient systems prevent outages and blackouts. Addressing these challenges requires comprehensive strategies and innovative approaches. In this regard, Ref. [
21] explores a range of critical issues related to smart energy systems, providing valuable methodologies to enhance their reliability, efficiency, and sustainability.
1.1. State of the Art
The forecasting of electricity demand has become a critical aspect of grid management, as accurate predictions enable the optimization of operations and support decision-making processes related to energy production and distribution. This not only enhances operational efficiency but also improves the reliability of energy systems.
Based on factors such as data availability and system complexity, the problem of predicting energy demand can be tackled by different methods, including statistical models, machine learning algorithms, and physics-based models. Load forecasting has been a fundamental business problem since the inception of the electric power industry [
22]. Traditionally, energy demand forecasting relied on statistical and mathematical models, such as time series analysis and regression techniques, which were effective in identifying patterns in structured data [
23]. However, with the growing availability of detailed consumption data and the increasing complexity of energy systems, these methods have faced limitations in capturing non-linear relationships and dynamic behaviors [
24]. The advent of data-driven approaches, fueled by advancements in machine learning, has significantly transformed forecasting methodologies [
25]. Big data analytics further enhances this transformation by enabling more accurate and real-time insights into energy consumption patterns, facilitating smarter energy management [
26]. Machine learning, a subset of artificial intelligence, employs sophisticated statistical techniques to uncover complex patterns in large datasets. These models can adapt to evolving data trends and account for various factors influencing energy demand, such as weather conditions, economic activities, and consumer behavior [
27].
Key machine learning techniques applied in energy forecasting include supervised learning models [
28], deep learning architectures [
29] and hybrid models [
30]. Among these, supervised learning models, such as support vector machines (SVMs), random forests (RF), and neural networks (NN), are widely utilized for demand prediction, leveraging their ability to identify patterns in large datasets. Deep learning architectures, including recurrent neural networks (RNNs), are particularly notable for their capability to capture temporal dependencies and sequential patterns, making them highly effective in time-series forecasting. Additionally, hybrid models combine machine learning techniques with physical knowledge. These models bridge the gap between data-driven models and energy systems, offering a reliable framework for forecasting.
As energy systems continue to evolve towards greater complexity and renewable integration, the role of machine learning in forecasting will become increasingly vital for achieving sustainable and resilient energy management.
Traditional methods, such as regression models and time-series analysis (e.g., ARIMA), remain useful for capturing seasonal trends and cyclical patterns. However, the increasing availability of large, complex datasets has accelerated the adoption of machine learning techniques, which better capture non-linear relationships and temporal dependencies. Deep learning models, such as long short-term memory (LSTM) networks and gated recurrent units (GRUs), are particularly effective for time-series forecasting, while hybrid approaches integrate these methods with classical techniques for greater accuracy. Many traditional approaches rely heavily on historical data and assume linear behavior, making them inadequate for capturing the nonlinear dynamics and increased variability introduced by renewable energy sources and distributed generation. Furthermore, data quality and integration across diverse sources, such as weather, socioeconomic indicators, and sensor data, remain complex, and most models struggle to adapt to abrupt changes, such as extreme weather events or economic disruptions. Even advanced AI-based models often suffer from limited transparency and scalability. Addressing these challenges is essential to improve forecasting accuracy, ensure grid stability, and support the transition toward a more resilient and renewable-driven energy system.
1.2. Objectives of the Paper
The objective of this paper is to contribute to the ongoing research on energy demand forecasting by applying advanced machine learning techniques. In this context, we investigate the adaptability of a forecasting algorithm to a well-defined dataset.
Although this topic has been extensively studied and numerous contributions exist in the literature, forecasting errors are still significant, particularly in critical and unpredictable situations, highlighting the need for more robust and adaptable approaches. The increasing penetration of renewable energy plants and the widespread deployment of small-scale generation units make forecasting increasingly complex and uncertain, calling for advanced models capable of adapting to a new, distributed and highly variable energy landscape. We apply our approach to a large and realistic dataset—the electricity demand in Italy. In this study, we focus on testing the performance of recurrent neural network models through numerical experiments, given their promising capabilities in handling sequential data. Recurrent neural networks (RNNs) are neural networks with cycles, where outputs can become future inputs. This makes them particularly suited for time-series forecasting. Specifically, we implemented the long short-term memory (LSTM) model, a type of RNN designed to capture both short and long-term dependencies in sequential data. While RNNs have been widely explored in energy forecasting [
31], much of the existing research relies on theoretical models or simulated datasets. This study contributes by applying RNNs to real electricity demand data, providing empirical validation and insights into their practical implementation challenges and benefits.
2. Background and Statement of the Problem
In recent years, driven by the increasing implementation of sustainability and climate change policies, renewable energy sources have gained significant traction in power systems. This shift has been particularly evident in many European countries, where the traditional model of centralized power generation has gradually evolved into a distributed generation system. The need to efficiently generate and utilize energy, especially in the context of high renewable penetration, has brought forecasting to the forefront of energy management. In this regard, the Italian energy system presents a valuable platform for testing forecasting algorithms, given its dynamic and evolving nature. The Italian energy system, like many others, has undergone a rapid transformation in recent years, shifting from a centralized structure with a few large power plants to a decentralized system comprising millions of small-scale generation units. Unlike many other energy markets, however, Italy stands out due to the small size of these units, with the average capacity of installations being significantly lower. This shift is primarily driven by the rapid growth of renewable energy sources, such as PV solar and wind. The challenge of managing energy flows, which has been recognized for some time, has become significantly more complex in recent years. At the end of March 2025, Italy had about 1,900,000 plants in operation, the major number are photovoltaic (PV) plants (1,878,780), with a total installed capacity of 37.9 MW [
32]. The installed capacity for different renewable energy sources is distributed as follows:
- −
Photovoltaics: 37.9 GW;
- −
Wind: 13.0 GW;
- −
Hydropower: 21.6 GW;
- −
Bioenergy and Geothermal: 4.8 GW.
The increasing penetration of intermittent renewable sources, such as solar and wind, not only introduces variability in generation but also alters load profiles due to prosumer behaviours and local balancing mechanisms, as discussed in [
33]. Recent events, such as the blackout in Spain, highlight how regional imbalances and insufficient forecasting accuracy can amplify the impact of renewable variability on system reliability [
34].
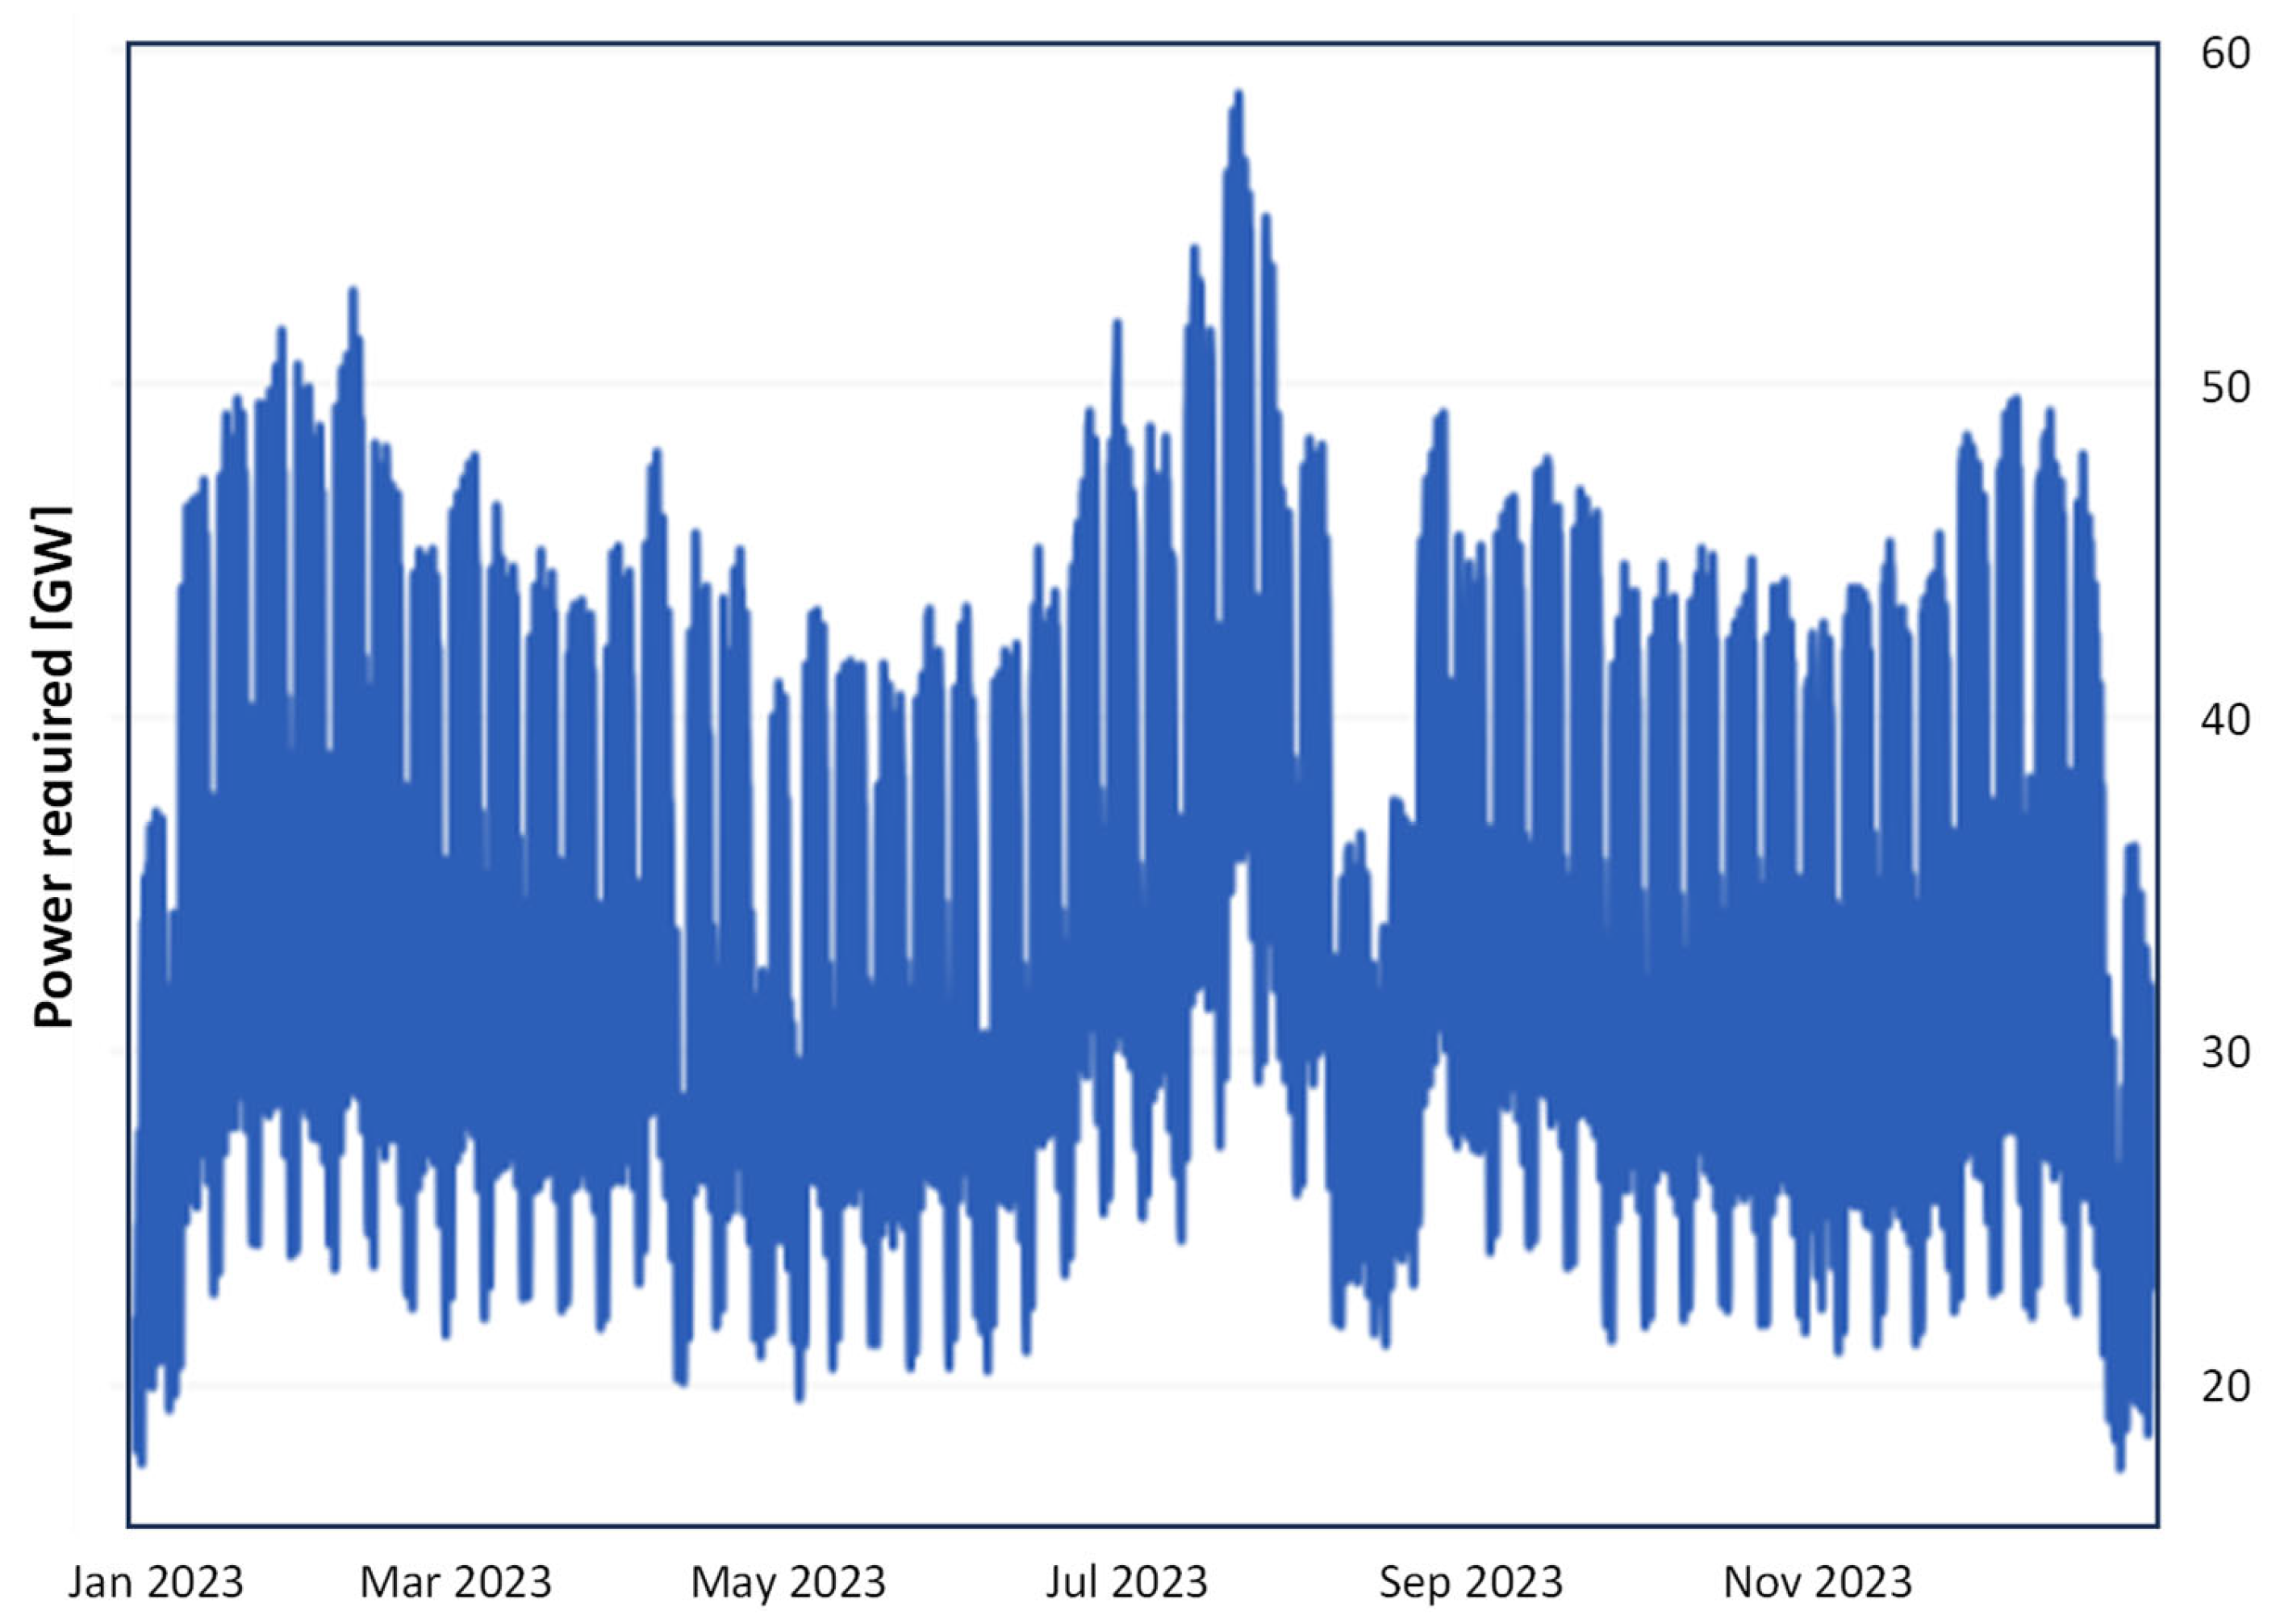
Figure 1 illustrates the complexity of the electricity system, characterized by the interaction of millions of users and generation units, often interconnected. These elements contribute to a dynamic network where electricity flows are frequently bidirectional, due to the presence of distributed energy resources, such as solar panels and small-scale producers. The system must balance highly variable consumption patterns with equally variable production profiles, also accounting for imported energy, typically concentrated during night hours. Furthermore, the increasing penetration of renewable energy sources, such as solar and wind, adds to this challenge due to their inherent intermittency and unpredictability. Ensuring grid stability and a reliable electricity supply, therefore, requires the integration of emerging technologies, including energy storage systems, demand-response strategies, and green hydrogen. Hydrogen can act as a flexible energy carrier, storing excess renewable production and making it available when needed, thus contributing to the system’s dynamic balance. This intricate and evolving structure highlights the need for accurate forecasting to ensure system stability and enable efficient energy management. The analysis of electricity consumption in Italy highlights the evolving dynamics of energy demand, shaped by seasonal variations, daily usage patterns, and the growing impact of renewable energy sources.
In recent years, peak demand has increasingly shifted toward the summer months, reflecting broader changes in consumption behavior and energy system operation. A wide range of data is now available to support research and analysis in the energy sector.
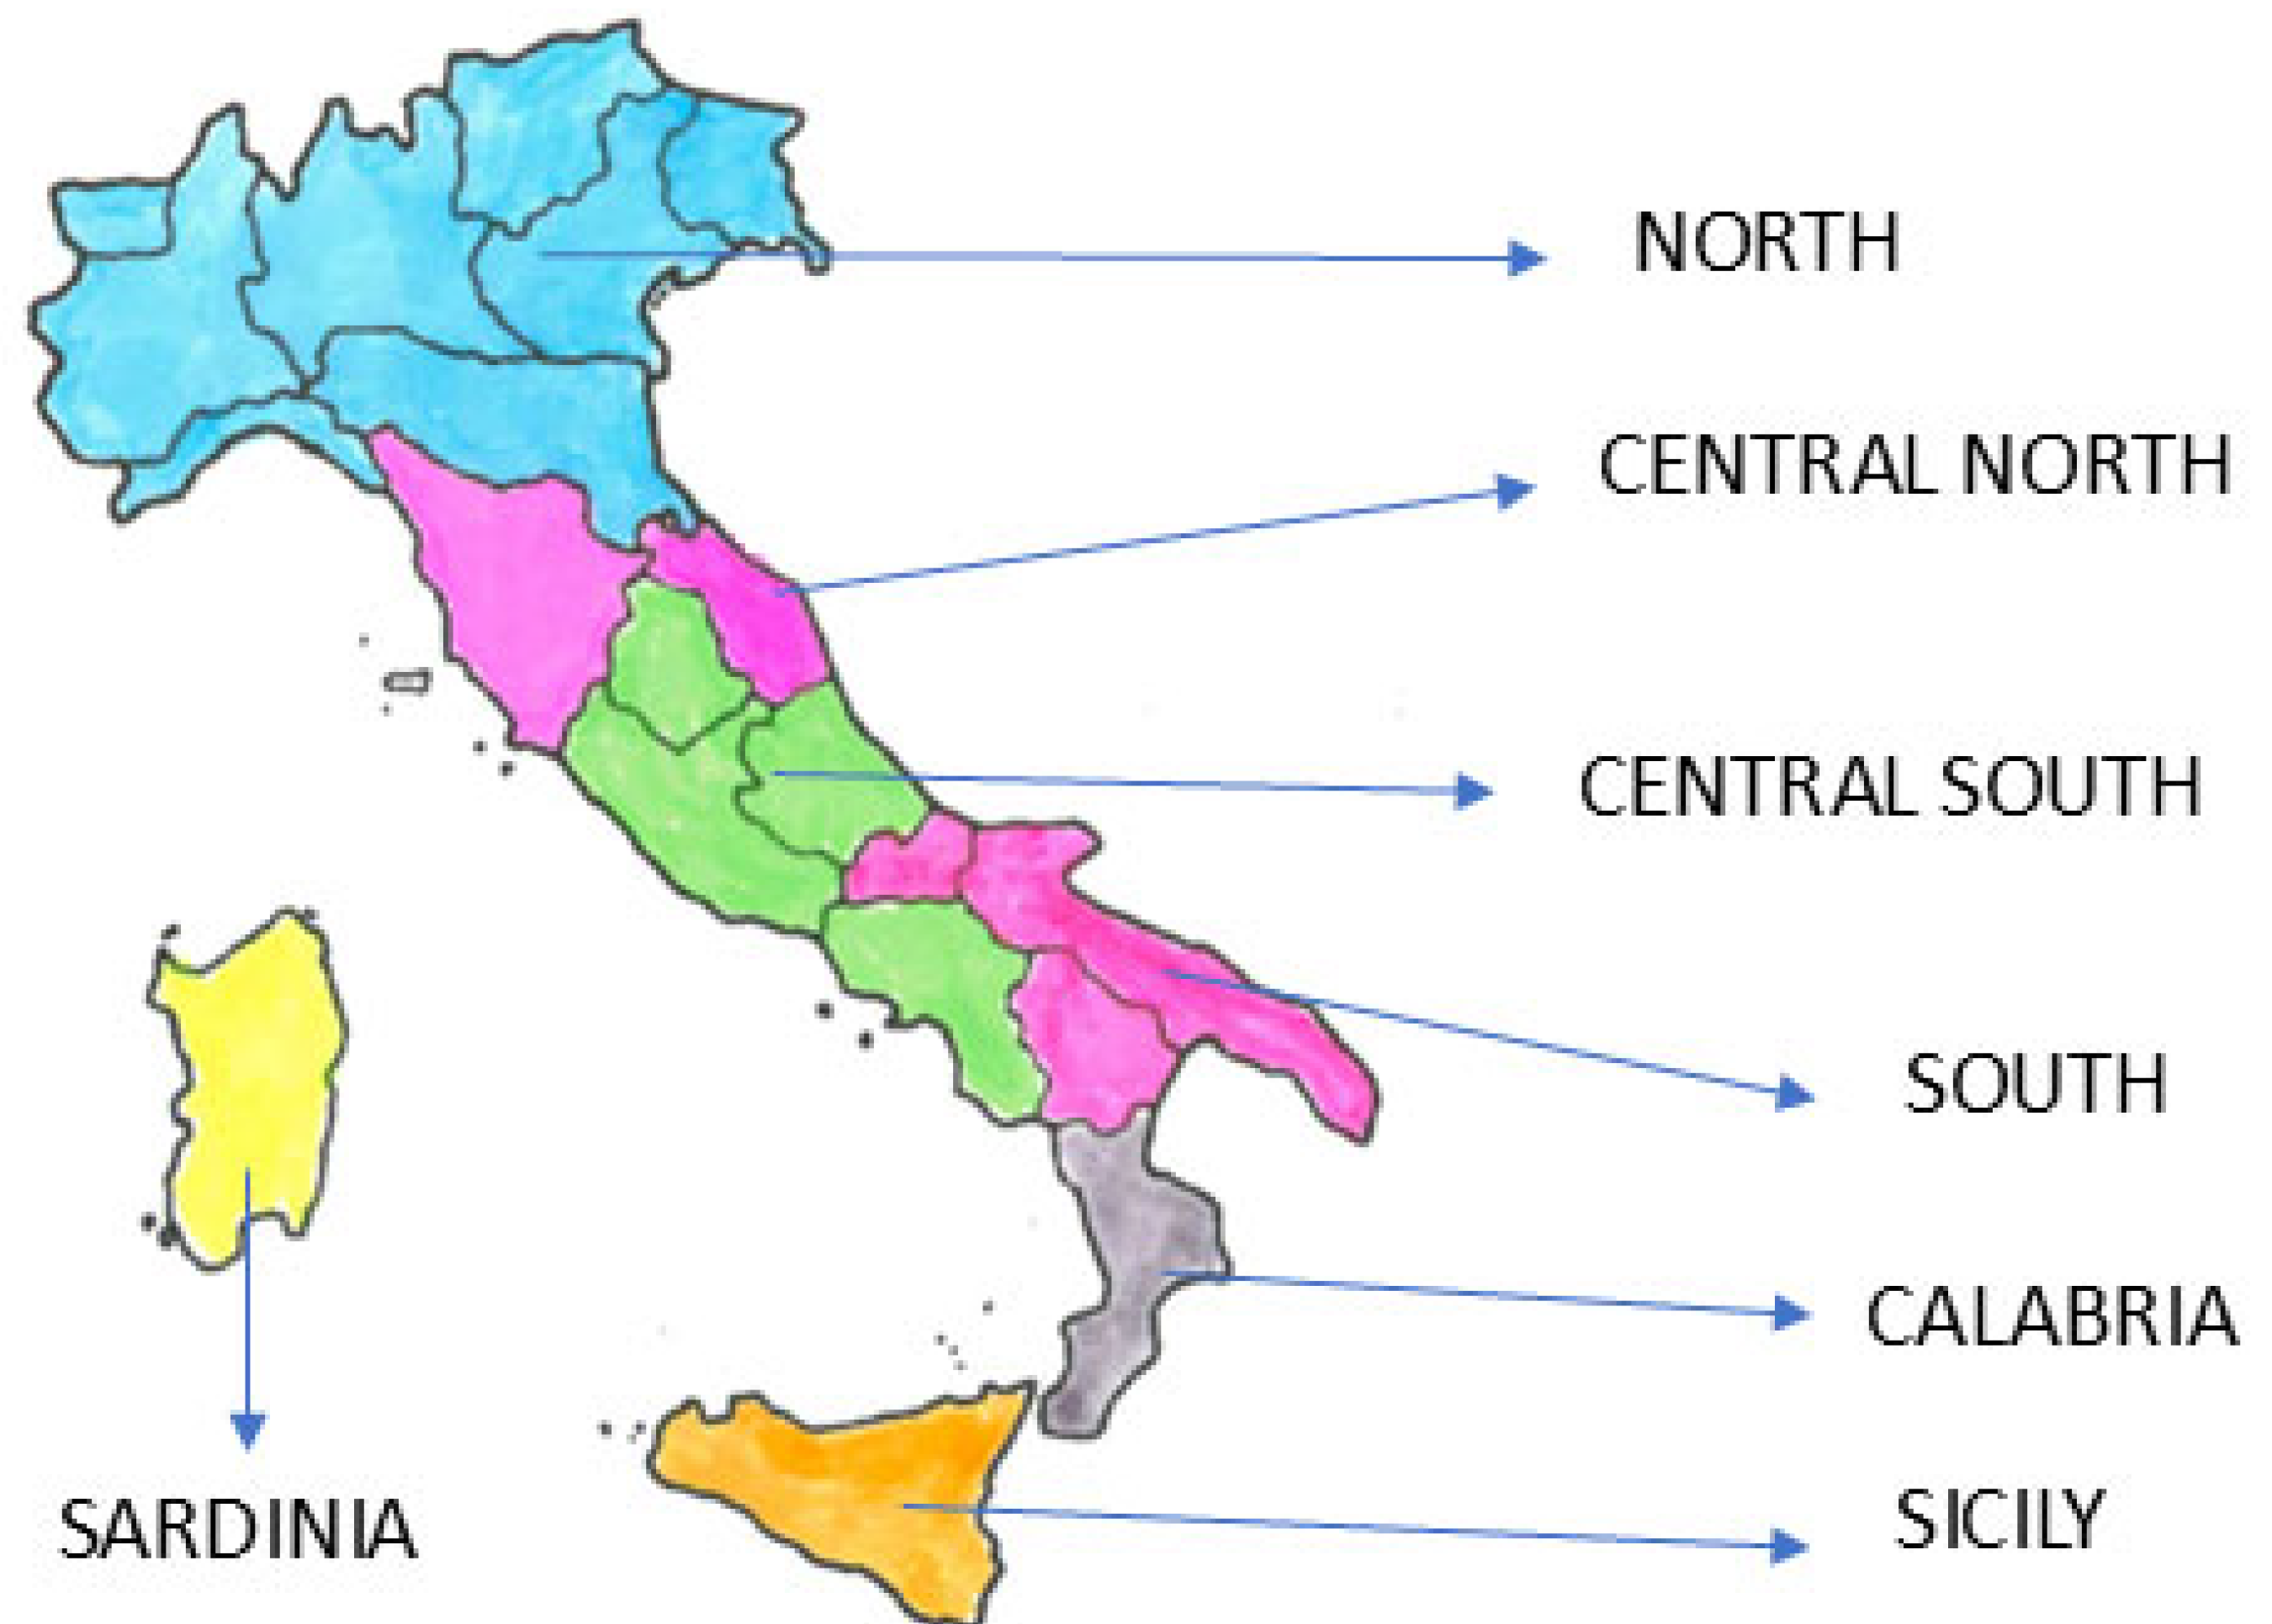
In the case of Italy, a valuable source is Terna, the national electricity transmission system operator, which provides extensive datasets through the “Transparency Report” section of its website [
33]. In compliance with EC Regulation no. 1228/2003, this platform offers detailed and regularly updated information on load, transmission, generation, and balancing. For this study, we focused on actual electricity load data, reported every 15 min or hourly for seven Italian regions—Northern, Central-Northern, Central-Southern, Southern Italy, Sardinia, Sicily—and for the country as a whole (
Figure 2).
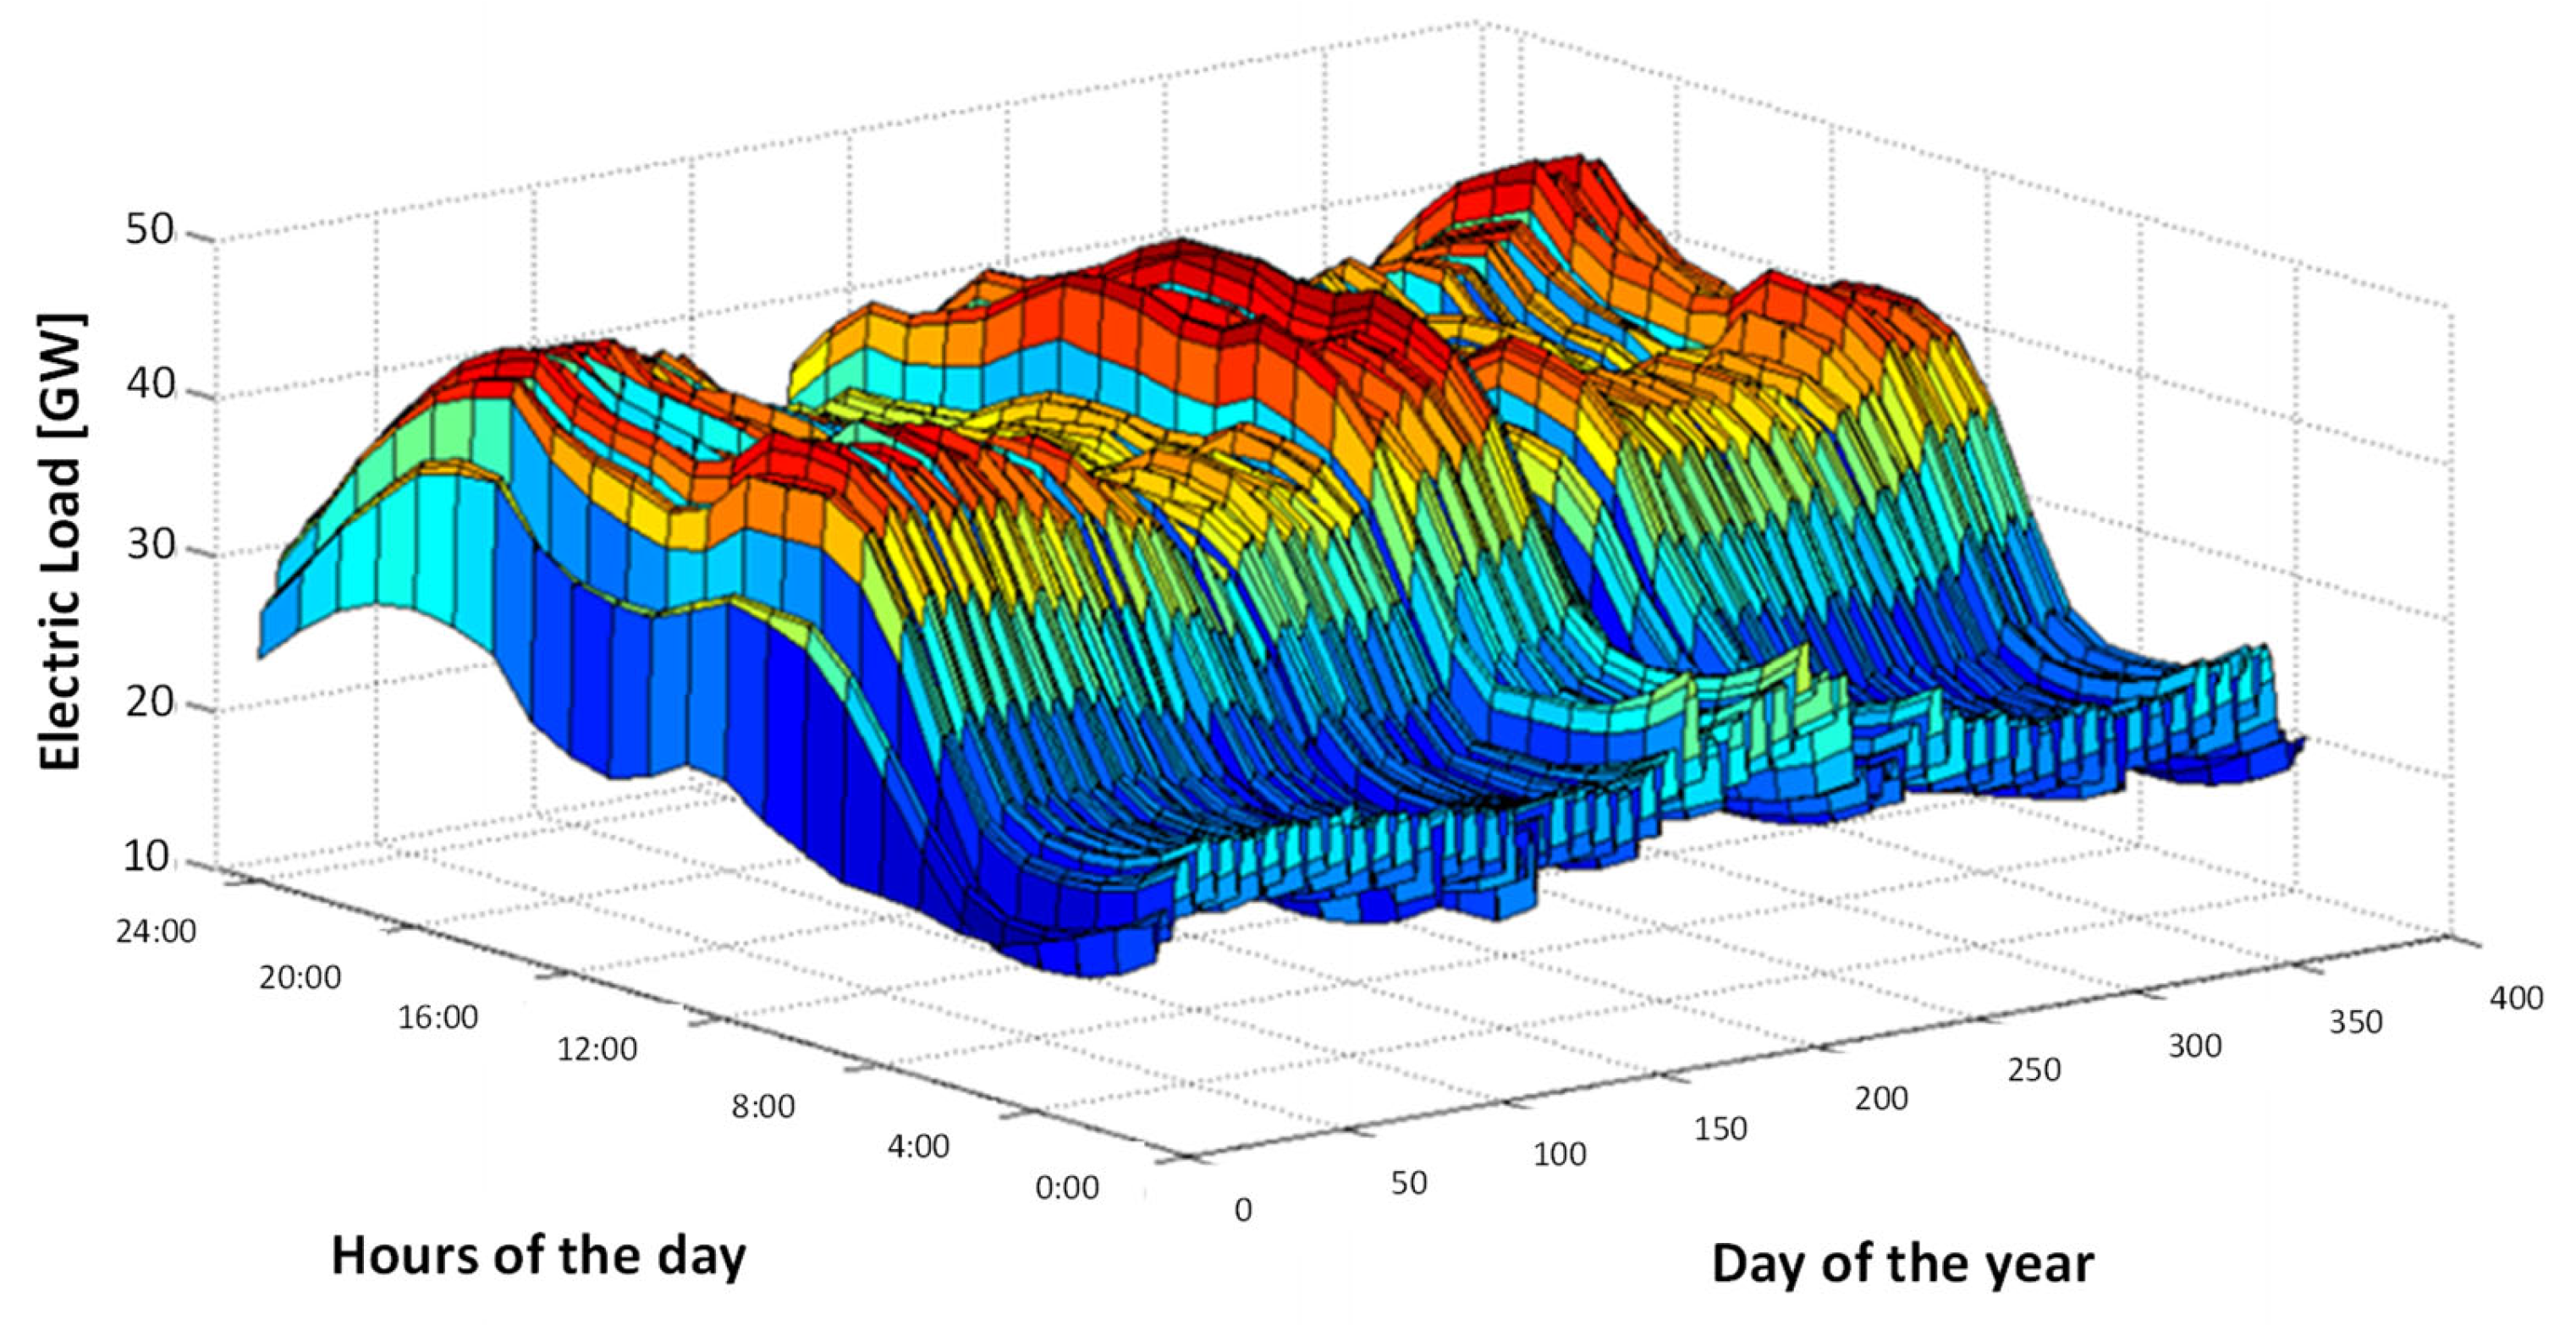
The analysis of electricity use data in Italy reveals a specific trend, characterized in recent years by peaks in energy demand during the summer season.
Figure 3 provides a three-dimensional view of the curves obtainable for a specific year, with the three axes representing the hours of the day (24), the days of the year (365), and the power demand on the grid along the z-axis.
To provide a clearer picture of these trends,
Appendix A includes key figures that illustrate electricity demand patterns across different timeframes obtained from [
35,
36,
37]. These visualizations capture the variability of energy consumption throughout the year, emphasizing how modern electricity systems no longer follow perfectly repetitive cycles. Additionally,
Appendix A presents the expansion of power plants in Italy, based on data from the Italian Energy Services Operator (GSE—Gestore dei Servizi Energetici) [
32,
35,
36,
37].
The integration of decentralized power generation, particularly from renewable sources, has significantly increased the complexity of modern energy systems. These developments have introduced bidirectional energy flows, heightened grid sensitivity, and a growing dependence on accurate forecasting to ensure system stability. Modern smart energy systems, powered by advanced Information and Communication Technologies (ICT), rely on real-time data exchange and precise predictions of both consumption and renewable generation to maintain grid balance, prevent congestion, and optimize operations. As shown in
Figure 1, managing such an interconnected and variable energy network requires forecasting models capable of adapting to increasing uncertainty. This is essential not only for efficient market functioning but also to reduce waste and ensure sustainable use of resources. Accurate knowledge of energy demand supports optimization of production and (re)distribution, reduction of inefficiencies, prevention of grid failures, and long-term infrastructure planning.
Electricity demand in Italy exhibits consistent daily and seasonal trends across the country. Although the qualitative shape of the load profile is moderately consistent across the seven geographical zones, significant quantitative differences among the seven zones described in
Figure 2 emerge, due to varying population densities and industrial activity levels, as evidenced in [
38]. Daily, load profiles are strongly influenced by the type of day. In many areas, three distinct clusters emerge, working days, Saturdays, and Sundays/holidays, with demand progressively decreasing from weekdays to weekends. However, in Southern Italy, Saturdays often resemble working days in terms of load, suggesting a simpler two-cluster classification between working days (including Saturdays) and holidays. Seasonal variations are also evident. Winter and summer show higher overall loads due to heating and air conditioning, respectively, while spring and autumn tend to have lower demand. The shape of the daily load curve changes with the seasons:
- −
In winter, peaks occur in the morning and evening (heating use);
- −
In mid-seasons, a third peak emerges in the afternoon, as heating decreases and midday activities grow;
- −
In summer, peaks shift to the morning and afternoon, reflecting air conditioning usage, especially in workplaces, with the evening peak diminishing;
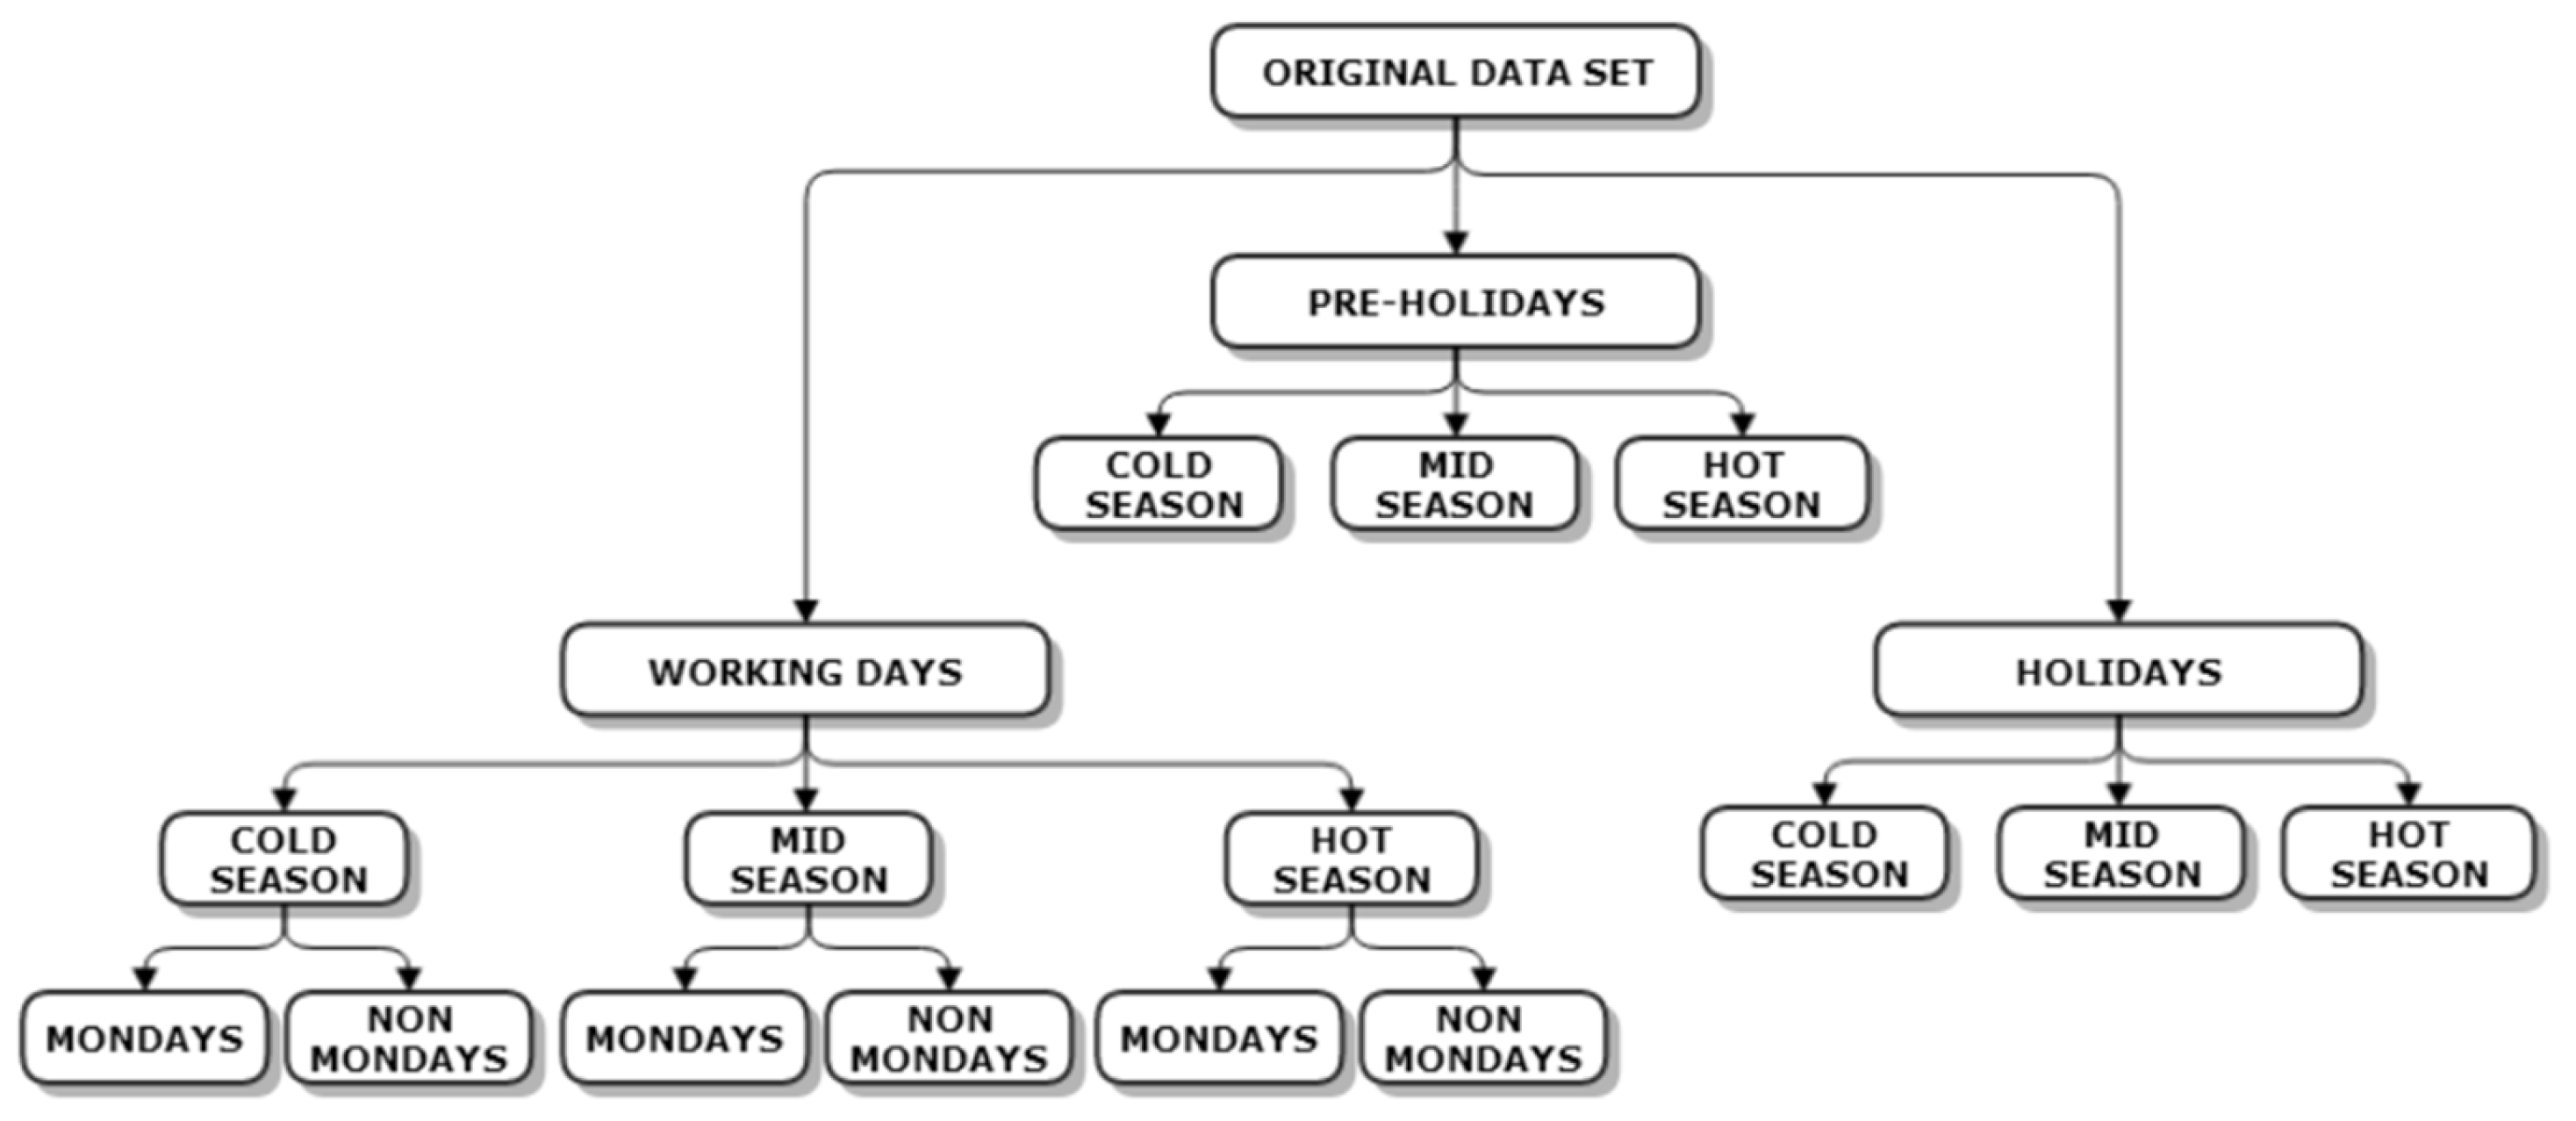
Figure 4 shows the main clusters emerging from the raw analysis of the data.
Three typical daily profiles are observed: working days, Saturdays or pre-holidays (with intermediate demand), and Sundays or holidays (with lower demand). Monday often shows a distinct profile in the Italian power system, with the largest gap between nighttime minimum and late-morning peak load, due to the sharp restart of activities after the weekend. This can be identified with the feature defined as “morning slope”, defining the difference between the load value at 10.00 a.m. and at 06.00 a.m., as discussed in [
38]. Seasonal effects are also evident, with varying peak times across winter, summer, and mid-season periods, while recurring patterns—such as daily, weekly, or seasonal cycles—and predictable factors, such as temperature or daylight hours can inform forecasts, energy demand remains highly irregular and sensitive to both local conditions and unforeseen events (e.g., heatwaves, behavioral shifts, such as the adoption of electric vehicles). These characteristics make it extremely difficult to derive effective physics-based models.
Over time, the field has increasingly shifted towards data-driven approaches. However, although such models achieve acceptable error margins, their reliability under extreme or rapidly changing conditions is still limited, highlighting the need for more robust and adaptable solutions.
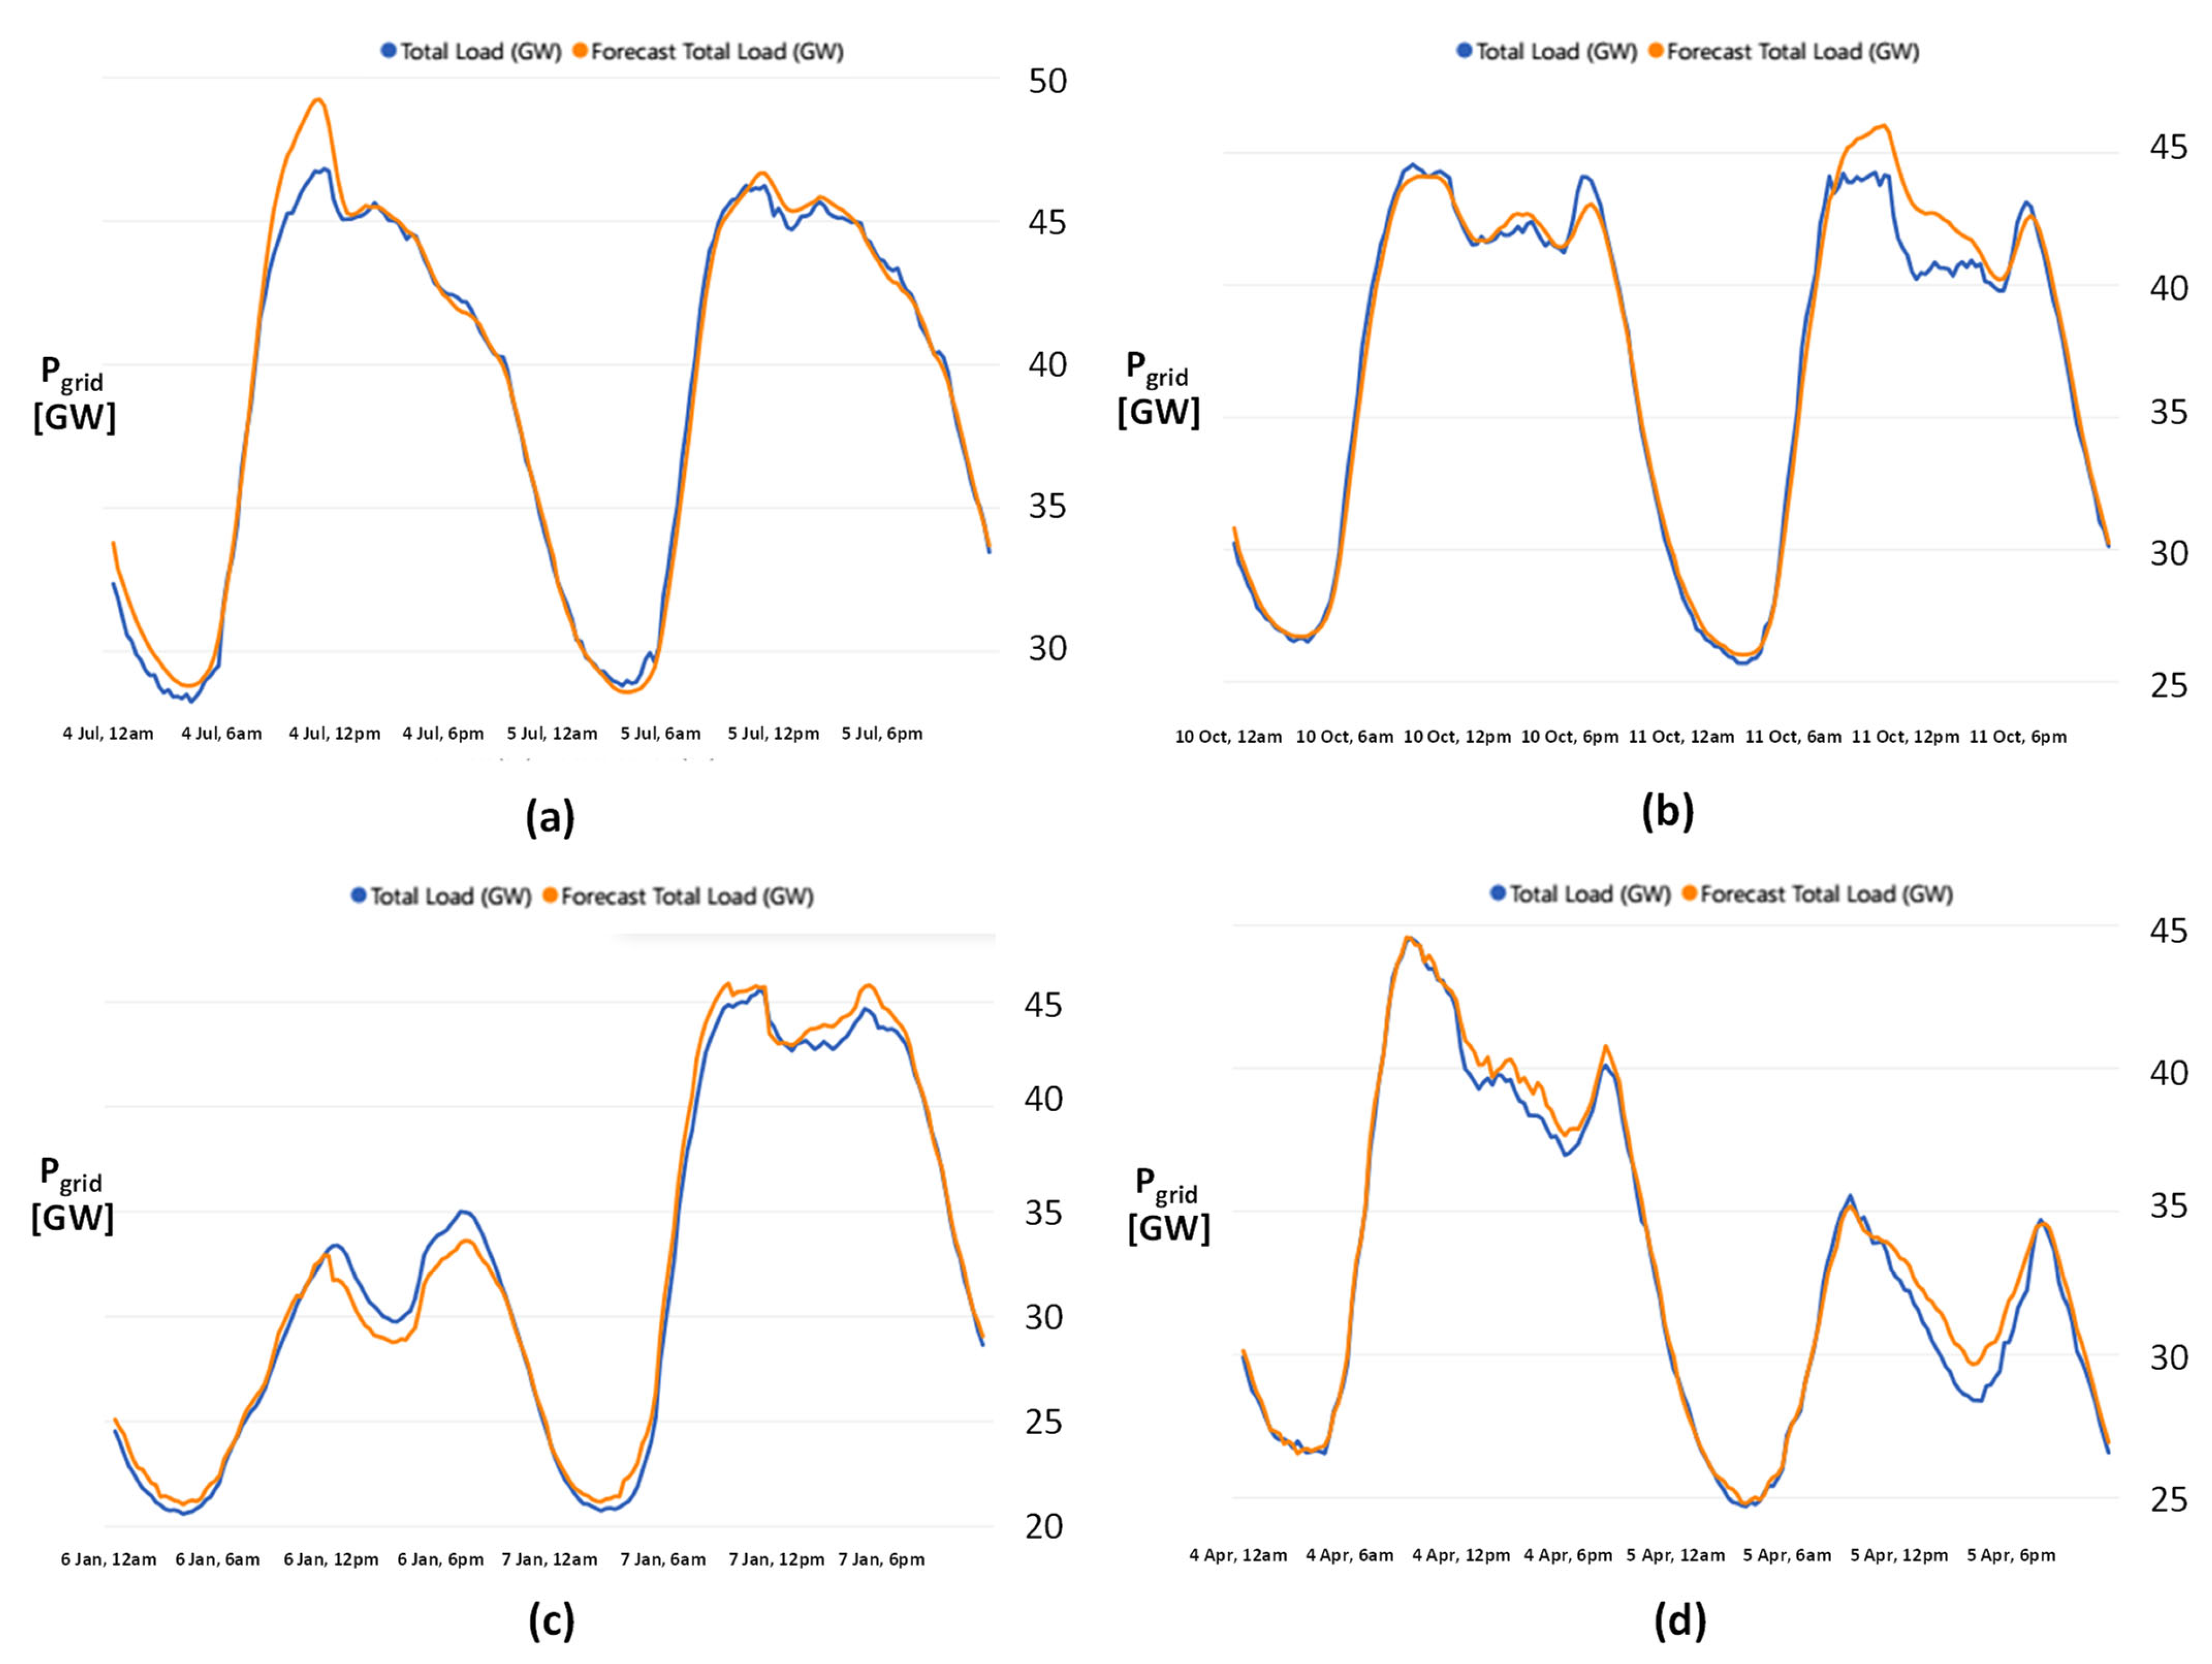
Figure 5 displays the forecasting curves (in red) alongside the actual measured loads (in blue) for the Italian electricity network, as provided by the national system operator. The four images represent two consecutive days under different seasonal conditions: summer (a), autumn (b), winter (c), and spring (d). As can be observed, although the general load trends are well captured, there are still significant discrepancies, especially when peak load conditions occur, highlighting the challenges in achieving high forecasting accuracy. Within this context, temporal forecasting plays a central role. It involves predicting future values of a time series.
3. Methodology Developed for Forecasting: Recurrent Neural Network (RNN) with Long Short-Term Memory (LSTM)
Forecasting methods can be applied to both electricity demand and energy production. As discussed in the previous sections, this topic has been widely studied and remains central to modern energy system management. Broadly speaking, forecasting techniques can be categorized into three main approaches:
- (1)
physics-based models, which rely on physical laws and system modeling;
- (2)
data-driven approaches, which use historical and real-time data to detect patterns and trends;
- (3)
hybrid models, which combine physical insights with data analytics.
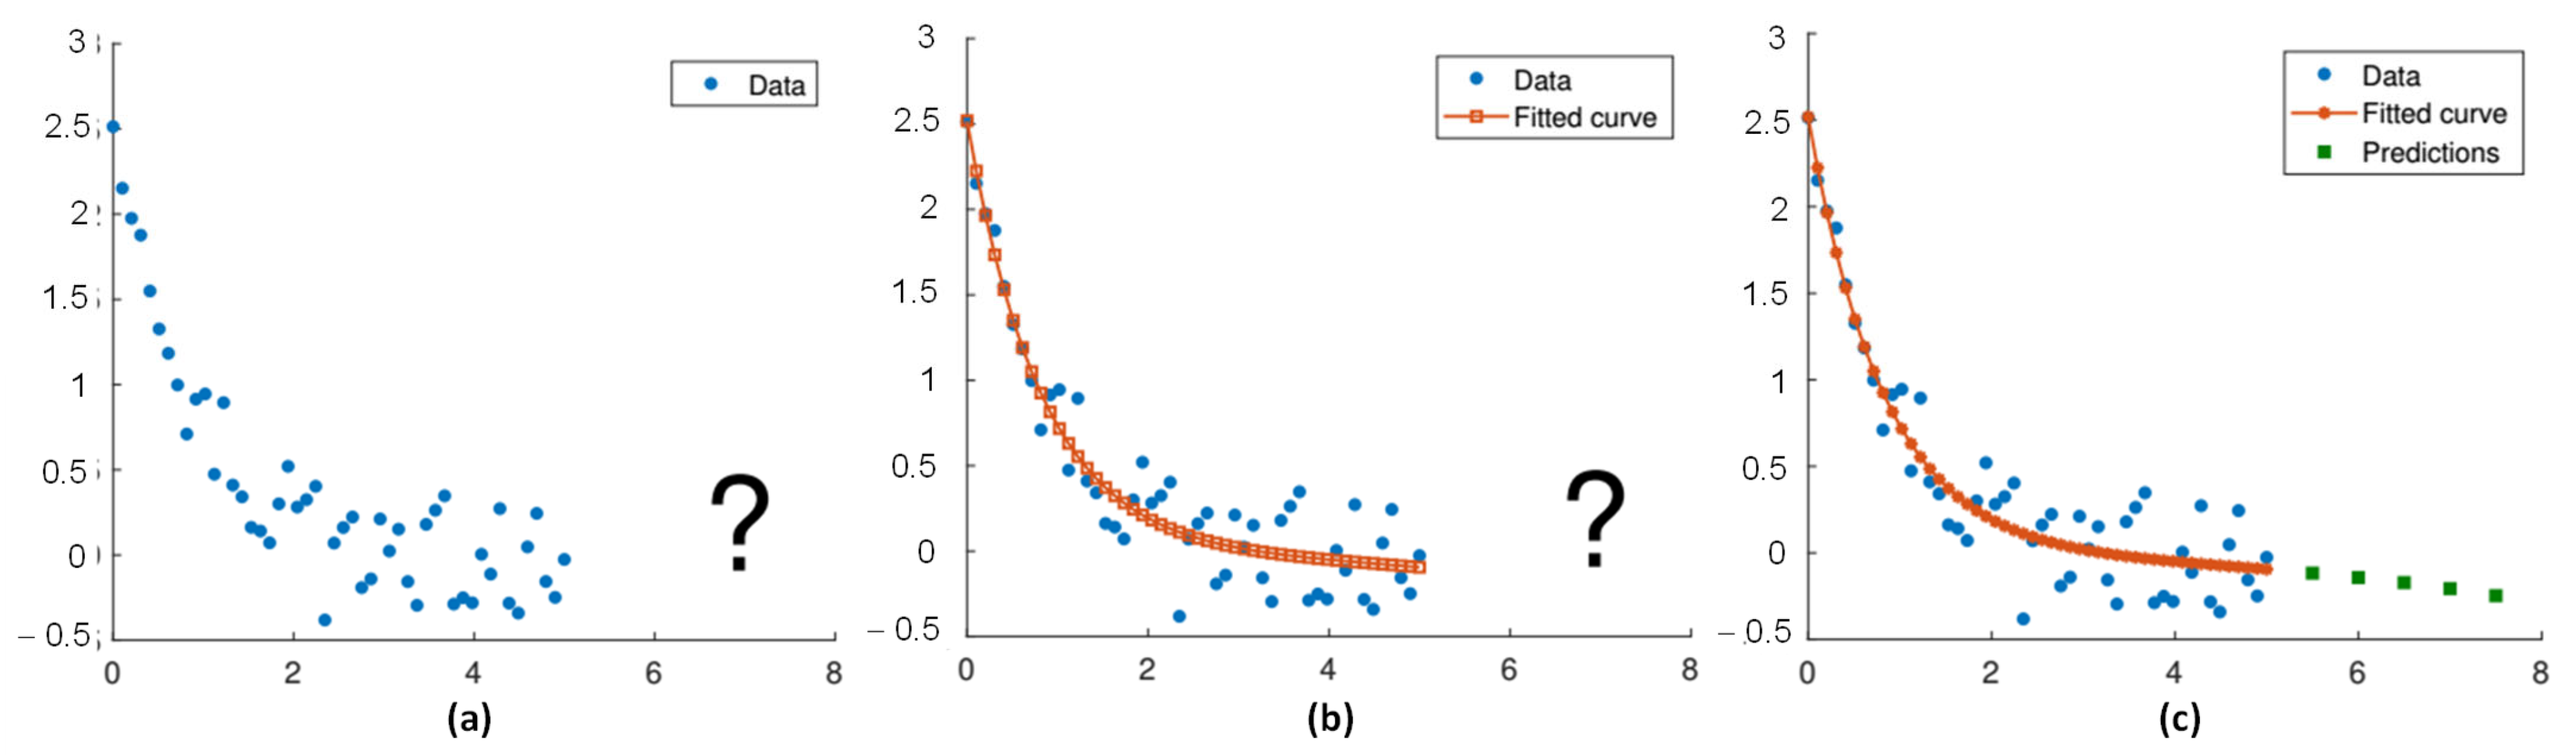
Mathematically, the forecasting problem can be stated, in a simplified form, as follows, given a set of historical observations:
The purpose is to find an approximation of a future value X by constructing a so-called forecasting model, which accurately describes the future behaviour of the time series. The forecasting model can be written as follows:
where nonlinear function
f generates the forecast and depends on the past data and on parameters β, which determine the response to the inputs. The parameters must be appropriately trained to produce an accurate forecast. The forecasting algorithm learns from past data to generate reliable predictions about future values.
Figure 6 provides a visual representation of this process.
The forecasting of electricity demand is becoming increasingly important, especially in the context of rising renewable energy integration. Accurate predictions of electricity demand are crucial for effective grid management, enabling the optimization of energy production and distribution. As variable renewable sources, such as wind and solar, increase, forecasting becomes essential to maintain grid stability and avoid imbalances. Accurate forecasting also helps prevent energy waste and supports efficient system operation.
Fortunately, large datasets from operators, such as Terna, are now available, offering valuable resources for forecasting studies. Forecasting is essential to modern electricity system management, spanning both demand and generation predictions across different time horizons to support decision making [
39].
- −
Very short and short-term forecasting, sometimes called nowcasting, supports real-time system operation and intraday electricity market management.
- −
Medium-term forecasting, typically up to 24 h ahead, enables day-ahead market scheduling and critical planning, such as resolving network congestion.
- −
Long-term forecasting focuses on strategic planning, including infrastructure development and investment decisions.
These forecasting objectives are summarized in
Table 1, highlighting varying timeframes crucial for ensuring grid efficiency. The classification of forecasting time horizons is freely adapted from [
40], providing a structured perspective on their role in energy management. Forecasting is challenging due to irregular fluctuations in demand, with peaks and valleys being particularly hard to predict. Defining a physical model is not feasible due to the large number of influencing factors and their unpredictability.
Given these challenges, accurate demand forecasting is more important than ever, requiring sophisticated data-driven approaches, such as machine learning, to handle the complexities and uncertainties in energy consumption. In developed countries, electricity demand follows recurring patterns, such as daily, weekly, and seasonal trends. However, there are also unpredictable factors, such as sudden heatwaves, unexpected events, or changes in consumption behavior, which can significantly impact demand.
In the field of energy systems, forecasting has become a crucial area of research and innovation. Recently, there has been a growing interest in machine learning techniques, which leverage large datasets and advanced algorithms to identify complex patterns and improve prediction accuracy, offering significant potential for modern energy systems.
Machine learning (ML) models offer significant potential for forecasting, particularly in predicting future electricity demand. ML, a branch of artificial intelligence, uses statistical methods to detect patterns in data, making it highly effective for modeling complex relationships that traditional analytical functions cannot capture. We are working with a time series, where each data point represents electricity demand at a specific time. This involves finding a function
f that maps past demand data to future values, using a set of parameters, as illustrated in Equation (2). The machine learning algorithm is trained from historical data by finding the parameters
β that minimize the misfit with the training data. Once trained, the model is capable of extrapolating and predicting future demand values, offering reliable forecasts even for time periods not directly observed. As the electricity grid becomes increasingly reliant on renewable energy sources, accurate forecasting of energy consumption is crucial for optimizing production and distribution. Electricity demand in a complex system, such as a national grid, is influenced by numerous factors, including weather conditions, economic activities, and social behaviors, which evolve over time [
38,
41].
In particular, we aim to explore the application of recurrent neural networks (RNNs) and long short-term memory (LSTM) networks to predict electricity demand [
42,
43]. The choice of LSTM as a forecasting model is motivated by previous work conducted by one of the authors, in which a comparative analysis of several ML algorithms showed no substantial differences in performance. Only ensemble approaches, combining multiple models, led to significantly improved results. In this context, selecting a single, well-understood architecture allows us to focus on model interpretability and integration, without compromising accuracy [
44].
Other types of neural networks could have been considered, such as artificial neural networks (ANNs), convolutional neural networks (CNNs), and deep neural networks (DNNs), which are all powerful architectures. ANNs and DNNs are general-purpose networks often used for static data, while CNNs are particularly effective for spatial or image-based inputs.
Traditional forecasting methods often struggle to account for the temporal dependencies and fluctuations inherent in energy demand.
The specific type of RNN, called long short-term memory (LSTM) networks, was introduced by Hochreiter and Schmidhuber in 1997 [
45,
46]. LSTM networks represent variations of RNNs, which are particularly well suited for handling time series data, as they process not only single data points but also entire sequences of data [
47,
48]. LSTM networks are explicitly designed to handle time-series data, thanks to their internal memory mechanisms that allow them to capture temporal dependencies and patterns over longer horizons. In the context of electricity load forecasting—where historical patterns and sequential correlations are fundamental—LSTMs offer a natural and efficient modeling choice.
The LSTM method has found extensive applications across a wide range of fields due to its ability to handle sequential data and capture long-term dependencies. Key areas of application include natural language processing (NLP), time-series analysis, healthcare and biomedical applications, audio and speech processing, video and image sequence analysis, control systems, robotics and autonomous vehicles. Some non-exhaustive examples of LSTM applications can be found in several studies across the literature [
49,
50,
51].
LSTM networks were chosen because they are particularly well suited for modeling temporal dependencies in time series data, often outperforming other architectures, such as standard feedforward or convolutional networks, in capturing sequential patterns. Although a detailed comparison is beyond the scope of this work and has already been tested in different papers, LSTM’s effectiveness in reconstructing time series dynamics made it a natural choice for this specific application.
The method’s versatility lies in its architectural enhancements that mitigate issues such as the vanishing gradient problem, allowing it to effectively process sequences over long horizons. For this reason, LSTM networks seem particularly well suited for predicting electricity demand in complex systems due to their inherent ability to model temporal dependencies and sequential data. This feature is crucial in energy demand forecasting, where patterns are often influenced by historical consumption trends, seasonal variations, and temporal correlations. For a more in-depth exploration of these concepts, reference texts, such as [
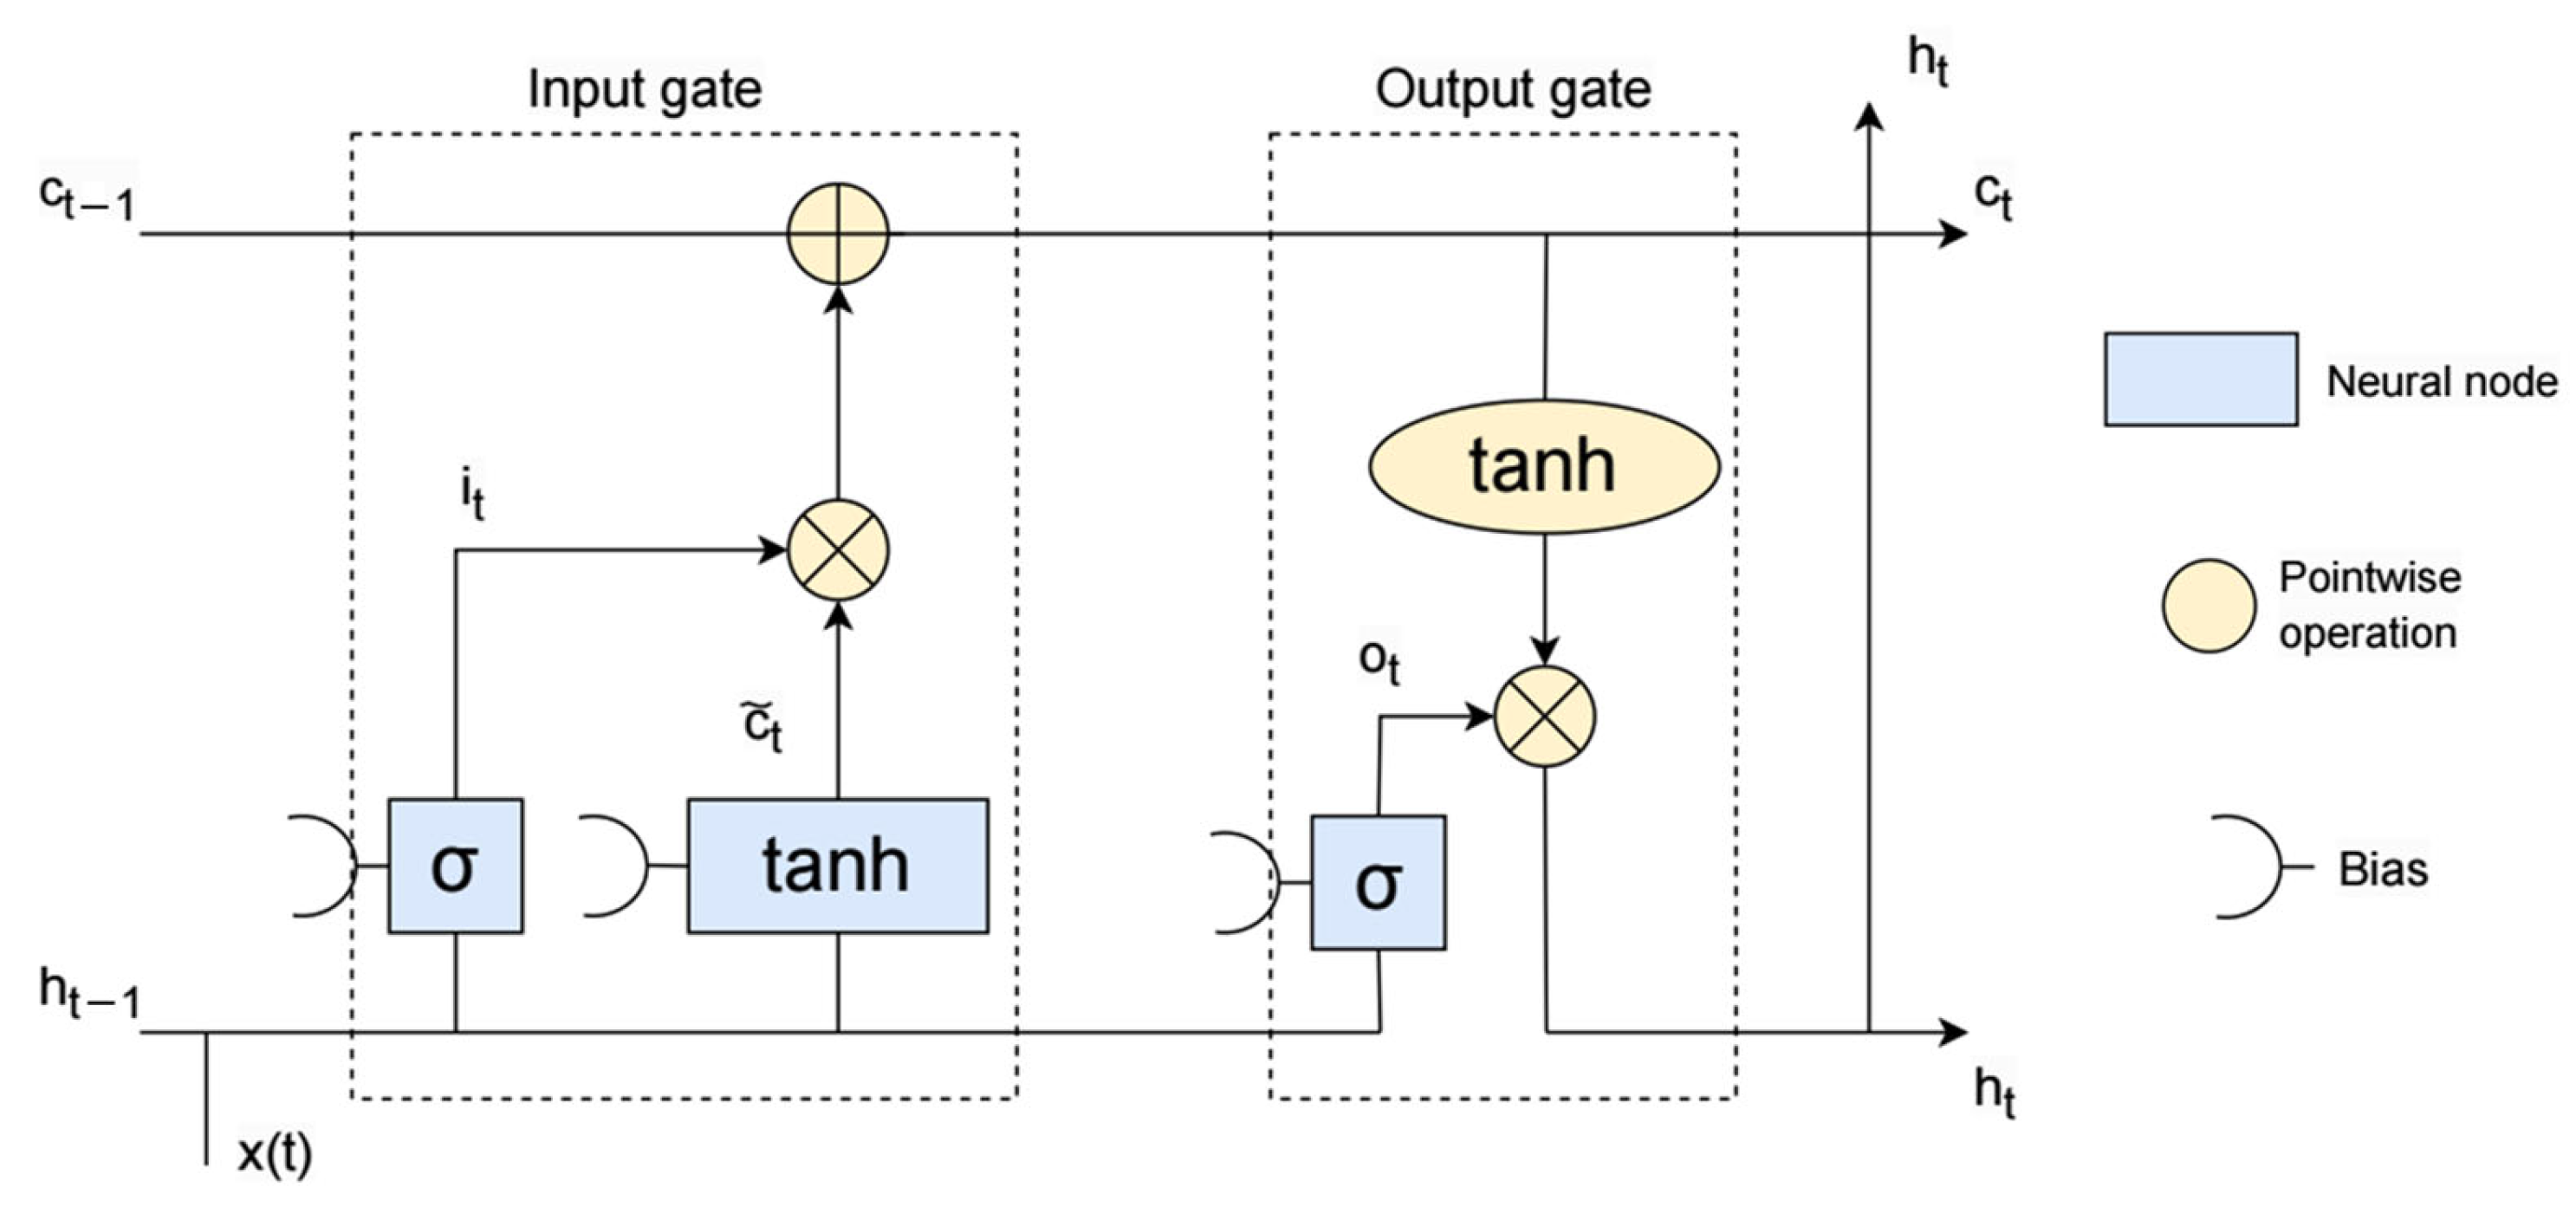
52], provide a comprehensive treatment of the subject. The building block of LSTM models is the recurrent unit. This is typically composed of a cell and three gates that regulate the flow of information into and out of the cell: the input gate, the output gate, and the forget gate. To update the cell state C
t, the unit maintains a so-called hidden state h
t, which plays the role of a memory, and is updated at each time step based on the previous hidden state and on the current input X
t. The LSTM could remove or add information to the cell state via the gates. This feedback loop allows the LSTM network to maintain useful, long-term dependencies to make predictions, both in current and future time-steps. In their formulation, the states of LSTM are defined by the following variables:
- −
Xt is the input state at time t;
- −
ht is the hidden state at time t;
- −
ct is the cell state at time t.
The gates are neural network layers whose architecture is of the following form:
where σ is the sigmoid activation function, and, for any z = {F, I, O}, W
z are the weights and b
z are the biases. The weights and the biases of all layers form the set of parameters β introduced in the general forecasting model previously defined by Equation (2). The LSTM network processes electricity load data, available every 15 min (4 times per hour), by using gates to control the flow of information. The forget gate decides which past data to discard by evaluating which information is no longer relevant. For example, if a sudden spike in electricity demand occurs due to a temporary event (such as a short-term weather change), the forget gate may decide to ignore that spike in future predictions. The input gate determines which new information to add to the memory, focusing on patterns that are consistent and relevant, such as recurring load patterns during peak hours. Finally, the output gate controls what information is used to make predictions. This flow of information allows the network to remember important trends (like daily peaks) while forgetting irrelevant noise, ensuring accurate predictions based on historical load trends. The fundamental steps and equations for an LSTM can be summarized as follows:
Forget gate layer. In the first step, a neural network (NN) layer is used to decide what information to discard from the cell state based on the current input state Xt and on the hidden state computed in the previous unit:
Input gate layer. This is a neural network layer aimed at deciding what new information to retain in the cell state:
Next, a tanh (hyperbolic tangent) NN layer creates a vector of new candidate values of the cell state:
- 4.
Update the cell state ct:
where the operator ⊙ denotes the element-wise product of vectors (Hadamard product) and
Is the candidate cell state.
- 5.
Update the hidden state ht:
by means of the output gate:
These operations enable LSTMs to learn long-term dependencies by selectively keeping relevant information and discarding irrelevant data over time. Despite recent variations, most LSTM methods share the same basic architecture, including the main operators, shown in
Figure 7, with input and output gates only. By leveraging the LSTM model, we aimed to improve the accuracy of electricity demand predictions, which is crucial for better energy management and grid optimization in Italy.
3.1. Data Description
We focused on the electricity demand in Italy, utilizing datasets provided by Terna S.p.A., the operator responsible for the national electricity grid. The data include electricity consumption (actual load) expressed in gigawatts (GW) measured every 15 min for the years 2022 and 2023, available at [
35,
36,
37]. Although our analysis considers the entire national grid, it is worth noting that the system is divided into 7 commercial zones, allowing for a more granular analysis at the zonal level. In a previous work [
38], one of the authors has already explored regional-level analysis, observing the benefits and challenges but also the inherent limitations of higher spatial granularity. However, for the purposes of this work, we opted to use aggregated national-level data to ensure consistency in model comparison, robustness of the results, and relevance for system-wide decision making.
Similar datasets are available for different states on the ENTSO-E Transparency Platform [
53], which provides comprehensive electricity market and grid data for various European countries, enabling cross-country comparisons and broader analyses. We considered two different types of datasets: the actual load dataset, containing the load consumption, and the day-ahead load forecast data, containing the load forecast provided by Terna. The first dataset is used to test the neural network, while the second is used for comparison. To ensure the datasets were suitable for analysis, some preprocessing steps were applied. First, the data were cleaned to address missing or inconsistent values. Next, to predict hourly consumption, data were downsampled using the resample function from a 15 min to an hourly frequency. Moreover, since ML algorithms are sensitive to the scale of the input data, the dataset was normalized; that is, they were rescaled to the range [0, 1]. Finally, the dataset was split into training, validation, and testing sets to facilitate model development and evaluation.
3.2. Model Architecture and Test Methodology
We developed an LSTM model using Python (version 3), a versatile and widely used programming language [
54], and the Keras library with a specific architecture. Keras is an open-source library specifically designed for deep learning tasks. Integrated within TensorFlow, Keras provides a high-level application programming interface (API) that simplifies the creation and training of neural network models. Keras was chosen because of its ability to handle sequential data efficiently through recurrent neural networks and, more specifically, LSTM models [
55]. The code was implemented by the authors, leveraging standard routines (e.g., sequential model, layers, dropout) available in Keras libraries.
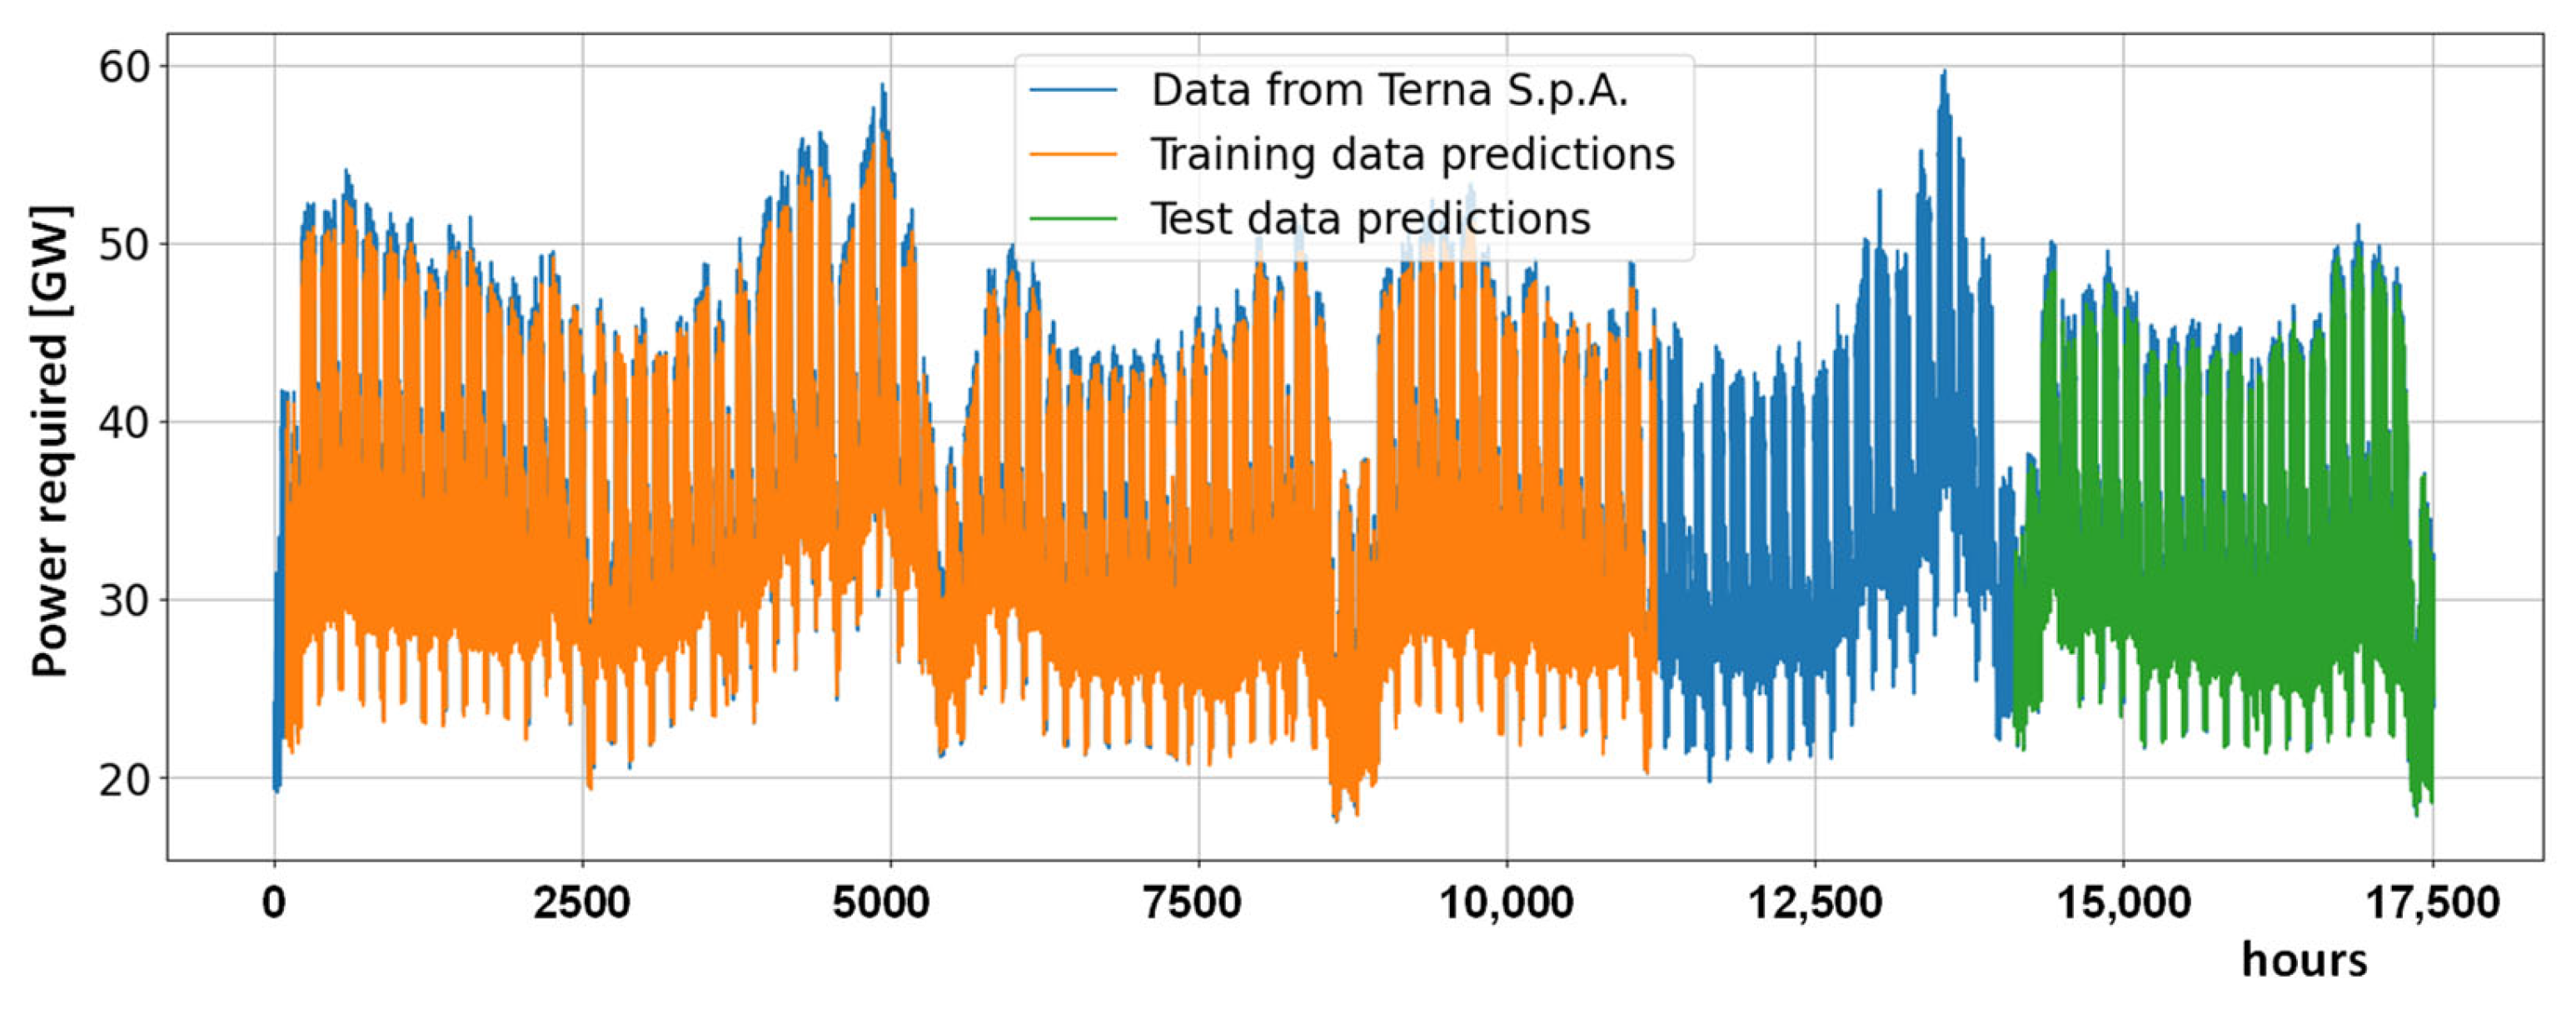
To better understand the structure of the proposed model, we provide the following description of its architecture and training process. The model is based on a recurrent neural network with LSTM layers. Specifically, it consists of four LSTM layers, each containing 50 hidden units. To prevent overfitting, a dropout layer with a rate of 0.2 is applied. The final output is produced by a single output layer. The input to the model is a sequence of “length” 100, and the total number of trainable parameters amounts to 71,051. The training process spans 50 epochs with a batch size of 20. The model is optimized using the Adam algorithm, and the mean squared error (MSE) loss function is employed to measure prediction accuracy. The dataset consists of hourly electricity demand data in the Italian system from January 2022 to December 2023 (a range of 17,520 h). The data were normalized in the [0, 1] interval and divided as follows:
- −
Training set: Data from 1 January 2022 to 12 April 2023 (a period of around fifteen months) were used for model training.
- −
Validation set: This was used to fine-tune the network architecture during training and collected data from 13 April 2023 to 7 August 2023 (a period of around four months has been considered).
- −
Test set: Data from 8 August 2023 to 31 December 2023 (a period of around five months) were employed to evaluate the model’s performance.
The training and validation sets correspond to 80% of the total available data, while the test set collects the remaining 20% of the data. The validation period (13 April 2023–7 August 2023) and testing period (8 August 2023–31 December 2023) were selected to cover a wide range of seasonal and operational variations in electricity demand.
Figure 8 provides all the data, evidence of the dataset used (in blue), the result of the forecasting on the training data (in orange), and on the test data (in green). The selected data range (January 2022–December 2023) were chosen to ensure the availability of data representative of a system configuration closely aligned with the current context. While similar results were observed when using different or longer training periods, this specific range offers a good compromise between recent data and length of the training period. The results are therefore representative and only minor adjustments (e.g., batch size) may be required when applying the method to different datasets.
3.3. Validation and Metrics
The key aspect of ML algorithm is the training phase, where the goal is to derive the function parameters β such that the model performs well on new, previously unseen inputs. At this stage, the number of parameters plays a crucial role. Indeed, a model with very few parameters will not be able to capture some of the core features of the time series and underfit the data. In contrast, the more parameters, the more likely the model is to fit to the spurious noise in the time series signal and hence cannot be extrapolated very well to new data, the so-called
overfitting. A powerful feature of ML algorithm is the possibility to minimize, during the training phase, the generalization error, namely the expected value of the error on new data, ideally from the set of data that we expect the algorithm to encounter in practice. To simulate this, the generalization error is estimated by assessing its performance on a test set of examples that were collected separately from the training set, the so-called validation set. In the numerical tests of this work, the model was validated using the root mean squared error (RMSE) as the evaluation metric.
where
and
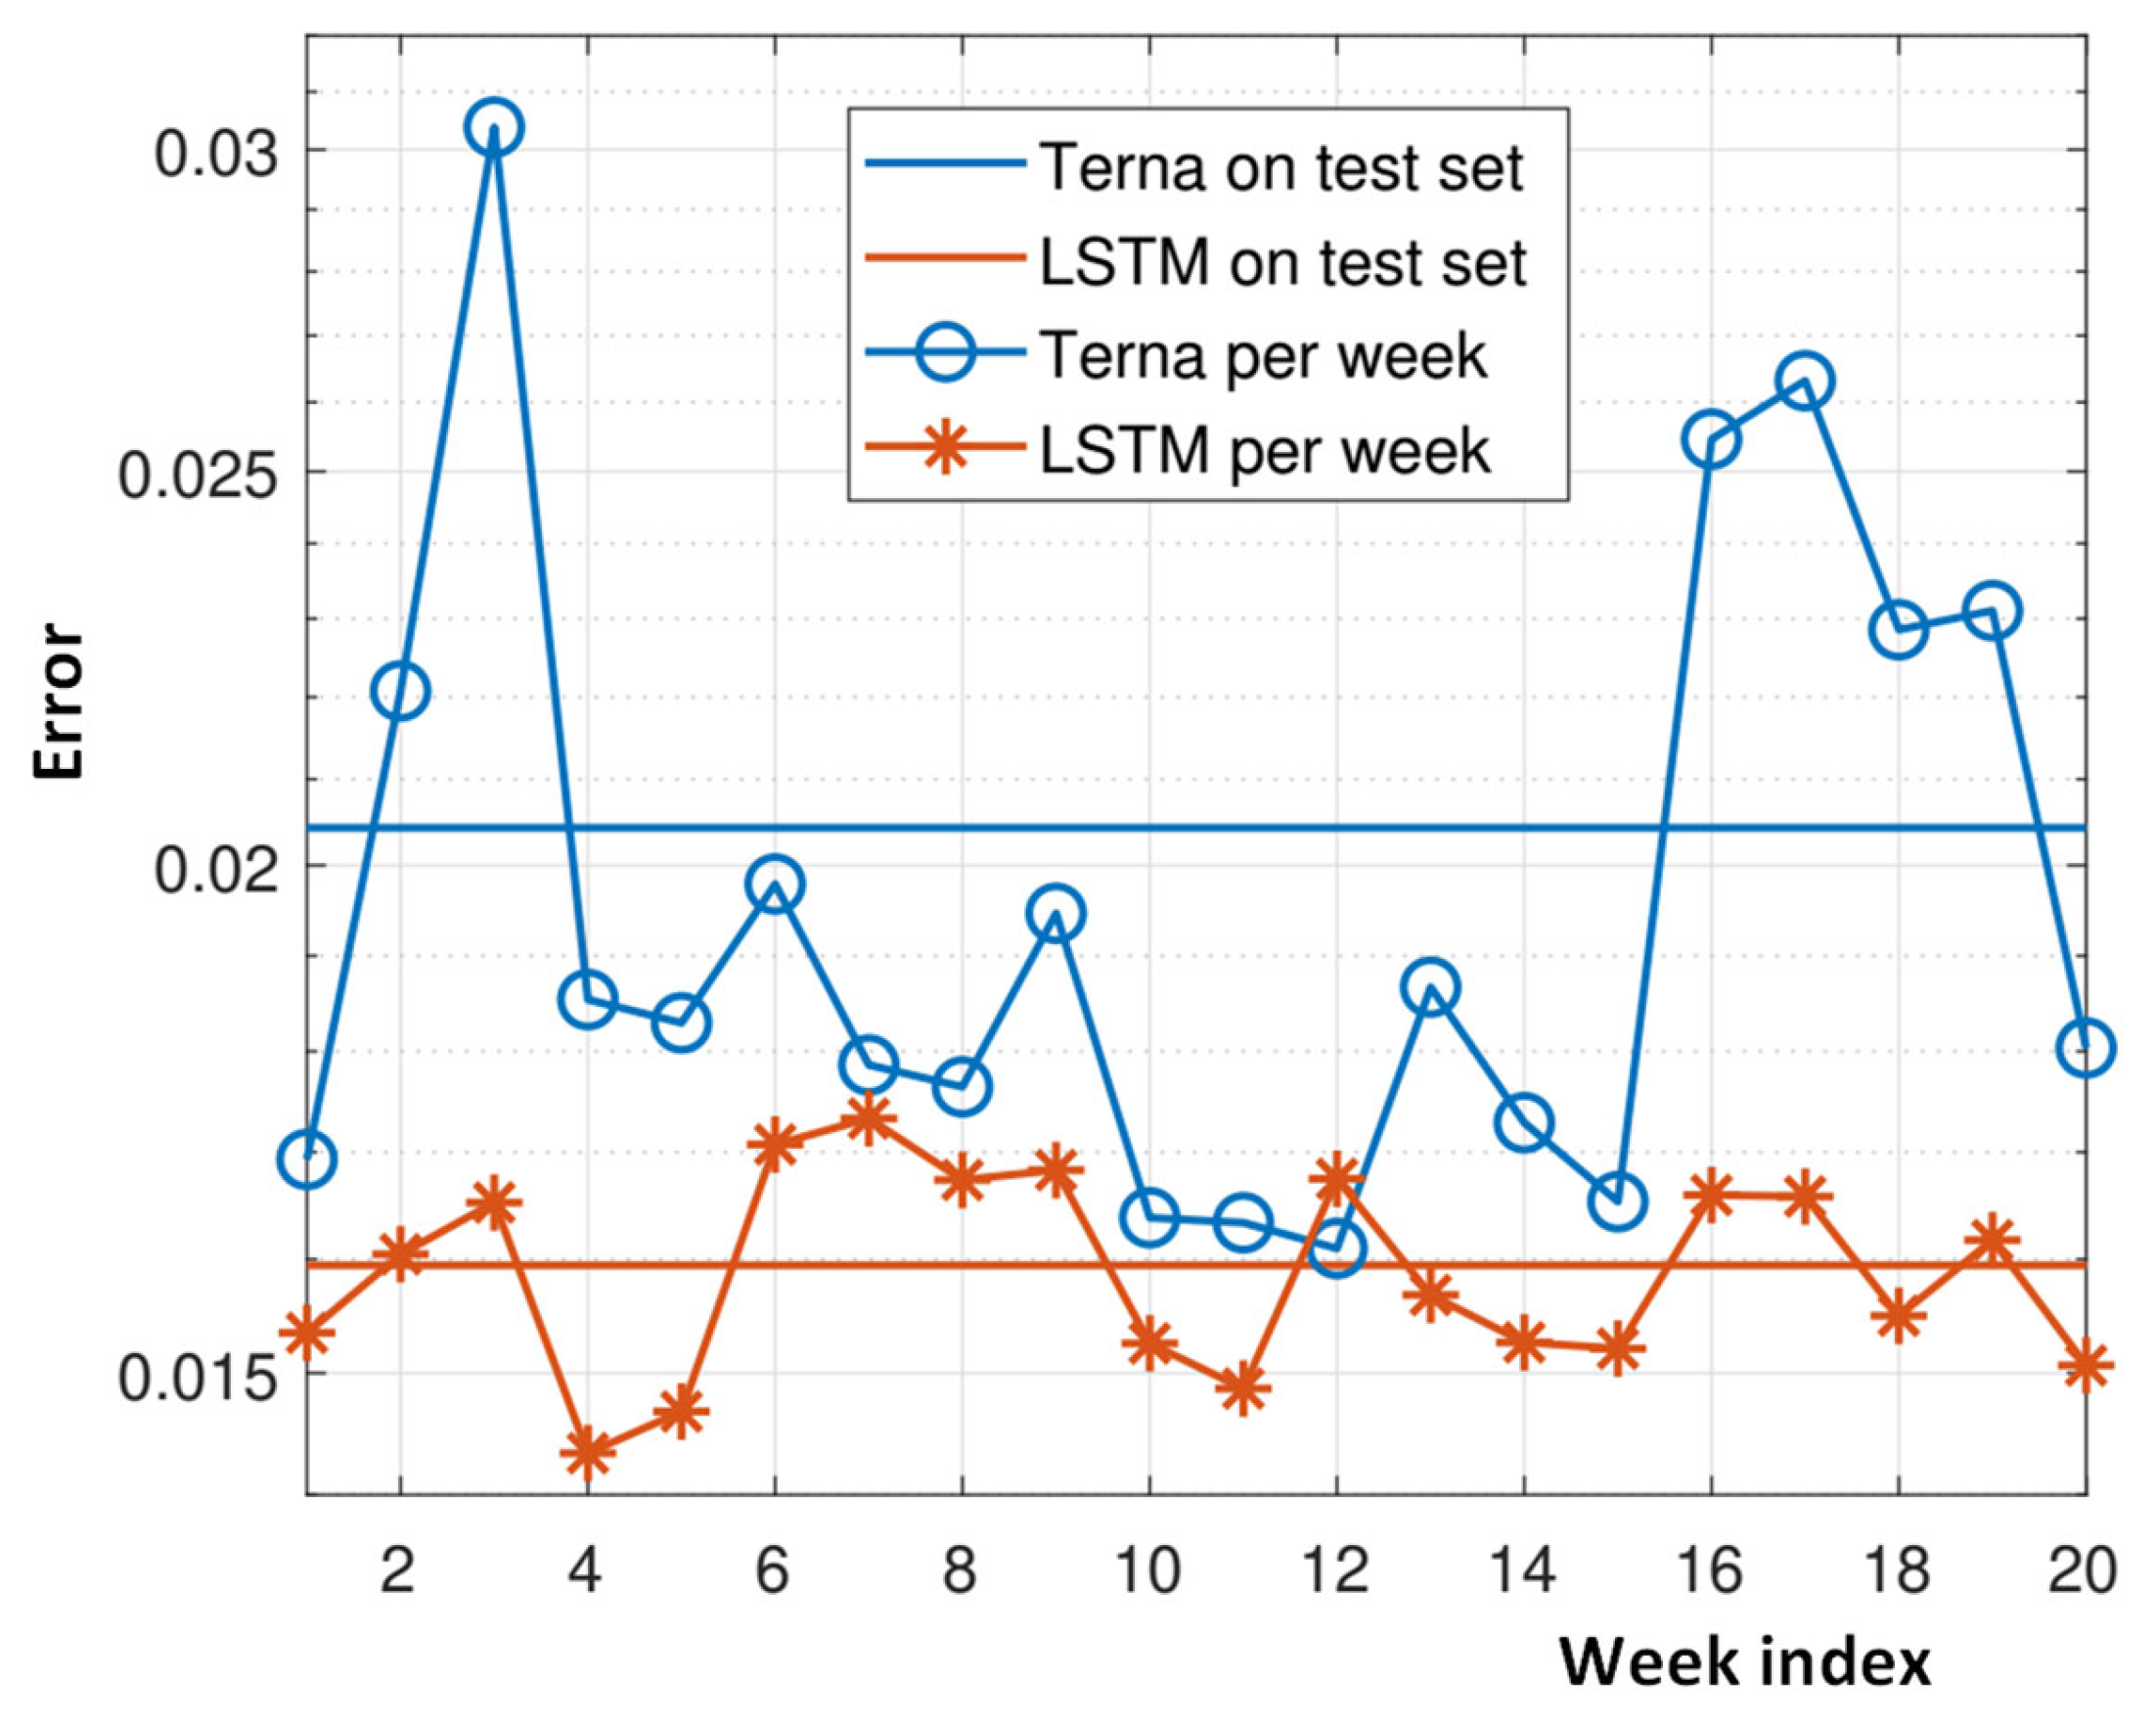
correspond to the measured and predicted values at each sample instant i (i.e., every hour), respectively. RMSE measures the average squared difference between predicted and actual values, providing a robust indicator of the model’s performance. The same metric was used to assess the quality of the model predictions on the test set collecting data that were not seen by the ML model. A lower RMSE value indicates higher accuracy and better predictive capability. The results are similar to Terna’s in terms of the error computed over the test set—0.0161 compared to Terna’s 0.0204. When looking at the RMSE over the test data corresponding to each single week, we observe, in
Figure 8, that our model presents less oscillations of the error compared to Terna’s result, showing a good predictive capability both a couple of weeks ahead and more than 15 weeks ahead. Qualitatively, the algorithm seems slightly better at capturing the function’s behavior during peak periods, at least for these data sets. As shown in
Figure 9, the developed method demonstrated an excellent fit to the data, outperforming the official model developed and used for predictions by Terna. This highlights the effectiveness of the proposed approach in accurately capturing the dynamics of electricity demand.
4. Results and Discussion
The forecasting model we developed has yielded highly satisfactory results. As demonstrated in
Figure 8 and
Figure 9 by the analysis of the predictions for a week in September 2023 (covering a total of 168 h), the model’s performance aligns closely with that of Terna’s official model and even surpasses it in accurately predicting energy demand peaks, at least for the tested problem. While the figure presented refers specifically to this selected week, the analysis was conducted over the entire period, confirming the model’s consistency and reliability.
Figure 10 compares the normalized power data obtained experimentally with the data predicted by the two forecasting models. This figure highlights the differences between the actual and predicted values, allowing an assessment of the accuracy and reliability of the models in predicting the power grid. While the figure presented refers specifically to this selected week, the analysis was conducted over the entire period (see
Figure 8), confirming the model’s consistency and reliability.
As shown by the error analysis in
Figure 9 and by the comparison between the two forecasting techniques exposed in
Figure 10, the results are very promising and demonstrate the potential of the model. The numerical experiments confirm the following:
- −
The forecasting accuracy of the developed model is comparable to that of Terna’s model.
- −
The model effectively predicts hourly energy demand for both short-term and medium-term horizons, according to the definitions analyzed in
Table 1, with notable reliability.
- −
The model delivers qualitatively robust results, successfully reproducing energy demand peaks, with a quantitative error that is below 2%.
These findings highlight the robustness and adaptability of the proposed forecasting approach.
The promising results obtained from the forecasting model suggest several notable advantages. First, the model’s ability to consistently predict energy demand peaks, even under the complex conditions of Italy’s decentralized and highly variable energy landscape, highlights its robustness. Moreover, the simplicity of implementing LSTM models in comparison to other machine learning techniques is a significant advantage. After being trained, LSTM networks can efficiently handle real-time data streams, making them particularly suitable for operational use in systems such as Italy’s energy grid. This feature is especially beneficial when considering the growing number of small-scale renewable energy installations, which require continuous adjustment in forecasting methods.
Another key strength of the proposed approach lies in its scalability. The model can easily be extended to account for longer forecasting horizons or more granular time intervals, which is crucial as energy management systems evolve to incorporate more distributed generation units and more complex demand-response mechanisms.
An additional advantage of the proposed LSTM-based forecasting model is its ease of implementation, which is facilitated by the widespread availability of well-established algorithms and libraries. Tools such as Keras, but also TensorFlow and PyTorch, offer open-access and user-friendly interfaces and pre-built functions that significantly reduce the complexity of building and training deep learning models. These libraries, coupled with extensive community support, allow for faster model development and deployment, even for teams with limited deep learning expertise.
As a result, integrating this model into operational systems becomes a feasible task for energy providers without requiring significant resources or time investments.
While the model’s implementation is straightforward, its value lies in offering a practical and adaptable framework for electricity demand forecasting using recurrent neural networks, specifically LSTM architectures. Our approach, tested on real-world data from the Italian electricity grid, produced results that are comparable to those of the official forecasting model used by Terna. The forecasting model and algorithm used by Terna are not publicly disclosed. While the performance of their approach is adequate, our method, despite being very simple, runnable on a laptop, and not relying on any physical information, such as weather data, achieves results that are comparable to those of Terna.
Beyond the accuracy of the predictions, we believe this study contributes to the analysis of a highly relevant and timely topic. It demonstrates how data-driven models can be effectively applied in operational contexts. However, the performance plateau observed suggests that future improvements may require integrating domain-specific knowledge and physical constraints into the learning process. A purely data-driven approach may struggle to significantly exceed current levels of performance without accounting for the underlying structure and dynamics of the energy system.
To improve forecasting accuracy, especially at finer temporal scales, the model can be enriched with handcrafted features that describe key aspects of the load profile, such as daily variability, peak structure, and intra-day fluctuations. These features help the model better interpret not only the quantity of energy consumed but also its distribution throughout the day.
Table 2 summarizes, according to our vision, a selection of such features, including statistical measures (e.g., mean, variance), temporal indicators (e.g., peak hour, morning slope), and frequency components (e.g., Fast Fourier Transform peaks), describing their relevance and contribution to capture different dimensions of the daily load behavior. Adding descriptive features to LSTM models moderately increases input complexity but does not significantly burden the model structure. If well selected and properly preprocessed, these features enhance learning by providing structured context, improving performance, especially during atypical days or in the presence of less predictable temporal patterns.
5. Conclusions
The increasing use of renewable energy sources and the optimization of energy systems require continuous balancing between energy supply and demand. Accurate forecasting of energy needs plays a crucial role in this process. In recent years, despite the proliferation of advanced forecasting algorithms, no substantial improvements have been observed in terms of accuracy. While the overall forecast error may appear acceptable, significant discrepancies persist at the level of specific time intervals or localized events. This limitation was starkly highlighted by the widespread blackout that occurred in Spain and Portugal on 27 April 2025, underscoring the operational relevance of reliable forecasting.
This paper explored how the vast amount of available data can be leveraged to build numerical models that, despite some degree of error, identify relationships and patterns in the data, enabling future demand predictions. We focused on evaluating the performance of recurrent neural network (RNN) models through numerical experiments. Unlike traditional neural networks, RNNs can retain information from previous time steps, making them well suited for time series forecasting. Specifically, we implemented the LSTM (long short-term memory) model, a type of RNN designed to capture both short-term and long-term dependencies in sequential data.
To assess the model’s performance, we used electricity demand data from Terna—Rete Elettrica Nazionale S.p.A., the Italian operator of the electricity transmission grid. The results of our analysis show the following:
- −
The accuracy of our predictions is comparable to the official model used by Terna.
- −
The model is effective at predicting hourly demand with good accuracy for both short- and medium-term periods (up to several months).
- −
The model accurately reproduces energy peaks, with quantitative errors consistently below 2%.
Our findings demonstrate that carefully designed machine learning models can significantly enhance the accuracy of energy demand forecasting. Moreover, this study not only validates the LSTM model’s effectiveness in predicting electricity demand but also provides a methodology that can be easily replicated for similar forecasting tasks in other fields: the method presented has broader applicability and can inform similar analyses in other national contexts.
Although the results obtained with the RNN-LSTM model are encouraging and comparable to those of official forecasts, it is important to highlight a structural limitation of data-driven approaches. These models are often designed in an ad hoc manner and lack a solid theoretical foundation, making their performance highly dependent on the specific dataset and experimental conditions. As such, they may yield excellent results in one context but generalize poorly in another. This result reinforces the idea that, while data-driven methods are useful, their predictive capacity reaches a plateau when relying solely on historical data. A more effective strategy could involve the development of hybrid models, incorporating not only accurate meteorological inputs but also physical information about the electrical system and its dynamics. Such integration could enhance the robustness and reliability of forecasts, especially under stress or near-critical conditions.


