Article

Decoding Harmonics: Total Harmonic Distortion in Solar Photovoltaic Systems with Integrated Battery Storage

by
Johana-Alejandra Arteaga
1,
Yuri Ulianov López
2,*,
Jesús Alfonso López
2 and
Johnny Posada
2
1
Compañía Energética de Occidente S.A.S. E.S.P.—CEOESP, Popayán 190003, Colombia
2
Energy Research Group, GIEN, Engineering Faculty, Autónoma de Occidente University, Cali 760035, Colombia
*
Author to whom correspondence should be addressed.
Electricity 2025, 6(2), 28; https://doi.org/10.3390/electricity6020028
Submission received: 27 November 2024 / Revised: 7 April 2025 / Accepted: 8 April 2025 / Published: 13 May 2025

Abstract

:
This paper analyzes the power quality in a 400 kWp grid-connected solar photovoltaic system with storage (BESS), considering standards IEEE Std 519TM, IEEE Std 1159TM, and IEC 61000-4-30. For system analysis, a photovoltaic array model is developed. Neplan-Smarter Tools software is used for model validation, and experimental measurements are performed on the actual photovoltaic system, recording total harmonic distortion (THDi/THDv). A class B power quality monitor was used to measure three-phase electrical variables: current, voltage, power, power factor, and THD. The THD level was generated at an energy level below 20% of the rated power, resulting in high THDi. The recorded THDv remained below 2.5%, which means that its value is limited by the IEEE 519 standard. When the BESS was connected to the PCC grid, the voltage level remained regulated, and the electrical system appeared to be stable. This paper contributes a methodology and procedure for measurement and power quality assessment, allowing for THD identification and enabling designers to configure better designs and energy system protections when integrating solar photovoltaic energy into an electrical distribution network.

1. Introduction

The use of solar photovoltaic (PV) systems to convert sunlight into electricity is rapidly expanding worldwide [1,2,3]. These systems, connected to the electrical grid, are becoming a more common and feasible alternative for energy production [4] because solar power is a form of distributed generation in which electricity is produced from local resources like sunlight [5]. These solar PV systems are mainly composed of a generator (photovoltaic modules) and an inverter, which is manufactured with electronic devices, such as SiC MOSFETs and IGBT transistors, capable of transforming the direct current into an alternating current, thus controlling the frequency and voltage value at the inverter output for an accurate synchronization with the grid.
Currently, with many PV systems connected to the grid, the operation or high penetration of these systems can affect the power grid quality and low-voltage networks, generating negative impacts such as harmonics [6]. Moreover, the DC-to-AC conversion process inherent in photovoltaic inverters significantly contributes to harmonic distortion, thus compromising the quality of the electrical power supply [7,8]. Thus, sudden changes in solar radiation, automatic disconnection of photovoltaic systems in the absence of a main power supply (anti-islanding protection), or electrical parameters (voltage or frequency) out of range can affect the quality of electric service [9,10]. International organizations, such as the Institute of Electrical and Electronics Engineers (IEEE), have identified and characterized these technical problems. In IEEE 1100, power quality is measured, analyzed, and improved on the bus voltage, usually a load bus voltage, to maintain that voltage as a sinusoid at the rated voltage and frequency [11]. Moreover, harmonic distortion in a nonlinear environment was found through simulations, and the network loading level was identified as a key factor [12].
Considering the loading issue, the relation between the harmonic current and the maximum load current demand is known as the total harmonic distortion (THD). The THD can change as the inverter output power varies [12,13]. In addition, we previously measured and found that high THD levels appear on the PCC under low-energy-demand conditions, especially when the generated energy is under low-rated power. The THD is an important index, expressed in percentage (%), and is used to describe the level of disturbance affecting the power quality in an electric system, as shown in Equation (1). Thus, THD analysis can improve the installation of solar grid tie systems in LV networks. Here, Ih is the h harmonic of the current and I1 is the fundamental current harmonic.
T H D = 100 h = 2 40 I h I 1 2  
The origins of such disturbances and their values remain a matter of research. Specific studies considered meteorological variables, such as environment temperature, irradiance, and rain, as basic conditions and their influence on solar power production, showing how current harmonics are presented in the point of common coupling (PCC) and how they are opposite to irradiance and power production [14]. Likewise, other practical research results showed that data monitored with IEC 61000-4-7:2002 require computational tools to simulate the impact of all the harmonic content in the current of a solar 10 kW grid-tied system in Croatia [15]. Several researchers analyzed the negative impact of solar PV grid-tie inverters in terms of sun radiation changes and the way inverter classification depends on waveforms: square (THD:40%), almost square (THD:30%), six steps (THD:28%), twelve steps (THD:15%), and pure sine without distortion [9,16].
Although there is a harmonic impact, solar PV inverters connected to the grid offer a high conversion efficiency (nearly 98%). In addition, they maintain a power factor higher than 90%, and, at the same time, they maintain a total harmonic distortion lower than 5% [17]. However, not all published research has measured less than 5% impact due to THDi; some specific cases reveal more than 20%, and it depends on the load and time of the day [18]. Some other authors analyzed harmonic emissions from PV inverters connected to a low-voltage grid while varying the solar irradiance levels and compared the results with field measurements [8,19]. In those studies, the field measurements of power quality parameters were conducted on several kWp PV systems and the relationship between the voltage and current harmonics in an LV system. In addition, the impact of a grid-connected PV during a regular working day on a university with its normal current flows was reported. Additionally, an increase in voltage pollution was observed near the point of common coupling (PCC), resulting in a decrease in voltage quality [20]. In addition, previous research has demonstrated that grid-connected PV inverters increase the disturbance of power distribution networks. The evidence shows that implementing inverters with multiple control objectives, such as symmetrical component control to compensate for unbalanced and harmonics of nonlinear loads, effectively mitigates these harmonics.
In PV solar inverters, the switching process uses pulse width modulation (PWM) techniques in SiC MOSFET and IGBT devices. Some research studies analyzed the impact of different environmental conditions [21]. SiC MOSFET devices operate at high switching frequencies and develop switching transients due to rapid changes in voltage and current (high dv/dt and di/dt), which can generate additional harmonics [22,23]. Existing and recognized solutions include active and passive filters [24,25]. Active filters improve harmonics mitigation because the efficacy and adaptability of traditional passive filters are limited, so innovative control strategies must be used [26].
Active filters, such as Shunt Active Power Filters (SAPFs), Three-Phase Voltage-Fed Shunt Active Power Filters, and Intelligent Control Active Filters, play a crucial role in improving the waveform of electric current distorted by nonlinear loads. These filters, as demonstrated in previous research, are effective in enhancing the performance of solar PV systems [27].
Despite their widespread use, passive filters have limitations that make them inadequate for reducing or mitigating THD in solar PV grid-connected systems. These filters, as highlighted in research studies [28], struggle with higher-order harmonics and are typically tuned to specific frequencies. They may also cause resonance issues with the grid in solar PV systems [29]. In contrast, active filters offer greater flexibility and dynamic response but are more complex and costly than passive filters. They require sophisticated control strategies [28,29].
This article evaluates and compares the results of investigations on the impact of current and voltage harmonics in a university campus building with electrical loads, like computers, LED lighting, medium-power motors for water pumping and lifts, and a few TVs. Some articles with similar results mention that harmonics are introduced by nonlinear loads such as transformers, compact fluorescent lamps (CFLs), LED lighting, fluorescent tubes, air conditioners, mobile chargers, TVs, computers, and medium AC motors for elevators [30,31,32].
According to several published papers, higher education institutions (HEIs) contribute to low power quality, specifically in electrical current total harmonic distortion (THD), due to the proliferation of nonlinear loads, such as computers, laboratory equipment, and lighting systems. Some studies conducted at various educational institutions have found that THDi levels exceed the IEEE standard limit of 5% [31,32,33,34]. This can lead to increased transformer losses, decreased electric energy efficiency at HEIs, and potential equipment damage [35,36]. Some researchers have discussed the relevance of harmonics and total harmonic distortion (THD) in university buildings with nonlinear loads. Moreover, they have provided a solid foundation for understanding the measurement and impact of harmonics and THD in university buildings with nonlinear loads. A study at Mutah University found that the THDi values for various nonlinear loads ranged from 15% to 30% [37,38]. Another study monitored and analyzed the harmonic distortions caused by typical nonlinear loads in an educational institution, indicating that the THDi values varied between 10% and 25% [39]. In a similar vein, another study explored power quality issues and harmonic analysis on university campuses, with a specific focus on the impact of nonlinear loads on the electrical network, yielding THDi values ranging from 12% to 28% across various nonlinear loads at Sultan Qaboos University in Oman [40]. Lastly, an Indian research study’s analysis showed that THDi values for nonlinear loads were between 18% and 35% [41].
Standardization plays a crucial role in this research area. Researchers adhere to IEEE standards for grid-connected PV systems to effectively identify and characterize electrical perturbations that impact power quality within the grid. These standards address the voltage and current distortions resulting from harmonics at the point of common coupling (PCC), notably, IEEE Std 519 and IEEE Std P519a. The IEEE 519-2014 standard serves as a benchmark for current distortion limits in distribution grids operating at voltages ranging from 120 V to 69 kV (with the low-voltage bus bar at 440 VAC), as detailed in Table 1 and Table 2 [42]. To accurately assess these disturbances, on-site measurements were conducted, followed by a comprehensive analysis of the recorded data under IEEE regulations [42,43]. Those tables display the maximum allowable harmonic current distortion for odd harmonics, expressed as a percentage of the short-circuit current (Isc) and the full-load current (IL). Even harmonics are restricted to 25% of the limits imposed on odd harmonics; therefore, their contribution can be considered negligible.
As feasible and proven solutions, technical failures in distribution networks are related to electrical disturbances; however, many solutions exist to reduce or mitigate them. Different flexible alternating-current FACT devices are used in that aspect, such as active static compensators or reactive STATVARs [19]. For industrial applications, a widely used solution is the implementation of a Static Var Compensator (SVC). Through the multifunctional control of the voltage source converter, the SVC allows for the load supply, harmonic mitigation, unity power factor achievement, active power control, and power quality maintenance in both grid-connected and isolated modes of operation. Results validate the effectiveness of this solution, demonstrating that under both operating conditions, the harmonic content remains below 5%, thus complying with the international standard IEEE Std 519-2014 [44]. Another control technique has been tested to improve the electrical power quality of an SSFV + BESS and, in turn, control the voltage at the common point, mitigating negative effects such as harmonics and unbalance, among others [45]. Some storage technologies enable the high penetration of solar energy into the grid [46]. The latter research is developed and described in this article. Therefore, battery storage has shown positive results in terms of energy management for electric power systems and In a grid-tie PV system, batteries help store surplus energy and provide a constant supply, improving power stability and quality while helping to reduce total harmonic distortion (THD) [47,48,49].
To clearly delineate the scope of this research, the major objectives of this study are presented below:
  • Analyze the power quality in a 400 kWp grid-connected solar photovoltaic system with storage (BESS), considering standards IEEE Std 519TM, IEEE Std 1159TM, and IEC 61000-4-30 in the analysis, using Neplan-Smarter Tools software for model validation.
  • Contribute a methodology and procedure for measurement and power quality assessment, allowing for THD identification.
  • Enable designers to configure better designs and energy system protections when integrating solar photovoltaic energy into an electrical distribution network.
The subsequent sections of this paper are organized to address each of these objectives in detail and discuss the following aspects:

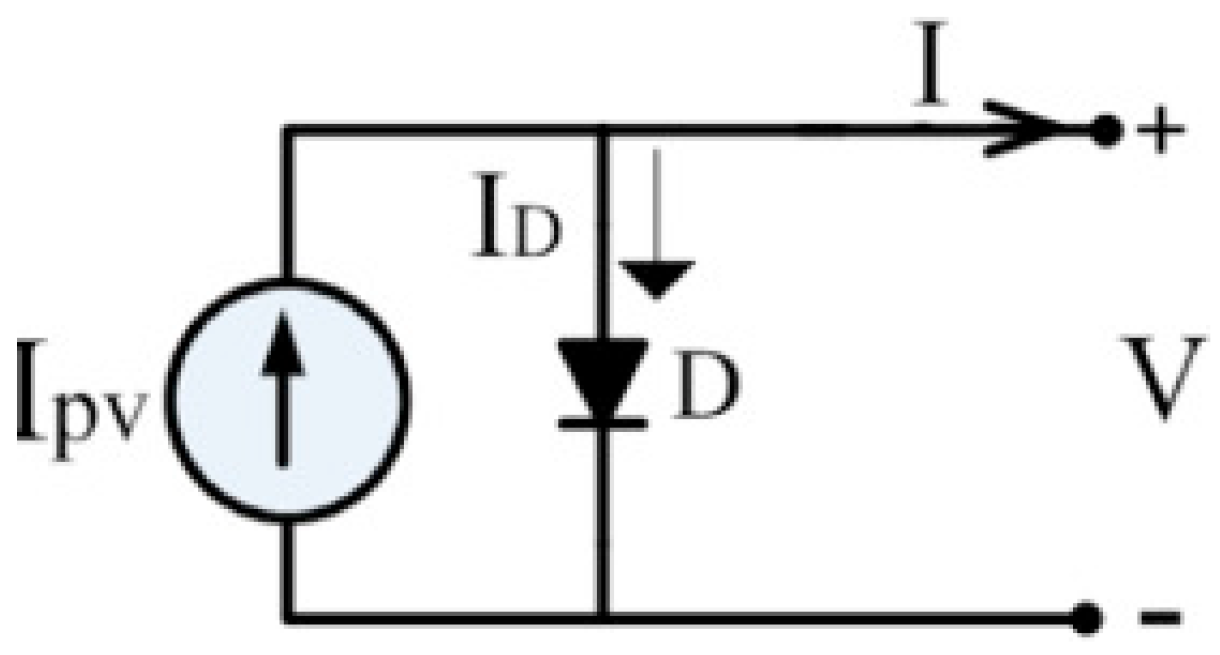
2. Mathematical Model

Many PV panel models already exist in the literature. However, this study used the single-diode model for simulations and studies. The model, as depicted in Figure 1, is characterized using Kirchhoff’s current and voltage laws. The solar cell’s electrical current (I) is the photocurrent produced minus the diode current (IpvID), is the diode saturation current, VD is the voltage of the diode, α is the ideality factor of the diode, q is the absolute value of electron electric charge, T the temperature in Kelvin, and K the Boltzmann constant. In the absence of solar irradiance, the cell behaves as a regular diode, and the generated current is calculated using Shockley’s law, as shown in Equation (2) [48].
I = I P V I S [ exp q V α K T 1 ]

2.1. Total Energy Generated by the PV System

The total energy per day produced in a subsystem uses the Watt´s law, which multiplies electric power P, expressed in watts (W), and t, which is the daytime expressed in hours (h), as shown in Equation (3). The time given is the number of sun hours per day at the location of the solar PV system, and k is the number of days in a month, as shown in Equation (4).
E m = t i = 1 k P i
E m t o t a l = t i = 1 3 j = 1 k P i j

2.2. Total Harmonic Distorsion (THD)

Total harmonic distortion (THD), which is the key study factor here, is the relationship between the harmonic current value and the maximum load current demand, as shown in Equation (5). THD can change significantly while the inverter output power varies simultaneously [13]. Usually, high THD levels are easily found under low-demand conditions, especially when the generated energy is less than 20% of the rated power. THD is an important index, expressed in percentage (%), and is used to describe the level of disturbance affecting the power quality in an electric system, as shown in Table 1. The analysis of harmonic distortion and the concept of total harmonic distortion (THD) facilitate the installation of grid-tied solar systems in LV networks. Solar PV inverters connected to the grid have a large conversion efficiency (near 98%) and a power factor higher than 90%, and, at the same time, they maintain a total harmonic distortion lower than 5% [17].
T H D = 100 h = 2 40 I h I 1 2
where Ih is the h harmonic of the electrical current and I1 is the fundamental current.
The total harmonic ratio to the fundamental frequency component is defined as the THD of the system. THD in the rms value is defined according to (6) and (7).
T H D v = V 2 , r m s 2 + V 3 . r m s 2 + + V h m a x r m s 2 V 1 , r m s
T H D i = I 2 , r m s 2 + I 3 . r m s 2 + + I h m a x r m s 2 I 1 , r m s
where Vx and Ix are the peak values of the fundamental, second-order, third-order, and higher-order harmonics of the voltage and current waveform, respectively.

3. Monitored System and Measurements: Demand and Generation

The Autonoma de Occidente University electrical system has three substations connected to the distribution grid for medium-voltage (primary) and low-voltage (secondary) 13.2 kV and 480 V AC, respectively. The main load is distributed as follows:
  • Substation No. 1—500 kVA transformer (13.200/480/277 V). Main load: Central administrative building.
  • Substation No. 2—1000 kVA transformer (13.200/480/277 V). The electrical loads are four classroom buildings, a university welfare building, a water plant, and a fitness student center.
  • Substation No. 3—800 kVA dry transformer (13.200/480/277 V). Loads: central building cooling plant.
The university campus’s electrical loads include computers, air-conditioned systems (HVAC), and LED lighting. Previous research developed two years ago by our colleagues from the research group identified, measured, and characterized this load. A group of colleagues measured the active, reactive, and total three-phase power over the entire university campus under conditions similar to those of the experiment. In the case study, previous research using the ISO 50001 Energy Management System monitored and measured all the university’s energy loads. In this case, the main loads are the air-conditioned system: two chillers of 250 tons of refrigeration (55,391 kWh/month), computers (10,552 kWh/month), and LED lighting (2533 kWh/month) [35]. The results show that the main building consumes an average of 4 MWh during the academic term. The hourly energy demand for two days is presented in Figure 2. Lighting loads account for approximately 30% of the total energy consumption. HVAC (Heating, Ventilation, and Air Conditioning) represents 40% of the total energy consumption. Computers, printers, laboratory equipment, and other electric loads, such as elevators (1 per classroom building), security systems, and kitchen appliances, together account for the remaining 10% of the energy consumption [35].
The university’s solar photovoltaic generation system is 430 kWp, providing approximately 15% to 18% of the campus’s total energy requirements. It should be noted that this energy is only provided during daylight hours. Because it is a grid-connected solar system, the local distribution network supplies the electricity needed at night or in the absence of daylight.
The solar PV system was developed in a Power Purchase Agreement–PPA to a energy utility. They brought all the components and installed in two phases:
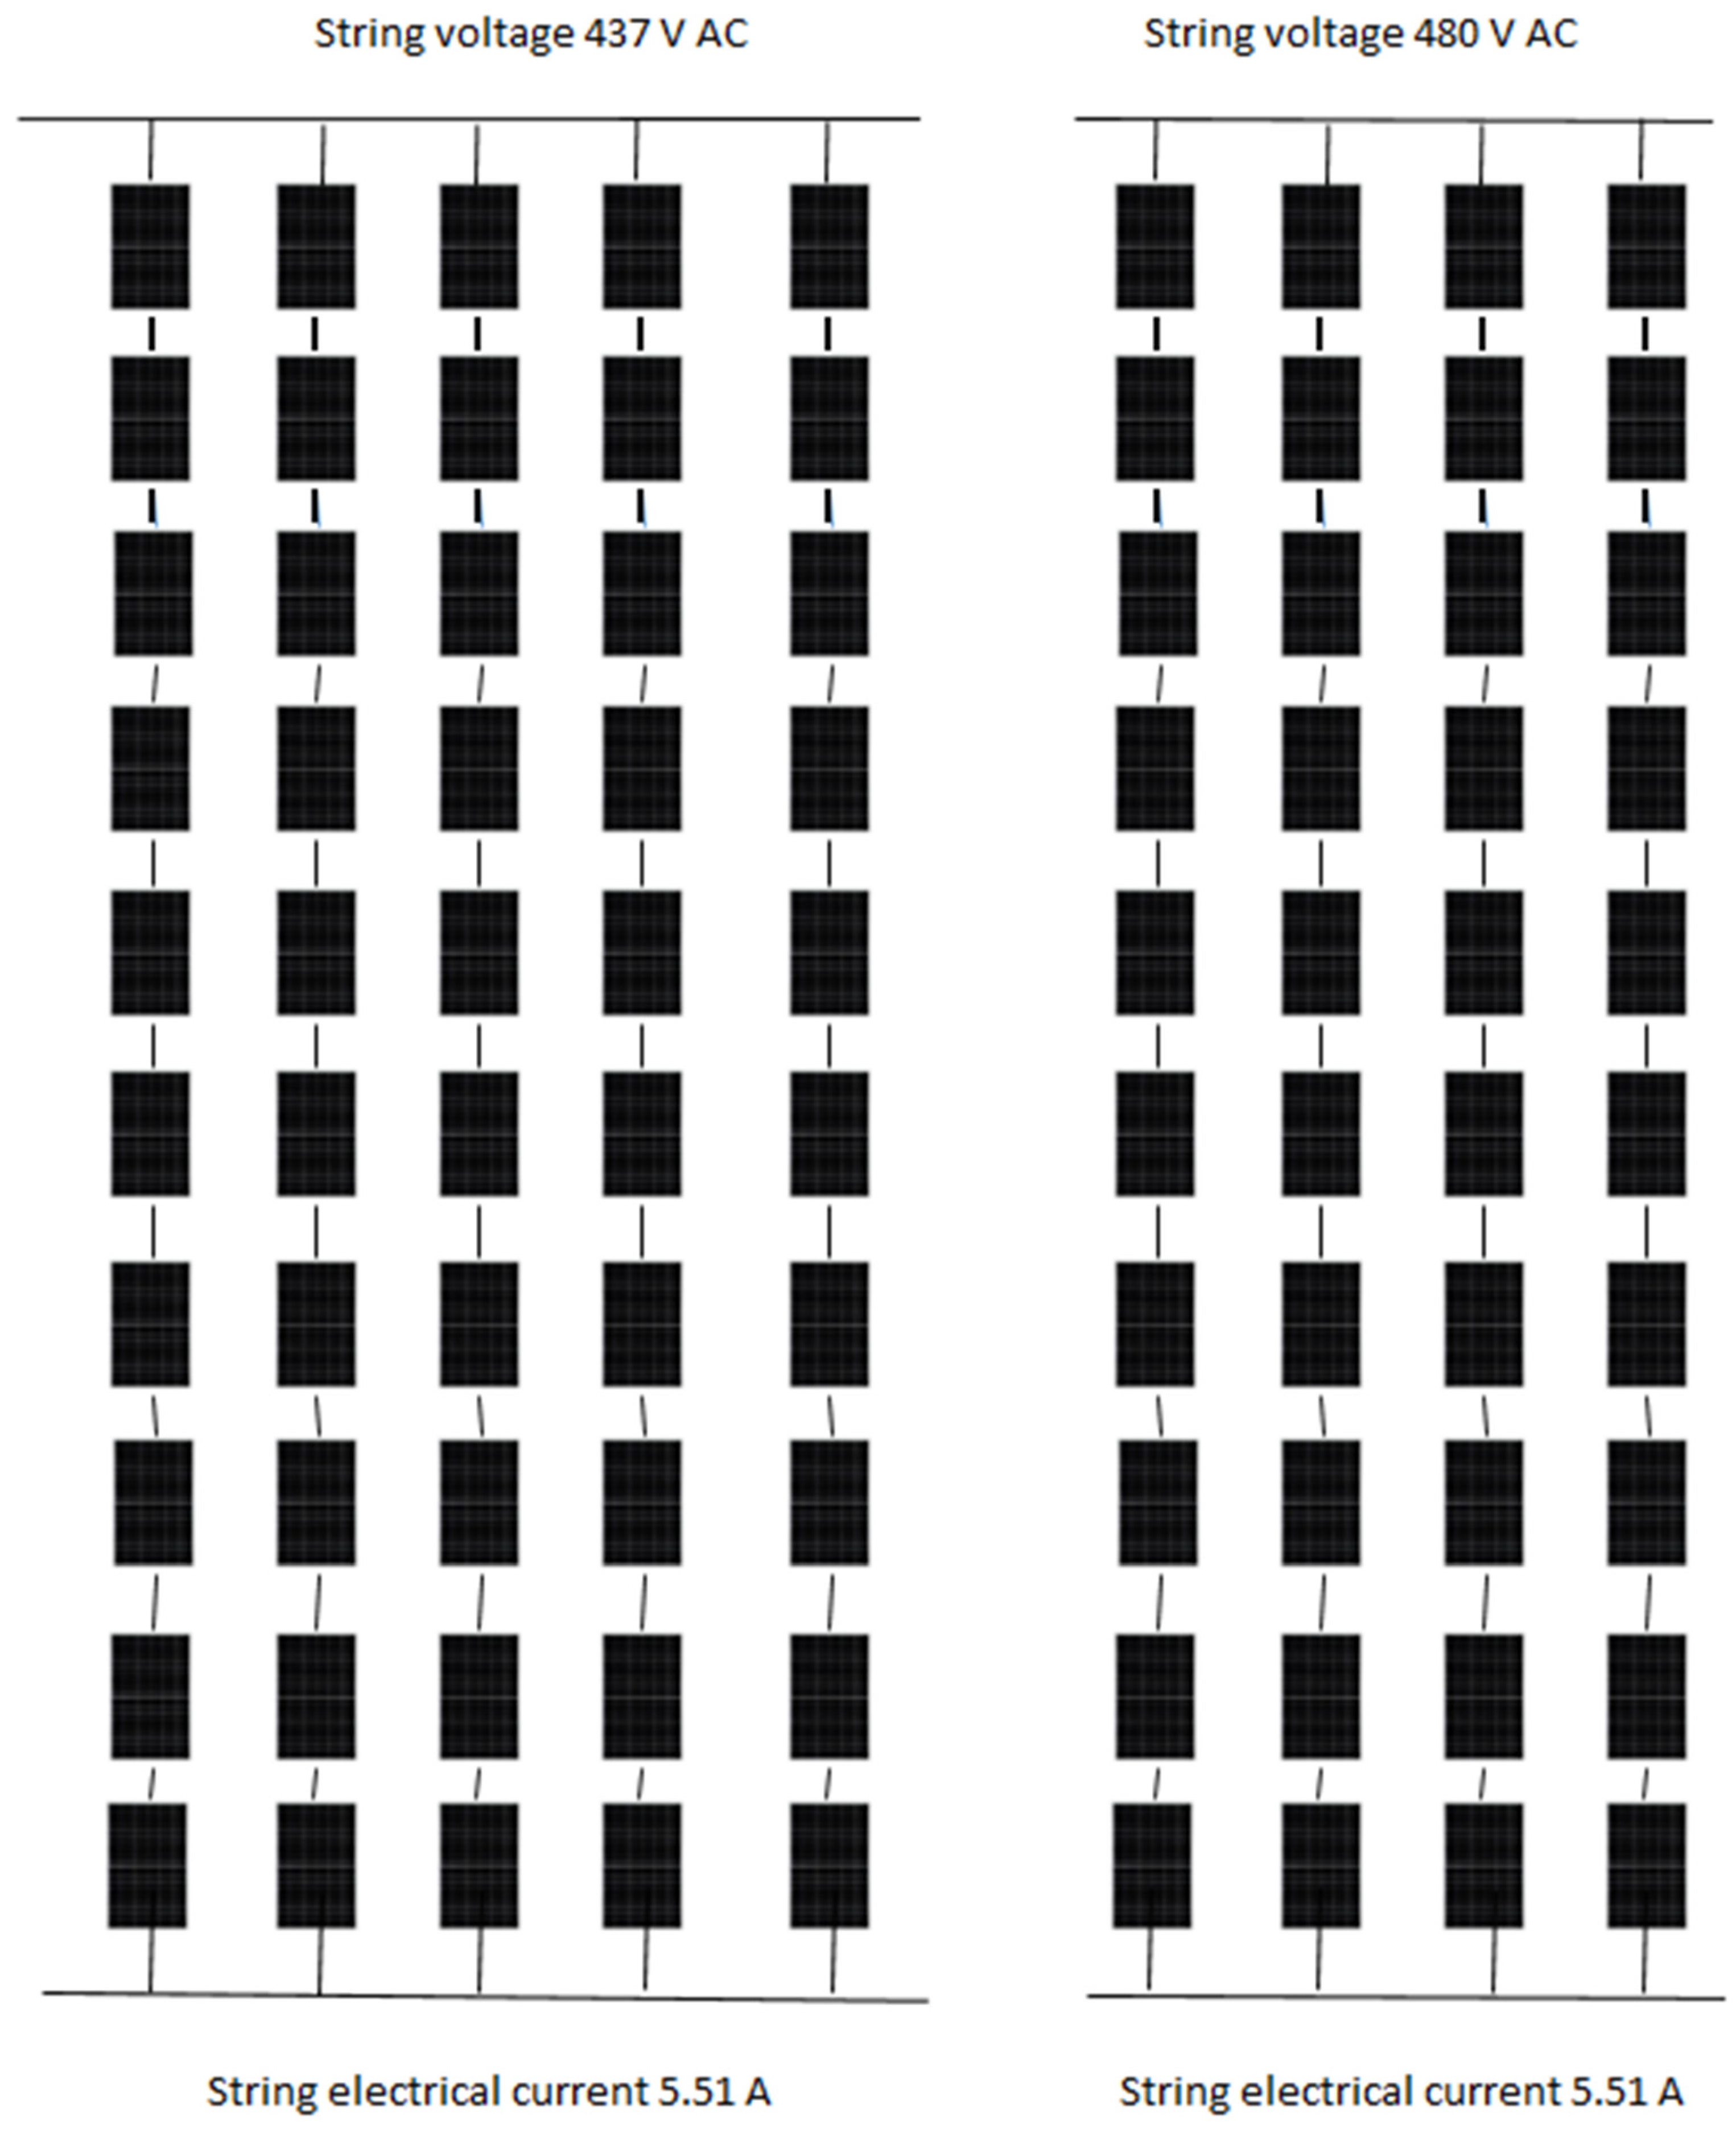
  • Phase 1: 150 kWp. Composed of 298 Panasonic 240 Wp (VBHN240) and 345 Panasonic modules (model-23030)—Tier 1. A topology of a 50 kWp subsystem with 10 and 11 parallel series strings is presented in Figure 3. The solar modules’ features are listed in Table 3, and the inverter data are listed in Table 4.
  • Phase 2: 250 kWp. Composed of a 944 module with 265 Wp (HR—265) Hareon Solar—Tier 2.
The photovoltaic solar energy generation for the measurement days is presented in Figure 4, where the maximum production occurs at midday, and this is similar throughout the year due to the city’s excellent location close to the Equator (latitude 4 N, longitude 76 west).

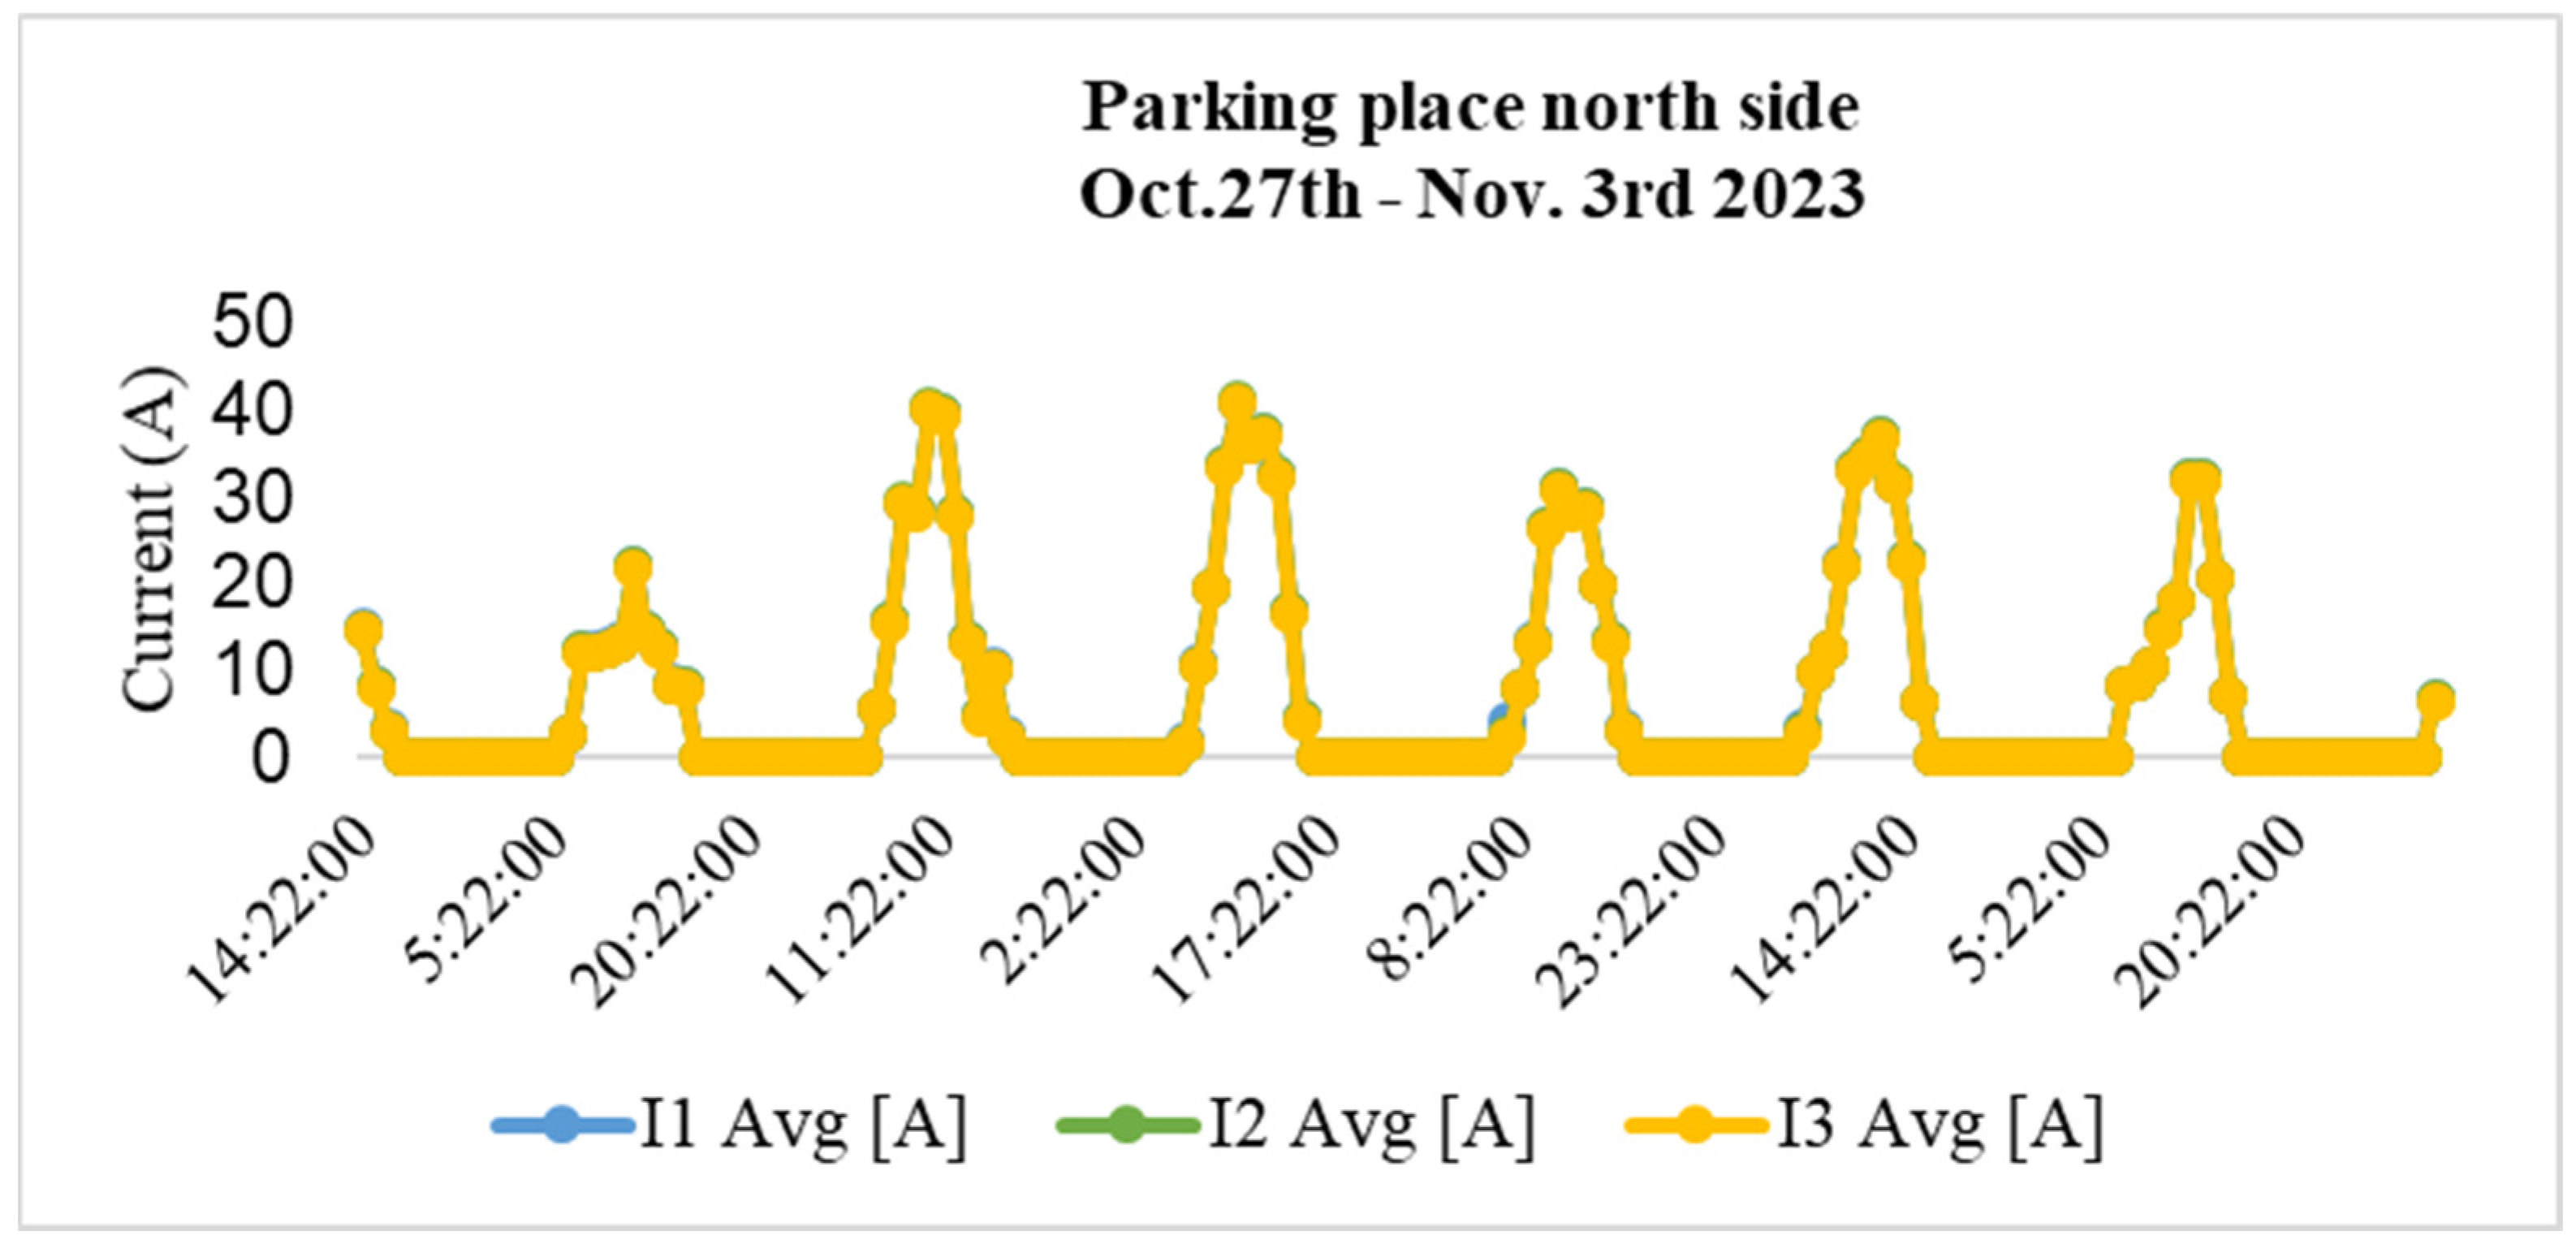
3.1. Power and Parameter Measurements

Field measurements at the point of common coupling (PCC) included the main electrical parameters, such as the voltage and current at the 440 V busbar. For the power-quality performance, the harmonics X–Y were measured, and the active and reactive powers were also considered. The measurement method followed the international IEC 61000-4-30: testing and measurement techniques for analyzing the measures. An HT three-phase monitor registers the current, voltage, harmonics, and power injected into the grid to measure the power quality performance parameters in the common coupling system. The main characteristics are listed in Table 5.
The assessment followed IEEE standard 519 for interconnecting distributed resources. A class B power quality monitor measures typical electrical variables, such as electrical current, voltage, power, power factor, and THD to evaluate power quality. Only the phase current produces THD below the permissible percentage, according to the standard.

3.2. Methodology

This section provides details of the simulation methodology steps and settings for simulating current harmonics up to the 51st order for a 430 kWp solar PV system with 4.6 kW on batteries. The following Scheme 1, is the flow chart that clearly illustrates the processes carried out under international standards and the analysis used to obtain the results.

3.2.1. Model Setup in NEPLAN

Network Configuration presents a single-line diagram of the PV system, illustrating the solar panels, inverters, transformers, batteries (data are detailed in Table 3, Table 4 and Table 5), and loads. Subsequently, harmonic current sources for the inverters were defined, specifying harmonics up to the 51st order. For the nonlinear loads, each NEPLAN block was configured with the active, reactive, and total power values that can contribute to harmonic distortion.
Simulation Settings: Initially, the frequency range was defined from 60 to 3060 Hz, encompassing harmonics up to the 51st order. Consequently, NEPLAN performed a load flow analysis to calculate the voltage and current harmonics at each node and element within the network. Furthermore, NEPLAN computed the total harmonic distortion (THD) for both voltage (THDv) and current (THDi).

Technical Parameters of Power Energy Systems

Note: The parameters of the energy storage system using batteries are input data for the NEPLAN® Smarter Tools software for the SEP, as presented in Table 3, Table 4, Table 5, Table 6, Table 7, Table 8 and Table 9.

4. Results: Current and Voltage Measurements

Figure 5 and Figure 6 show the regular currents obtained with the HT instrument and produced on 30 October 2023.
In Figure 7, Figure 8 and Figure 9, we present the energy demand, solar PV generation, and THDI production for comparison with these parameters.
The PV subsystems supply current throughout the day from 5 a.m. to 5 p.m.; however, a distinct Gaussian distribution of photovoltaic generation is pronounced between 6 a.m. and 4 p.m., as presented in the figures. Figure 8 illustrates the typical photovoltaic current production profile from 6:00 a.m. to 4 p.m. Despite the use of high-quality inverters, the photovoltaic generation process consistently exceeds the THD limits of 5% and 8%, reaching a peak of 21.5% around 7:30 a.m. (green curve). While the maximum energy production occurs between 8 a.m. and 2 p.m. when THD is at its lowest, in order to comply with the THD standard of less than 8%, the optimal energy production range lies between 9 a.m. and 1:30 p.m.
Figure 9, obtained using the HT power quality meter, shows the harmonic distortion analysis (%THD) results for the three phases in the same period. As previously analyzed, this figure shows the lowest harmonic distortion at midday, thus verifying compliance with the standard. The previous analyses show that the lowest harmonic distortion occurs around midday, confirming compliance with the standard. As an interesting result, the maximum THD values occurred in the early hours and near 5:00 p.m. On a typical sunny day, high irradiance values yield high power values; however, this is not the case at the beginning, i.e., when the sun starts shining. The same phenomenon occurs at sunset. The measurements show that a solar PV grid-tied system produces high THDi levels (around 21.5% while AM), while THDv is within the range limited by IEEE 519 without affecting the electrical system. According to the measured and reported data, there was a negative impact on the power quality, resulting in a high percentage of electric current harmonics. These differences are consistent with the conclusions of previously published research [37,38,39,40]. The previously published measurement data support the interpretation of high THDi values.
The research that reported high THDI of nonlinear loads at low irradiance concurs with similar findings in a recently published study. Previous research measured THDI values exceeding 146.6%. However, the authors reported an almost constant THDI, with values between 146 and 271.1% [31]. Despite the almost constant THDI values observed, an interesting coincidence contrasting with that article is that the highest THDi values occur in the early morning and late afternoon. For instance, similar results were reported on a university campus (similar loads) in Malaysia, where a high THD current of more than 20% was recorded when solar irradiance was below 200 W/m2 [32]. Neither study mentioned the inverter features, where the IEEE 1159 standard plays a significant role. The standard dictates that a synchronous inverter should avoid harmonics exceeding 5% while generating electricity from a solar photovoltaic generator, thus establishing this as the maximum value. As solar irradiance increases and reaches noon, THDI tends to zero. This observation is significant as it suggests that power quality improves with increasing solar irradiance, as shown in Figure 9. However, the measurements in these two publications do not exhibit this behavior, indicating a potential area for further research and optimization.

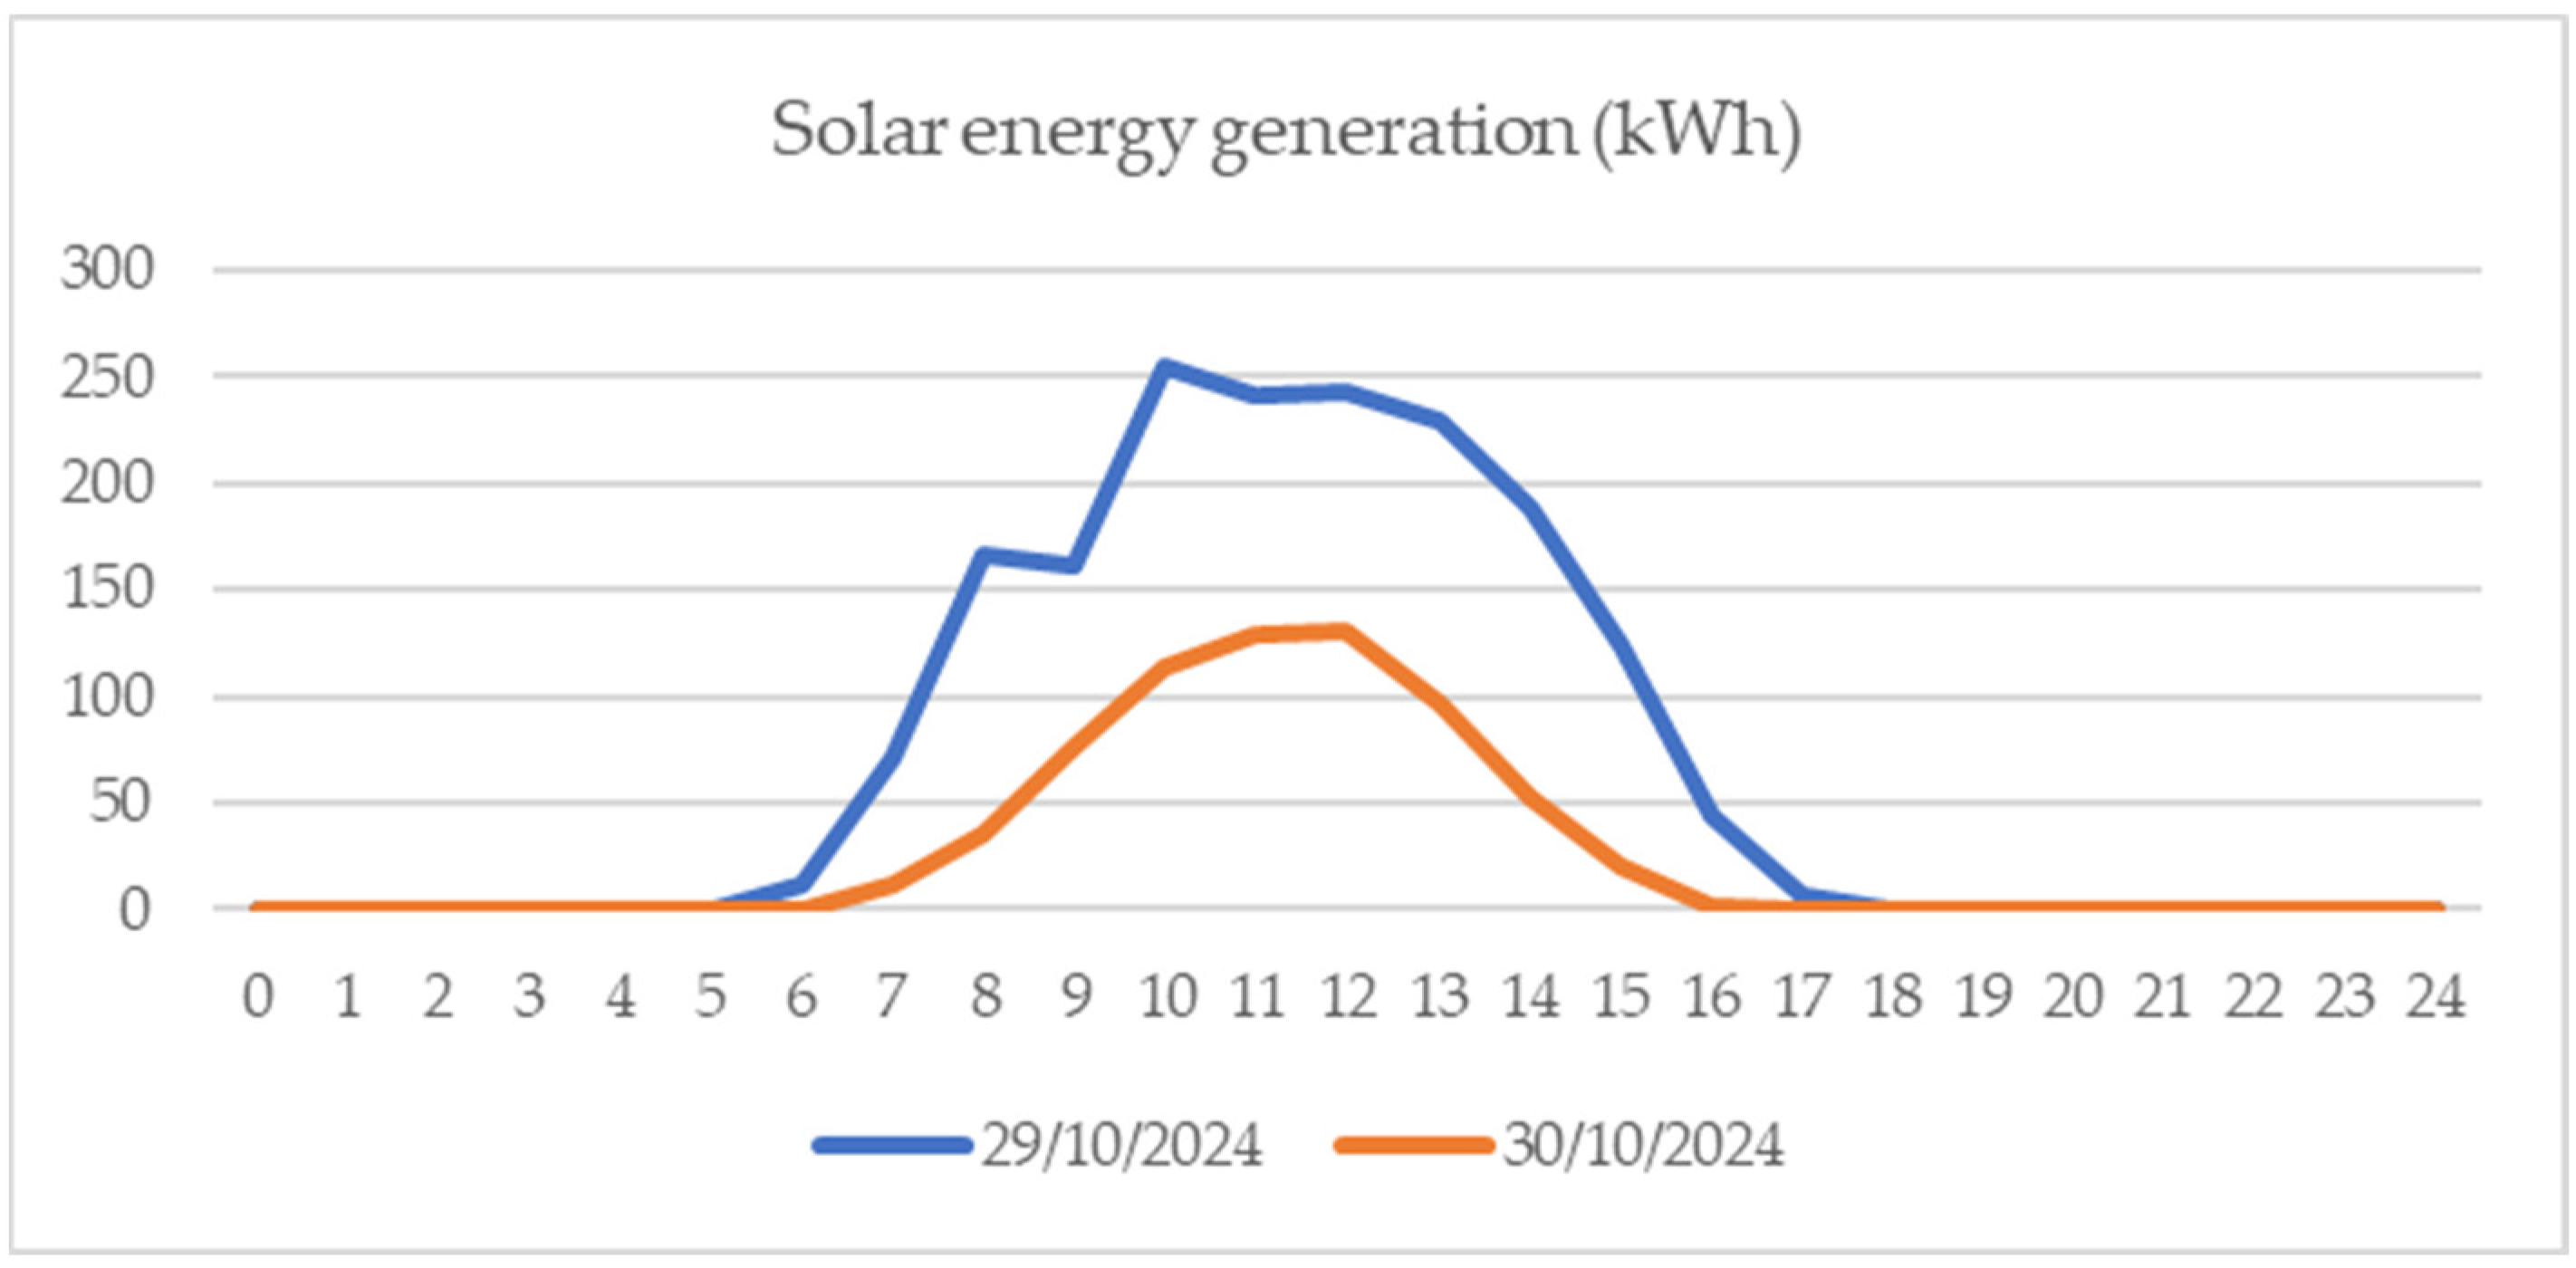
4.1. Monthly Generated Energy

Figure 10 and Figure 11 show the energy generated during 2023. The results show the energy produced by the simulation using radiation data according to NASA data or Environmental Studies Colombian Institute data (in Spanish IDEAM). Due to high values of irradiance, the maximum power is produced in January, October, and December, suggesting that the highest power and energy measurements will occur in these months. However, the low radiation values at sunrise and sunset are not affected by the month of the year; they occur daily.
Measurements were taken using three-phase network analyzers. The results obtained, both practical and theoretical (simulations), were evaluated considering national standards NTC 5000—2002, NTC 5001—2008, IEEE Std 519TM—2014, IEEE Std 1159TM—2009, and IEC 61000-4-30—2015. Based on these regulations and their application to previous research by the same group, a particular behavior of the current waveform and THD was observed. Figure 12 presents the current THD performance, while Figure 13 presents the voltage THD performance in the three-phase system, and the differences are evident.
Figure 12 presents the characteristics of the current total harmonic distortion (THDI) by the irregular and asymmetrical waveforms in the three phases. In phases 1 and 2, THDV was almost 120% in the morning and midday, with a high generation level, similar to THDi. In contrast, in phase 3, low solar PV generation values produce THD minimum values that tend to zero.
The research group has been conducting power quality analysis since 2005. This was when the first solar photovoltaic system was implemented at the university’s facilities. The greatest impact of current harmonics occurs at the beginning of the day and at sunset when solar irradiance is low. The data comprised a time series of third-harmonic percentages, recorded hourly from 5:41 a.m. to 5:41 p.m. Among the peak values, the highest harmonic percentage was 4.649% at 7:41 a.m., while the average harmonic percentage over the entire period was approximately 1.33%. Notable peaks occurred at 7:41 a.m. (4.649%), 8:41 a.m. (4.11%), and 1:41 p.m. (4.096%). The simulation data and measurements were conducted according to the IEEE 519 standard. The results obtained here are similar to the THDi measurements reported in [31] and [32]. However, high THDIs with nonlinear loads at HEIs are also notable.
In comparison, a typical THDv value oscillates between 0.5% and 2.5%, according to IEEE standard 519. Consequently, THDv does not depend on the solar radiation absorbed by the system nor on the generated current or the asymmetrical performance of THDi. Data analysis indicates that while phase current 1 is below 2 A at a given time, phases 2 and 3 exhibit current values higher than 30 A during high radiation levels. These voltage imbalances contribute to increased harmonic distortion.

4.2. Simulation and Results

NEPLAN is a software program that can analyze, plan, and simulate an entire electric distribution system. The Neplan® Smarter Tools analysis indicated that the maximum current for the subsystems was 58.01 A. Nevertheless, the measurements show values below those mentioned as follows: 57.05 A for the north parking and 15.75 A for the south PV system. These lower-than-expected values could be influenced by external factors, such as shading, inadequate maintenance of solar cells, the operating environment of the equipment (inverters), and weather variations. The entire solar PV system was developed at 136 kWp and 140 kWp for the research case. These subsystems are connected to two electric substations in the university’s power system. Power monitors were connected to the 480 VAC electric panels for experimental measurements and were set up for voltage, current, harmonic, interharmonic, and active and reactive power. Table 2 presents a comparison of the monitoring performance compared with the standards.

4.3. Simulation of the Grid-Tie System Using BESS

The simulation of the Autonoma de Occidente University single-line diagram was performed using Neplan—Smarter Tools software. This process was performed based on the original diagram. Figure 14 shows the design of the one-line diagram with the solar photovoltaic systems connected to the two substations.
After simulating the university’s electrical power system in three scenarios (without the PV system, with PV, and with PV + BESS), the spectral analysis of signal levels in percentages and the total harmonic distortion (THD) in both current and voltage were obtained, as presented in the following figures. A load flow analysis was previously conducted, and, as shown in the figures, the voltage levels are below the standards, as detailed in Table 10. This table presents the load flow results, illustrating the voltage magnitude and angle at each node across the three scenarios.
As shown in Table 10, steady-state voltages exceed 90% of the nominal voltage at each node, which determines compliance with the given limits in Colombian standards from res. No. 024—2005. Others reach 100% in column V%.
In the PV solar photovoltaic generation using 4.06 kW batteries as energy storage (BESS), the NEPLAN® Smarter Tools simulation produced a total power (S) of 1459.96 kVA, an active power of 129.43 kW, and a reactive power (Q) equal to 67.47 kVAR. The system consumes a current of 405.14 A, and the electrical parameters are regulated, as presented in Figure 15 and Figure 16. Comparing these results allows for the identification of whether the connection of solar PVs to energy storage causes disturbances when energy is injected into the grid.
At the end of this research, there is no significant effect on the voltage values. However, the harmonic distortion is also minimal.

5. Discussion

An on-grid solar PV system has a minimal impact on the voltage waveform. However, THDi performance significantly affects the power quality at a PCC (point of common coupling). Notable variations are observed early in the morning and at sunset under a medium electric load with low irradiance and when the solar PV system generates low power output. This highlights the need for further research to optimize the impact of increased storage and potential changes in electrical parameters. Additional THD measurements considering parameters such as temperature and humidity in diverse scenarios, along with their improvements, are crucial for ongoing research and discussion within the field.

6. Conclusions

This research confirms that, regarding electrical loads in higher education institutions, beyond air conditioning, the loads are nonlinear. It was verified that the current in these loads has a high harmonic content, and its total harmonic distortion (THDi) could reach values up to 40%, according to published research. For this type of load, it is important to note that the electrical energy is generated by solar photovoltaics, which is produced in DC in solar panels and converted to AC by synchronous inverters that produce high percentages of THDi in the early morning and afternoon. This study contrasted and validated this result, where a maximum THDi of 21.5% was measured at low solar radiation values. These findings underscore the potential impact of the research on electrical engineering and renewable energy. No direct relation exists between the activation time of loads and the harmonic generation of solar PV systems. Moreover, a review indicated that every higher education institution with solar PV generation that measures harmonics has found high percentages at sunrise and sunset, corresponding to low irradiance.
This paper provides an interesting discussion about the possibility of extrapolating the methodology. Specifically, it analyzes how high values of solar irradiance (3.8 kWh/m2) in the location (latitude 4°, longitude −76° W) can be extended to other locations; however, the analysis should vary for other latitudes due to irradiance changes. To clarify the applicability of the findings beyond a university campus setting, it is considered that the methodology used, while tailored to a university campus, includes several elements, such as the IEC standard procedure, which can be adapted to larger-scale systems. The results offer unique insights that can be extrapolated to other settings. For example, the patterns observed in solar resource utilization and demand profile behavior can inform similar studies in corporate offices or community centers, but they cannot inform industrial assessments. Moreover, in a distributed generation (DG) system, there is no direct relationship between solar PV generation and the energy profile at the PCC (point of common coupling) because the DG plant and users are connected to a national electric network in an infinite bus.
The solar PV grid-tie system, in accordance with IEEE Std 519TM-2014, IEC 61000-4-30:2015, and NTC 5001:2008, maintains individual and total harmonic distortion of current (THDi) and demand below 8% at high irradiance levels. This ensures a high-quality, reliable system with minimal impact on the voltage waveform. However, the THDi performance indicates a significant impact on the power quality at the PCC (point of common coupling). This issue is particularly pronounced during significant variations, such as the 22% THD in phase 1 observed at 8:35 a.m. (Figure 11), which occur early in the morning and at sunset when the solar PV system generates low power levels.
The battery energy storage system (BESS), which was connected and delivered 4.06 kW of power to the system, helped reduce the campus energy consumption by 2%. It can be concluded that the storage system improves the voltage-regulated levels and that connecting the energy storage system using 0.5 kVA batteries reduces the university’s electricity consumption.
Considering the simulation results, the voltage levels found in the photovoltaic systems in both Neplan and TopView software are in the range of 270–290 V, demonstrating compliance with the provisions of IEC 61000-4-30:2015 and CREG Resolution No. 024 of 2005. These levels, which were determined to be 273.3 V (98.6%) to 295.5 V (101.89%) for the north parking lot and 275.40 V (99.42%) to 287.8 V (99.24%) for the south parking lot, indicate the system’s reliability.
The following key points are organized in bullet points with an emphasis on their originality and significance:
  • Analysis Focus: This analysis focused on power quality in a 400 kWp grid-connected solar photovoltaic system with battery storage (BESS).
  • Standards Considered: This analysis considered IEEE Std 519TM, IEEE Std 1159TM, and IEC 61000-4-30.
  • Key Findings: The key findings include high total harmonic distortion in current (THDi) under low power conditions. In addition, voltage distortion (THDv) remained below 2.5%.
  • Global Expansion: Solar PV systems are rapidly expanding as a feasible alternative for energy production.
  • Harmonic Generation: These systems can affect power grid quality, generating low and high current harmonics due to the DC-to-AC conversion process in inverters.
  • Model Development: A photovoltaic array model was developed and validated using Neplan-Smarter Tools software.
  • Experimental Measurements: Experimental measurements were performed on the actual grid-connected 430 kWp solar PV system, recording electrical variables like current, voltage, power, power factor, and THD, using a class B power quality monitor for accurate measurements.
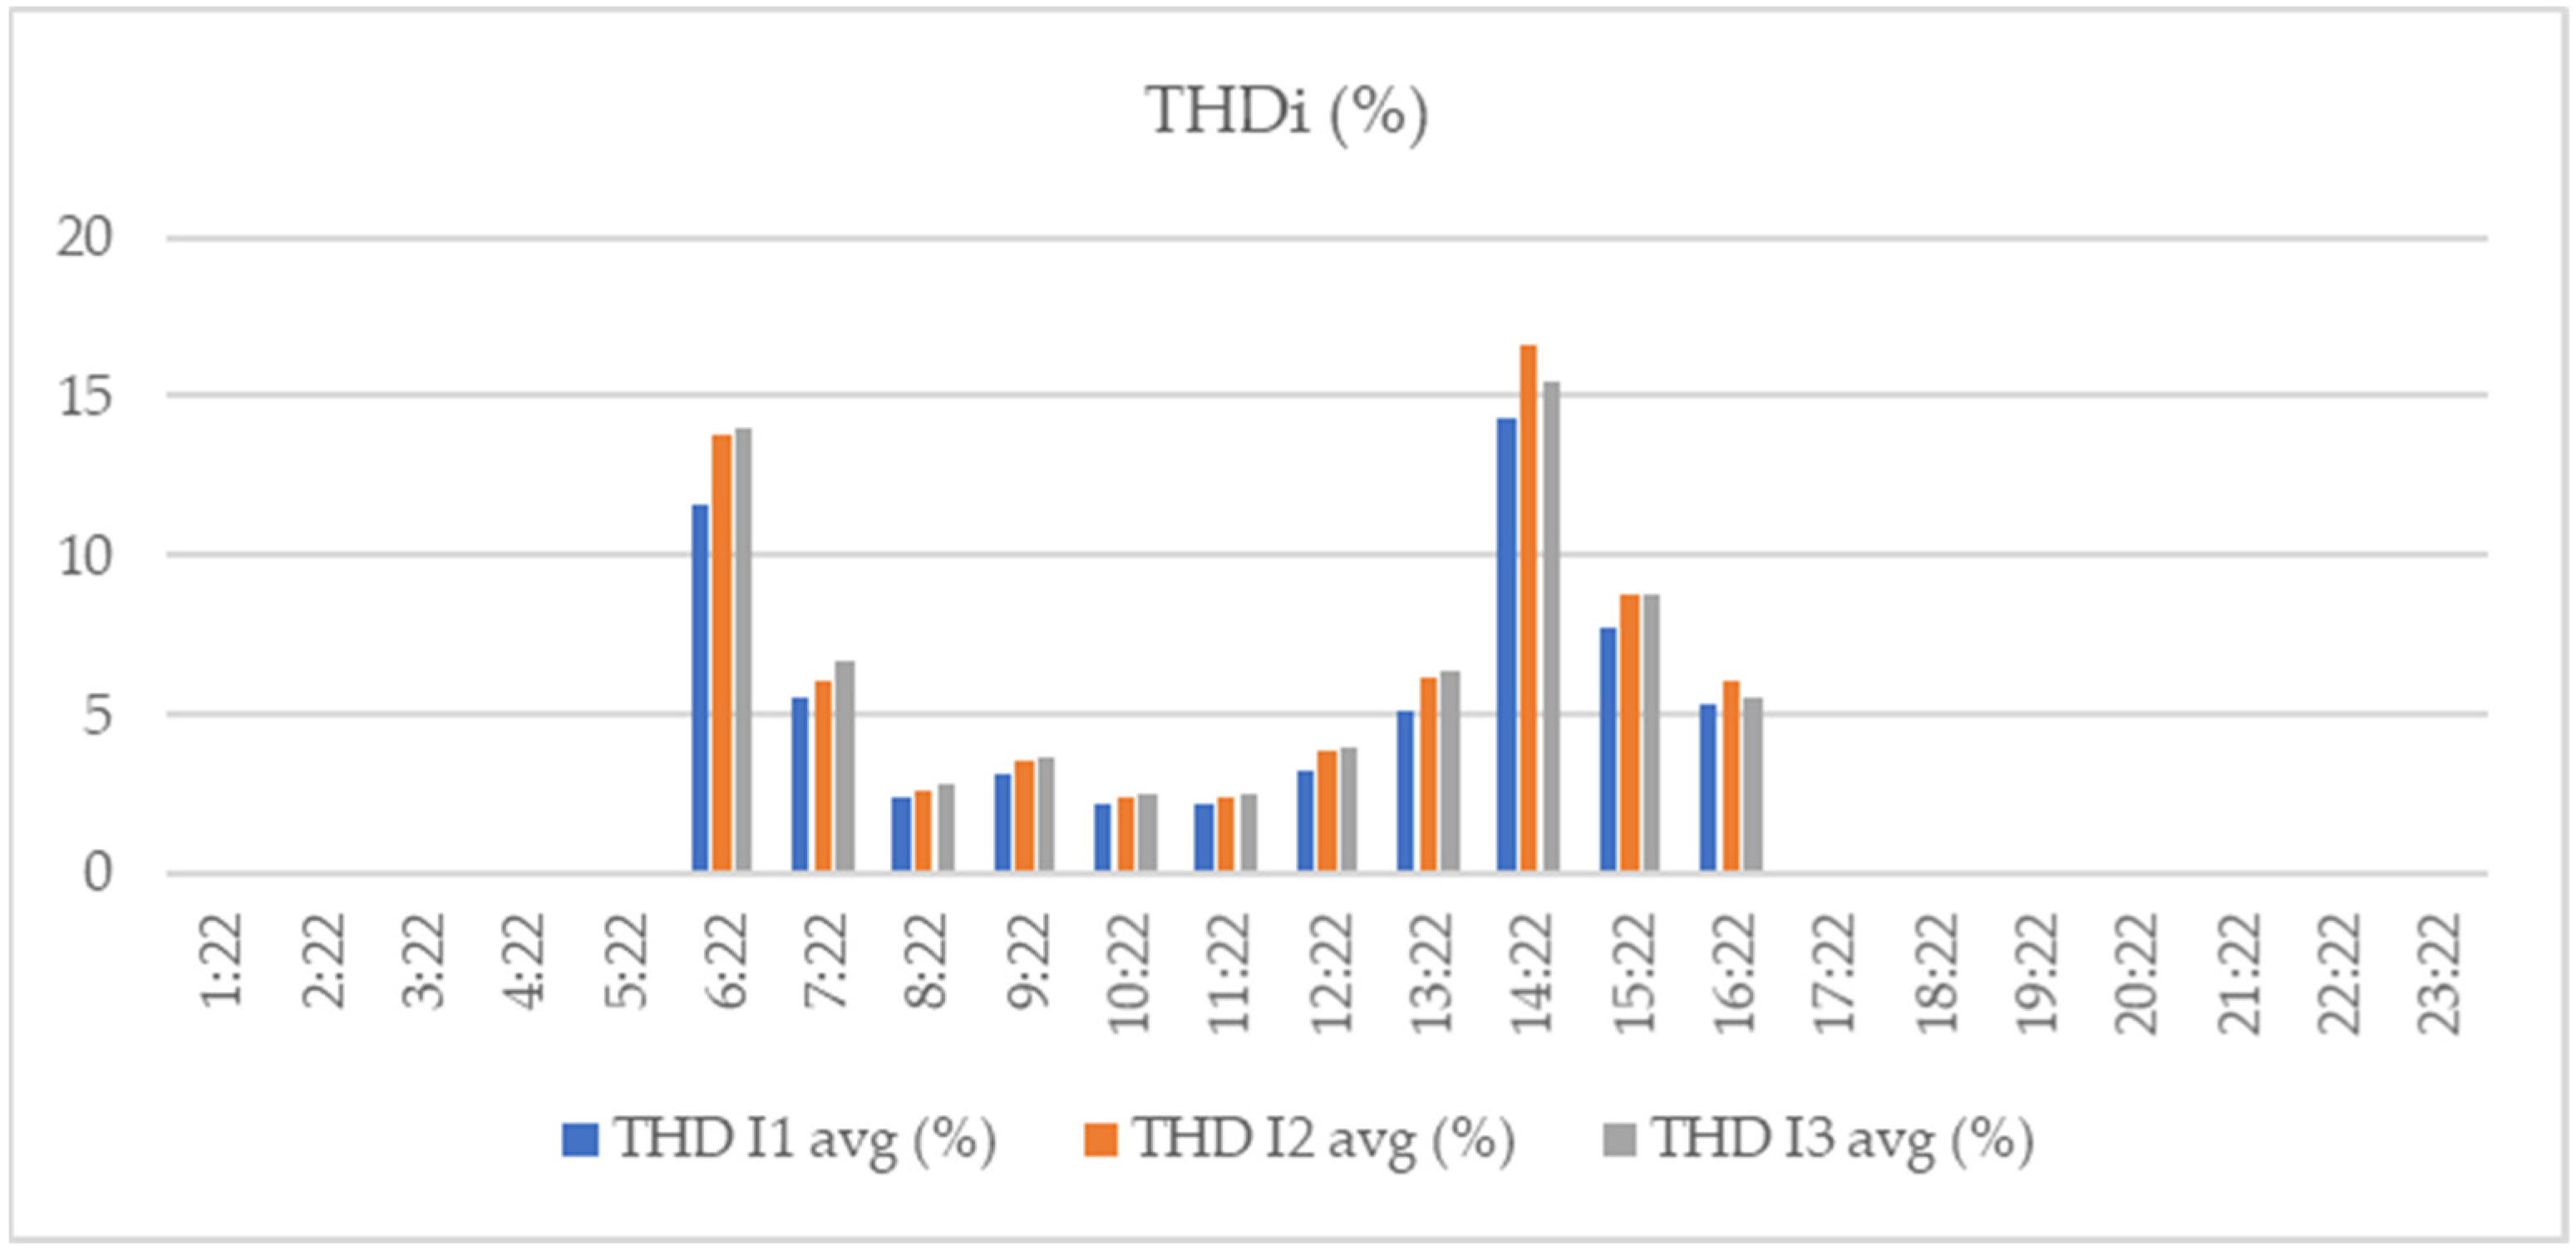
  • High THDi Levels: High THDi levels were recorded under a real scenario with low-energy-demand conditions, especially when generated energy was below 20% of rated power.
  • THDv Compliance: THDv compliance remained within acceptable limits as per IEEE 519 standards.
  • BESS Impact: The simulation showed that the connection of BESS helped regulate voltage levels.
  • Power Quality Maintenance: Solar PV systems with integrated BESS can maintain power quality within acceptable limits.
  • THDi Concerns: High THDi levels are a concern under low power conditions, necessitating further research and optimization.

Author Contributions

Authors J.-A.A. and Y.U.L. contributed to the conceptualization of this article. Y.U.L. and J.A.L. contributed to the methodology (measures and data analysis) and validation. J.-A.A. contributed to the software. Y.U.L., J.A.L. and J.P. contributed to the formal analysis. Y.U.L. and J.P. prepared the draft and this manuscript. All authors have read and agreed to the published version of the manuscript.

Funding

This research received no external funding.

Data Availability Statement

Data are contained within the article.

Acknowledgments

The authors thank Universidad Autonoma de Occidente for its support.

Conflicts of Interest

Author Johana-Alejandra Arteaga was employed by the company Compañía Energética de Occidente S.A.S. E.S.P.—CEOESP. The remaining authors declare no conflicts of interest.

References

  1. Hara, R.; Kita, H.; Tanabe, T.; Sugihara, H.; Kuwayama, A.; Miwa, S. Demonstration grid-connected photovoltaic projects in Japan. Proc. IEEE Power Energy Mag. 2009, 7, 77–85. [Google Scholar] [CrossRef]
  2. Almaktar, M.; Shaaban, M. Prospects of renewable energy as a non-rivalry energy alternative in Libya. Renew. Sustain. Energy Rev. 2021, 143, 110852. [Google Scholar] [CrossRef]
  3. Liu, E.; Bebic, J. Distribution System Voltage Performance Analysis for High Penetration Photovoltaics; National Renewable Energy Laboratory (NREL): Golden, CO, USA, 2008. [Google Scholar]
  4. Fekete, K.; Klaic, Z.; Majdandzic, L. Expansion of the residential photovoltaic systems and its harmonic impact on the distribution grid. Renew. Energy 2012, 43, 140–148. [Google Scholar] [CrossRef]
  5. Ackermann, T. Distributed resources and re-regulated electricity markets. Electr. Power Syst. Res. 2007, 77, 1148–1159. [Google Scholar] [CrossRef]
  6. Ahsan, S.M.; Khan, H.A.; Hussain, A.; Tariq, S.; Zaffar, N.A. Harmonic Analysis of Grid-Connected Solar PV Systems with Nonlinear Household Loads in Low-Voltage Distribution Networks. Sustainability 2021, 13, 3709. [Google Scholar] [CrossRef]
  7. Khalid, M.R.; Alam, M.S.; Sarwar, A.; Asghar, M.J. A Comprehensive review on electric vehicles charging infrastructures and their impacts on power-quality of the utility grid. eTransportation 2019, 1, 100006. [Google Scholar] [CrossRef]
  8. Elkholy, A. Harmonics assessment and mathematical modeling of power quality parameters for low voltage grid connected photovoltaic systems. Sol. Energy 2019, 183, 315–326. [Google Scholar] [CrossRef]
  9. Elphick, S.T. The Modern Domestic Load and Its Impact on the Electricity Distribution Network; University of Wollongong: Wollongong, Australia, 2011; Available online: http://ro.uow.edu.au/theses/3502 (accessed on 1 August 2023).
  10. Durán, J.C.; Raggio, D.; Socolovsky, H.P.; Videla, M.; Plá, J. Evaluación De La Calidad De La Energía En Dos Casos De Estudio: Distorsión Armónica Inyectada Por Un Sistema Fotovoltaico De 40 Kw Y Emitida Por Las Cargas De Una Vivienda Unifamiliar. Av. Energías Renov. Medio Ambiente 2016, 20, 13–14. [Google Scholar]
  11. IEEE Std 1100-1999; IEEE Recommended Practice for Powering and Grounding Electronic Equipment. IEEE: New York, NY, USA, 1999. [CrossRef]
  12. Torquato, R.; Trindade, F.; Freitas, W. Analysis of the harmonic distortion impact of photovoltaic generation in Brazilian residential networks. In Proceedings of the 2014 16th International Conference on Harmonics and Quality of Power (ICHQP), Bucharest, Romania, 25–28 May 2014; pp. 239–243. [Google Scholar]
  13. Chicco, G.; Mancarella, P. Distributed multi-generation: A comprehensive view. Renew. Sustain. Energy Rev. 2009, 13, 535–551. [Google Scholar] [CrossRef]
  14. Ulianov, Y.; Orozco, M.A. Power Quality Performance of a Grid-Tie Photovoltaic System in Colombia. In Proceedings of the IEEE Transmission and Distribution Latin-America Conference and Exposition, Montevideo, Uruguay, 3–5 September 2012. [Google Scholar]
  15. Karadeniz, A.; Ozturk, O.; Koksoy, A.; Atsever, M.B.; Balci, M.E.; Hocaoglu, M.H. Accuracy assessment of frequency-domain models for harmonic analysis of residential type photovoltaic-distributed generation units. Sol. Energy 2022, 233, 182–195. [Google Scholar] [CrossRef]
  16. González Pacheco, C. Simulación De Un Inversor Trifásico Conectado A Red Desde Paneles Fotovoltaicos Y Diseño De Su Control; Universidad Politécnica de Madrid: Madrid, Spain, 2018. [Google Scholar]
  17. Eltawil, M.A.; Zhao, Z. Grid-connected photovoltaic power systems: Technical and potential problems—A review. Renew. Sustain. Energy Rev. 2010, 14, 112–129. [Google Scholar] [CrossRef]
  18. Elomari, Y.; Norouzi, M.; Marín-Genescà, M.; Fernández, A.; Boer, D. Integration of Solar Photovoltaic Systems into Power Networks: A Scientific Evolution Analysis. Sustainability 2022, 14, 9249. [Google Scholar] [CrossRef]
  19. Mahela, O.P.; Khan, B.; Alhelou, H.H.; Tanwar, S.; Padmanaban, S. Harmonic mitigation and power quality improvement in utility grid with solar energy penetration using distribution static compensator. IET Power Electron. 2021, 14, 912–922. [Google Scholar] [CrossRef]
  20. Sakar, S.; Balci, M.E.; Aleem, S.H.A.; Zobaa, A.F. Integration of large-scale PV plants in non-sinusoidal environments: Considerations on hosting capacity and harmonic distortion limits. Renew. Sustain. Energy Rev. 2018, 82, 176–186. [Google Scholar] [CrossRef]
  21. Panneerselvam, S.; Srinivasan, B. Switching loss analysis of IGBT and MOSFET in single phase PWM inverter fed from photovoltaic energy sources for smart cities. Int. J. Syst. Assur. Eng. Manag. 2022, 13 (Suppl. 1), 718–726. [Google Scholar] [CrossRef]
  22. Mahfuz-Ur-Rahman, A.M.; Islam, M.R.; Muttaqi, K.M.; Rahman, M.A.; Sutanto, D. An advanced modulation technique for transformerless grid connected inverter circuits used in solar photovoltaic systems. IEEE Trans. Ind. Electron. 2022, 70, 3878–3887. [Google Scholar] [CrossRef]
  23. Fuentes, C.D.; Müller, M.; Bernet, S.; Kouro, S. SiC-MOSFET or Si-IGBT: Comparison of design and key characteristics of a 690 V grid-tied industrial two-level voltage source converter. Energies 2021, 14, 3054. [Google Scholar] [CrossRef]
  24. Sen, S. Medium voltage extreme fast charger based on novel medium voltage SiC power devices. The University of Texas at Austin. Dissertation Presented to the Faculty of the Graduate School of The University of Texas at Austin in Partial Fulfillment of the Requirements for the Degree of Doctor of Philosophy, Austin, TX, USA. 2021. Available online: https://repositories.lib.utexas.edu/items/020d17a0-6acc-4537-acc1-6b016e0a4cec (accessed on 1 August 2023).
  25. Jalan, R.; Gaur, C.; Pandey, J.P. Analysis of Harmonic Reduction Using An Intelligent Control Active Filter in A Solar Grid with Variable Load. SSRG Int. J. Electr. Electron. Eng. 2024, 11, 212–222. [Google Scholar] [CrossRef]
  26. Morsli, A.; Tlemçani, A.; Krama, A.; Abbadi, A.; Zellouma, L.; Nouri, H. Applying the Direct Power Control Strategy in a Shunt Active Filter by Exploiting the Solar Photovoltaic Energy as a Continuous Source. Nonlinear Dyn. Syst. Theory 2020, 20, 410–424. [Google Scholar]
  27. Barva, A.; Joshi, S. Comparative Analysis of Passive, Active, and Hybrid Active Filters for Power Quality Improvement in Grid-Connected Photovoltaic System. In Proceedings of the 2023 7th International Conference on Computer Applications in Electrical Engineering-Recent Advances (CERA), Roorkee, India, 27–29 October 2023; pp. 1–6. [Google Scholar] [CrossRef]
  28. Benedicte, M.; Moses, P. Design of Hybrid Active Power Filters (HAPFs) for Grid-Connected Photovoltaic Systems Using Modified p-q theory. In Proceedings of the 2022 IEEE PES/IAS PowerAfrica, Kigali, Rwanda, 22–26 August 2022; pp. 1–5. [Google Scholar] [CrossRef]
  29. Boopathi, R.; Indragandhi, V. Enhancement of power quality in grid-connected systems using a predictive direct power controlled based PV-interfaced with multilevel inverter shunt active power filter. Sci. Rep. 2025, 15, 7967. [Google Scholar] [CrossRef]
  30. Da Silva, R.P.B.; Quadros, R.; Shaker, H.R.; da Silva, L.C.P. Effects of mixed electronic loads on the electrical energy systems considering different loading conditions with focus on power quality and billing issues. Appl. Energy 2020, 277, 1155–1158. [Google Scholar] [CrossRef]
  31. Adak, S.; Cangi, H.; Eid, B.; Yilmaz, A.S. Developed analytical expression for current harmonic distortion of the PV system’s inverter about the solar irradiance and temperature. Electr. Eng. 2021, 103, 697–704. [Google Scholar] [CrossRef]
  32. Kalair, A.; Abas, N.; Kalair, A.R.; Saleem, Z.; Khan, N. Review of harmonic analysis, modeling and mitigation techniques. Renew. Sustain. Energy Rev. 2017, 78, 1152–1187. [Google Scholar] [CrossRef]
  33. Ashok, S.; Thiruvengadom, S. Harmonics in distribution system of an educational institution. Power Qual. 1998, 98, 145–150. [Google Scholar] [CrossRef]
  34. Suhara, E.M.; Jasmin, E.A.; Sangeetha, N. Analysis of harmonics in an educational institution and active filter design for mitigation. In Proceedings of the 2011 IEEE Recent Advances in Intelligent Computational Systems, Trivandrum, India, 22–24 September 2011; pp. 819–822. [Google Scholar]
  35. Nasrul, N.; Firmansyah, F. Harmonics Impact a Rising Due to Loading and Solution ETAP using the Distribution Substation Transformer 160 kVA at Education and Training Unit in PT PLN. Int. J. Adv. Sci. Eng. Inf. Technol. 2015, 5, 469–474. [Google Scholar] [CrossRef]
  36. Diaz, M.C.; Viveros Mira, M.; Quispe, E.C.; Castrillón, R.; Lasso, A.; Vidal, J.R. A Methodology to Analyze Significant Energy Uses and Energy Consumption for Improving Energy Performance in Higher Education Buildings. Int. J. Energy Econ. Policy 2023, 13, 636–649. [Google Scholar] [CrossRef]
  37. Alawasa, K.M.; Al-Odienat, A.I. Harmonics assessment and analysis at low voltage networks—Case study: Mutah University campus (Engineering building). In Proceedings of the 2017 10th Jordanian International Electrical and Electronics Engineering Conference (JIEEEC), Amman, Jordan, 16–17 May 2017; pp. 1–6. [Google Scholar] [CrossRef]
  38. Priyadharshini, A.S.; Devarajan, N.; Anitt, R. Survey of Harmonics in Non-Linear Loads Survey of Harmonics in Non-Linear Loads. Int. J. Recent Technol. Eng. 2012, 1, 45–50. [Google Scholar]
  39. Papadopoulos, T.A.; Christoforidis, G.C.; Chatzisavvas, K.C.; Papagiannis, G.K. Harmonic level measurements and analysis at higher education buildings. In Proceedings of the 8th Mediterranean Conference on Power Generation, Transmission, Distribution and Energy Conversion (MEDPOWER 2012), Cagliari, Italy, 1–3 October 2012; pp. 1–6. [Google Scholar] [CrossRef]
  40. Dolara, A.; Leva, S. Power Quality and Harmonic Analysis of End User Devices. Energies 2012, 5, 5453–5466. [Google Scholar] [CrossRef]
  41. Michalec, Ł.; Jasiński, M.; Sikorski, T.; Leonowicz, Z.; Jasiński, Ł.; Suresh, V. Impact of Harmonic Currents of Nonlinear Loads on Power Quality of a Low Voltage Network–Review and Case Study. Energies 2021, 14, 3665. [Google Scholar] [CrossRef]
  42. IEEE Std 519-2014; (Revision of IEEE Std 519-1992). IEEE Recommended Practice and Requirements for Harmonic Control in Electric Power Systems. IEEE: New York, NY, USA, 2014. Available online: www.ieee.org (accessed on 1 August 2024). [CrossRef]
  43. IEEE Std 1159-1995; IEEE Recommended Practice for Monitoring Electric Power Quality. IEEE: New York, NY, USA, 1994.
  44. Singh, Y.; Singh, B.; Mishra, S. Multifunctional Control for PV-Integrated Battery Energy Storage System With Improved Power Quality. IEEE Trans. Ind. Appl. 2020, 56, 6835–6845. [Google Scholar] [CrossRef]
  45. Kalla, U.K.; Kaushik, H.; Singh, B.; Kumar, S. Adaptive Control of Voltage Source Converter Based Scheme for Power Quality Improved Grid-Interactive Solar PV–Battery System. IEEE Trans. Ind. Appl. 2020, 56, 787–799. [Google Scholar] [CrossRef]
  46. Zahedi, A. Maximizing solar PV energy penetration using energy storage technology. Renew. Sustain. Energy Rev. 2011, 15, 866–870. [Google Scholar] [CrossRef]
  47. Das, C.K.; Bass, O.; Mahmoud, T.S.; Kothapalli, G.; Masoum, M.A.; Mousavi, N. An optimal allocation and sizing strategy of distributed energy storage systems to improve performance of distribution networks. J. Energy Storage 2019, 26. [Google Scholar] [CrossRef]
  48. Jordehi, A. Parameter estimation of solar photovoltaic (PV) cells: A review. Renew. Sustain. Energy Rev. 2016, 61, 354–371. [Google Scholar] [CrossRef]
  49. Chong, S.E. Total harmonic distortion performance of the grid connected solar photovoltaic system at Universiti Teknikal Malaysia Melaka. Int. J. Renew. Energy Res. (IJRER) 2019, 9, 1967–1975. [Google Scholar]
Figure 1. One diode model of an ideal solar cell.
Electricity 06 00028 g001
Figure 2. Electric energy consumption on the campus.
Electricity 06 00028 g002
Figure 3. Scheme of the solar PV-tied subsystem at the north side.
Electricity 06 00028 g003
Figure 4. Solar PV energy generation for 29 and 30 October 2024.
Electricity 06 00028 g004
Scheme 1. Methodology flow chart for experimental part of this research. Source: authors.
Electricity 06 00028 sch001
Figure 5. PV currents in the north and south parking lots in TopView version3.
Electricity 06 00028 g005
Figure 6. Current subsystem stage 1 in TopView version 3.
Electricity 06 00028 g006
Figure 7. Energy consumption profile on 30 October 2023.
Electricity 06 00028 g007
Figure 8. Total solar PV generation on 30 October 2023.
Electricity 06 00028 g008
Figure 9. THDi% produced on 30 October 2023.
Electricity 06 00028 g009
Figure 10. Monthly power production averages for a 150 kWp solar PV installation.
Electricity 06 00028 g010
Figure 11. Solar PV production average during the measurement period.
Electricity 06 00028 g011
Figure 12. Waveforms of THDI current for each phase.
Electricity 06 00028 g012
Figure 13. Waveforms of THDV voltage for each phase.
Electricity 06 00028 g013
Figure 14. Single-phase diagram of the NEPLAN simulation.
Electricity 06 00028 g014
Figure 15. Voltage in parking–south side.
Electricity 06 00028 g015
Figure 16. Voltage in parking–north side.
Electricity 06 00028 g016
Table 1. Distortion limit values for individual harmonic current (Di) and total harmonic demand distortion (TDD) in current percentage (IL) (odd harmonics).
Distortion Limits on Current for Distribution Networks
120   V < V n 69   k V
Relation
I S C / I L
< 11 11 h < 17 17 h < 23 23 h < 35 h 35 TDD
< 20 * 4.0 2.0 1.5 0.6 0.3 5.0
20 < 50 7.0 3.5 2.5 1.0 0.5 8.0
50 < 100 10.0 4.5 4.0 1.5 0.7 12.0
100 < 1000 12.0 5.5 5.0 2.0 1.0 15.0
> 1000 15.0 7.0 6.0 2.5 1.4 20.0
*: The power generation equipment should operate under these current distortion Isc/IL values. Note: ISC is the minimum short-circuit triphase current available for evaluating the feasibility of the PCC. The IL is the maximum demand current in the PCC.
Table 2. Current Distortion limit values for Subtransmission levels.
Current Distortion Limits for Subtransmission
69 k V < V n 161 k V
< 20 * 2.0 1.0 0.75 0.3 0.15 2.5
20 < 50 3.5 1.75 1.25 0.5 0.25 4.0
50 < 100 5.0 2.25 2.0 0.75 0.35 6.0
100 < 1000 6.0 2.75 2.5 1.0 0.5 7.5
> 1000 7.5 3.5 3.0 1.25 0.7 10.0
*: The power generation equipment should operate under these current distortion Isc/IL values.
Table 3. Panasonic 230 W PV module characteristics from the datasheet.
ModelPanasonic 230 W
Maximum powerW (+15%/−5%)
Short circuit current (Isc)5.84
Maximum power current (Imp)5.48
Maximum power voltage (Vmp)43
Open circuit voltage (Voc)51.8
Table 4. FRONIUS solar inverter data from the datasheet.
Technical FeaturesSYMO 17.5–3 480SYMO 24.0–3 480
Max. output power17.495 W/VA23,995 W/VA
Output configuration480 V Delta + N
Frequency range (adjustable)59.3–60.5 Hz
Admissible conductor size (AC)AWG 14–AWG 6
Table 5. HT power monitor features. Power Monitor Analyzer HT PQA824.
DisplayTFT, 65,536 Colors (240 pxl) HIGH Contrast, Touch Screen
Measurements QualityCAT IV 600 V (phase—Neutral)
CAT IV 1000 V (among inputs)
Grid Power Quality and FlickerEN50160
Electric Energy QualityEN61000-4-30, Class B
Table 6. Transmission line data.
LineDistance (km)No. Lines R   ( 1 )
Ω/km
X   ( 1 )
Ω/km
R   ( 0 )
Ω/km
X   ( 0 )
Ω/km
I r Max. (High) A
B1–BT10.00610.6560.1871.8161.369125
B1–BT20.3510.6560.1871.8161.369125
B1–BT30.0910.6560.1871.8161.369125
B5–B20.3530.1280.1641.1270.647350
B5–B30.0130.1280.1641.1270.647350
B5–B40.2630.1280.1641.1270.647350
Table 7. Transformer data.
Substation S r MVA V n 1 kV V n 2 kV U kr ( 1 ) % U kr ( 0 ) % GV I r 1 ( A ) I r 2 ( A )
S/E #10.513.20.4802.32.3Dy521.87601.4
S/E #2113.20.4805.755.75Dy543.741202.8
S/E #30.813.20.4805.755.75Dy534.9962.2
TR-MR0.050.4800.2085.755.75Dyn560.1138.8
Table 8. Energy storage system data.
SAEB V r kVCosphi rI (A)Emáx kWh P out kWP kW
E0.2081.01.370.50.5
Table 9. Solar PV subsystems data and diesel generator.
Gen. U r kV S r MVA cos φ QuantityP kW
PV–PAN0.4800.0481148
PV–PAS0.4800.0481148
PV–ADMON0.4800.0481148
PV–AC0.4800.1411140
PV–EB&C0.4800.0961196
PE0.4801.0580.85-736
GB0.4800.1760.85-150
Table 10. Power flux results.
Bus NameWithout PV (OFF)+SSFV (ON)+SSFV + BESS
V (kV)V (°)V (%)V (kV)V (°)V (%)V (kV)V (°)V (%)
Bus SE#113.20.00010013.20.00010013.20.000100
Bus SE#213.20.00399.9913.20.00310013.20.003100
Bus SE#313.20.00210013.20.00210013.20.002100
Node #113.20.00010013.20.00010013.20.000100
Node #20.477−0.67699.360.478−0.41099.490.478−0.404100
Node #30.479−0.04299.870.480−0.01299.910.480−0.012100
Node #40.478−0.05299.680.478−0.05299.680.478−0.052100
Node #50.4800.0001000.480.0001000.4800.000100
Node #6------0.2080.000100
Note: SE: substation.
Disclaimer/Publisher’s Note: The statements, opinions and data contained in all publications are solely those of the individual author(s) and contributor(s) and not of MDPI and/or the editor(s). MDPI and/or the editor(s) disclaim responsibility for any injury to people or property resulting from any ideas, methods, instructions or products referred to in the content.

