Abstract
The successful integration of photovoltaic (PV) generators in cities requires careful planning that accounts for possible factors influencing their operation. Numerous authors have extensively studied these factors; however, the urban environment has its unique characteristics. This study aims to conduct a narrative review of the most common and influential urban factors that impact the operation of PV modules and explore potential mitigation strategies. Based on preliminary knowledge on the topic, a methodology was proposed according to which they are classified into two categories: those enhanced by the urban environment and those specific to it. A total of 97 studies, mostly from the last decade, were selected based on the relevance and impact criteria. Shading, soiling, and snow were analyzed in an urban context, followed by different urban-specific factors, such as the urban landscape, pollution, and the limitations of PV mounting spots, which can lead to more than 50% performance losses. The performed review also identified the key and most promising approaches for mitigation of the abovementioned factors, such as electrostatic dust cleaning and forward bias current snow removal. Furthermore, recommendations for urban landscape planning were made in the context of PV integration. This review could also be useful for designers and operators of urban PV facilities by providing them with basic guidelines for their optimization.
1. Introduction
The development of renewable energy technologies has gradually improved during the last decades, which has led to their ubiquitous application. The search for cleaner energy has also supported the process, which can help enhance humankind’s living environment. Photovoltaics have been dominating the renewables market for numerous reasons, such as their relatively easy installation, low-cost maintenance, the possibility of building integration, etc. [1]. Solar energy has been integrated into all sectors of the economy, starting from energy generation for general use, applications in the industrial [2] and agricultural [3] sectors, and, last but not least, in the administrative and domestic sectors [4,5].
Urban areas are a promising location for integrating PV generators for different reasons. One is that photovoltaics are installed on building roofs and walls, thus not taking up additional space [6]. Another option is the application of PV modules as a roof for parking sites, which creates shading for the vehicles while at the same time generating energy for nearby consumers [7]. Furthermore, the load profile of solar energy and administrative buildings is very similar, stimulating the creation of decentralized energy systems with minimal transportation losses [8].
Solar potential is known to be strongly dependent on the available solar radiation at a specific geographic region, the technology of PV panels used, their orientation in space, the application of solar trackers, etc. However, the performance of photovoltaic installations is also influenced by numerous random factors, such as weather conditions and different environmental events [9].
One of the major factors influencing photovoltaics’ performance is their temperature [10]. For example, a study in Saudi Arabia showed that at 48 °C ambient temperature, the performance of the PV modules was reduced by 22% compared with standard testing conditions [11]. On the contrary, a study in Jordan showed that the efficiency of the PV panels could be boosted by up to 14% if the modules are cooled with water [10]. Similar results were reported in [12], showing that the performance of PV thermal panels is 8% higher compared to PV modules without a water cooling system. In [13], it was shown that the power output could be improved by correcting maximum power point (MPP) tracking with appropriate coefficients, taking into account the temperature and irradiance.
Another major factor in the performance of photovoltaic installations is the occurrence of different dusting and soiling events. According to [14], soiling in the city of Madrid could create a transmittance loss of up to 5% if no artificial cleaning is applied. Similarly, in [15], it was reported that power losses in agricultural areas due to dusting could surpass 11% 36 days after cleaning; however, according to [16], this effect could be mitigated by applying hydrophobic nanocoatings.
Other more or less random factors influencing PV generation include the relative humidity of the air [17], wind speed [18], cloudiness [19], fog [20], snow [21], shading [22], wildfires [23,24], etc.
On the other hand, the urban environment has specific characteristics, which may impact the abovementioned factors in either direction. For example, a known phenomenon in large cities is the so-called urban heat island, increasing environmental temperatures by up to 5 °C. It is caused by the large volumes of asphalt, concrete, and other building materials and the limited vegetation [25]. On the contrary, [26] reported that PV and especially PV thermal installations can reduce the impact of the urban heat island by up to 0.2 °C during daytime and by up to 0.3 °C during nighttime.
Another influential factor in the urban environment is shading caused by nearby high-rise buildings and other artificial objects [27]. Similarly, air pollution in urban areas may decrease the available solar radiation and increase the soiling ratio [28]. Furthermore, cities often have large populations of birds that may additionally influence the soiling ratio [29]. The urban environment also adds some specific factors, such as limited PV installation sites (roofs, walls, etc.) [30], the difficulties with their maintenance [31], etc. The abovementioned shows that while the continuous integration of photovoltaics in urban areas is important for modern society, some specific factors are observed that should be considered to ensure the optimal design, implementation, and exploitation of PV installations. In other words, to support the efficient application of photovoltaics in city areas, it is important to answer the question “Which are the key factors that influence the performance of PV installations in the urban environment and what options exist for their mitigation?“.
Numerous previous review studies exist that deal with the application of photovoltaic energy under different circumstances. They analyze the performance of PV technologies from various perspectives, such as different architectures [32], application of cooling techniques [33], application in residential areas [34], etc. Furthermore, some analyze the impact of influential factors on PV performance [9], while others analyze the impact of PV installations on the environment [35]. Nevertheless, our initial study could not identify review articles that summarize the impact of all major urban environment factors on photovoltaic systems, i.e., a research gap can be identified.
This study aims to review the key factors influencing the performance of photovoltaic installations located in an urban environment and possible approaches for their mitigation. The paper is organized in the following way. Section 2 presents a preliminary study of the available review papers and describes the proposed methodology for conducting this study. Section 3 reviews the factors that are enhanced by the urban environment, and Section 4 reviews the urban-specific factors. Finally, in Section 5, concluding remarks and recommendations are made.
2. Substantiation and Methodology of the Study
As was already mentioned in the introduction, we could not identify any previous review articles that summarize the impact of all major urban environment factors on photovoltaic systems. To account for the state of the art on the problem, a preliminary study was conducted in the Scopus database. We selected several keyword combinations to identify previous studies, which were chosen based on the following logic:
- -
- “photovoltaic efficiency factors”—this keyword combination is expected to return general studies investigating factors affecting the efficiency of photovoltaic installations.
- -
- “photovoltaic shading”—considering shading is a major factor in the urban environment, so this keyword combination is expected to return studies dealing with the impact of shading.
- -
- “photovoltaic soiling”—similarly, this keyword combination is expected to return studies dealing with the impact of soiling.
- -
- “photovoltaic urban environment”—this keyword combination is expected to return studies that are more focused on the main topic of this review, i.e., the impact of the urban environment on photovoltaic installations.
- -
- “photovoltaic urban factors”—this last keyword combination is expected to return studies focused on urban factors that impact photovoltaic installations.
The abovementioned keyword combinations were searched within “Articles titles, Abstracts, Keywords” of the Scopus database, with the results limited to the last 10 years. Furthermore, to identify review articles, an additional filter was applied under the “Document type” category, which limits the results to “Review”. The results from this preliminary study are summarized in Table 1. It can be seen that almost 20,000 articles have investigated the influence of different factors, such as shading and soiling, on the operation of photovoltaic modules. By November 2024, fewer than 1200 articles were specifically aimed at the application of photovoltaics in an urban environment. Out of them, only 35 and 21 were review articles identified, respectively, with the keywords “photovoltaic urban environment” and “photovoltaic urban factors”.

Table 1.
A summary of research and review articles in the Scopus database from 2015 to November 2024.
To better understand the scope of the review articles, they were thoroughly analyzed and divided into different categories depending on their main focus (Table 2). It can be seen that even though these articles were identified with the “urban” keyword included, most of them do not focus specifically on the urban environment:
Table 2.
A summary of the main focus of the identified review articles from the last 10 years.
- Nine of them review different aspects of the application of urban photovoltaics, their effects, and their potential for society;
- Four of them review the application of PV hybrid systems in an urban environment;
- One of them reviews different approaches for forecasting PV power in an urban environment.
It can be seen that a limited number of review articles exist that deal with the urban environment. Furthermore, very few of them analyze and summarize the impact of the urban environment on the efficiency of photovoltaic installations. The abovementioned points once again indicate that a research gap exists, which this article will try to fill.
When analyzing previous studies, the following classification for the categorization of factors influencing the performance of urban photovoltaics is proposed (Figure 1):
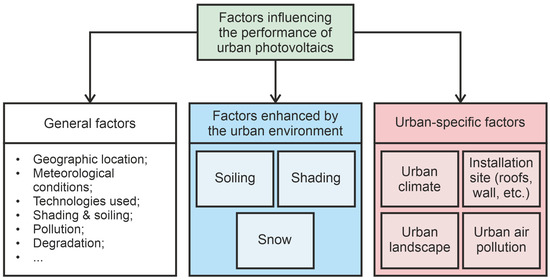
Figure 1.
Adopted classification of factors influencing the performance of urban photovoltaics.
- General factors—they are not limited to urban installations but influence the performance of all photovoltaic modules. Such factors include geographic location, meteorological conditions (temperature, wind speed, etc.), the PV technologies used, degradation, etc. This category is not the object of the current study.
- Factors enhanced by the urban environment—some of the factors belonging to the first category are additionally enhanced, which changes their impact and/or occurrence frequency. Different soiling, shading, and snowing events belong in this category.
- Urban-specific factors—the urban environment creates unique factors that influence the performance and reliability of photovoltaic installations. Such factors are the urban climate and landscape, the installation place of photovoltaics, air pollution, etc.
The second and third categories are the object of study and analyzed in the remaining sections of the paper. The main criteria that should be used in the source selection process are the following:
- -
- Relevance—the analyzed sources should closely match each specific category and subcategory to follow the adopted classification;
- -
- Impact—the articles analyzed should provide enough information to assess the impact of the factor and/or the proposed mitigation approach.
3. Factors Enhanced by the Urban Environment
3.1. Influence of Shading
When it comes to PV installations, two types of partial shading can be defined [36]:
- Static shadows caused by objects on the PV surface, such as leaves, or nearby large objects, such as hills and large buildings, that cause a relatively steady shadow for a long time;
- Dynamic (moving) shadows caused by nearby artificial objects, trees, clouds, etc.
Two main sources of shading exist in the urban environment: buildings and trees (Figure 2). High-rise buildings commonly dominate the urban landscape and create many shadows during the day, which may impact the generation of electrical energy by photovoltaics. That is why the installation spots of PV modules should be carefully chosen to limit urban shadows. For this reason, walls and roofs of buildings are the most common places [37]. Shading of the photovoltaic surface is known to cause many effects on PV installation, such as decreasing its energy output [38], increasing or decreasing the cells’ temperature, depending on the shading area [36,39], and modifying the key electrical characteristics of PV modules [40], including open-circuit voltage (Voc), short-circuit current (Isc), maximum power point voltage (Vmpp), and maximum power point current (Impp). Furthermore, prolonged exposure to hotspots accelerates the degradation processes in PV modules and shortens their lifetime [41]. Small area shading leads to low power losses; however, they could have a much more significant impact on the PV installation as a whole. The main reason for this is that the bypass diodes usually do not activate if the shaded area is less than a cell, creating a hotspot and accelerating aging. Therefore, small shadows pose a greater threat to PV installations compared to large ones, even though their impact on PV performance is almost insignificant.
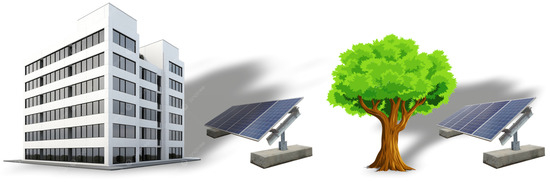
Figure 2.
Main sources of shading in the urban environment: high-rise buildings and trees.
In [42], the influence of partial tree-caused shading on inverter-operated PV strings was investigated in a geographic region with high radiation potential and high temperature (Algeria, desert climate). The results showed that while the corresponding PV installation was partially shaded, the PV efficiency decreased by up to 41% compared to a reference one. It affected the energy yield and performance ratio (PR). Shading is also known to change the temperature of PV modules. In [39], the temperature field of polycrystalline PV modules was investigated under the influence of partial cell shading in an urban environment (Bulgaria, temperate continental climate). The results showed that shading areas of 8 × 8 cm and more could create a hotspot, while the temperature gradient of the unshaded cells surpasses 50 °C. Similar findings were found in [43]. The authors reported that the module temperature could reach 130 °C due to hotspot formation under partial shading conditions.
Different passive and active methods are used to limit the impact of shading [36]. The passive approach is commonly based on the application of bypass diodes, which are nowadays integrated into most PV modules. Because of their price, usually three diodes are used per module; however, other options are also available. For example, the results obtained in [44] showed that the influence of shadows could be further mitigated if five bypass diodes were used. The authors achieved these results using a MATLAB/Simulink simulation of various scenarios with differently shaded cells, different levels of irradiation, and different numbers of bypass diodes.
Other passive approaches also reduce the impact of shading in an urban environment. One of them is based on the so-called shingled technology for PV production. According to [45], when under the influence of shading, shingled modules produce higher output power compared to conventional ones. The study, however, noted that power production greatly depends on the orientation of the shadow related to the PV module. A 20% horizontal shading ratio leads to a 20% reduction in the produced power. On the contrary, a 20% vertical shading ratio leads to a 100% reduction in the produced power. In [46], it was shown that when shingled PV modules are used with less than 50% shading, the increase in the output power is more than 10% compared to conventional modules (Figure 3). Another passive approach is based on the application of individual DC/DC optimizers for each PV module in addition to an inverter. The results in [47] showed that not all PV modules should have a DC/DC optimizer because this increases the total losses. However, a limited application of such devices could reduce the overall losses compared to an inverter-only scenario.
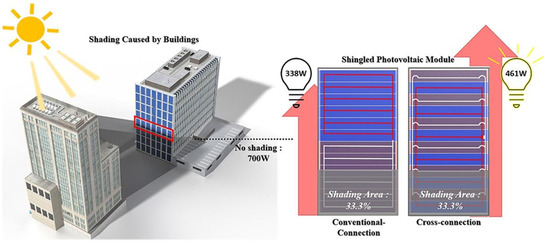
Figure 3.
The application of shingled PV modules could significantly increase energy generation in partial shading scenarios. (Reprinted with permission from Ref. [46], 2025, Elsevier).
The active approach for mitigating the influence of shadings is based on reconfiguring the electrical connections between the PV modules. For example, [48] investigated different interconnections of the PV modules using clustering algorithms to mitigate the effect of shading (Figure 4). The obtained results showed that an increase in the generated power is possible using such an approach. A similar study was conducted in [22], where four different interconnections of PV strings were studied under the influence of different partial shading scenarios. It was found that the total-cross-tied (TCT) configuration is less affected by partial shading. Similarly, in [38], five string configurations were studied. The authors proposed a hybrid configuration, which can be an alternative to TCT and SP configurations and reduce power losses without additional controllers.
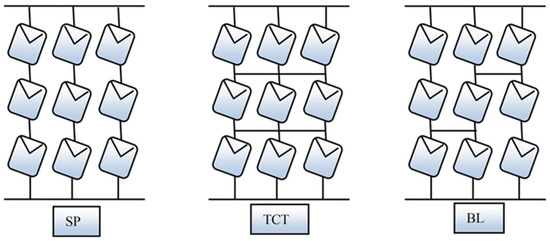
Figure 4.
Different interconnection schemes of PV strings that are capable of reducing the shading losses. (Reprinted with permission from Ref. [48], 2016, Wiley).
A summary of the performed analysis is presented in Table 3. It shows that there are several approaches for mitigating urban shading. The passive ones are based on the application of bypass diodes, the shingled PV technology, and the limited usage of DC–DC optimizers for modules, which are more likely to be shaded. Even though the first approach is the most widely used nowadays, the performed analysis allows us to conclude that the most appropriate solution in urban scenarios is the application of shingled PV modules. They could create a significant increase in the overall PV performance if used in areas with partial shading compared to a bypass diodes-only scenario. In theory, the application of individual panel optimizers could provide superior results; however, this would require very careful planning during the design time. Furthermore, periodical reevaluation and actualization would be required during exploitation to account for changes in the urban landscape (new buildings, new/higher trees, etc.). This would lead to increased maintenance costs and is therefore not appropriate for common users.
Table 3.
A summary of the reviewed articles dealing with shading of urban PV installations.
The active approaches are based on the reconfiguration of strings, but they are more difficult to plan and implement. Furthermore, they require higher qualifications of the workers implementing it. Considering the state of the art, for the time being, there is not enough evidence that active approaches are appropriate for mass users.
3.2. Influence of Soiling
Soiling of PV installations can be caused by many factors, such as polluted air from urban and industrial environments [49], nearby agricultural fields [50], birds [51], etc. It is known to strongly influence PV panels’ power loss and efficiency [52], temperature [53], degradation and system failure rate [54], etc.
In [55], they investigated soiling on urban PV installations in a desert climate. A 20% power loss was observed, caused mainly by the decrease in Isc and Impp currents. Furthermore, a 21% increase in the degradation rate was reported compared to the reference panels after three months of testing. In another study, dust samples from Islamabad and Bahawalpur (Pakistan) were analyzed after collection for 6 weeks (Figure 5a) [56]. The results showed that different sizes and dust types affect solar transmission differently. The power loss due to soiling in Islamabad surpassed 15%, and in Bahawalpur it was 25%. Furthermore, the temperature increase in the modules was affected differently. The authors concluded that proper scheduling of the cleaning cycle should account for the type of dust in the corresponding region. A similar study was presented in [57], where soiling in Babuin (Indonesia) and Perth (Australia) was compared. The authors investigated the dependency of the average transmission on the two types of soiling as a function of the dust’s density. The results showed that 0.15 mg/cm2 of dust could reduce the PV output by 5% to 8%, depending on the type of dust and the type of PV technology.
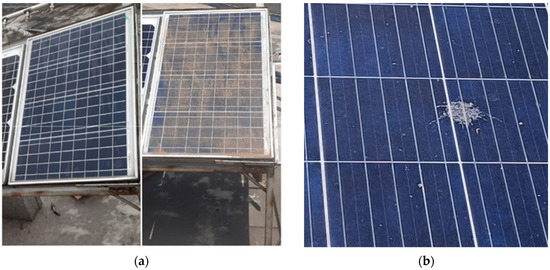
Figure 5.
Examples of different types of soiling typical in an urban environment: (a) clean and dirty modules in Islamabad, Pakistan (reprinted with permission from Ref. [56], 2023, Elsevier); (b) a PV module with bird droppings on it (reprinted with permission from Ref. [58], 2024, MDPI).
In [59], the impact of soiling on polycrystalline and monocrystalline modules in Hatay (Türkiye) was compared. The results showed that dust on PV panels reduces the average Isc by 2.7% and the average Uoc by 4.65% for polycrystalline modules. The same study for monocrystalline modules showed a 0.15% reduction in the Uoc and a reduction of 2.1% in the Isc. The authors admitted that these percentages are relatively low because the study accounted not only for sunny but also for rainy days. In [60], the impact of soiling on polycrystalline PV panels after 90 days of natural accumulation was investigated. The results showed that Isc could be reduced by up to 13% and the available power by up to 16% when the PV panel is under the influence of dust.
In [61], a methodology for investigating different types of soiling was proposed. Six dust pollutants were studied—ash, laterite, stone dust, sandy, coal powder, and cement. The results showed that laterite soiling creates the lowest power losses per g/m2, while stone dust and cement lead to the highest. Nevertheless, in most cases, soiling is caused by two or more pollutants and is therefore more complex.
Bird droppings are a different type of soiling especially common in the urban environment (Figure 5b). According to [51], they cause the highest reduction in the maximum power per weight of the sample. The measured decrease in Isc reached up to 80%; in Uoc, it went up to 36%, and the maximum power went up to 87%. A similar study was conducted in [62]. The authors showed that the power losses from bird droppings could reach up to 23%, although they also depend on the tilt angle of the photovoltaic module. The highest annual power losses (14.5%) occurred at a tilt angle of 0°, and the lowest (6–6.5%) occurred at tilt angles of 25° to 60°.
Considering the abovementioned points, the PV surface must be cleaned periodically to ensure maximal efficiency. This could happen naturally, under the influence of certain meteorological events (windstorms), or artificially. An important aspect of cleaning a PV installation is deciding when to do it. The main problem is that the price of cleaning should always be considered. This is especially important for locations with relatively low levels of soiling [63] and for building-integrated photovoltaics, where the conventional cleaning approaches are not appropriate [64].
In [63], supervised machine learning algorithms (linear regression, random forest, decision tree, multilayer perception, and neural network) were used to assess the impact of soiling on the power of PV modules. The study relied on weather and operational data of the solar installation as input features. The multilayer perception (MPL) neural network was the best-performing algorithm, which achieved an R2 value of 0.999. A similar study was conducted in [58] aimed at classifying urban PV panels as either clean or dirty using six machine learning algorithms: convolutional neural network, kNN, SVM, random forest, decision tree, and Naïve Bayes. RGB images of clean and dirty photovoltaic surfaces were used to train the models. The neural network showed optimal performance with an F1 score of 0.913. The obtained results showed that machine learning could be used to support the decision making process of when to clean a photovoltaic installation.
Different methods for cleaning PV installations exist based on water-based or waterless systems. Such methods include manual cleaning, robot-based cleaning, automated water sprinkler systems, electrostatic cleaning, UAV-based cleaning, self-cleaning coatings, etc. [31,65,66,67]. Many of them have limited applicability in urban photovoltaics. For example, manual and robot-based cleaning could be applied to roof-based photovoltaics, but they would be hard to implement for façade ones. Similarly, water sprinklers could be used on roof-based photovoltaics, but water sprinkling could be a problem for façade installations, as this would be inconvenient for passing citizens.
Nevertheless, some of the other approaches have high potential in urban PV installations. For example, in [68], an electrostatic-based low-power cleaning approach for dust removal from soiled panels was proposed. It is based on placing electrodes on top of the PV surface and supplying them with high AC voltage, which creates an electrostatic force and ejects the dust (Figure 6). In [69], a UAV-based approach was proposed where the downward thrust of a drone is used to wind off dust particles. The methodology achieved very high clearance efficiency, with up to 68% increase in the power output of PV modules; however, it cannot be directly applied to façades. Another limitation of this approach is its applicability for dust removal but not for bird droppings or dirty rain. In [70], another UAV-based system was proposed that uses an automated brush. Once again, the application of this approach is questionable when it comes to façade photovoltaics.
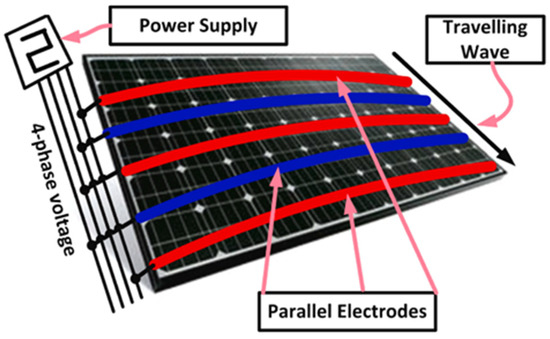
Figure 6.
The concept of electrostatic cleaning of PV panels. (Reprinted with permission from Ref. [31], 2023, Elsevier).
In [71], the influence of different coatings on the dust deposition of PV surfaces was investigated. The obtained results indicated that dust deposition is reduced and transmittance compared to bare glass panels could be increased by up to 10%. Similarly, in [72], different hydrophobic-based coatings were investigated, which achieved up to 14.3% improvement in the efficiency of PV panels, although the results varied for different days. A summary of the application of different PV cleaning approaches in an urban scenario is presented in Table 4. Considering the current state of the art, only two of them are applicable in all cases of building-integrated photovoltaics—the self-cleaning coatings and electrostatic cleaning.
Table 4.
Summary of the applicability of the PV cleaning approaches for urban PV installations.
The performed analysis in this section of the paper is summarized in Table 5. It shows that the impact of urban PV soiling strongly depends on the soiling rates and their chemical compositions. Both factors are site-specific and depend on the local industries, soils, air pollution, bird colonies, etc. This indicates that urban PV installations should be cleaned periodically to maximize their output. On the other hand, PV surface cleaning is expensive and often difficult to implement in an urban environment and therefore requires proper scheduling. Previous studies have shown that this decision making process could be successfully realized with the help of machine learning. The most promising cleaning technology applicable in all cases of building-integrated photovoltaics is electrostatic cleaning, especially if the high-voltage electrodes are integrated into the PV modules.
Table 5.
A summary of the reviewed articles dealing with soiling of urban PV installations.
3.3. Influence of Snow
Snow and ice are known to affect the performance of PV cells significantly. In [73], the influence of snow cover on the performance of different PV technologies was investigated. The obtained results showed that with the increase in snow depth, the power losses vary between 20% and 30% for 1 cm of snow and reach almost 100% when the snow depth becomes 8 cm. Snow depth above 2.5 cm leads to more than 50% power losses. Similarly, in [74], the influence of snow cover on the generation of PV panels was modeled based on deep learning and 4 million hourly readings from 40 sites. The study showed that a snow depth of 1.3 cm reduces power generation by more than 40%. The study also noted the influence of orientation, tilt, and shading. In [21], it was shown that 2 cm of snow depth reduces solar energy transmittance to 10–20% for the different wavelengths. Similarly, the PV surface’s albedo changes from 20% to 90% in the first 3 cm of snow cover. Furthermore, the authors noted the importance of selecting an appropriate method of snow removal to avoid damage to the PV surface.
However, the impact of snow on urban photovoltaics could be increased for the following reasons:
- PV rooftop modules often have a low tilt angle, which limits the ability of snow to slide down;
- Building-integrated modules installed on walls and roofs are difficult to clean of snow and ice because of limited access to them.
Two management strategies exist for roof PV snow (Figure 7): keeping the snow on the roof to avoid hazardous snow downfalls or removing it. The first option reduces the generated electrical energy, while several solutions exist for the second option. Some of them are based on applying new materials, forward bias current, appropriate roof design, etc. [75,76].
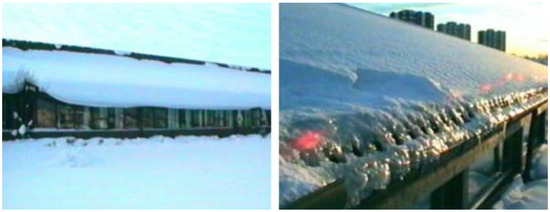
Figure 7.
A combination of snow and ice on buildings’ roofs. (Reprinted with permission from Ref. [75], 2013, Elsevier).
In [76], an approach for snow and ice cleaning of building-applied photovoltaics was investigated based on applying a controlled forward bias on PV modules. The obtained results showed that 10A of current could increase the module’s temperature by 5–6 °C, which could help the snow melt and slide. On the other hand, after evaluating different snow removal methods from a low-angle rooftop PV installation, [77] concluded that neither the passive methods (application of appropriate surface coatings) nor the active forward bias electrical heating methods were enough without additional interventions. On the other hand, in [78], two approaches for melting the snow were compared (Figure 8). In the first approach, a panel with a heater was used, and the second approach was based on reverse current. The results showed that the two approaches had approximately the same snow melting rates and cleared the PV modules’ surfaces after 35 min.
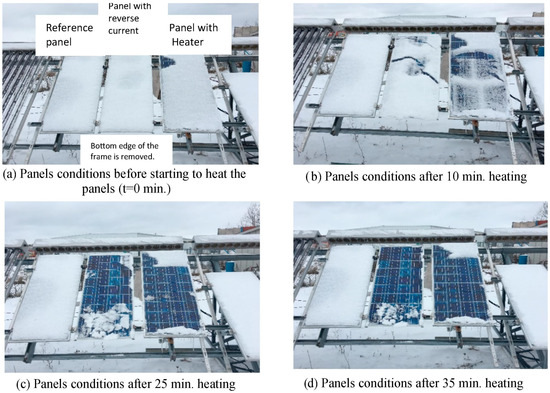
Figure 8.
The impact of reverse current on PV snow melting. (Reprinted with permission from Ref. [78], 2018, Elsevier).
In [79], a domino-like snow removal strategy was proposed, which utilizes the electricity obtained by the already uncovered (from snow) PV modules via string reconfiguration to melt the snow on the covered modules (Figure 9). The obtained result showed that the concept is operational at −14.8 °C, 248 W·m−2 solar radiation, and 27° usable inclination.
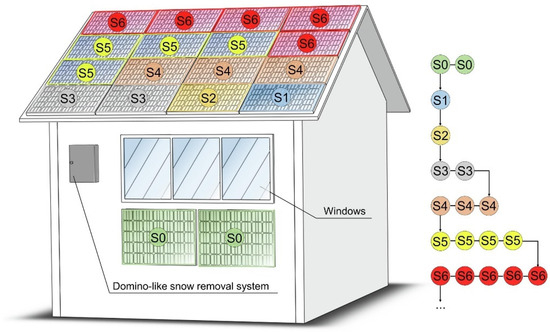
Figure 9.
A domino-like snow removal strategy proposed in Zheng et al. (Reprinted with permission from Ref. [79], 2023, Elsevier).
Different approaches were evaluated in [75] based on novel material surface solutions, such as low-friction coatings, self-heating materials, self-cleaning coatings, etc. A hydrodynamic surface coating was also investigated in [80] to determine its ability to effectively slide down snow; however, it was found that there are no advantages to using such coatings for clearing PV surfaces of snow. A more recent study showed that hydrophilic and hydrophobic coatings decrease snow accumulation to a greater extent compared to an uncoated scenario, even though no noticeable changes in PV generation were observed [81].
The results of the performed analysis are summarized in Table 6. They show that snow can significantly reduce the power generation of PV modules if it is not removed. However, cleaning could be difficult to implement for building-integrated photovoltaics. Once again, passive and active approaches exist for dealing with this problem. Passive methods rely on the application of novel coating materials, but their efficiency is still arguable. The active approaches rely on different schemes for applying forward bias current, although they are only applicable when the negative temperatures are not far from 0 °C. Furthermore, risks from snow sliding exist, which could harm nearby people and infrastructure. To summarize, considering the state of the art of snow removal technologies, the obvious winner in terms of efficiency and feasibility is the forward bias current. It is applicable in all PV building-integration scenarios when there is a limited amount of snow cover, and it can be easily implemented by the inverters. In case of deep snow cover, only manual removal is applicable; however, this situation can only occur with rooftop photovoltaics, while the façade ones do not suffer from such impacts in most cases.
Table 6.
A summary of the reviewed articles dealing with the impact of snow on urban PV installations.
4. Urban-Specific Factors
As mentioned earlier, urban-specific factors can be classified into several categories:
- -
- The urban climate—it is well-known that the urban environment is dominated by significant amounts of concrete and asphalt, and it usually has limited vegetation. For this reason, the temperatures are usually up to 5 °C higher than in the city’s surroundings. Furthermore, high-rise buildings commonly reduce the wind speed, which also affects the cooling capabilities of PV panels.
- -
- The urban installation sites—land in cities is commonly quite expensive; for this reason, urban photovoltaics are commonly integrated as a part of the buildings, mostly as rooftop and façade ones. This creates many limitations, such as making access to them more difficult, which affects the maintenance costs.
- -
- The urban landscape—it is dominated by high-rise buildings and, eventually, skyscrapers, which might create significant shadows in the surrounding areas. As a result, the performance of PV installations might be additionally influenced if the landscape and the city development plan are not taken into consideration during design.
- -
- The urban pollution—the urban lifestyle, city planning, industry, transport, etc. commonly lead to additional pollution in the form of smog and dust particles. On the one hand, this could affect the direct solar radiation that reaches photovoltaic facilities, and, on the other hand, it could create additional soiling on the PV surface.
Nevertheless, it should be understood that the impact of the above categories cannot be analyzed independently because they contribute to the effects of each other.
Previous studies have shown that the urban environment influences the efficiency of PV installations. For example, the performance of numerous urban, suburban, and rural PV installations in the Netherlands (Europe) was evaluated in [82]. The analysis showed that the PV performance ratio (PR) in an urban environment is lower by approximately 3% in comparison to a rural environment. Similarly, in [83], the key factors influencing PV output in urban areas were investigated for Mexico City (North America). As such, the attenuation of solar radiation, the different spectral distributions leading to more diffuse radiation, the higher urban ambient temperature, and the lower wind speed were listed. A reduction in the PV output by up to 20% was reported in the urban environment compared to the rural one. Another study [84] investigated the influence of microclimate conditions in the small Swedish city of Luleå on the performance of façade-mounted PV panels. The results showed that PV conditions and performance greatly depend on the local characteristics (nearby buildings, etc.), which should always be accounted for. Furthermore, the study concluded that for northern countries, façade photovoltaics are preferable because of the lower sun azimuth. In general, the influence of the urban climate could have a different impact on PV performance depending on the geographic region and climate zone. Furthermore, often, this factor is mixed with the influence of other factors, and it is therefore difficult to assess its individual impact.
Other studies have further investigated the impact of the urban landscape, which has specific characteristics (Figure 10). The influence of buildings’ height and positioning on the output power of PV modules in the Chinese city of Yichang (Hubei Province) was investigated in [85]. It was concluded that reducing the low-rise buildings ratio (LBR), i.e., increasing the number of high-rise buildings, is likely to increase rooftop exposure to sunlight. On the contrary, an increase in LBR decreases shadows but may also decrease aggregate sunlight exposure. In another study, the influence of different urban factors on the output of building PV installations in the conditions of China was investigated; factors included the place of installation (rooftop, south/west façade), the height of the building, and the surrounding buildings where the PV facility is placed [86]. The authors generated numerous random 3D models of residential buildings in order to evaluate their solar energy potential. The study concluded that the average façade installation rates depend on the height of the target building and that of the nearby building in the corresponding direction. These parameters were found to be the most influential for the geographic location and urban landscape of China. To summarize, the most influential factor affecting PV energy production in the urban environment is the height of buildings. In locations where higher buildings dominate the landscape, façade photovoltaics could have a higher share by taking the top parts of the buildings. On the other hand, cities with lower height of the buildings allow for an increase in the share of rooftop installations.
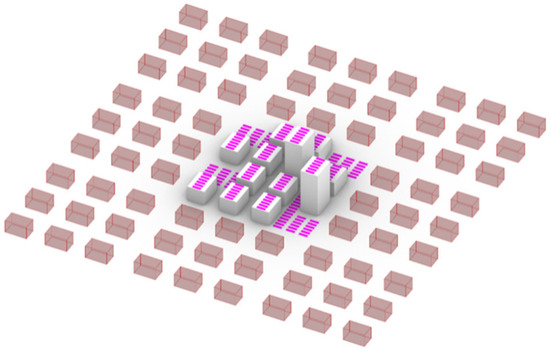
Figure 10.
The urban landscape and the created limitations on PV placement. (Reprinted with permission from Ref. [85], 2024, MDPI).
Another unique characteristic of the urban environment is the limited spots for mounting photovoltaics, such as buildings’ roofs, walls, and parking lots (Figure 11). For example, in [87], the difference between gravel and green PV rooftop installation was investigated. The results showed that the green roof could provide up to 32% more incident irradiance to the PV module. However, the urban landscape is still dominated by conventional roofs and not by green ones. The performance of conventional and green roofs was also compared in [88]. This time, the study results showed that conventional roofs outperform green ones in cold weather.
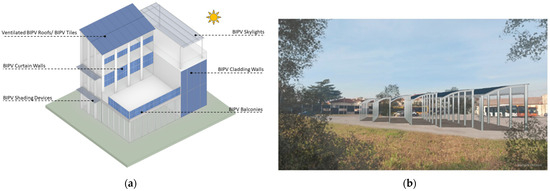
Figure 11.
Possible applications of photovoltaics in an urban environment: (a) building-integrated systems (reprinted with permission from Ref. [30], 2022, MDPI); (b) parking sites (reprinted with permission from Ref. [89], 2024, MDPI).
Similar experiments were organized in [90], where the influence of two environmental factors (temperature and relative humidity) on different types of urban PV installations was investigated. The performance of rooftop, parking shed, and ground-based panels was compared to find that their losses were 0.82%, 5.41%, and 27.95%, respectively. Such differences are the result of a combination of factors, such as additional shading, different levels of wind speed, etc., yet they give the necessary background for recommendations.
The type of mounting of the building-integrated PV (BIPV) also influences the performance of PV panels. In [91], the temperature regime of PV modules was investigated when operating under ventilated and insulated conditions. The results obtained for Denmark showed that the ventilated modules could have up to 20 °C lower temperatures in comparison to insulated ones. Such differences could lead to a significant decrease in PV performance for the insulated case. Similar studies in Switzerland were conducted in [92]; however, this time, the performance decrease was also investigated. It was shown that the power reduction is approximately 0.43%/°C in both insulated and ventilated cases for glass/backsheet modules. However, power reduction could be decreased to 0.37%/°C for glass/glass insulated modules. These observations allow us to conclude that glass/glass technology is preferred when it comes to building-integrated insulated modules. Another important observation is that the geographic location should also be considered. In countries with hot climates, the additional increase in module temperature could be mitigated with the use of ventilated BIPV. On the other hand, in northern countries, where improved insulation properties should be ensured, insulated glass/glass modules could be considered.
Other studies have investigated the influence of panel orientation in the urban context. The performance of wall-mounted PV panels in the Iranian city of Tabriz was the object of study in [93]. Their power output was compared with reference PV modules with an azimuth of 0° and a tilt angle of 25°. The results showed that wall-mounted panels facing south produce 59% less energy when compared with the reference ones, while the reduction for west- and east-oriented panels is 62% and 72%, respectively. A more thorough investigation of wall-mounted panels on high-rise buildings was performed in [37], accounting for eight azimuths. The authors concluded that the optimal vertical façade orientations for PV applications in Malaysia are east, west, southeast, and southwest. These results can be explained by the higher incident irradiance as well as the geographic latitude, which is near the equator. The study also showed that rooftop photovoltaics have a better performance ratio when compared to wall-based ones. This conclusion can be extended to any geographic location near the equatorial line where the sun azimuth is high, i.e., at such locations, façade photovoltaics are expected to have more limited applicability.
A different commonly observed factor in urban areas is smog or air pollution. It is typically caused by ozone and differently sized particles (PM2.5, PM10) [94,95]. In addition to the typical sources of dust, such as agricultural activities, bare soil, deserts, open mines, quarries, etc., the urban environment also adds pollutants from the industry and transport sectors, construction sites, the domestic sector, and others (Figure 12). In [95], PV power loss due to haze in a total of 16 worldwide cities (Delhi, Ulan Bator, Singapore, Shanghai, Pristina, Mexico City, Manama, Los Angeles, London, Kolkata, Kampala, Jakarta, Hanoi, Dhaka, Bogota, Beijing, and Addis Ababa) was investigated. The results showed that Singapore and Bogota have lower relative insulation loss (approximately 2%) and Delhi has the highest, reaching up to 12%. This can be explained by cultural and lifestyle differences, as well as the technological development of the specific location, which adds a unique segment to this factor.
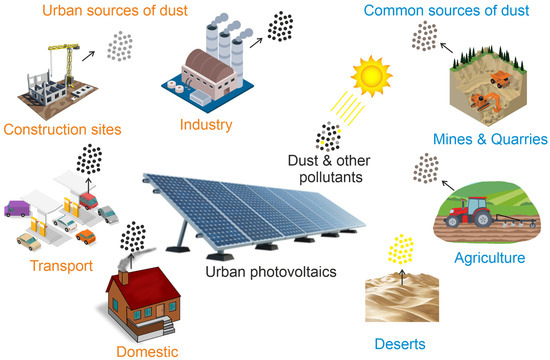
Figure 12.
Different sources of air pollution in the urban environment.
The influence of PM2.5 and PM10 on the generation of PV energy was also investigated in [96] for two locations in the Republic of Korea. The results showed that 15 µg/m3 of PM2.5 reduces PV power generation to 85–90%, and 91 µg/m3 reduces it to 78–84%. Similarly, 30 µg/m3 of PM10 reduces PV generation to 83–85%, and 330 µg/m3 reduces it to 72–74%. In [97], the influence of PM2.5 in Hong Kong on the performance of PV modules was investigated. The results showed that for the different months of the year, the reduction in the irradiation is within 1.72–4.16% if PM2.5 is within the range of 12.1 to 35.4 µg/m3. Furthermore, this reduces the PV yield from 0.5% to 3.8%, depending on the technology used. Another study investigated the influence of different air pollutants (SO2, NO2, PM2.5, PM10, CO, and O3) on solar radiation in China [20]. The results showed that the average global solar radiation (AGSR) reduction varies between 18.66% in situations with slight pollution and 45.58% in situations with dangerously high pollution. The authors also showed the reduction of the clearness index as a function of the relative air quality index (RAQI). The abovementioned points show that regional urban pollution is a factor that should be considered in short- and medium-term planning. It depends on the local culture, industry, and lifestyle, and it can be changed only by implementing appropriate long-term government policies.
A summary of the performed analysis is presented in Table 7. It can be seen that the urban environment significantly impacts the performance, exploitation, and power generation of photovoltaic parks in mostly negatively ways. The urban heat island, higher shading probability, air pollution created by human activity, and limitations in PV mounting spots influence their performance and limit their optimal application. Most of these urban-specific factors cannot be mitigated and therefore should be carefully considered during the design and exploitation phases of PV installations. Their influence varies widely and depends on geographic location, local climate, cultural differences, etc. Therefore, to obtain a realistic assessment of the impact of the urban environment on specific photovoltaic installations, site-specific experiments or simulations are required.
Table 7.
A summary of the reviewed articles dealing with urban-specific factors influencing the performance of PV installations.
The investigated studies showed that for the efficient application of building-integrated photovoltaics, the geographic location should be considered. For example, in northern countries, it is recommended to concentrate on façade installations, as this will increase the cumulative produced energy. On the other hand, urban photovoltaics located near the equator provide more energy from rooftop installations, which is easily explained by the higher sun azimuth. This also means that if urban PV energy output should be maximized in a certain city/country, the national/regional government should adopt appropriate city planning strategies.
One thing that should also be considered, however, is the application of energy storage devices. When batteries are available for temporarily storing photovoltaic energy, it is worth maximizing generation according to the abovementioned recommendations. However, for grid-connected installations without energy storage, it might be better to generate more energy during peak energy consumption hours when its price is higher, leading to better financial results. So, another secondary factor that should be accounted for is the local energy price policy and the typical regional load profile. Obviously, for optimizing the PV performance ratio, batteries are required.
5. Conclusions
Various factors, such as geographic latitude, climate conditions, landscape, etc., influence the performance of PV installations. However, when it comes to urban photovoltaics, some of the abovementioned factors are further enhanced, and additional ones are introduced. This review analyzes the most common and influential urban factors that affect the operation of PV modules and the available practices for their mitigation. The influence of shading, soiling, snow cover, and other challenges for PV operators in the urban environment is thoroughly discussed in this paper. Different urban-specific factors are also analyzed, such as the urban heat island, urban landscape, urban pollution, and the specifics of building-integrated photovoltaics. Numerous passive and active approaches are discussed, which allow for mitigating the impact of the urban environment.
The key conclusions from the performed review can be summarized as follows:
- -
- Currently, the optimal approach for dealing with urban shading is the application of shingled photovoltaics. Limited application of DC/DC optimizers is also possible; however, their positioning should be periodically reevaluated following the changing urban landscape.
- -
- The most promising soiling mitigation approach for BIPV is electrostatic cleaning; however, this would require manufacturing PV modules with integrated high-voltage electrodes. The application of drone/robot cleaning is possible for rooftop installations; however, it still has limited usage for façade ones.
- -
- The optimal snow removal approach for urban PV installation is the application of forward bias current. For situations with deep snow and very low temperatures, only manual removal is applicable.
- -
- The geographic region is important when choosing the specific urban photovoltaic technology. For northern countries, it is recommended to concentrate on façade glass/glass installations, especially for landscapes with higher buildings. On the other hand, cities that are closer to the equatorial line should concentrate on ventilated BIPV, mostly rooftop.
- -
- Local urban pollution is a factor that should be considered in short- and medium-term planning. Its mitigation can only be based on appropriate long-term government policies.
The identified problems and the recommendations made in this review have some limitations. While they were based on studies on a wide range of geographic regions and different climate zones, they cannot account for all possible circumstances. Therefore, more accurate information regarding the optimal configuration and performance of urban photovoltaics can only be obtained via experimental and simulation studies for a specific geographic location.
The analysis performed in this comprehensive review could be useful for researchers and designers dealing with urban PV systems, as well as operators of such facilities. The obtained results allow us to identify several promising topics for future investigations, such as possibilities for the integration of electrostatic-based soiling cleaning systems within PV modules, the application of unmanned aerial vehicles for cleaning vertically placed PV surfaces, as well as studies in the field of urban planning aimed at optimizing the urban landscape for the integration of renewable energy sources.
Author Contributions
Conceptualization, B.I.E.; methodology, B.I.E.; validation, K.G.G.-E. and B.I.E.; formal analysis, K.G.G.-E.; data curation, B.I.E.; writing—original draft preparation, K.G.G.-E., D.T.T. and B.I.E.; writing—review and editing, B.I.E.; visualization, K.G.G.-E.; supervision, B.I.E.; project administration, B.I.E.; funding acquisition, B.I.E. All authors have read and agreed to the published version of the manuscript.
Funding
This study is financed by the European Union—NextGenerationEU through the National Recovery and Resilience Plan of the Republic of Bulgaria, project No BG-RRP-2.013-0001.
Data Availability Statement
Not applicable.
Conflicts of Interest
The authors declare no conflicts of interest.
References
- Pillai, D.S.; Shabunko, V.; Krishna, A. A comprehensive review on building integrated photovoltaic systems: Emphasis to technological advancements, outdoor testing, and predictive maintenance. Renew. Sustain. Energy Rev. 2022, 156, 111946. [Google Scholar] [CrossRef]
- Mekhilef, S.; Saidur, R.; Safari, A. A review on solar energy use in industries. Renew. Sustain. Energy Rev. 2011, 15, 1777–1790. [Google Scholar] [CrossRef]
- Pascaris, A.S.; Schelly, C.; Burnham, L.; Pearce, J.M. Integrating solar energy with agriculture: Industry perspectives on the market, community, and socio-political dimensions of agrivoltaics. Energy Res. Soc. Sci. 2021, 75, 102023. [Google Scholar] [CrossRef]
- Beloev, H.; Stoyanov, I.; Iliev, T. Good Practices in Implementing Energy Efficiency Measures in “Angel Kanchev” University of Ruse. In Proceedings of the 2022 8th International Conference on Energy Efficiency and Agricultural Engineering (EE&AE), Ruse, Bulgaria, 30 June–2 July 2022; IEEE: Piscataway, NJ, USA, 2022; pp. 1–4. [Google Scholar] [CrossRef]
- Deng, G.; Newton, P. Assessing the impact of solar PV on domestic electricity consumption: Exploring the prospect of rebound effects. Energy Policy 2017, 110, 313–324. [Google Scholar] [CrossRef]
- Panagiotidou, M.; Brito, M.C.; Hamza, K.; Jasieniak, J.J.; Zhou, J. Prospects of photovoltaic rooftops, walls and windows at a city to building scale. Sol. Energy 2021, 230, 675–687. [Google Scholar] [CrossRef]
- Iringová, A.; Kovačic, M. Design and optimization of photovoltaic systems in a parking garage-a case study. Transp. Res. Procedia 2021, 55, 1171–1179. [Google Scholar] [CrossRef]
- Spertino, F.; Chicco, G.; Ciocia, A.; Corgnati, S.; Di Leo, P.; Raimondo, D. Electricity consumption assessment and PV system integration in grid-connected office buildings. In Proceedings of the 2015 IEEE 15th International Conference on Environment and Electrical Engineering (EEEIC), Rome, Italy, 10–13 June 2015; IEEE: Piscataway, NJ, USA, 2015; pp. 255–260. [Google Scholar] [CrossRef]
- Aslam, A.; Ahmed, N.; Qureshi, S.A.; Assadi, M.; Ahmed, N. Advances in solar PV systems; A comprehensive review of PV performance, influencing factors, and mitigation techniques. Energies 2022, 15, 7595. [Google Scholar] [CrossRef]
- Al-Odat, M.Q. Experimental study of temperature influence on the performance of PV/T cell under Jordan climate conditions. J. Ecol. Eng. 2022, 23, 80–88. [Google Scholar] [CrossRef]
- Bahaidarah, H.; Rehman, S.; Subhan, A.; Gandhidasan, P.; Baig, H. Performance evaluation of a PV module under climatic conditions of Dhahran, Saudi Arabia. Energy Explor. Exploit. 2015, 33, 909–929. [Google Scholar] [CrossRef]
- Salem Ahmed, M.; Mohamed, A.S.A.; Maghrabie, H.M. Performance evaluation of combined photovoltaic thermal water cooling system for hot climate regions. J. Sol. Energy Eng. 2019, 141, 041010. [Google Scholar] [CrossRef]
- Makrides, G.; Zinsser, B.; Phinikarides, A.; Schubert, M.; Georghiou, G.E. Temperature and thermal annealing effects on different photovoltaic technologies. Renew. Energy 2012, 43, 407–417. [Google Scholar] [CrossRef]
- Sanz-Saiz, C.; Polo, J.; Martín-Chivelet, N.; del Carmen Alonso-García, M. Soiling loss characterization for Photovoltaics in buildings: A systematic analysis for the Madrid region. J. Clean. Prod. 2022, 332, 130041. [Google Scholar] [CrossRef]
- Jung, D.; Gareis, G.H.; Staiger, A.; Salmon, A. Effects of soiling on agrivoltaic systems: Results of a case study in Chile. In Proceedings of the Agrivoltaics 2021 Conference: Connecting Agrivoltaics Worldwide, Freiburg, Germany, 14–16 June 2021; AIP Publishing: Melville, NY, USA, 2022; Volume 2635. [Google Scholar] [CrossRef]
- Ehsan, R.M.; Simon, S.P.; Sundareswaran, K.; Kumar, K.A.; Sriharsha, T. Effect of soiling on photovoltaic modules and its mitigation using hydrophobic nanocoatings. IEEE J. Photovolt. 2021, 11, 742–749. [Google Scholar] [CrossRef]
- Tripathi, A.K.; Ray, S.; Aruna, M.; Prasad, S. Evaluation of solar PV panel performance under humid atmosphere. Mater. Today Proc. 2021, 45, 5916–5920. [Google Scholar] [CrossRef]
- Zhe, L.W.; Irwan, Y.M.; Irwanto, M.; Amelia, A.R.; Safwati, I. Influence of wind speed on the performance of photovoltaic panel. Indones. J. Electr. Eng. Comput. Sci. 2019, 15, 62. [Google Scholar] [CrossRef]
- Chrobak, P.; Skovajsa, J.; Zalesak, M. Effect of cloudiness on the production of electricity by photovoltaic panels. In Proceedings of the 20th International Conference on Circuits, Systems, Communications and Computers, Corfu Island, Greece, 14–17 July 2016; EDP Sciences: Les Ulis, France, 2016; Volume 76, p. 02010. [Google Scholar] [CrossRef]
- Zhao, Q.; Yao, W.; Zhang, C.; Wang, X.; Wang, Y. Study on the influence of fog and haze on solar radiation based on scattering-weakening effect. Renew. Energy 2019, 134, 178–185. [Google Scholar] [CrossRef]
- Andenæs, E.; Jelle, B.P.; Ramlo, K.; Kolås, T.; Selj, J.; Foss, S.E. The influence of snow and ice coverage on the energy generation from photovoltaic solar cells. Sol. Energy 2018, 159, 318–328. [Google Scholar] [CrossRef]
- Saiprakash, C.; Mohapatra, A.; Nayak, B.; Ghatak, S.R. Analysis of partial shading effect on energy output of different solar PV array configurations. Mater. Today Proc. 2021, 39, 1905–1909. [Google Scholar] [CrossRef]
- Ford, E.; Peters, I.M.; Hoex, B. Quantifying the impact of wildfire smoke on solar photovoltaic generation in Australia. iScience 2024, 27, 108611. [Google Scholar] [CrossRef]
- Gilletly, S.D.; Jackson, N.D.; Staid, A. Quantifying wildfire-induced impacts to photovoltaic energy production in the Western United States. In Proceedings of the 2021 IEEE 48th Photovoltaic Specialists Conference (PVSC), Fort Lauderdale, FL, USA, 20–25 June 2021; IEEE: Piscataway, NJ, USA, 2021; pp. 1619–1625. [Google Scholar] [CrossRef]
- Mohajerani, A.; Bakaric, J.; Jeffrey-Bailey, T. The urban heat island effect, its causes, and mitigation, with reference to the thermal properties of asphalt concrete. J. Environ. Manag. 2017, 197, 522–538. [Google Scholar] [CrossRef]
- Masson, V.; Bonhomme, M.; Salagnac, J.L.; Briottet, X.; Lemonsu, A. Solar panels reduce both global warming and urban heat island. Front. Environ. Sci. 2014, 2, 14. [Google Scholar] [CrossRef]
- Ye, Y.; Zhu, R.; Yan, J.; Lu, L.; Wong, M.S.; Luo, W.; Chen, M.; Zhang, F.; You, L.; Wang, Y.; et al. Planning the installation of building-integrated photovoltaic shading devices: A GIS-based spatiotemporal analysis and optimization approach. Renew. Energy 2023, 216, 119084. [Google Scholar] [CrossRef]
- Song, Z.; Liu, J.; Yang, H. Air pollution and soiling implications for solar photovoltaic power generation: A comprehensive review. Appl. Energy 2021, 298, 117247. [Google Scholar] [CrossRef]
- Swart, A.J.; Hertzog, P.E. Analyzing the impact of pigeon droppings on the output performance of a Pico solar system. NeuroQuantology 2022, 20, 2704. [Google Scholar]
- Chen, T.; An, Y.; Heng, C.K. A Review of Building-Integrated Photovoltaics in Singapore: Status, Barriers, and Prospects. Sustainability 2022, 14, 10160. [Google Scholar] [CrossRef]
- Khalid, H.M.; Rafique, Z.; Muyeen, S.M.; Raqeeb, A.; Said, Z.; Saidur, R.; Sopian, K. Dust accumulation and aggregation on PV panels: An integrated survey on impacts, mathematical models, cleaning mechanisms, and possible sustainable solution. Sol. Energy 2023, 251, 261–285. [Google Scholar] [CrossRef]
- Vodapally, S.N.; Ali, M.H. A Comprehensive Review of Solar Photovoltaic (PV) Technologies, Architecture, and Its Applications to Improved Efficiency. Energies 2023, 16, 319. [Google Scholar] [CrossRef]
- Sato, D.; Yamada, N. Review of photovoltaic module cooling methods and performance evaluation of the radiative cooling method. Renew. Sustain. Energy Rev. 2019, 104, 151–166. [Google Scholar] [CrossRef]
- Leloux, J.; Narvarte, L.; Trebosc, D. Review of the performance of residential PV systems in France. Renew. Sustain. Energy Rev. 2012, 16, 1369–1376. [Google Scholar] [CrossRef]
- Tawalbeh, M.; Al-Othman, A.; Kafiah, F.; Abdelsalam, E.; Almomani, F.; Alkasrawi, M. Environmental impacts of solar photovoltaic systems: A critical review of recent progress and future outlook. Sci. Total Environ. 2021, 759, 143528. [Google Scholar] [CrossRef]
- Mamun, M.A.A.; Hasanuzzaman, M.; Selvaraj, J. Experimental investigation of the effect of partial shading on photovoltaic performance. IET Renew. Power Gener. 2017, 11, 912–921. [Google Scholar] [CrossRef]
- Ghazali, A.; Salleh, E.; Chin Haw, L.; Mat, S.; Sopian, K. Feasibility of a vertical photovoltaic system on a high-rise building in Malaysia: Economic evaluation. Int. J. Low-Carbon Technol. 2017, 12, 349–357. [Google Scholar] [CrossRef]
- Nayak, B.; Mohapatra, A.; Das, P. Optimal hybrid array configuration scheme to reduce mismatch losses of photovoltaic system. In Proceedings of the 2017 Second International Conference on Electrical, Computer and Communication Technologies (ICECCT), Coimbatore, India, 22–24 February 2017; IEEE: Piscataway, NJ, USA, 2017; pp. 1–7. [Google Scholar] [CrossRef]
- Evstatiev, B.; Valov, N.; Gabrovska-Evstatieva, K.; Mladenova, T.; Mihailov, N. Investigation of the Accuracy of Thermographic Inspections of Photovoltaic Modules. In Proceedings of the 2023 IEEE 29th International Symposium for Design and Technology in Electronic Packaging (SIITME), Craiova, Romania, 18–20 October 2023; IEEE: Piscataway, NJ, USA, 2023; pp. 59–64. [Google Scholar] [CrossRef]
- Fialho, L.; Melicio, R.; Mendes, V.M.F.; Figueiredo, J.; Collares-Pereira, M. Effect of shading on series solar modules: Simulation and experimental results. Procedia Technol. 2014, 17, 295–302. [Google Scholar] [CrossRef]
- Moretón, R.; Lorenzo, E.; Narvarte, L. Experimental observations on hot-spots and derived acceptance/rejection criteria. Sol. Energy 2015, 118, 28–40. [Google Scholar] [CrossRef]
- Dabou, R.; Sahouane, N.; Necaibia, A.; Mostefaoui, M.; Bouchafaa, F.; Rouabhia, A.; Ziane, A.; Bouraiou, A. Impact of partial shading and PV array power on the performance of grid connected PV station. In Proceedings of the 2017 18th International Conference on Sciences and Techniques of Automatic Control and Computer Engineering (STA), Monastir, Tunisia, 21–23 December 2017; IEEE: Piscataway, NJ, USA, 2017; pp. 476–481. [Google Scholar] [CrossRef]
- Rahman, M.M.; Hasanuzzaman, M.; Rahim, N.A. Temperature effect of photovoltaic module under partial shading operation condition. In Proceedings of the 3rd IET International Conference on Clean Energy and Technology (CEAT), Kuching, Malaysia, 24–26 November 2014; IEEE: Piscataway, NJ, USA, 2014. [Google Scholar] [CrossRef]
- Abdelaziz, G.; Hichem, H.; Chiheb, B.R.; Rached, G. Shading effect on the performance of a photovoltaic panel. In Proceedings of the 2021 IEEE 2nd International Conference on Signal, Control and Communication (SCC), Hammamet, Tunisia, 20–22 December 2021; IEEE: Piscataway, NJ, USA, 2021; pp. 208–213. [Google Scholar] [CrossRef]
- Bae, J.; Jee, H.; Park, Y.; Lee, J. Simulation-Based Shading Loss Analysis of a Shingled String for High-Density Photovoltaic Modules. Appl. Sci. 2021, 11, 11257. [Google Scholar] [CrossRef]
- Kim, J.; Bae, J.; Jeong, R.; Lee, J. Shading-loss enhancement of high-density photovoltaic shingled module for urban building applications. Sol. Energy 2025, 287, 113193. [Google Scholar] [CrossRef]
- Baumgartner, F.; Vogt, R.; Allenspach, C.A.; Carigiet, F. Performance analysis of shaded PV module power electronic systems. In Proceedings of the 38th European Photovoltaic Solar Energy Conference and Exhibition (EUPVSEC), Online, 6–10 September 2021; pp. 650–654. [Google Scholar]
- Rathinadurai Louis, J.; Shanmugham, S.; Gunasekar, K.; Atla, N.R.; Murugesan, K. Effective utilisation and efficient maximum power extraction in partially shaded photovoltaic systems using minimum-distance-average-based clustering algorithm. IET Renew. Power Gener. 2016, 10, 319–326. [Google Scholar] [CrossRef]
- Urrejola, E.; Antonanzas, J.; Ayala, P.; Salgado, M.; Ramírez-Sagner, G.; Cortés, C.; Pino, A.; Escobar, R. Effect of soiling and sunlight exposure on the performance ratio of photovoltaic technologies in Santiago, Chile. Energy Convers. Manag. 2016, 114, 338–347. [Google Scholar] [CrossRef]
- Javed, W.; Guo, B.; Figgis, B.; Aïssa, B. Dust potency in the context of solar photovoltaic (PV) soiling loss. Sol. Energy 2021, 220, 1040–1052. [Google Scholar] [CrossRef]
- Shaik, S.; Vigneshwaran, P.; Roy, A.; Kontoleon, K.J.; Mazzeo, D.; Cuce, E.; Saleel, C.A.; Alwetaishi, M.; Khan, S.A.; Gürel, A.E.; et al. analysis on the impacts of soil deposition and bird droppings on the thermal performance of photovoltaic panels. Case Stud. Therm. Eng. 2023, 48, 103128. [Google Scholar] [CrossRef]
- Kumar, E.S.; Sarkar, B.; Behera, D.K. Soiling and dust impact on the efficiency and the maximum power point in the photovoltaic modules. Int. J. Eng. Res. Technol. 2013, 2, 2. [Google Scholar]
- Sharma, S.; Malik, P.; Sinha, S. The impact of soiling on temperature and sustainable solar PV power generation: A detailed analysis. Renew. Energy 2024, 237, 121864. [Google Scholar] [CrossRef]
- Aghaei, M.; Fairbrother, A.; Gok, A.; Ahmad, S.; Kazim, S.; Lobato, K.; Oreski, G.; Reinders, A.; Schmitz, J.; Theelen, M.; et al. Review of degradation and failure phenomena in photovoltaic modules. Renew. Sustain. Energy Rev. 2022, 159, 112160. [Google Scholar] [CrossRef]
- Lasfar, S.; Haidara, F.; Mayouf, C.; Abdellahi, F.M.; Elghorba, M.; Wahid, A.; Kane, C.S.E. Study of the influence of dust deposits on photovoltaic solar panels: Case of Nouakchott. Energy Sustain. Dev. 2021, 63, 7–15. [Google Scholar] [CrossRef]
- Rashid, M.; Yousif, M.; Rashid, Z.; Muhammad, A.; Altaf, M.; Mustafa, A. Effect of dust accumulation on the performance of photovoltaic modules for different climate regions. Heliyon 2023, 9, e23069. [Google Scholar] [CrossRef]
- Tanesab, J.; Parlevliet, D.; Whale, J.; Urmee, T. The effect of dust with different morphologies on the performance degradation of photovoltaic modules. Sustain. Energy Technol. Assess. 2019, 31, 347–354. [Google Scholar] [CrossRef]
- Evstatiev, B.I.; Trifonov, D.T.; Gabrovska-Evstatieva, K.G.; Valov, N.P.; Mihailov, N.P. PV Module Soiling Detection Using Visible Spectrum Imaging and Machine Learning. Energies 2024, 17, 5238. [Google Scholar] [CrossRef]
- Sonsuz, O.; Adıgüzel, E.; Kabaoğlu, R.O.; Ersoy, A. The effect of pollution on photovoltaic panels under climate conditions in Hatay. Erzincan Univ. J. Sci. Technol. 2020, 13, 1413–1423. [Google Scholar] [CrossRef]
- Shariah, A.; Al-Ibrahim, E. Impact of Dust and Shade on Solar Panel Efficiency and Development of a Simple Method for Measuring the Impact of Dust in any Location. J. Sustain. Dev. Energy Water Environ. Syst. 2023, 11, 1110448. [Google Scholar] [CrossRef]
- Fan, S.; Wang, Y.; Cao, S.; Sun, T.; Liu, P. A novel method for analyzing the effect of dust accumulation on energy efficiency loss in photovoltaic (PV) system. Energy 2021, 234, 121112. [Google Scholar] [CrossRef]
- Sisodia, A.K.; Mathur, R.K. Impact of bird dropping deposition on solar photovoltaic module performance: A systematic study in Western Rajasthan. Environ. Sci. Pollut. Res. 2019, 26, 31119–31132. [Google Scholar] [CrossRef] [PubMed]
- Silva, L.A.C.; Ruiz, L.G.B.; Criado-Ramón, D.; Bessa, J.G.; Micheli, L.; Jiménez, M.D.C.P. Assessing the impact of soiling on photovoltaic efficiency using supervised learning techniques. Expert Syst. Appl. 2023, 231, 120816. [Google Scholar] [CrossRef]
- Umar, S.; Waqas, A.; Tanveer, W.; Shahzad, N.; Janjua, A.K.; Dehghan, M.; Qureshi, M.S.; Shakir, S. A building integrated solar PV surface-cleaning setup to optimize the electricity output of PV modules in a polluted atmosphere. Renew. Energy 2023, 216, 119122. [Google Scholar] [CrossRef]
- Khadka, N.; Bista, A.; Adhikari, B.; Shrestha, A.; Bista, D. Smart solar photovoltaic panel cleaning system. In IOP Conference Series: Earth and Environmental Science; IOP Publishing: Bristol, UK, 2020; Volume 463, p. 012121. [Google Scholar] [CrossRef]
- Khadka, N.; Bista, A.; Adhikari, B.; Shrestha, A.; Bista, D.; Adhikary, B. Current practices of solar photovoltaic panel cleaning system and future prospects of machine learning implementation. IEEE Access 2020, 8, 135948–135962. [Google Scholar] [CrossRef]
- Benyadry, S.; Halimi, M.; Khouya, A. Soiling impact and cleaning techniques for optimizing photovoltaic and concentrated solar power power production: A state-of-the-art review. Energy Environ. 2024, 35, 1637–1669. [Google Scholar] [CrossRef]
- Kawamoto, H. Electrostatic cleaning equipment for dust removal from soiled solar panels. J. Electrost. 2019, 98, 11–16. [Google Scholar] [CrossRef]
- Rehman, S.; Mohandes, M.A.; Hussein, A.E.; Alhems, L.M.; Al-Shaikhi, A. Cleaning of Photovoltaic Panels Utilizing the Downward Thrust of a Drone. Energies 2022, 15, 8159. [Google Scholar] [CrossRef]
- Sarkis, S.S.; Khanfar, L.A.; Ghabour, B.N.; Zaki, L.; Alahmed, M.; Jaradat, M.A.; Wadi, A.; Khalil, A. Novel design of a hybrid drone system for cleaning solar panels. In Proceedings of the 2022 Advances in Science and Engineering Technology International Conferences (ASET), Dubai, United Arab Emirates, 21–24 February 2022; IEEE: Piscataway, NJ, USA, 2022; pp. 1–6. [Google Scholar] [CrossRef]
- Zhao, W.; Lu, H. Self-Cleaning Performance of Super-Hydrophilic Coatings for Dust Deposition Reduction on Solar Photovoltaic Cells. Coatings 2021, 11, 1059. [Google Scholar] [CrossRef]
- El-Mahallawi, I.; Elshazly, E.; Ramadan, M.; Nasser, R.; Yasser, M.; El-Badry, S.; Elthakaby, M.; Oladinrin, O.T.; Rana, M.Q. Solar PV Panels-Self-Cleaning Coating Material for Egyptian Climatic Conditions. Sustainability 2022, 14, 11001. [Google Scholar] [CrossRef]
- Hosseini, S.; Taheri, S.; Farzaneh, M.; Taheri, H. Modeling of snow-covered photovoltaic modules. IEEE Trans. Ind. Electron. 2018, 65, 7975–7983. [Google Scholar] [CrossRef]
- Bashir, N.; Irwin, D.; Shenoy, P. DeepSnow: Modeling the impact of snow on solar generation. In Proceedings of the 7th ACM International Conference on Systems for Energy-Efficient Buildings, Cities, and Transportation, Yokohama, Japan, 18–20 November 2020; pp. 11–20. [Google Scholar] [CrossRef]
- Jelle, B.P. The challenge of removing snow downfall on photovoltaic solar cell roofs in order to maximize solar energy efficiency—Research opportunities for the future. Energy Build. 2013, 67, 334–351. [Google Scholar] [CrossRef]
- Aarseth, B.L.; Øgaard, M.B.; Zhu, J.; Strömberg, T.; Tsanakas, J.A.; Selj, J.H.K.; Marstein, E.S. Mitigating snow on rooftop PV systems for higher energy yield and safer roofs. In Proceedings of the 35th European Photovoltaic Solar Energy Conference and Exhibition, Brussels, Belgium, 24–28 September 2018; pp. 1630–1635. [Google Scholar]
- Granlund, A.; Lindh, M.; Vikberg, T.; Petersson, A.M. Evaluation of Snow Removal Methods for Rooftop Photovoltaics. In Proceedings of the 8th World Conference on Photovoltaic Energy Conversion, Milan, Italy, 26–30 September 2022; pp. 1122–1128. [Google Scholar] [CrossRef]
- Rahmatmand, A.; Harrison, S.J.; Oosthuizen, P.H. An experimental investigation of snow removal from photovoltaic solar panels by electrical heating. Sol. Energy 2018, 171, 811–826. [Google Scholar] [CrossRef]
- Zheng, J.; Liu, W.; Cui, T.; Wang, H.; Chen, F.; Gao, Y.; Fan, L.; Omer, A.A.A.; Ingenhoff, J.; Zhang, X.; et al. A novel domino-like snow removal system for roof PV arrays: Feasibility, performance, and economic benefits. Appl. Energy 2023, 333, 120554. [Google Scholar] [CrossRef]
- Andrews, R.W.; Pollard, A.; Pearce, J.M. A new method to determine the effects of hydrodynamic surface coatings on the snow shedding effectiveness of solar photovoltaic modules. Sol. Energy Mater. Sol. Cells 2013, 113, 71–78. [Google Scholar] [CrossRef]
- Barker, A.J.; Douglas, T.A.; Alberts, E.M.; IreshFernando, P.A.; George, G.W.; Maakestad, J.B.; Moores, L.C.; Saari, S.P. Influence of chemical coatings on solar panel performance and snow accumulation. Cold Reg. Sci. Technol. 2022, 201, 103598. [Google Scholar] [CrossRef]
- Moraitis, P.; Kausika, B.B.; Nortier, N.; Van Sark, W. Urban Environment and Solar PV Performance: The Case of the Netherlands. Energies 2018, 11, 1333. [Google Scholar] [CrossRef]
- Tian, W.; Wang, Y.; Ren, J.; Zhu, L. Effect of urban climate on building integrated photovoltaics performance. Energy Convers. Manag. 2007, 48, 1. [Google Scholar] [CrossRef]
- Spett, M.; Lau, K.; Rizzo, A. Urban Microclimate Impact on Vertical Building-Integrated Photovoltaic Panels. Urban Plan. 2024, 9, 8350. [Google Scholar] [CrossRef]
- Huang, Y.; Yang, Y.; Ren, H.; Ye, L.; Liu, Q. From Urban Design to Energy Sustainability: How Urban Morphology Influences Photovoltaic System Performance. Sustainability 2024, 16, 7193. [Google Scholar] [CrossRef]
- Tian, J.; Ooka, R. Evaluation of solar energy potential for residential buildings in urban environments based on a parametric approach. Sustain. Cities Soc. 2024, 106, 105350. [Google Scholar] [CrossRef]
- Lamnatou, C.; Chemisana, D. A critical analysis of factors affecting photovoltaic-green roof performance. Renew. Sustain. Energy Rev. 2015, 43, 264–280. [Google Scholar] [CrossRef]
- Nagengast, A.; Hendrickson, C.; Matthews, H.S. Variations in photovoltaic performance due to climate and low-slope roof choice. Energy Build. 2013, 64, 493–502. [Google Scholar] [CrossRef]
- Franco, A.; Lutzemberger, G.; Bevilacqua, M.G.; Quilici, F.G.; Vezzani, M. Green-Powered Electric Public Mobility: Integrating Urban and Interurban Routes—A Case Study Analysis. Electricity 2024, 5, 254–270. [Google Scholar] [CrossRef]
- Iqbal, S.; Khan, S.N.; Sajid, M.; Khan, J.; Ayaz, Y.; Waqas, A. Impact and performance efficiency analysis of grid-tied solar photovoltaic system based on installation site environmental factors. Energy Environ. 2023, 34, 2343–2363. [Google Scholar] [CrossRef]
- Andersen, N.L.; Babin, M.; Thorsteinsson, S. Experimental investigation of the temperature distribution in a BIPV façade. EPJ Photovolt. 2024, 15, 36. [Google Scholar] [CrossRef]
- Gok, A.; Ozkalay, E.; Friesen, G.; Frontini, F. The influence of operating temperature on the performance of BIPV modules. IEEE J. Photovolt. 2020, 10, 1371–1378. [Google Scholar] [CrossRef]
- Ebrahimpour, A. Using Solar Panels on Building Exterior Walls Is Not Reasonable in Dry-Cold Climates (Experimental Study). 2022; preprint, Available at SSRN 4047965. [Google Scholar] [CrossRef]
- Sadat, S.A.; Hoex, B.; Pearce, J.M. A review of the effects of haze on solar photovoltaic performance. Renew. Sustain. Energy Rev. 2022, 167, 112796. [Google Scholar] [CrossRef]
- Peters, I.M.; Karthik, S.; Liu, H.; Buonassisi, T.; Nobre, A. Urban haze and photovoltaics. Energy Environ. Sci. 2018, 11, 3043–3054. [Google Scholar] [CrossRef]
- Son, J.; Jeong, S.; Park, H.; Park, C.E. The effect of particulate matter on solar photovoltaic power generation over the Republic of Korea. Environ. Res. Lett. 2020, 15, 084004. [Google Scholar] [CrossRef]
- Song, Z.; Wang, M.; Yang, H. Quantification of the impact of fine particulate matter on solar energy resources and energy performance of different photovoltaic technologies. ACS Environ. Au 2022, 2, 275–286. [Google Scholar] [CrossRef] [PubMed]
Disclaimer/Publisher’s Note: The statements, opinions and data contained in all publications are solely those of the individual author(s) and contributor(s) and not of MDPI and/or the editor(s). MDPI and/or the editor(s) disclaim responsibility for any injury to people or property resulting from any ideas, methods, instructions or products referred to in the content. |
© 2025 by the authors. Licensee MDPI, Basel, Switzerland. This article is an open access article distributed under the terms and conditions of the Creative Commons Attribution (CC BY) license (https://creativecommons.org/licenses/by/4.0/).