Article

Improving Dynamic Security in Islanded Power Systems: Quantification of Minimum Synchronous Inertia Considering Fault-Induced Frequency Deviations

by
José Gouveia
1,
Carlos L. Moreira
1,2,* and
João A. Peças Lopes
1,2
1
CPES—INESC Technology and Science, FEUP Campus, Rua Dr. Roberto Frias, 4200-465 Porto, Portugal
2
Faculty of Engineering, University of Porto, 4200-465 Porto, Portugal
*
Author to whom correspondence should be addressed.
Electricity 2023, 4(2), 114-133; https://doi.org/10.3390/electricity4020008
Submission received: 30 December 2022 / Revised: 25 March 2023 / Accepted: 28 March 2023 / Published: 13 April 2023

Abstract

:
In isolated power systems with very high instantaneous shares of renewables, additional inertia should be used as a complementary resource to battery energy storage systems (BESSs) for improving frequency stability, which can be provided by synchronous condensers (SCs) integrated into the system. Therefore, this paper presents a methodology to infer the system dynamic security, with respect to key frequency indicators, following critical disturbances. Of particular interest is the evidence that multiple short-circuit locations should be considered as reference disturbances regarding the frequency stability in isolated power grids with high shares of renewables. Thus, an artificial neural network (ANN) structure was developed, aiming to predict the network frequency nadir and Rate of Change of Frequency (RoCoF), considering a certain operating scenario and disturbances. For the operating conditions where the system frequency indicators are violated, a methodology is proposed based on a gradient descent technique, which quantifies the minimum amount of additional synchronous inertia (SCs which need to be dispatch) that moves the system towards its dynamic security region, exploiting the trained ANN, and computing the sensitivity of its outputs with respect to the input defining the SC inertia.

1. Introduction

The large-scale integration of converter-interfaced renewable energy systems (CI-RESs) in isolated power systems is progressively reducing the share of synchronous units in the daily system operation, thus lowering the availability of power-frequency regulation capacity and synchronous inertia during certain periods [1,2]. The reduced synchronous inertia in isolated systems leads to larger frequency excursions and to a faster Rate of Change of Frequency (RoCoF) following disturbances, since the system is more prone to activate the under-frequency load shedding mechanisms, which is typically considered as a violation of dynamic security criteria [3].
In order to mitigate this issue, while allowing for more CI-RES integration, insular system operators have been implementing several solutions. In recent years, insular system operators have been installing battery energy storage systems (BESSs) to provide fast power-frequency regulation reserves [4]. Another option that has been exploited is the development of new grid codes, which require the active participation of CI-RESs in the provision of regulation services [5]. Alternatively, dynamic security assessment (DSA) algorithms have been developed with the aim of allowing an increase integration of RES without jeopardizing the system security [6].
The DSA methods intend to evaluate the dynamic security of a given dispatch scenario over several contingencies. DSA strategies have two main goals: (1) ensure that the unit commitment (UC)/economic dispatch (ED) solution is robust in terms of the system dynamic security point of view and (2) guarantee that the system dynamic security during real-time operation is not compromised due to renewable generation and/or load consumption forecasting errors during the daily operation. Following the identification of an insecure operating condition, preventive measures can be suggested to the system operator [7,8].
In the first instance, some online DSA methods resorted to performing full dynamic simulations of the entire power grid [9]. However, the long execution times and intensive computational burden associated with the numerical methods which solve its algebraic and differential equations makes them unsuitable for online applications. More recently, the emergence of machine learning-based methods, such as artificial neural networks (ANNs) or decision trees (DTs), offered alternative solutions to assess network security following network disturbances. These learning techniques are trained offline considering a wide range of operation scenarios and contingency events. Its main advantage relies on reduced computational effort to assess the network state with a minimal error margin [8,9,10,11,12].
The first DSA methods for isolated power grids were developed during the European R&D CARE project in the late 1990s, which used Crete island as a study case, having at that time a peak load exceeding 400 MW and more than 60 MW of installed wind power. Subsequent to that project, it started the MORE CARE project which aimed to produce enhanced capabilities for the CARE software [8,10]. The aim was to optimize the operation of isolated systems with increased shares of CI-RESs (mainly wind power) and providing advanced online security functions, both in preventive and corrective mode. In [7,12,13] similar DSA methodologies were proposed. All of these approaches are based on the offline training of an ANN/DT for the fast assessment of the system dynamic security. In case of insecure operating conditions, corrective measures were provided via generation redispatch.
The works presented in [7,10,12,13] addressed case studies in which the system is still operated with a considerable amount of conventional thermal-based generation. In such operating conditions, in the case of an insecure operating scenario, a simple rescheduling of the generation units could ensure the system stability. Nonetheless, such approaches are not suitable for isolated systems with high shares of CI-RESs. More recently dynamic security constrained UC approaches have been developed for low-inertia systems.
A frequency constrained Mixed Integer Linear Programming (MILP) UC formulation was presented in [14], in which linear constraints are derived explicitly to compute frequency nadir and RoCoF in the face of disturbances. In [15,16,17], a simplified model based in the system equivalent inertia, was used to derive the analytical representation of system frequency nadir, and was incorporated into a linear UC problem formulation. A frequency-constrained MILP UC was presented in [18]. This work addressed the Canary Island archipelago, considered a high integration of wind generation. The frequency assessment was performed based on a simplified single-bus model of the network. A dynamic security constrained UC was proposed in [19], with the system frequency metrics calculated throughout the swing equation, considering the network equivalent inertia. Furthermore, a BESS was considered to provide frequency regulation, whose control parameters were adjusted to provide proper dynamic frequency support, with the BESS participation in the energy arbitrage also being considered. A frequency-constrained stochastic UC problem was proposed in [20] in order to cope with the uncertainties associated with CI-RESs, where the RoCoF and frequency nadir were obtained from a simplified single-bus model of the network.
In the past, synchronous inertia did not represent a problem since there was a large availability of traditional power plants with synchronous machines (SMs). However, the large-scale integration of CI-RESs in isolated systems leads to decreasing levels of online synchronous inertia, which contributes to jeopardize the system security. Traditionally, the ED algorithms proposed in the literature did not dynamically evaluate the synchronous inertia adequacy of a dispatch result in terms of “N-1” contingency, since the non-synchronous generation represented a small part of the generation portfolio. However, the replacement of SMs for CI-RESs is bringing new challenges to system operators, where low synchronous inertia translates into rapid RoCoF, which may result in the cascading trip of online SMs, contributing also to a larger frequency decay. Indeed, a historical RoCoF of 6 Hz/s was recorded on the South Australian blackout on 28 September 2016, where the instantaneous penetration level of CI-RESs was over 50%. Additionally, regions such Ireland and Texas present a CI-RES penetration ratio exceeding 40% of the system load. In fact, synchronous inertia acts as a large dampener since it slows down the frequency dropping [6,21,22,23].
The Australian energy market operator predicted that the expected net load (actual load from which non-dispatchable wind and PV generation is subtracted) on a random day in 2030 will be significantly light, and consequently, fewer SMs will be dispatched in the network. In this sense, the predictable net load may cause a shortage of synchronous inertia, jeopardizing frequency stability, since presently a maximum RoCoF of ±0.5 Hz/s and a maximum frequency decay of 0.5 Hz are allowed. Therefore, in [6], the authors proposed a synchronous inertia constrained ED, in order to guarantee the system dynamic stability while avoiding renewables curtailment. Therefore, in case of an insecure solution of the dispatch, synchronous condensers (SCs) are scheduled. In fact, the integration of SCs in low-inertia systems increases the system dynamic security. Thus, in recent years the system operators of some low-inertia systems, such as Ireland or Great Britain, have been installing SCs in order to enhance the network stability [5,24].
Addressing in more detail the works available in the literature regarding dynamic security constrained and synchronous inertia constrained ED/UC, it is clear the proposed methodologies consider generating tripping as the reference disturbance where, in most cases, a simplified model of the network is sufficient to access the system dynamic stability metrics [3,6,14,15,16,17,18,19,20]. Nevertheless, in isolated systems, network faults tend to become the most severe frequency stability-related contingency, particularly in operating scenarios with very high (instantaneous) shares of CI-RESs. This is a direct consequence of the low residual voltages observed in the moments subsequent to a network fault that leads to significant active power dips in CI-RESs followed by active power recovery gradients which may affect frequency stability as a result of large fault-induced frequency deviations [21]. Therefore, a detailed model of the network must be considered in the dynamic simulations, in order to study its effect on faults in the grid frequency dynamics.
In such operating conditions, it was demonstrated that the installation of BESSs, operating in grid-following mode, might not be enough to contain the fast frequency dynamics, as shown in [25]. Therefore, and in order to avoid renewable generation curtailment, additional solutions should be exploited to mitigate the negative effects associated with the high shares of CI-RESs. The integration of additional synchronous inertia in such operating conditions could be used as a complementary solution to improve frequency dynamics in the face of certain disturbances. This additional inertia can be provided by SCs to be integrated in the system.
In this work, a methodology is proposed to infer the system dynamic security with respect to key frequency indicators, namely the frequency nadir and RoCoF, following critical disturbances (short-circuit events in transmission and distribution networks). Furthermore, it was demonstrated that fault-induced frequency deviations were the most severe contingency for the network dynamic stability, while generation loss could be easily contained by the fast power-frequency response usually made available at power converter interfaces existing in BESSs [21]. In the case of insecure operating conditions, preventive control actions can be suggested to be exploited by the system operator, which consists of synchronous inertia dispatch.
In a first step, extensive offline dynamic simulations of the system are performed over a wide range of possible operating scenarios aiming to create a functional knowledge database, which is then used to train an ANN structure, capable of predicting the frequency indicators (frequency nadir and RoCoF) for any network operating scenario. For the operating conditions where the system frequency indicators are violated, a methodology is proposed based on a gradient descent technique, which quantifies the minimum amount of SCs that need to be dispatched, in order to avoid the need for renewable generation curtailment, while assuring the aforementioned key frequency indicators are not violated. Other solutions involving thermal power plant redispatch and renewables curtailment could be derived. However, the core concern is to maximize renewables integration and hence SC dispatch is assumed as the preferred option to be followed. For this purpose, a methodology to determine the minimum amount of additional synchronous inertia is proposed for scenarios where frequency indicators are violated, which exploits the trained ANN by computing the sensitivity of its outputs (frequency nadir and RoCoF) with respect to the input defining the SC inertia.

2. Case Study—Description and Modelling

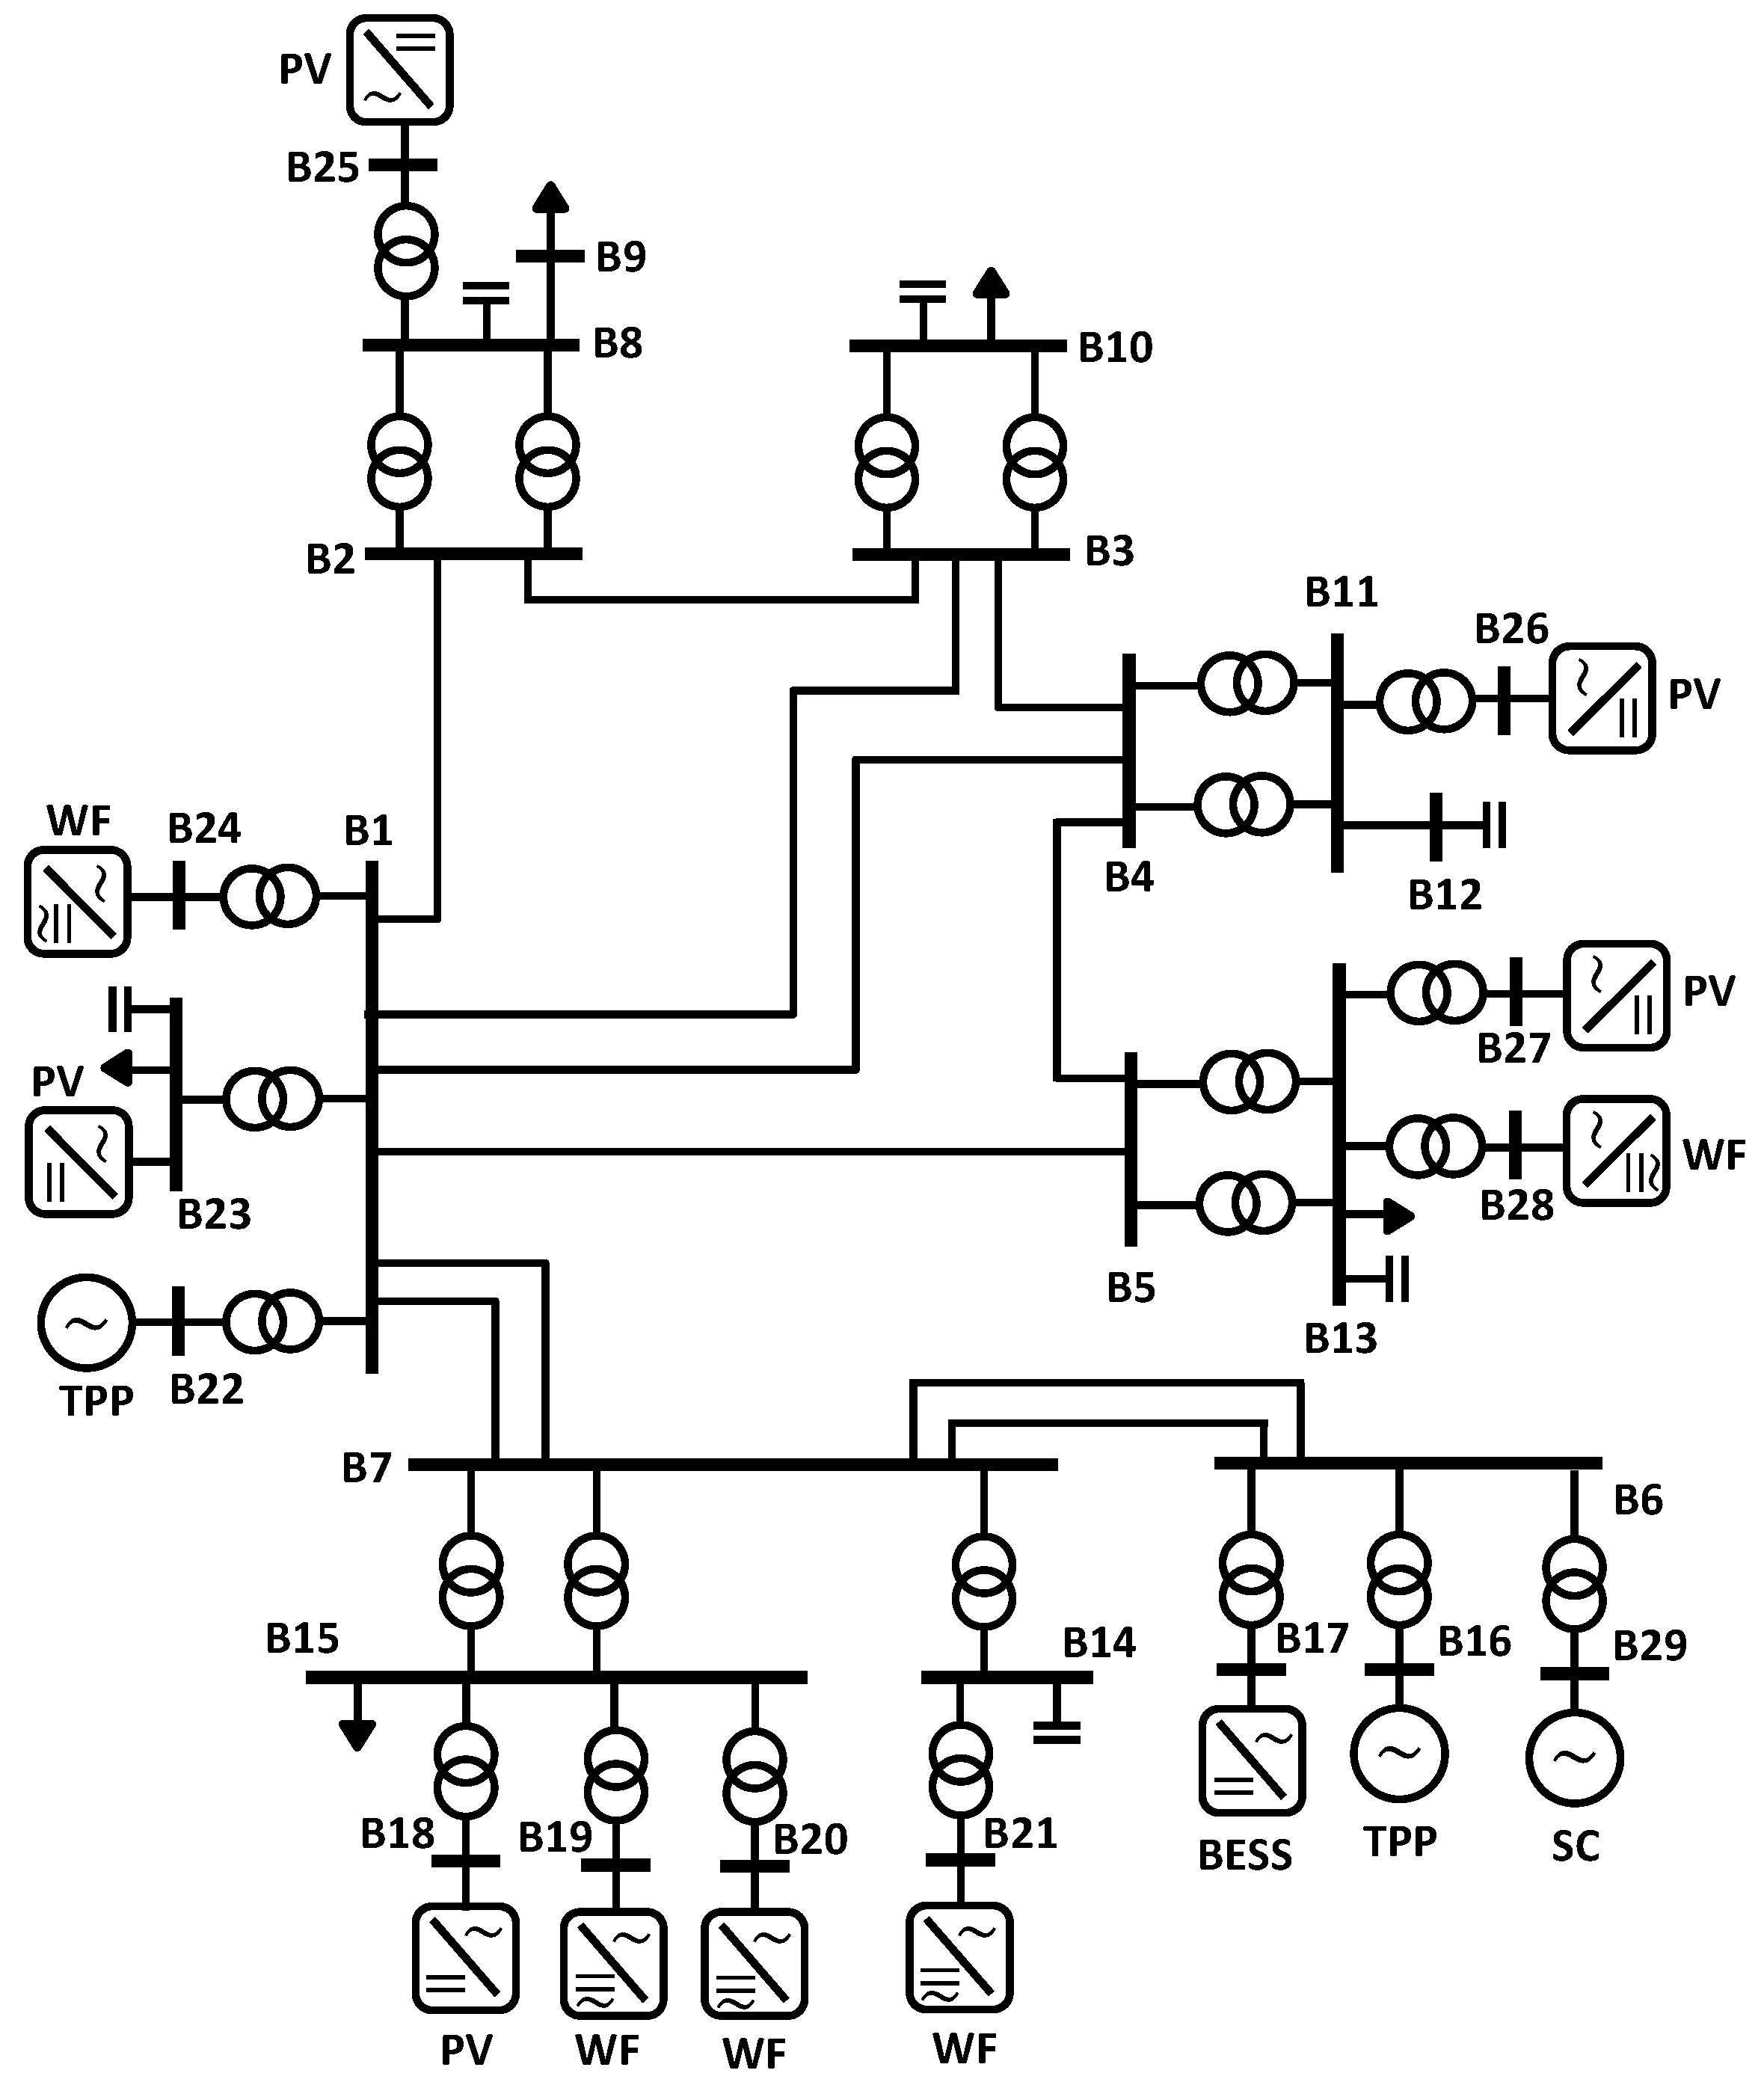
2.1. Power System Description

The electric power system of the Rhodes island considered in this study comprises a transmission infrastructure operating at 150 kV. The generation portfolio includes two thermal-based power plants (with a total generation capacity of 437.8 MW), five wind farms (with a total generation capacity of 49.15 MW) and PV generation including large- and small-scale installations (with a total generation capacity of 18.16 MW). The Rhodes power system single-line diagram is presented in Figure 1 (note that “TPP” stands for thermal power plant, while “SC” stands for synchronous condenser). It was considered that SC location will take the place within an existing TPP. Additional investigations regarding the most appropriate location of the SC with respect to the dynamic performance of the power plant can be performed, but is out of the scope of this work. The characteristics of the thermal units are presented in Table 1 (note that “S.” stands for Soroni thermal power plant, while “S.R.” stands for South Rhodes thermal power plant), including the synchronous unit’s inertia (referred to the apparent power S of each unit), as well as the merit order for the different units.

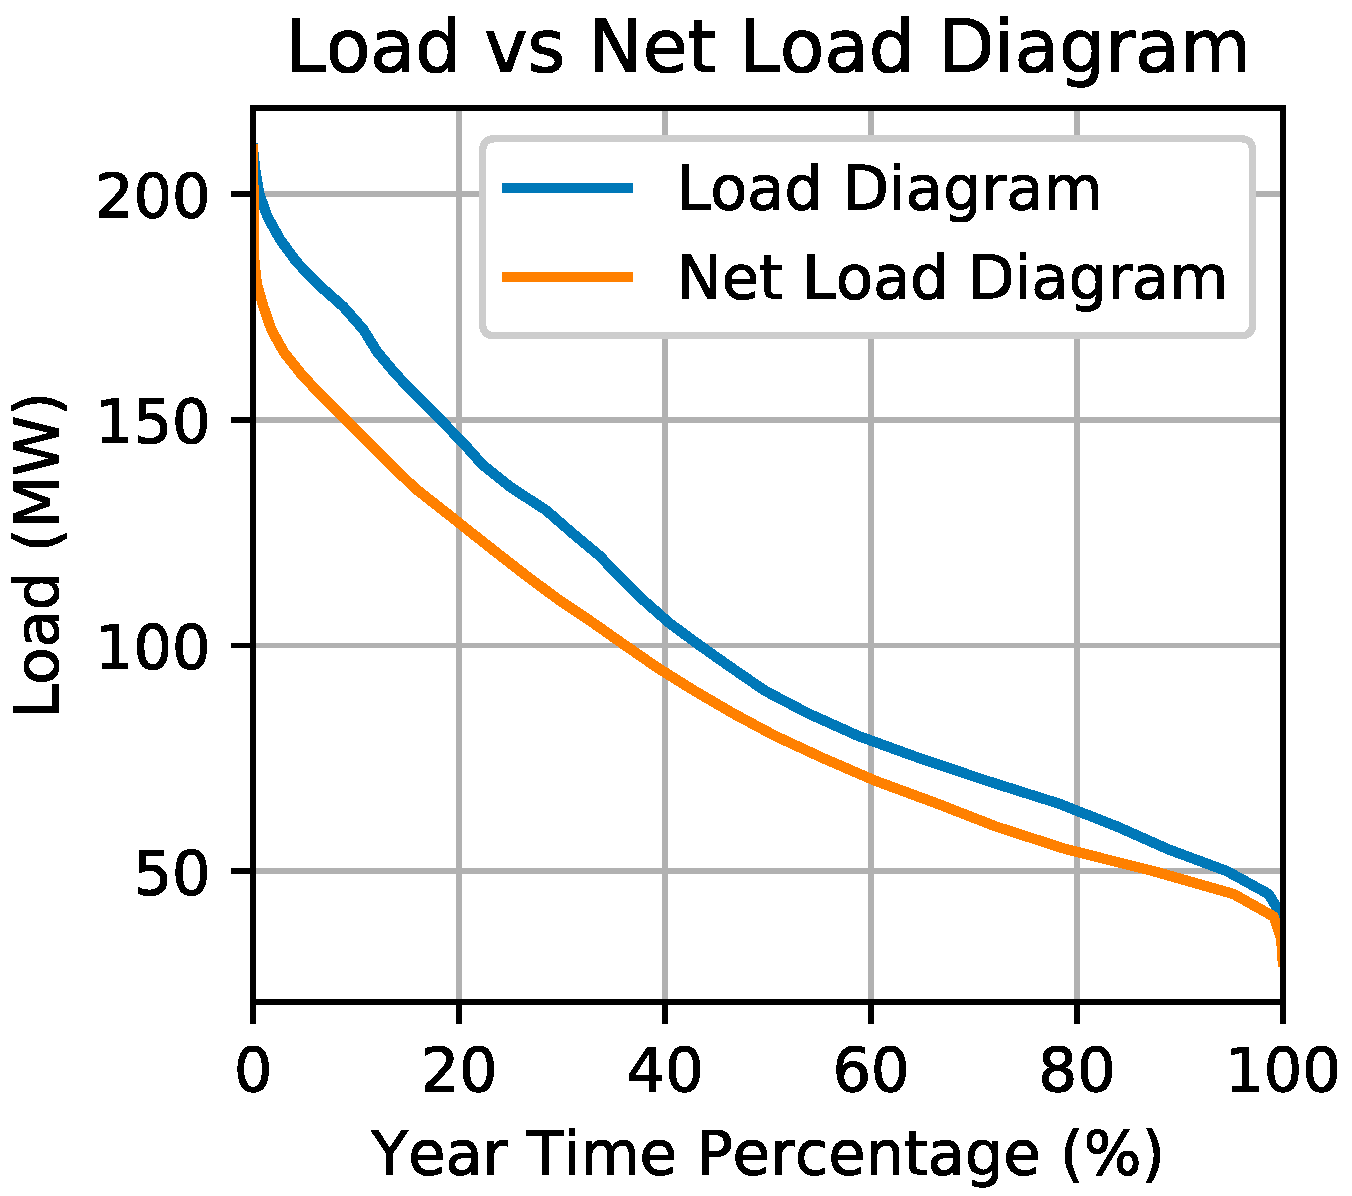
2.2. Current Operation and Prospective System Development

The load and renewable generation historical data from 2018 were provided by the local system operator. The system is characterized by a large seasonal consumption variability. The load consumption ranges from an autumn/winter valley load around 40 MW and summer peak loads of about 220 MW, with the summer peak consumption being twice the value recorded in the winter period. Furthermore, it was concluded that the Rhodes power system is currently operated with a large share of thermal-based generation, once it was verified to have a large net load during the year, as shown in the sorted annual load diagram (for total and net load) presented in Figure 2. As observed, the network is never operated with a net load lower than 30 MW. Hence, the current operating rules demand at least two thermal generation units in operation and a spinning reserve margin to cover the unplanned drop of the largest generation infeed. Regarding the dynamic security metrics, the system is considered secure if the frequency deviation does not lead to the activation of under-frequency load shedding relays, whose first activation level is set at 49.4 Hz or a frequency RoCoF lower than −2 Hz/s (a time window of 500 ms was considered for the RoCoF calculation).
Within the scope of this work and taking as reference the guidelines of the local system operator, a future planning horizon is considered with increased shares of CI-RESs as described hereafter.

2.2.1. Integration of Additional Renewable Generation

Based on Figure 1, it was verified that there is margin for renewable generation expansion (without the risk of curtailment). Therefore, this work considered the integration of an additional 30 MW of PV generation. This is in line with the local system operator’ CI-RES expansion planning, which foresees the installation of rooftop PV installations, as well as stand-alone large- and small-scale installations. Therefore, the additional 30 MW PV generation capacity was assumed to be equally shared among the three PV types of installations, hence each category accounted for 10 MW of the installed capacity. Within the three PV type installations, fault-ride through (FRT) capability with reactive current control priority during voltage sags is considered for the large-scale installations and FRT capability without reactive current injection capability for the small-scale installations. Regarding the rooftop PV installations, it is assumed they are not FRT-compliant, being disconnected from the grid following a voltage sag of 0.85 pu at their connection point.

2.2.2. Integration of a Battery Energy Storage System

In order to increase the integration of CI-RES generation, the installed BESS has an installed power capacity of 30 MW, whose power converter is operated as a grid-following unit. The BESS is intended to provide grid regulation services (for voltage and frequency), allowing the network operation with only one SM.

2.3. Power System Modelling

The dynamic model of the Rhodes power system was developed in the PSS/E software and using PSS/E library models. The thermal-based generation units and corresponding parametrization for the dynamic models were provided by the local system operator, being divided between diesel, gas and steam synchronous generators. The corresponding governing systems are DEGOV1 for the South Rhodes power plant and IEEEG1 governor model for the Soroni power plant. In terms of voltage control, these units were equipped with distinct excitation system models, including the IEEE AC5, SEXS, EXST1, IEEET1 and IEEET2. Data privacy issues precludes the presentation of the models’ parameters.
Regarding the wind and PV generation modeling, general converter models were considered. In this sense, the REGCA model was used for the renewable energy generator model, while the REECA was used for the renewable energy electrical model. These models are endowed with FRT capability, being given priority to reactive current injection during voltage sags. Relative to the post-fault active power ramp recovery, the wind generators have a 1 pu/s ramp and there is a faster post-fault active power recovery for PV installations (FRT-compliment PV installations are assumed to fully recover the pre-fault power in 100 ms). Note that the active power recovery of wind generators is slower, compared to the PV generators, to keep the mechanical stress on its components at acceptable levels. Since the PV generators have no mechanical components, its recovery time is greatly reduced [26]. The same generic converter models were considered for the BESS, also using the REPCA model for the active and reactive power control mode. A frequency/active power droop of 1% was considered, which means that the BESS will inject 1 pu of its capacity for a frequency deviation of 0.5 Hz.

3. Need for Synchronous Inertia

As previously stated, the installation of a BESS, operated as a grid-following unit, has been a common solution used by insular system operators, in order to cope with the increasing integration of CI-RESs. However, in this section it is intended to demonstrate that, in scenarios with very a high share of CI-RESs, the dispatch of additional synchronous inertia is required to comply with given frequency metrics. In such scenarios, the isolated action of the BESS is not enough to ensure the system dynamic stability. Thus, two illustrative operating scenarios were considered, representing two possible winter noon periods with a high integration of wind and PV power:
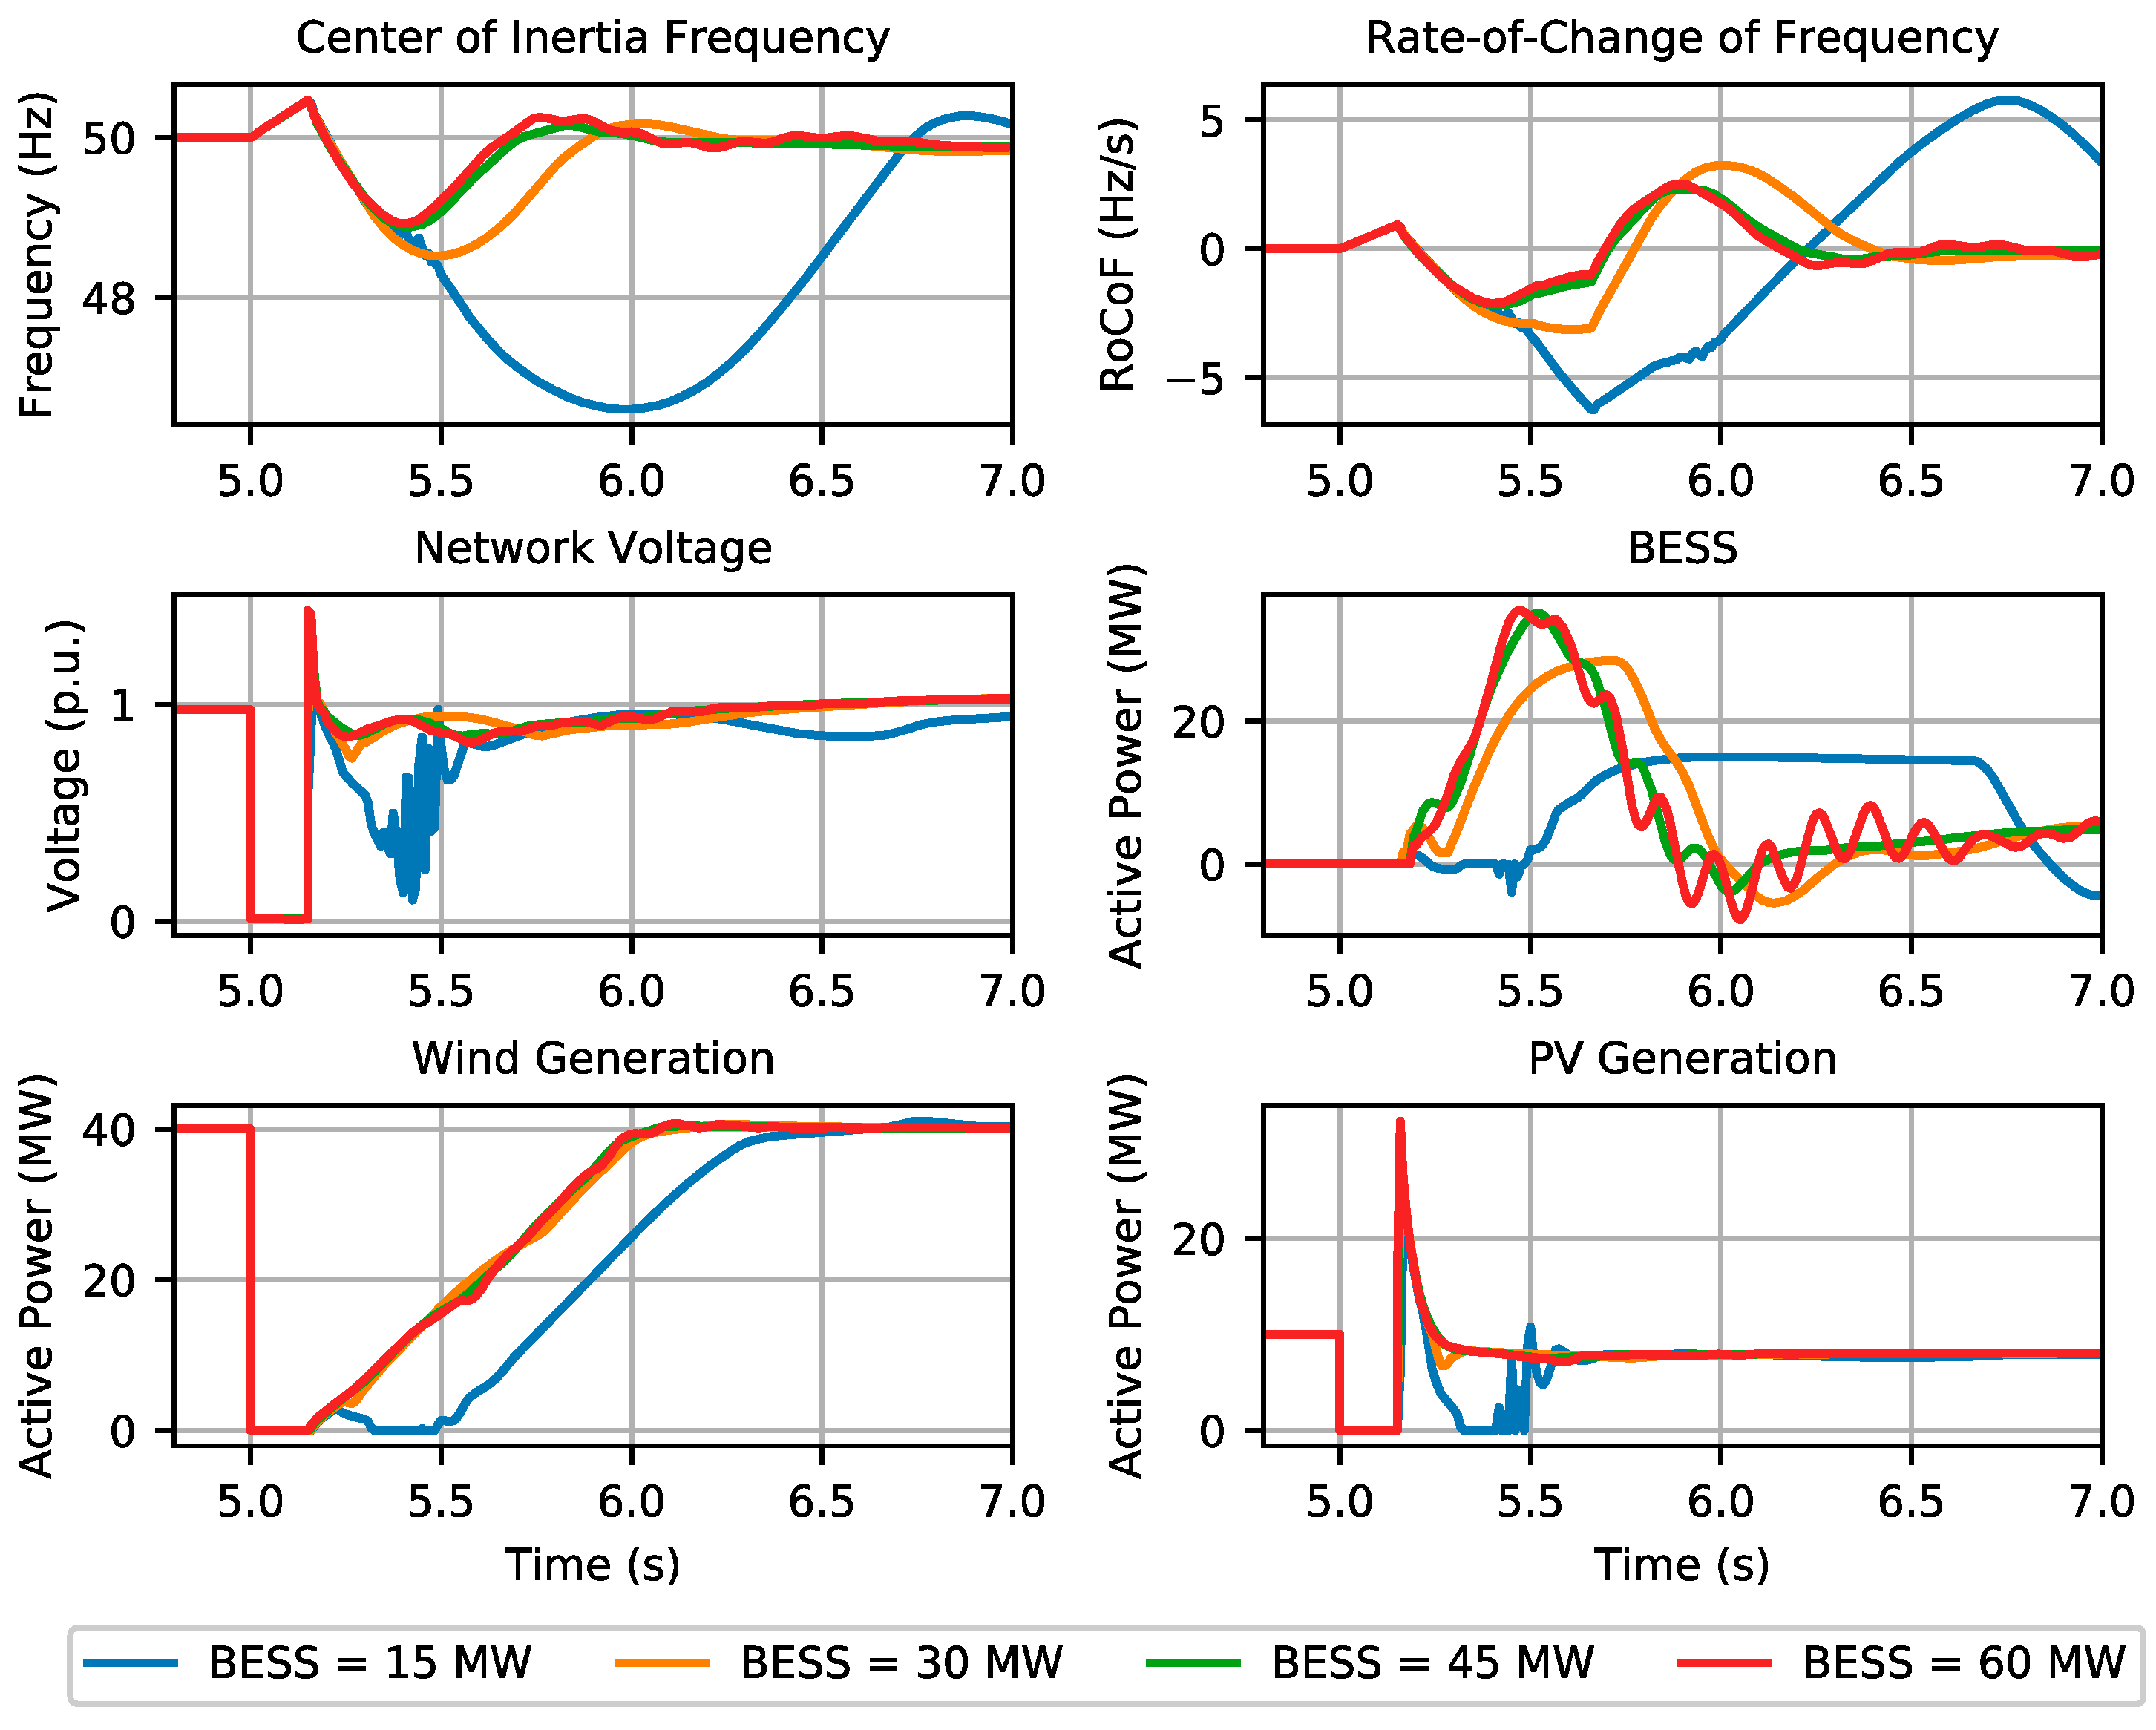
  • Operating scenario 1: the network operates with one SM, with a load consumption of 60 MW, a wind generation of 40 MW and a PV generation of 10 MW;
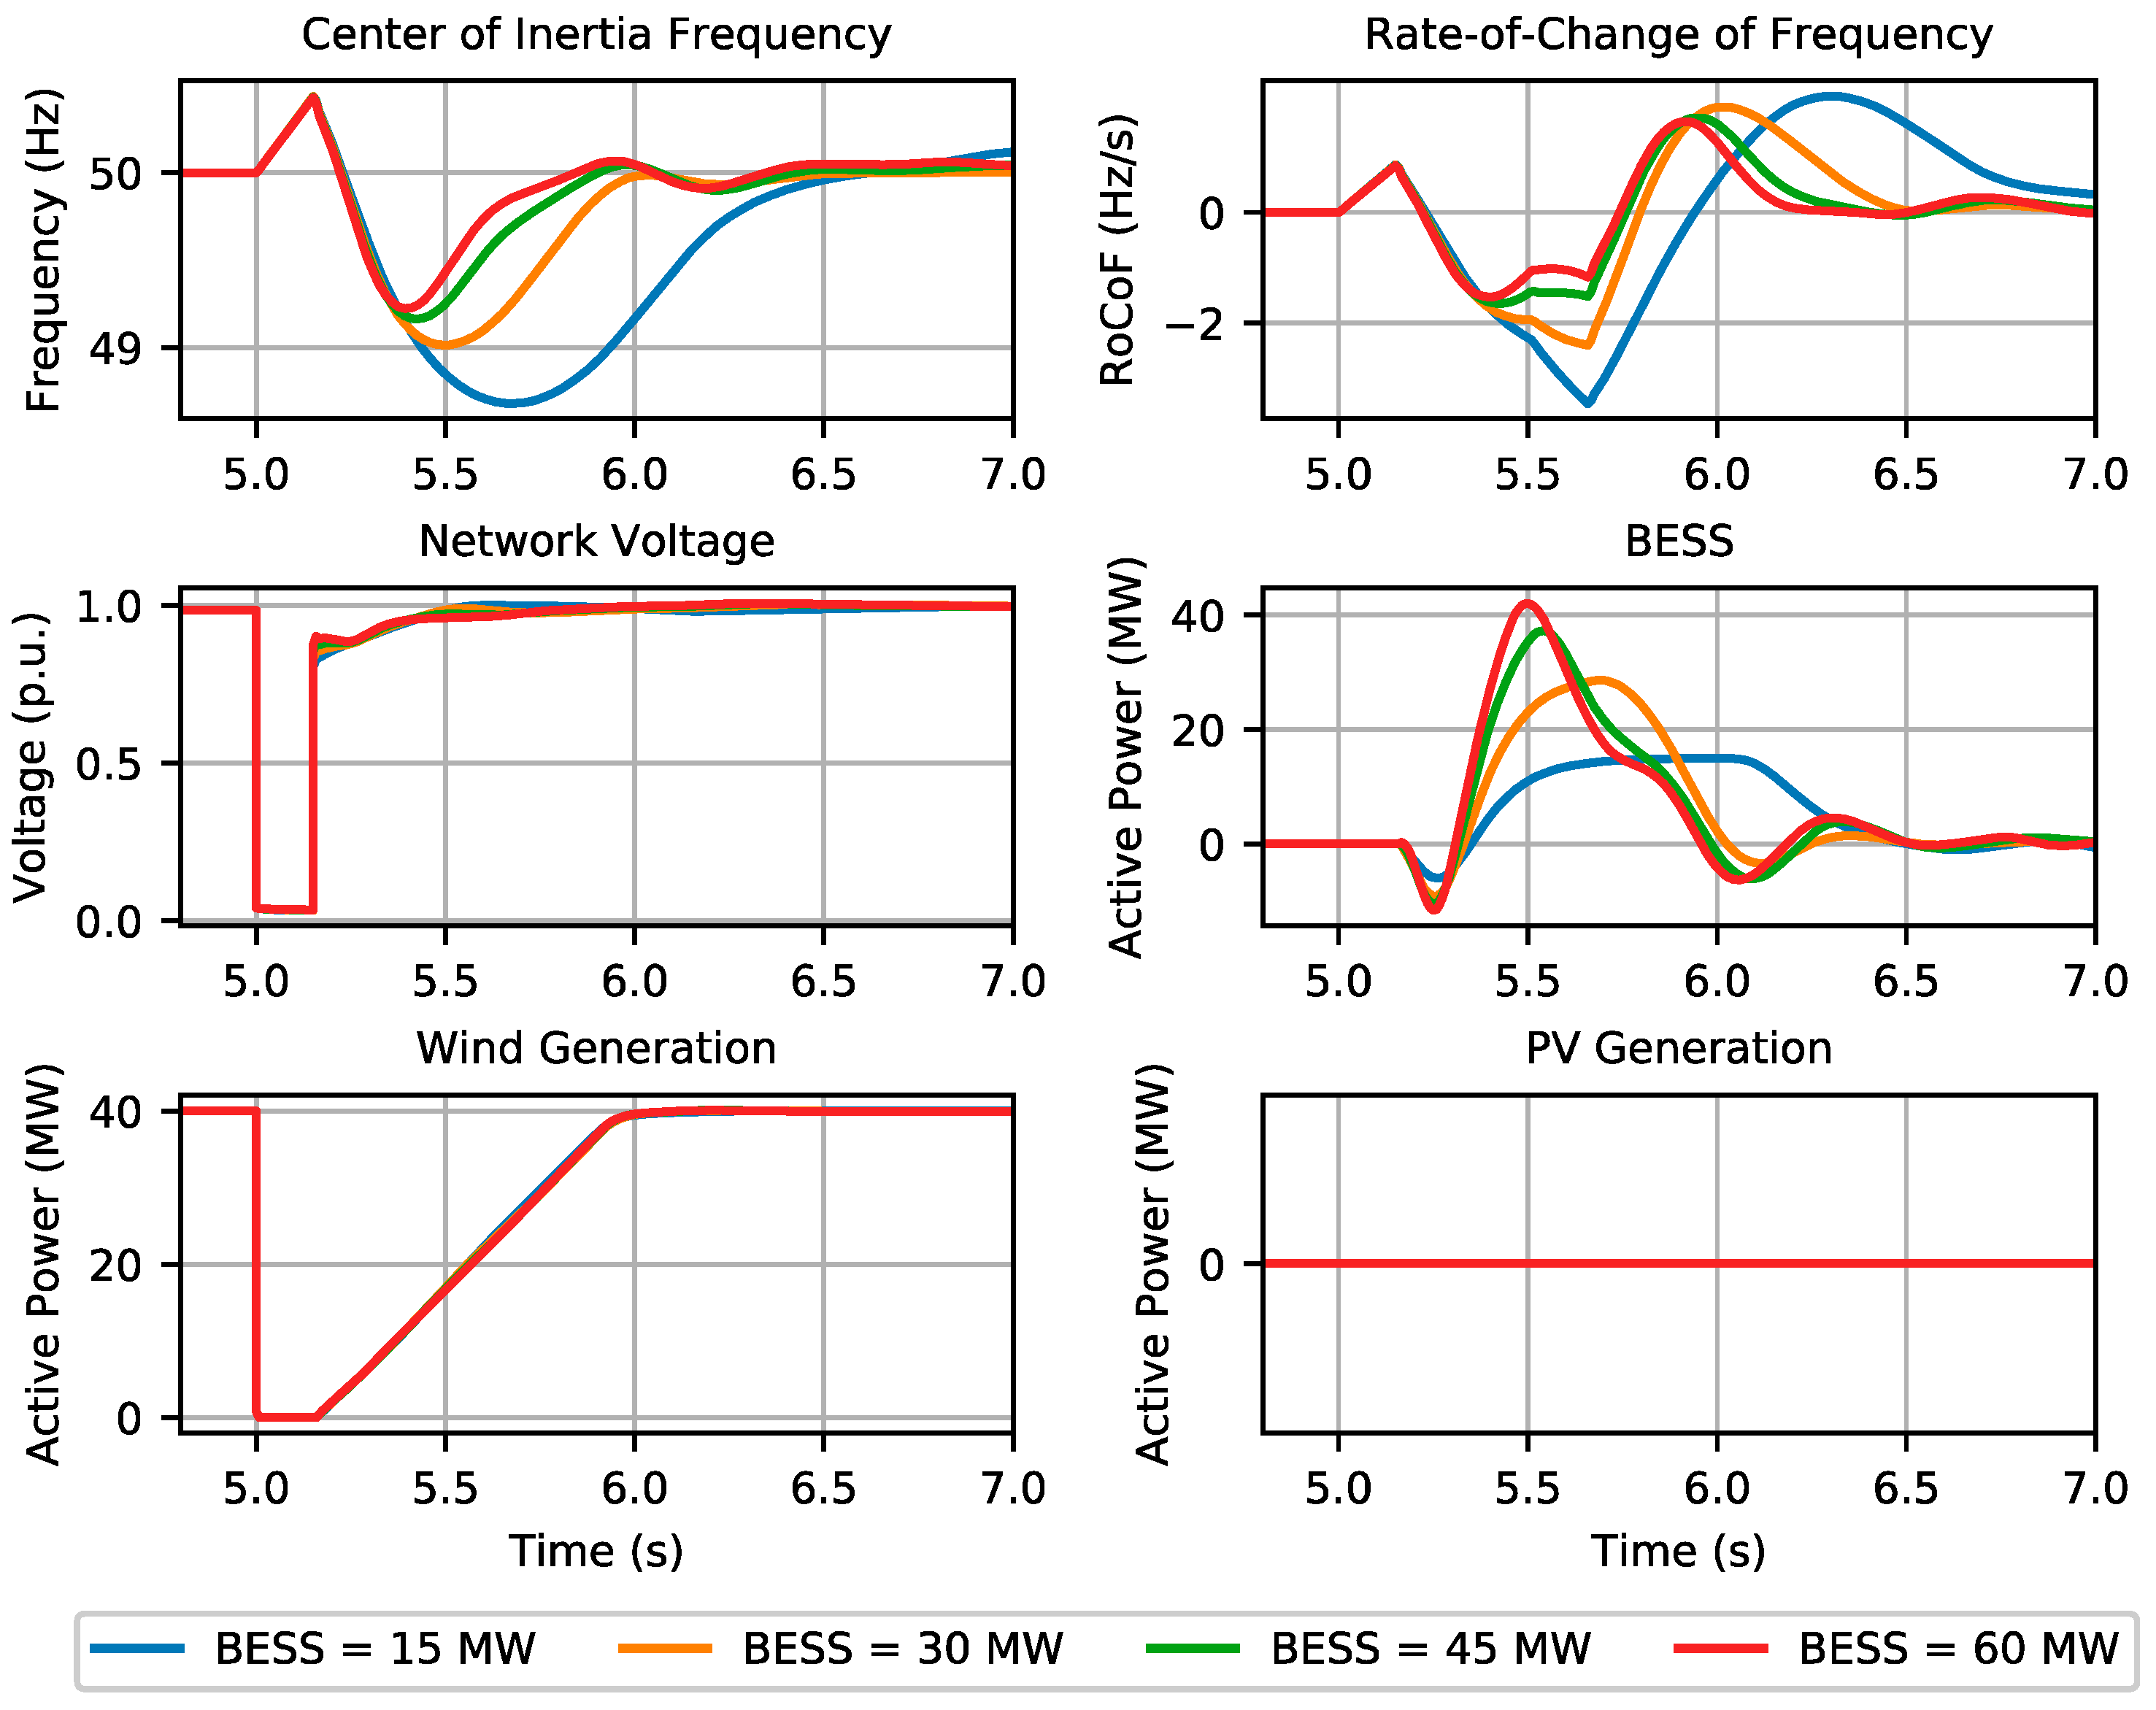
  • Operating scenario 2: the network is operated with two SMs, with a load consumption of 60 MW, a wind generation of 40 MW and a PV generation of 0 MW.
Three distinct analyses were performed and are presented in the next subsections. In Section 3.1, we perform a sensitivity analysis to study the influence of the BESS power capacity in the network frequency response after a short-circuit event. A similar sensitivity analysis is performed in Section 3.2, focusing on the SC capacity. Lastly, we analyze the influence of distinct contingency event types in the network frequency behavior.

3.1. BESS Power Capacity—Sensitivity Analysis

A sensitivity analysis of the BESS power capacity was performed, where it was intended to evaluate its influence over the network key frequency indicators—referred to as the center of inertia (COI) of the system (the COI is calculated only as a function of the online synchronous inertia). For this purpose, we considered the occurrence of a symmetrical three-phase short-circuit in the line connecting B1 to B2 (see Figure 1). Four distinct cases were compared, where different BESS power capacities were considered, namely 15, 30, 45 and 60 MW.
The results can be observed in Figure 3 and Figure 4, regarding operating scenario 1 and operating scenario 2, respectively. It was verified that a 60 MW BESS power capacity is required in order to contain the system frequency within the prescribed limits (49.4 Hz and −2 Hz/s) in operating scenario 1, corresponding to a power capacity much larger than that of the synchronous units. On the other hand, even with a 60 MW BESS, the frequency nadir reached approximately 49.25 Hz in operating scenario 2, exceeding the minimum frequency limit. As observed, the large frequency deviation following the fault clearance was induced by the wind generation recovery ramp, which took about 1 s to recover to their pre-fault active power injection. It was also observed that a higher BESS power capacity translates into higher amounts of power injected into the grid by the BESS after the fault clearance. In scenario 1, for the case of a 15 MW BESS, some voltage oscillations after the fault clearance were observed, which led to PV active power oscillations. Moreover, the results clearly demonstrated that RoCoF sensitivity to the BESS power capacity, in the range where load shedding is avoided (RoCoF > −2Hz/s), was effective only if very large (>45 MW) BESS capacities were used.

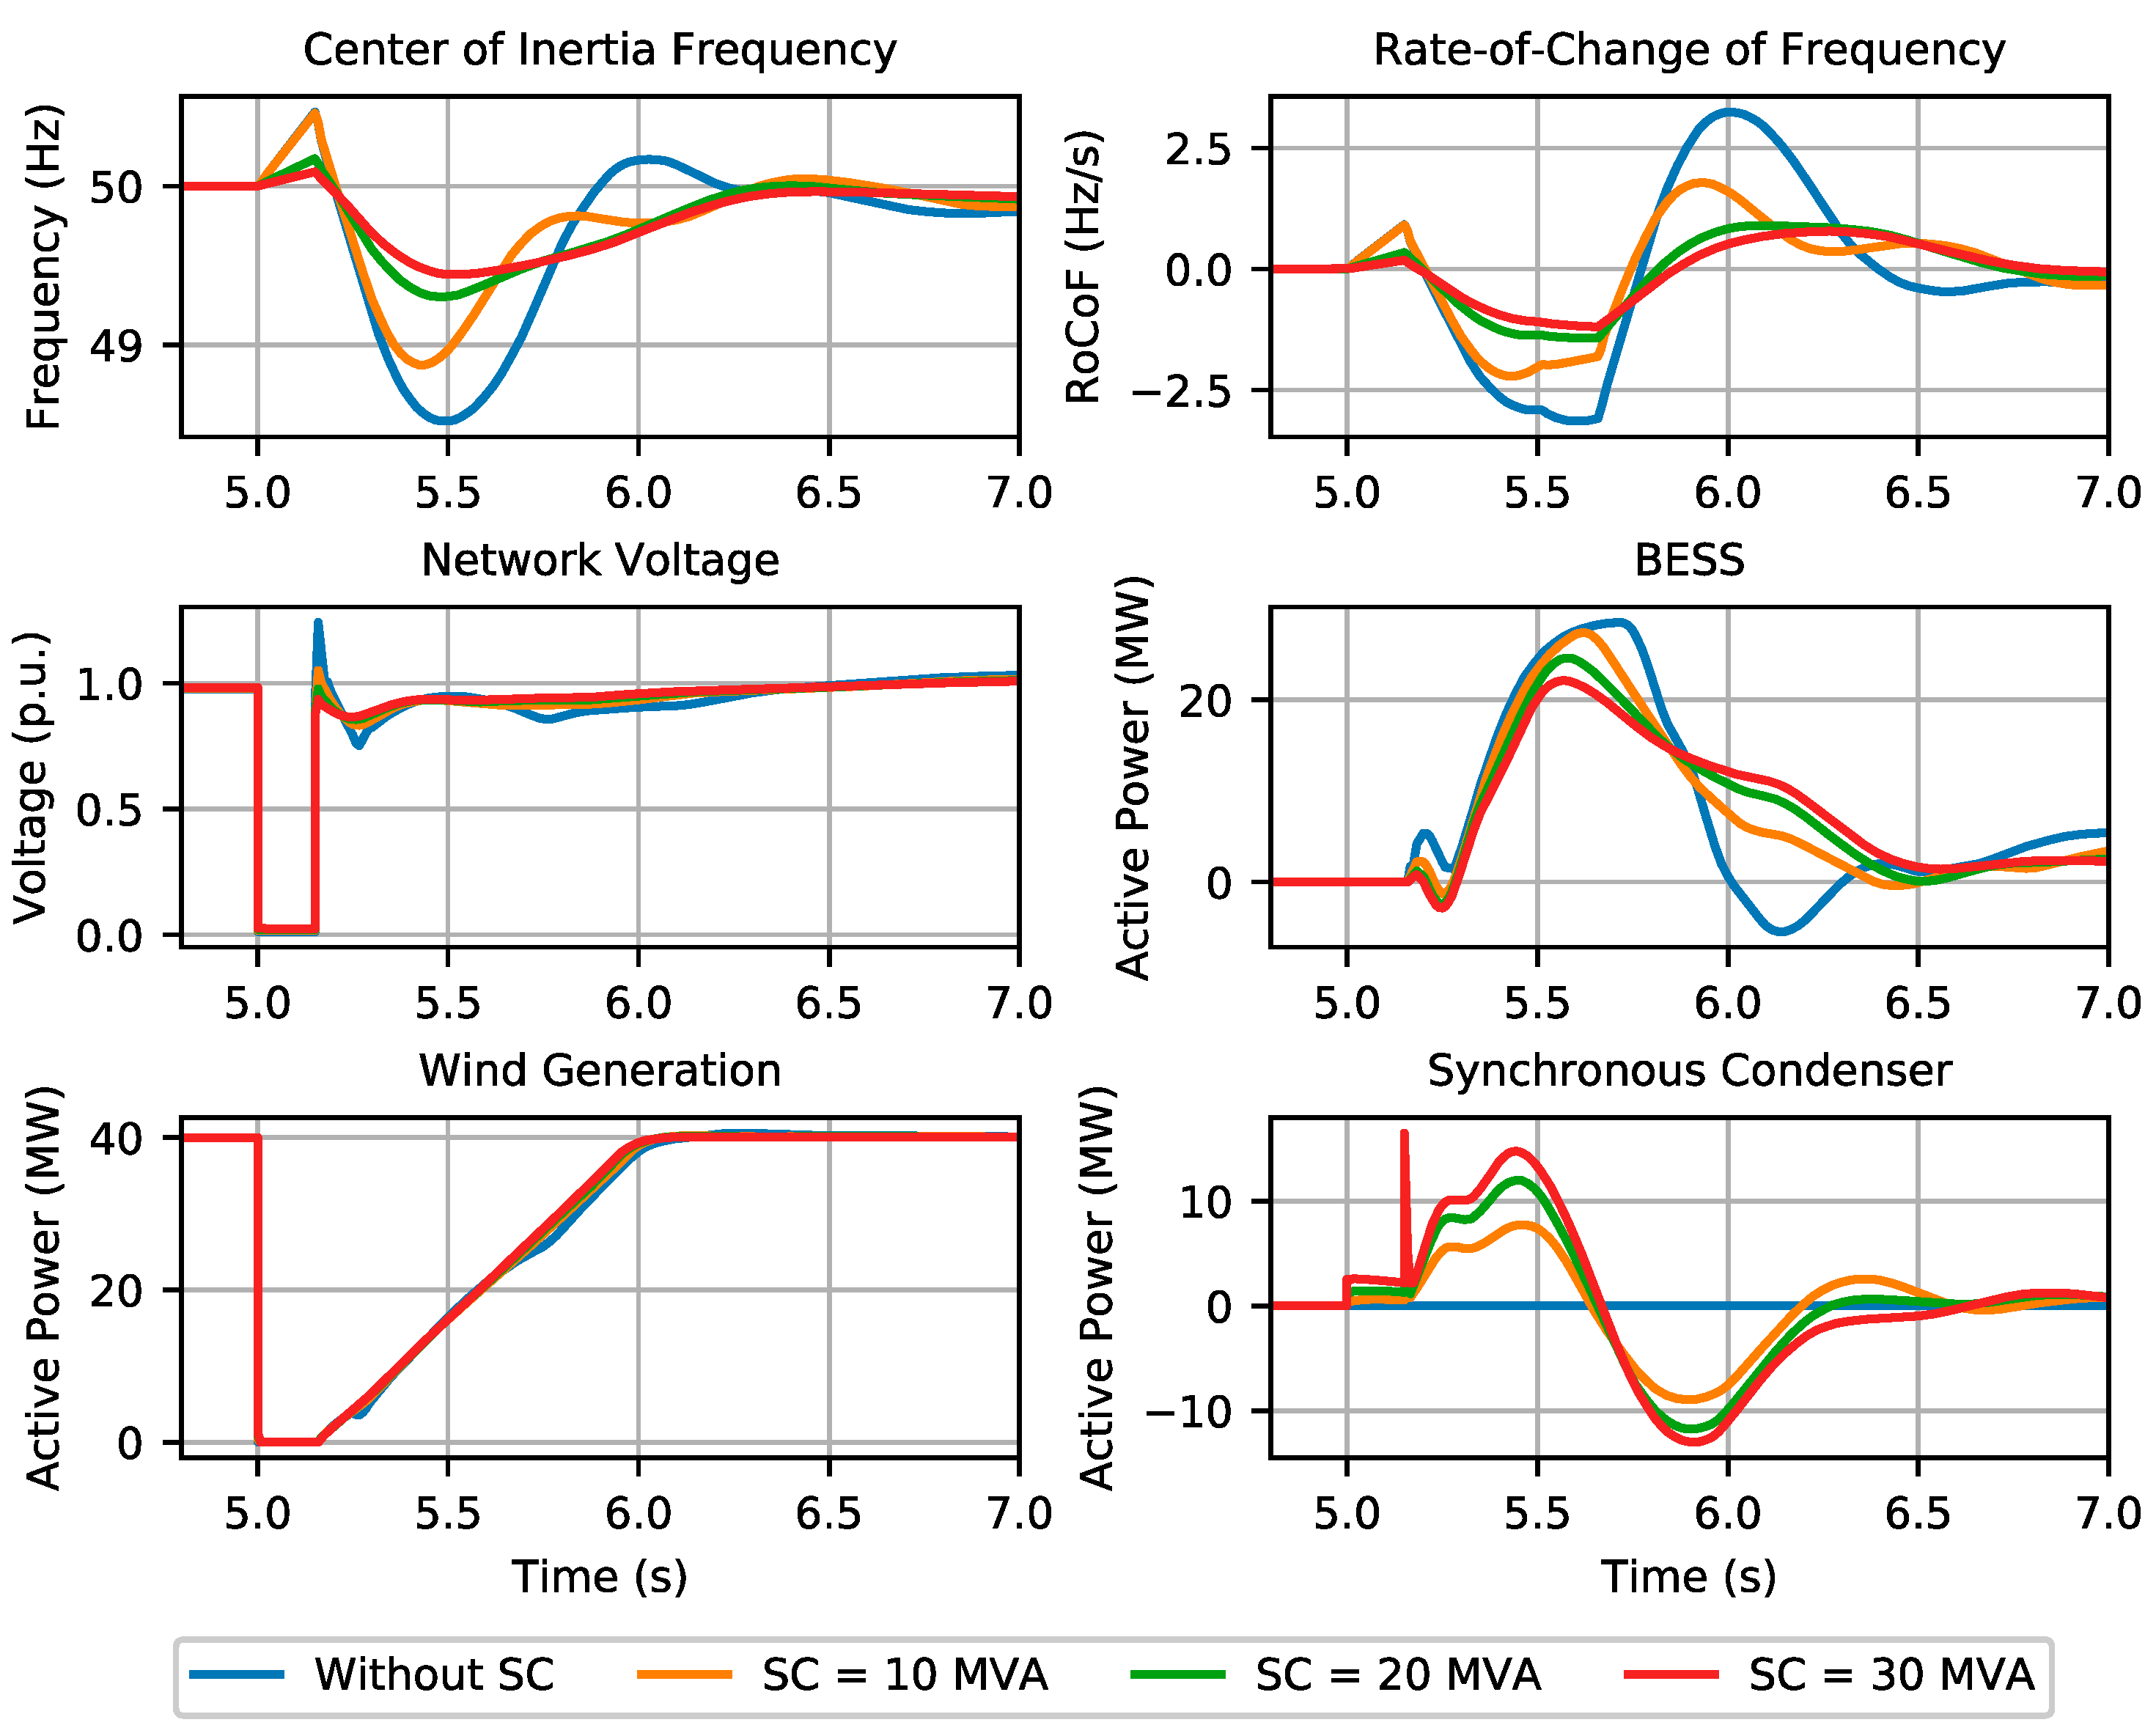
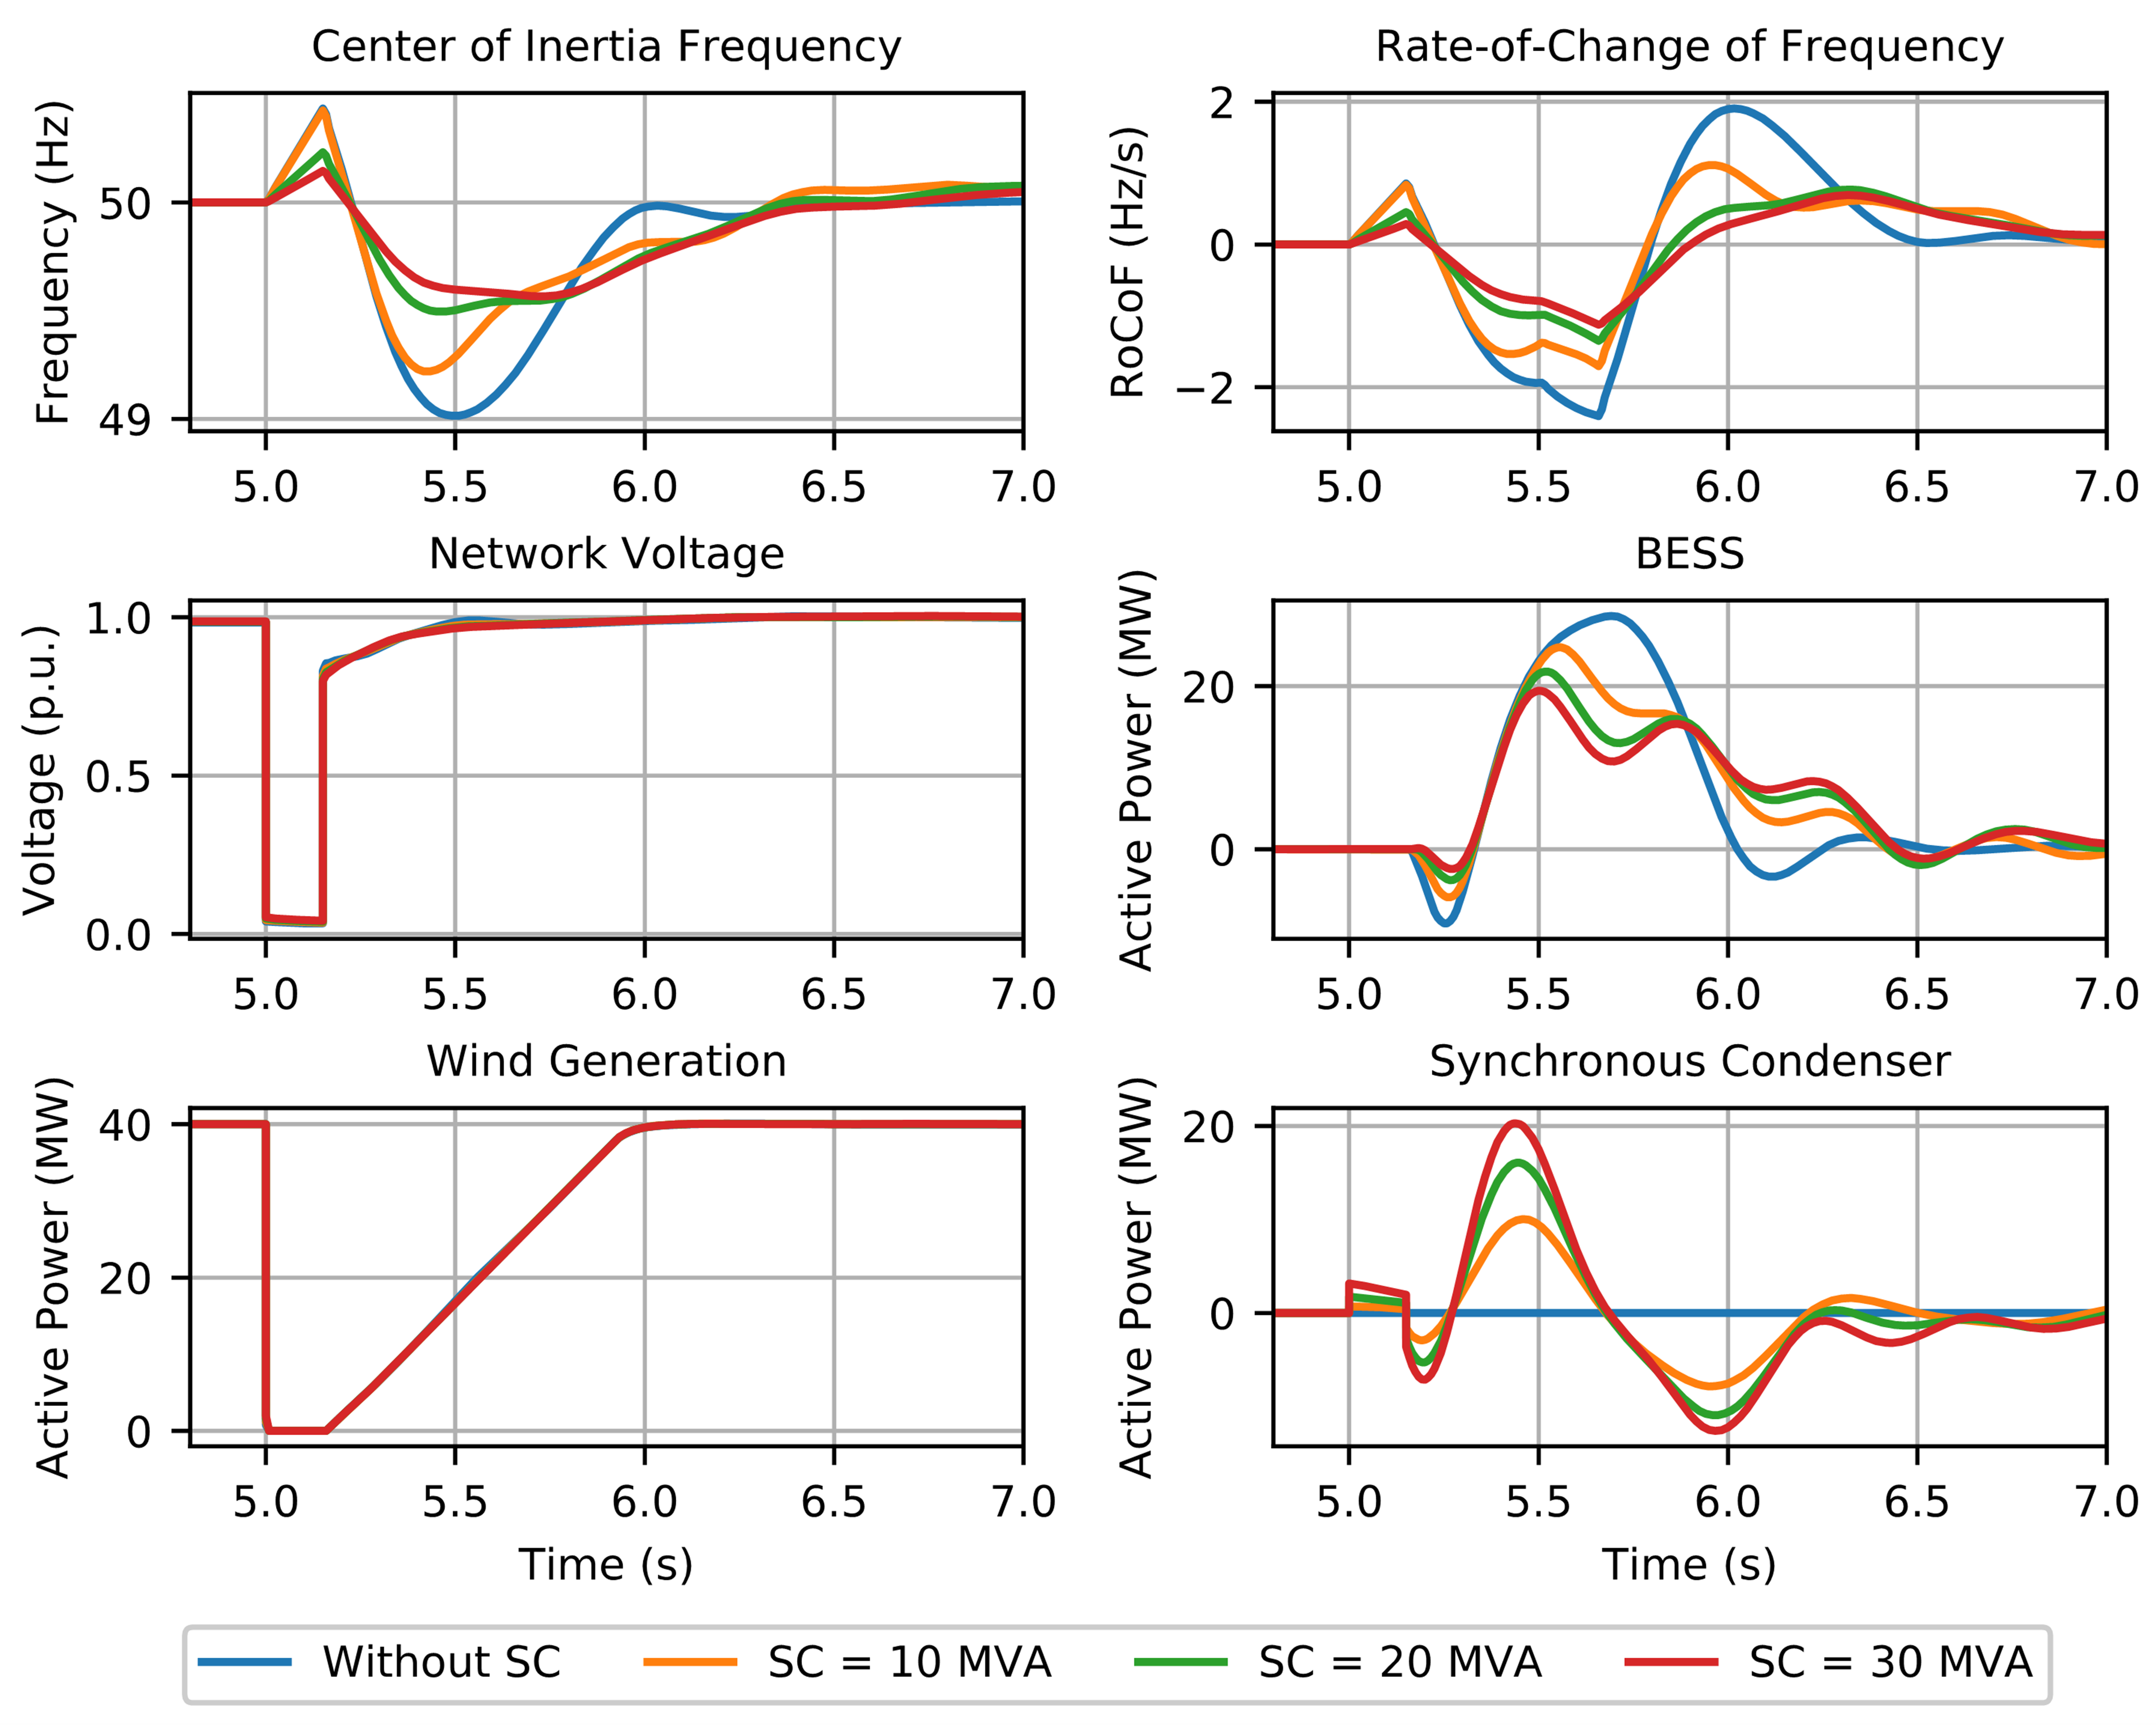
3.2. Integration of Synchronous Condensers—Sensitivity Analysis

In this section, we evaluate the impact of adopting SCs into the grid frequency dynamic behavior. In this case, the BESS power capacity was fixed at 30 MW, while four distinct cases were compared, representing different levels of SC integration, namely 0, 10, 20 and 30 MVA (note that an inertia constant of 7 MWs/MVA was considered for the SC).
The obtained results are shown in Figure 5 and Figure 6, regarding operating scenario 1 and operating scenario 2, respectively. The connection of a SC considerably reduced the frequency nadir and RoCoF, with a significant amount of active power being injected by the SC in the moments subsequent to the fault clearance (approximately 8–16 MW in scenario 1 and 10–20 MW in scenario 2, depending on the SC capacity). These fast power injections are a direct result of the inertia contribution from the SC and were found to have a fundamental impact on improving grid frequency in terms of nadir and RoCoF. Furthermore, it was shown that the inclusion of SC decreased the regulation effort of the BESS. Therefore, a SC of 30 MVA in operating scenario 1 and a SC of 20 MVA in operating scenario 2, together with a 30 MW BESS, were capable of successfully containing the grid frequency such that the risk of under-frequency load shedding was mitigated.

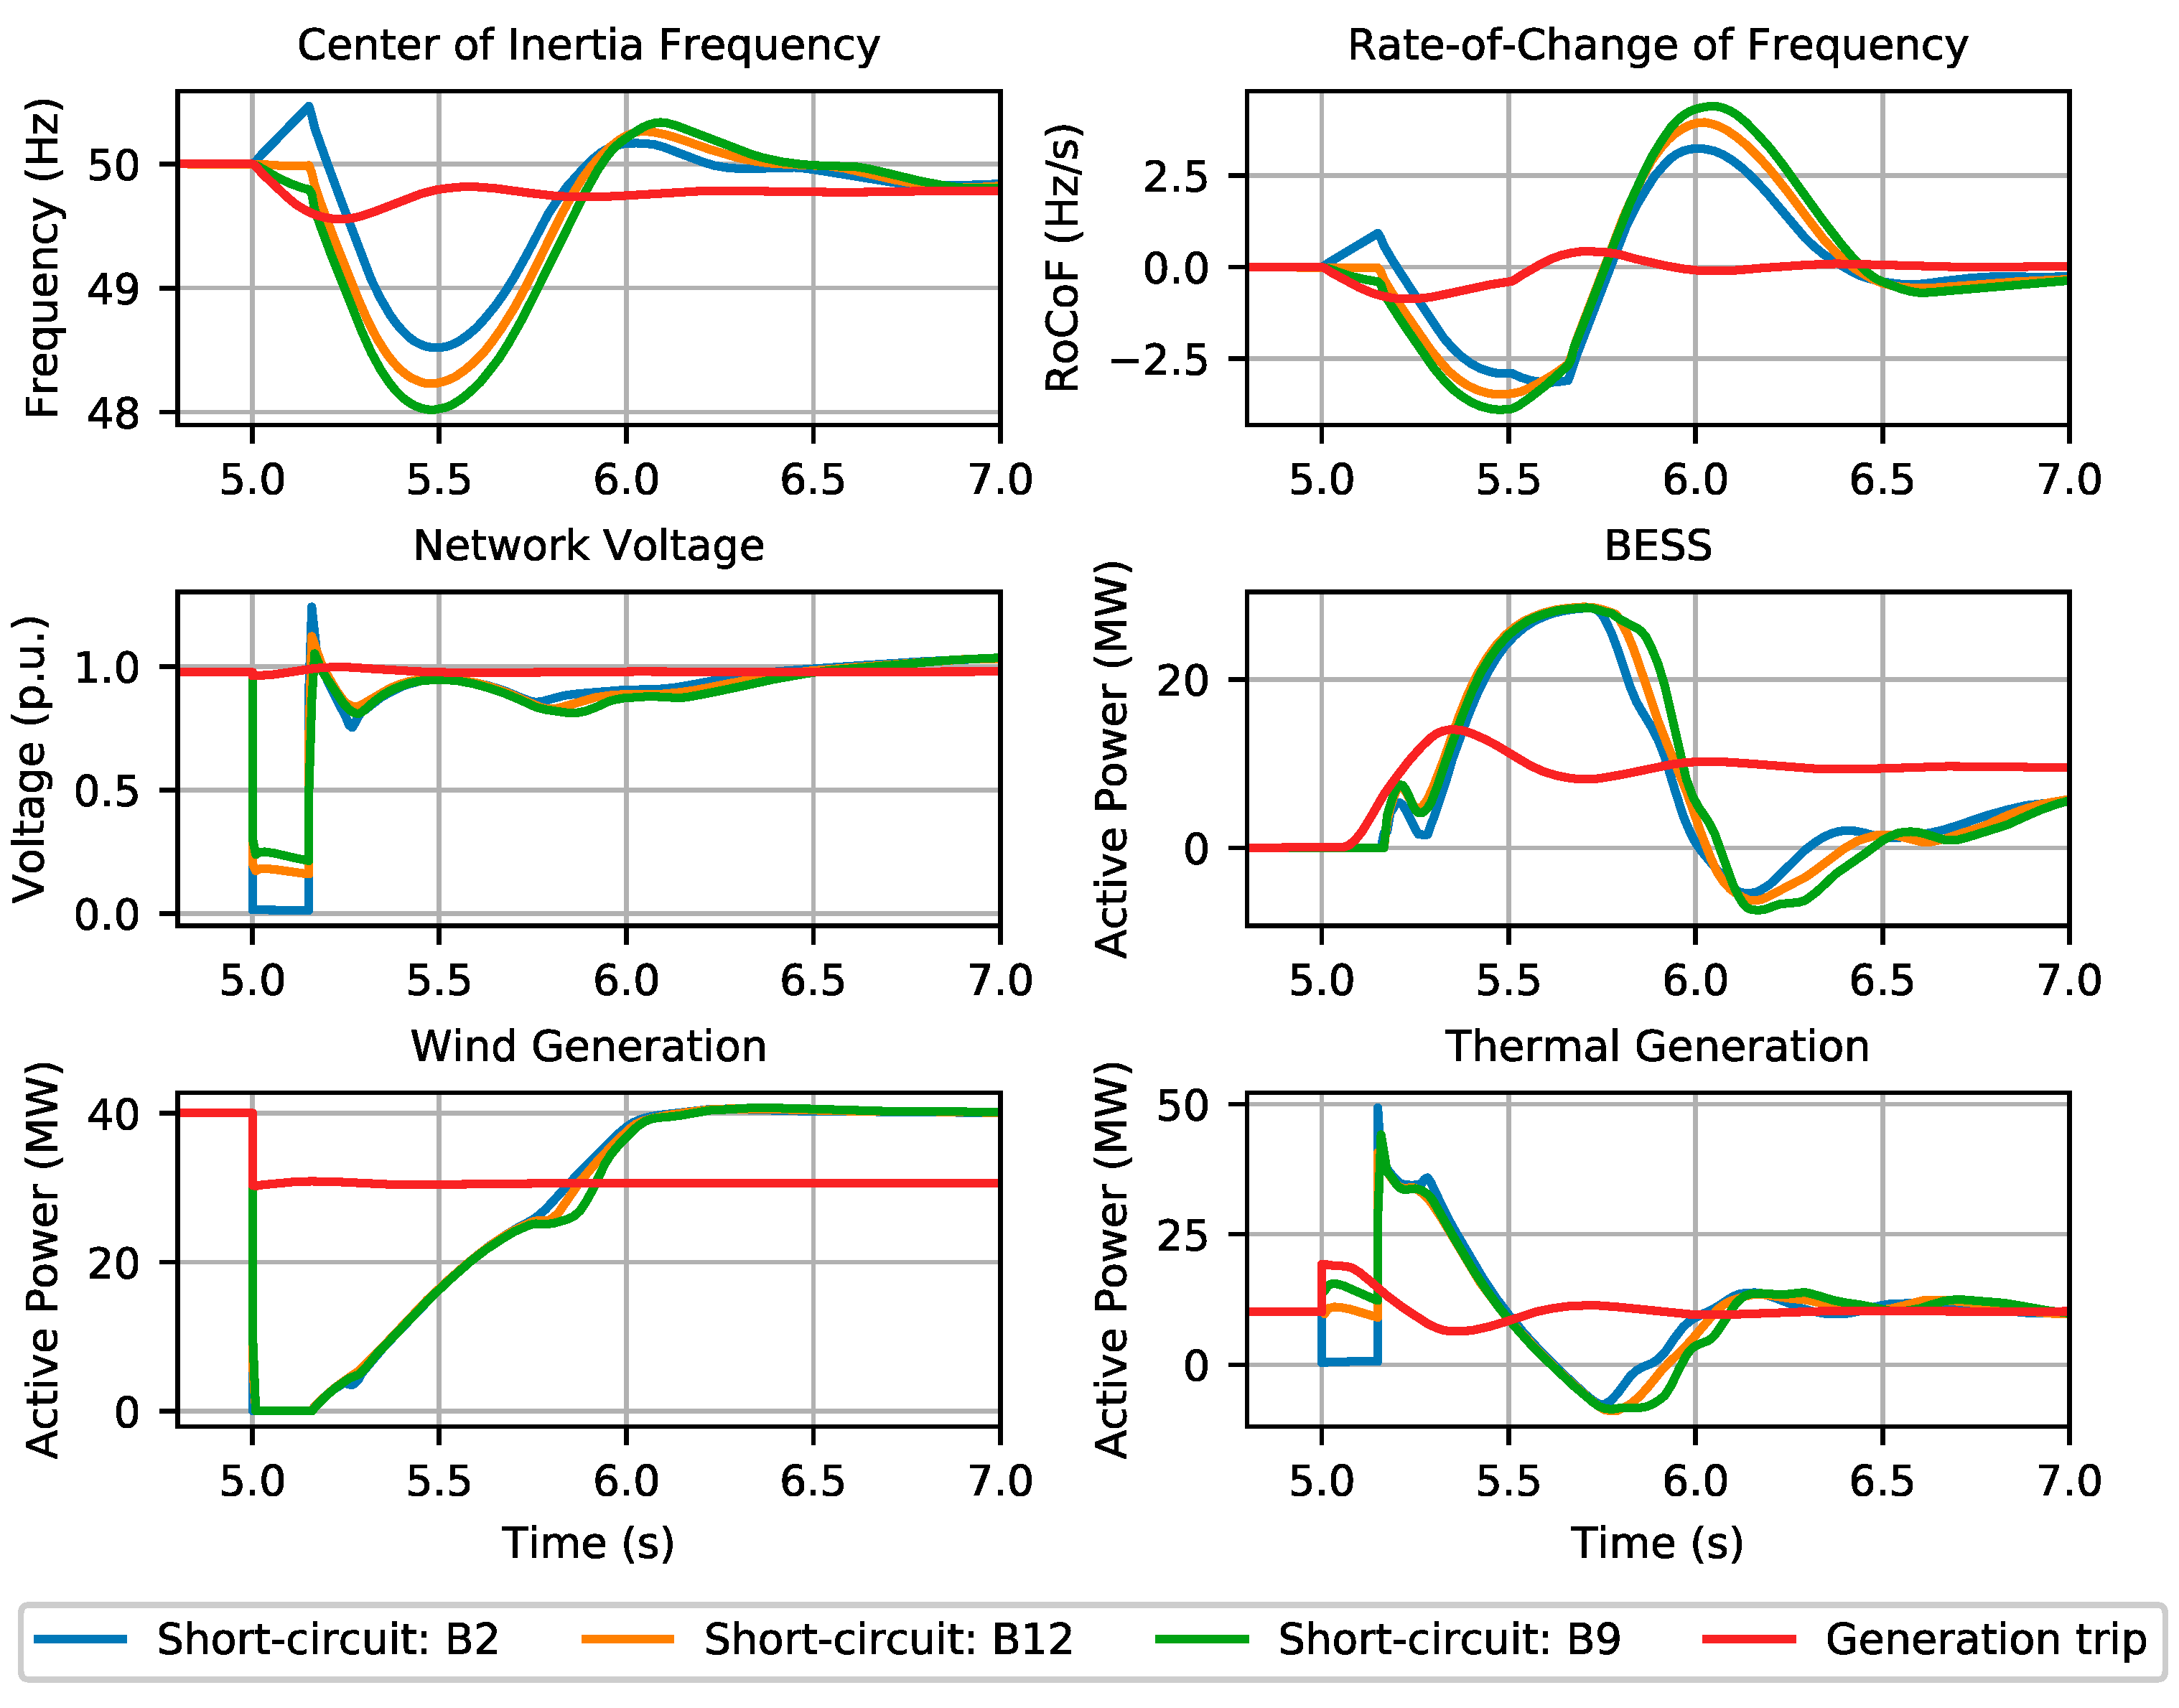
3.3. Network Contingencies—Sensitivity Analysis

In the literature, authors commonly consider the loss of the largest generating unit as the critical disturbance in isolated or low inertia systems [3,6]. In line with the previous sensitivity analysis, in order to identify what type of contingency event has a higher risk of endangering system frequency stability, an analysis was performed, with the same network scenario (installation of a 30 MW BESS without the inclusion of an SC). Thus, the sudden loss of a generating unit and short-circuit events in different locations of the network were simulated, both in transmission and distribution networks. Regarding the generation trip event of the generating unit injecting the largest amount of active power was considered. In operating scenario 1 this event corresponds to a generation trip of 9.4 MW, while in operating scenario 2 it corresponds to the tripping of 11.1 MW in the Soroni diesel unit 1.
The results for operating scenario 1 and operating scenario 2 are depicted in Figure 7 and Figure 8, respectively. It is possible to conclude that, in the considered operating scenarios, short-circuit events led to the largest frequency excursions compared to generating trip events. This is due to the wind generation active power recovery ramp rates. In addition, it was also verified that different fault locations may result in different system frequency dynamics following fault clearance. Therefore, it is recommended that the frequency-constrained UC algorithms applied in isolated systems with high shares of CI-RESs should consider network faults as the critical frequency stability contingency (as documented in [21]), taking into consideration multiple fault locations.

4. Minimum Synchronous Inertia Quantification

In this section we present a methodology which aims to quantify, for a given network operating scenario, the required minimum synchronous inertia which is able to sustain the frequency deviation and admissible RoCoF to its prescribed limits, considering a set of distinct disturbances. Hence, the ultimate goal is to secure the grid frequency dynamics in the face of critical disturbances without risking load shedding activation. As demonstrated in Section 3.3, network faults are the critical network contingency event, requiring the dynamic simulation of a complete network model, which is computationally demanding. In addition, from Section 3.3 it was verified that it is recommended to consider multiple contingency events to monitor the network dynamic security, which increases the computational burden associated with the dynamic simulations required to characterize key frequency indicators for each operating scenario. Therefore, it was necessary to exploit a machine learning-based approach, based on offline-generated system knowledge, in order to avoid the execution of dynamic simulations. Thus, an ANN-based framework was developed for the fast assessment of the network frequency key indicators (nadir and RoCoF). The ANN training was performed offline through a knowledge database which contains information about a large set of feasible network operating scenarios. Afterwards, the minimum amount of SC that should be connected to the system was computed based on a sensitivity analysis between the ANN outputs (frequency nadir and RoCoF) with respect to the input defining the SC’s total capacity.
In the next subsections the different steps of the developed methodology is presented and discussed.

4.1. Functional Knowledge Dataset

The first step of the considered methodology consists of the creation of a functional knowledge dataset which will be later used for the training phase of an ANN. In this sense, this process is divided in two main steps, as described hereafter.

4.1.1. Dataset Generation

First, a dataset was created containing the information about the power system dynamic behavior following the simulation of a set of disturbances, which was then used to train the ANN. In order to assure that the ANN accurately reproduces the system key frequency indicators, the database used for training covers a large number of feasible operating scenarios. In this sense, the total system load, and wind and PV capacities were divided into intervals of 5/10 MW, which were then combined in order to form distinct operating scenarios. In each combination of load, and wind and PV generation intervals, three random values were generated for each interval, which translated to 27 distinct operating points. Moreover, an analysis of the correlation between wind load and PV load was performed, based on the Rhodes historical data. Thus, the combinations of load/wind and load/PV that did not existed were eliminated. Finally, 21,201 operation points were created based on the aforementioned assumptions.
For each operating point, the number of thermal units to be in operation was determined based in the N-1 security criteria rule for assuring a sufficient reserve margin for proper system operations, for which the BESS power capacity of 30 MW was added. Then, the generator dispatch was performed according to a merit order-based UC (see Table 1). The following constraints were considered:
  • The active power output limits of the SM must be respected;
  • At least one SM must be in operation;
  • The system should have enough power reserve to cover the loss of the generator injecting the largest amount of power.

4.1.2. Offline Dynamic Simulation

Each operating point of the dataset was simulated offline in the PSS/E simulation package and considered four distinct disturbances:
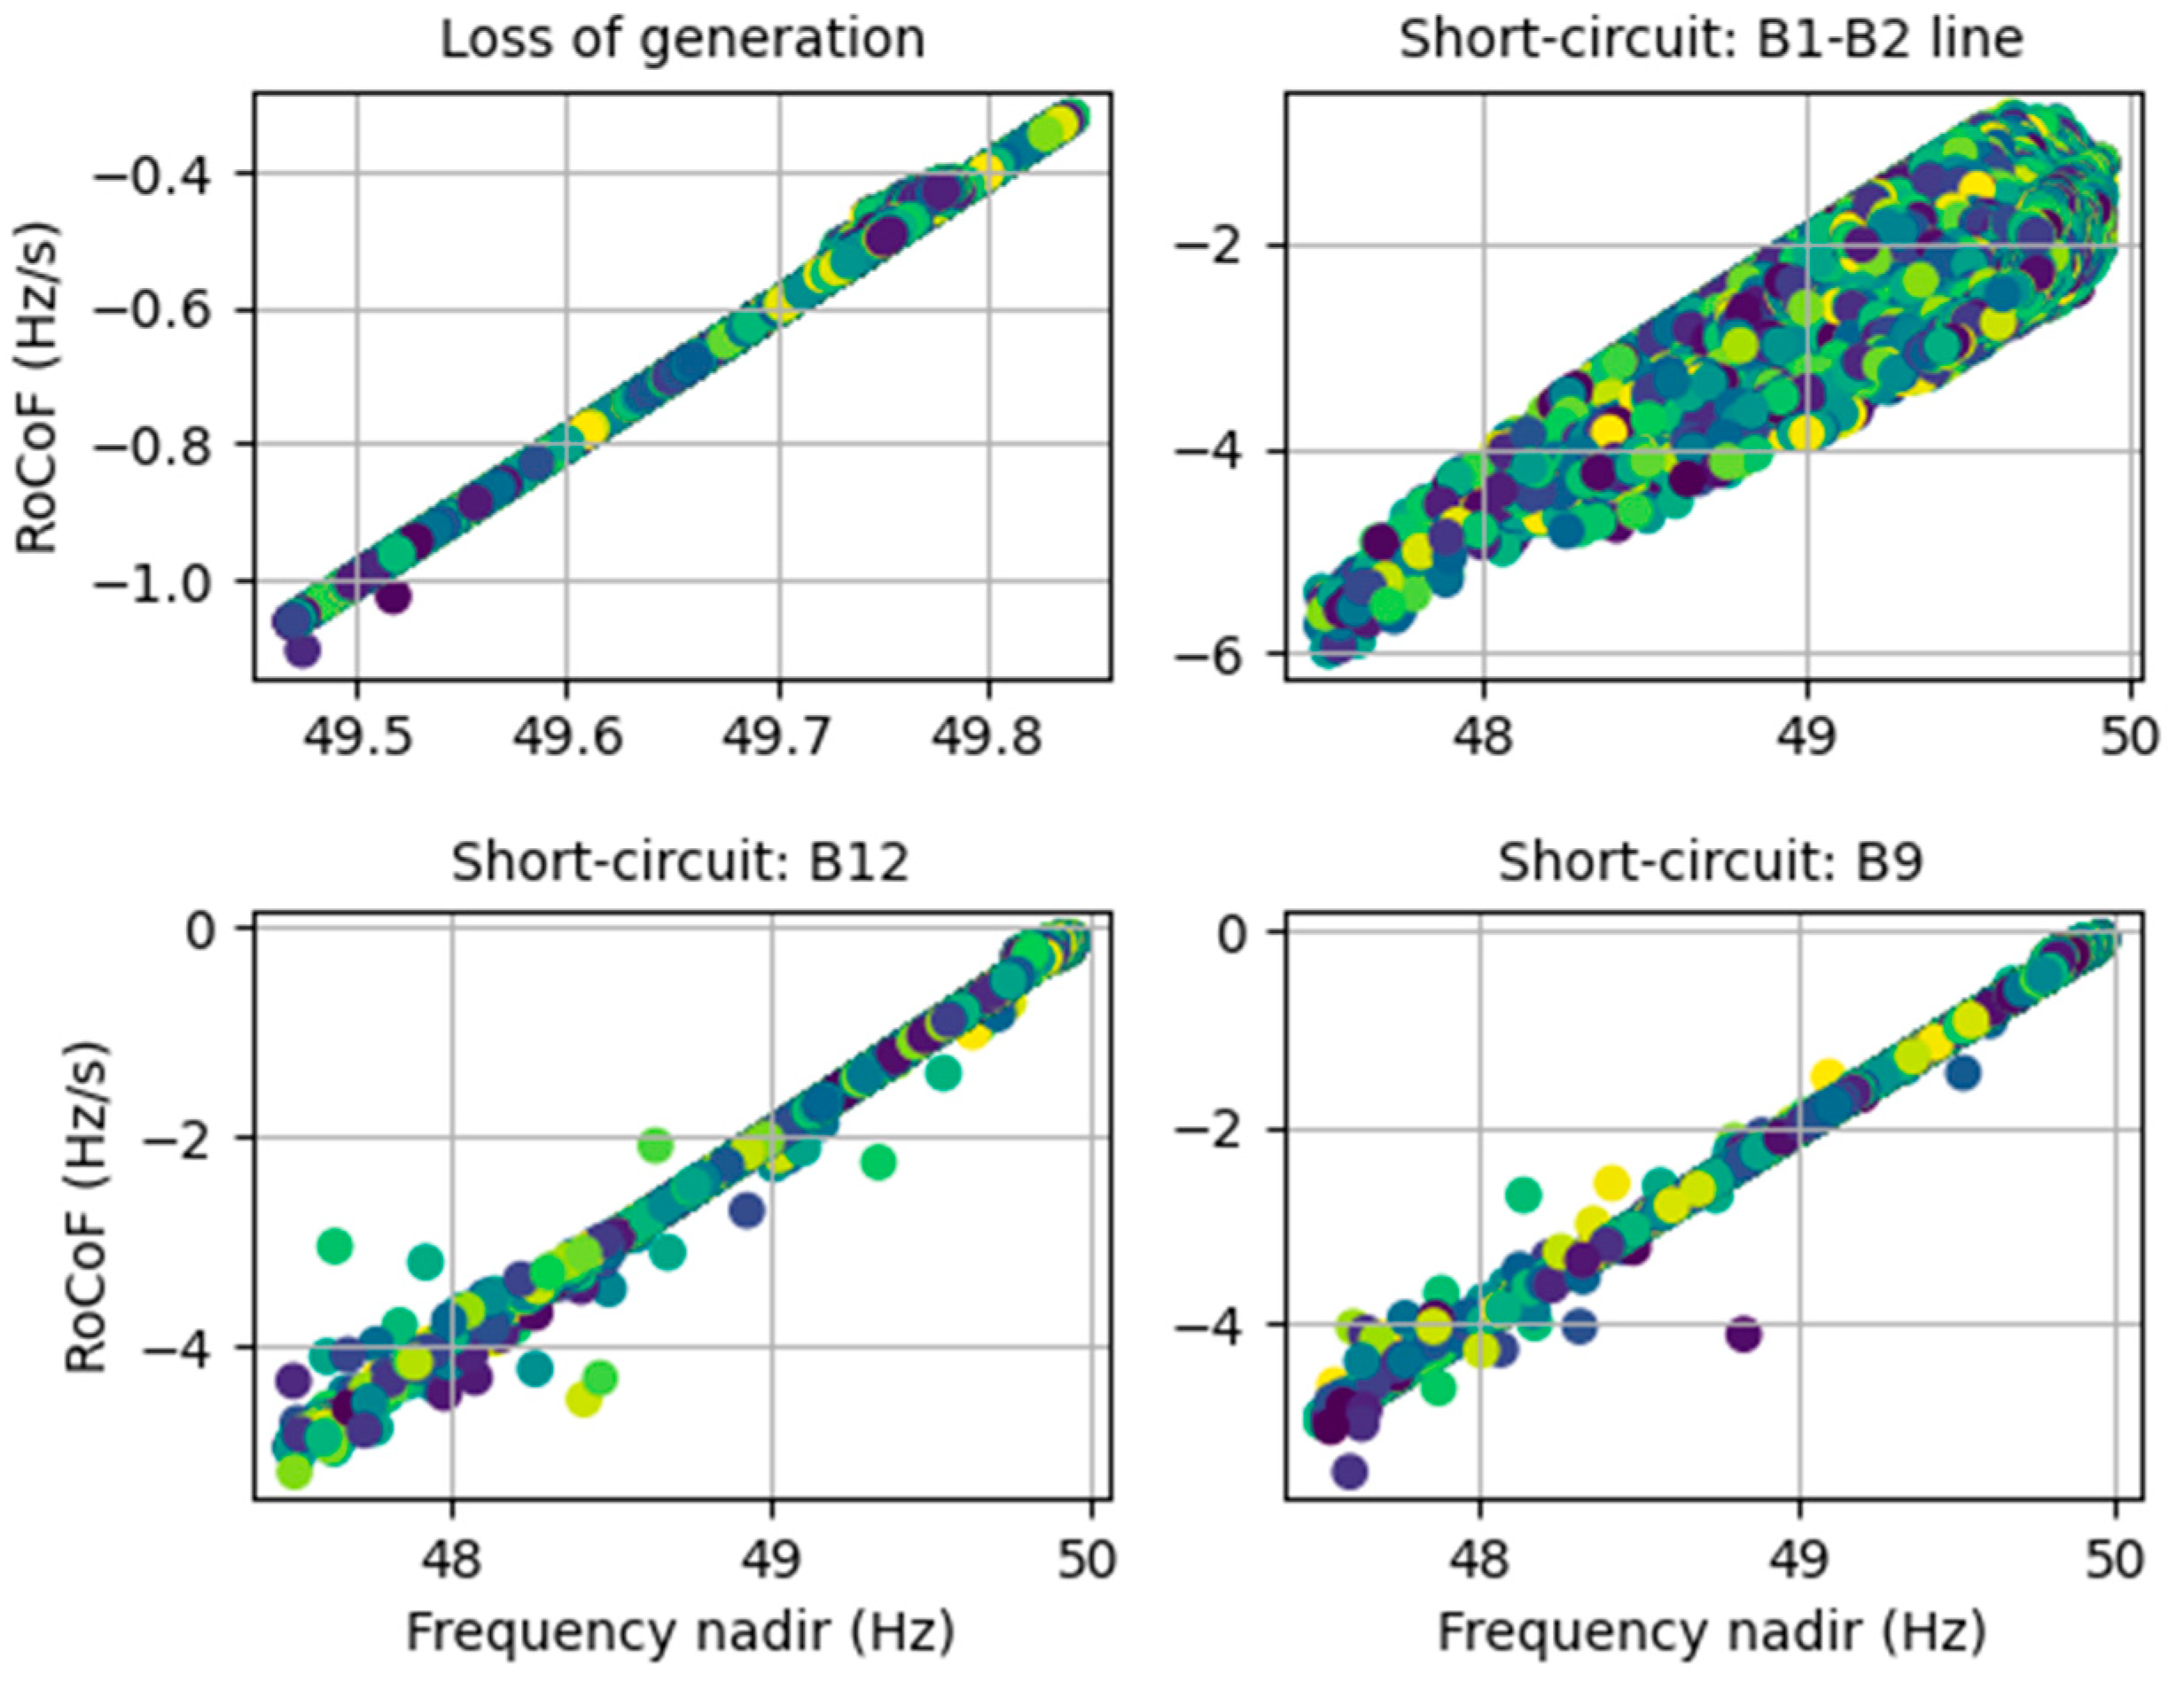
  • The sudden trip of the generator injecting the largest amount of active power;
  • 150 ms short-circuit occurring in the line connecting B1 and B2 (leading to the tripping of the line);
  • 150 ms short-circuit occurring in B12;
  • 150 ms short-circuit occurring in B9.
From the dynamic simulations that were performed, two key frequency indicators were obtained, which characterized the dynamic stability of each operating point with respect to the time series of the frequency obtained for the system COI: RoCoF (measured in a window of 500 ms) and frequency nadir. As previously stated, the system COI was calculated considering only synchronous inertia, namely the online SM and SC. The corresponding results are presented in the mappings depicted in Figure 9, verifying that, for the short-circuit disturbances, the frequency security metrics were violated in a large number of scenarios.
As observed in Figure 9, for generation tripping events, there was no risk of violating frequency nadir or RoCoF limits for all the considered scenarios, since the BESS regulation action was able to keep the frequency values within the prescribed metrics. On the other hand, it was possible to conclude that for short-circuit type events, a large share of insecure operating scenarios was identified, ranging from 29.7% to 40.7%, depending on the short-circuit location, causing frequency and/or RoCoF violations.
Thus, for the insecure operating points, the dynamic simulations for accessing the key frequency indicators were iteratively repeated through a successive increase of the SC installed capacity in steps of 2 MVA (with an inertia constant of 7 MWs/MVA per installed capacity [27]). This step was used in order to provide a wide granularity of the data set with respect to the influence of the SC capacity on the key frequency indicators under assessment. Hence, the distribution of the volume of the SC which was required to be installed for each contingency event is shown in Figure 10. As it can be observed for short-circuit type disturbances, in 30–40% of the considered scenarios required to schedule a SC to assure system dynamic security. Nevertheless, different trends in the distribution of the required capacity of additional SC depend significantly on the fault location.

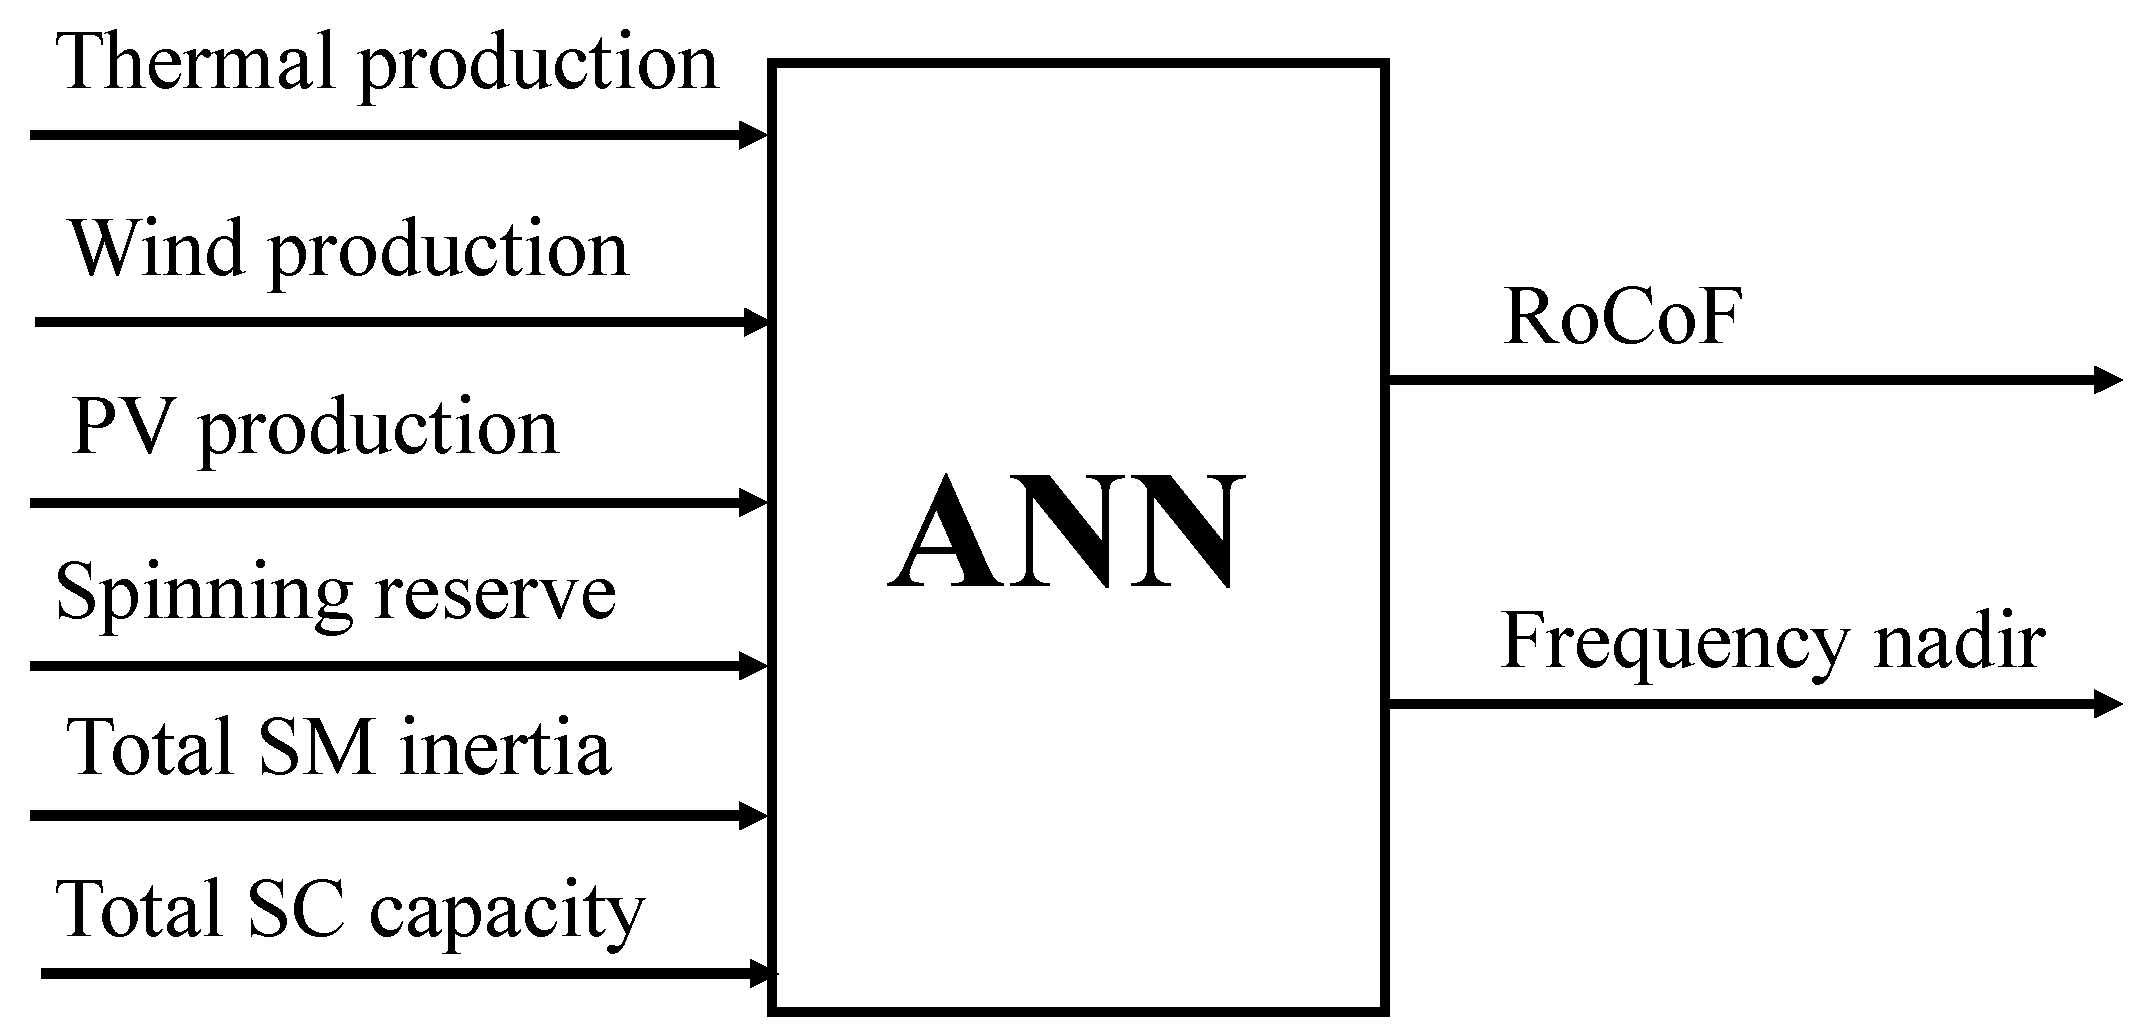
4.2. ANN Architecture

In order to perform a fast assessment of the system frequency metrics in the face of distinct contingency events, several ANNs were developed—one per location of the considered short-circuit event (the three distinct short-circuit locations identified in Figure 10):
  • Event 1: Short-circuit: B1–B2 line;
  • Event 2: Short-circuit: B12;
  • Event 3: Short-circuit: B9.
The reference architecture of each ANN consisted of 6 inputs, 2 hidden layers (composed of 12 and 30 hidden neurons) and 2 outputs. The considered activation functions for the hidden layers and outputs were the sigmoid and linear functions, respectively. The ANN training process was achieved through the Adam optimization algorithm, which consists of a stochastic gradient descent method [28]. The input variables should be independent and characterize the state of the system for each scenario from steady-state information and/or intrinsic characteristics of the running units (such as the synchronous inertia, as it has a high impact in system frequency RoCoF). Therefore, the chosen input variables were the generators’ active power set-point (from thermal, wind and PV units), the spinning reserve, the total synchronous inertia from the thermal units in operation and the total capacity from the scheduled SC. Note that the aggregated power production for each generation type was considered in order to reduce the number of input variables. In turn, the output variables were the frequency nadir and the RoCoF. The ANN architecture can be observed in Figure 11.
Note that no ANN was developed to predict the system response in the face of generation tripping, since from Figure 10 it was concluded that there was no need to schedule the SC. For this specific disturbance, the considered BESS was able to cope with the prescribed frequency metrics.

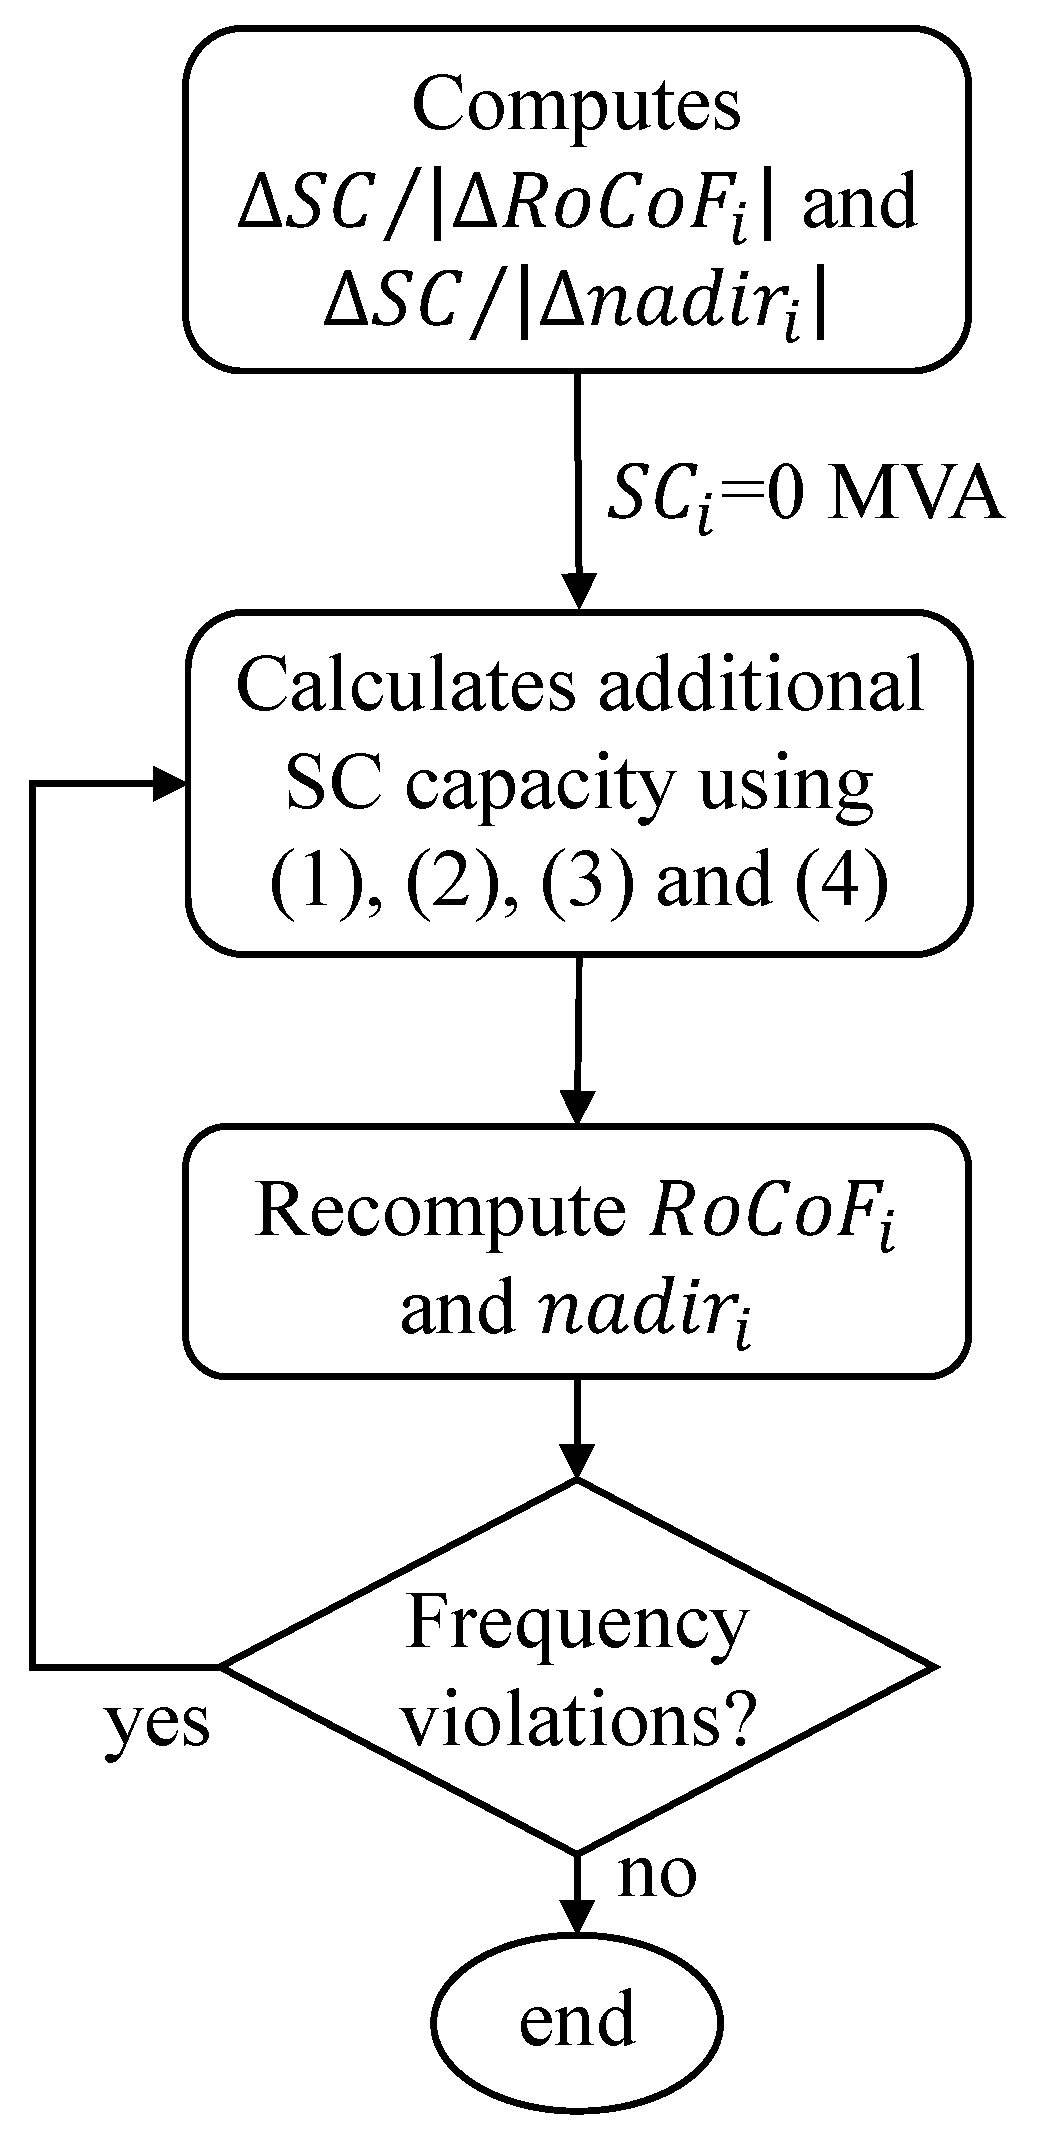
4.3. Computing Minimum Synchronous Inertia

For the operational scenarios where the system frequency metrics are violated, SCs need to be dispatched in order to avoid renewable generation curtailment. Therefore, in this work, a methodology was proposed which aims to determine the minimum amount of synchronous inertia that moves the system towards its dynamic security region considering the prescribed frequency metrics. Firstly, exploiting the trained ANNs, the sensitivity of the outputs (frequency nadir and RoCoF) was computed with respect to the input defining the SC total capacity for each ANN. Then, it was followed a sensitivity approach similar to the one used in [7] when defining preventive control measures regarding maximum frequency excursions. Thus, a gradient descent technique iteratively searched for the additional minimum amount of SCs that must be added to the system. This process was applied individually to each contingency event i (and corresponding ANN) as follows:
while   ( R o C o F i i < 2 Hz / s )   or   ( n a d i r i < 49.4 Hz )
S C a d ,       i r o c o f = ( 2 R o C o F i ) × Δ S C i | Δ R o C o F i |
S C a d ,       i n a d i r = ( 49.4 n a d i r i ) × Δ S C i | Δ n a d i r i |
S C a d ,       i = m a x ( S C a d ,       i r o c o f ;   S C a d ,       i n a d i r )
S C i = S C i + S C a d ,       i
where S C a d ,   i is the additional capacity of SC that should be added to the system in each iteration of the process (considering contingency event i ), while S C i is the total determined SC capacity. R o C o F i and n a d i r i are the respective outputs of the considered ANN, while Δ S C / | Δ R o C o F | and Δ S C / | Δ n a d i r | are the coefficients that translate the sensitivity between the ANN input defining the SC total capacity and the ANN’s RoCoF and frequency nadir outputs, respectively. At the end of each iteration, the ANN’s R o C o F i and n a d i r i are recalculated, considering the updated S C i capacity. The flowchart of this preventive control algorithm is presented in Figure 12.
Note that the iterative procedure described in Figure 12 is applied individually to each ANN (representing the system key frequency indicators for contingency event i ) when insecure scenarios are detected. Therefore, after this preventive control algorithm has been carried out for all the considered contingency events, the SC capacity that effectively will be dispatched corresponds to the worst-case event. Thus, the SC capacity that will be dispatched for a defined scenario will correspond to the maximization of the SC capacities determined individually for each contingency event. This is calculated as follows:
S C a d = m a x ( S C 1 ,   S C 2 , ,   S C n )
where SCad represents the effective SC capacity that will be necessary to be dispatched in the system ( n represents the number of considered contingency events).

5. Simulations and Analysis of the Results

This section presents an analysis of the main results of the methodology proposed in this article. A statistical analysis of the ANN performance is presented in Section 5.1. In Section 5.2 the results of the ANN are evaluated, with an assessment of the fault location’s influence over the system dynamic stability. Finally, in Section 5.3 the performance of the minimum synchronous inertia computation methodology presented in Section 4.3 is analyzed.

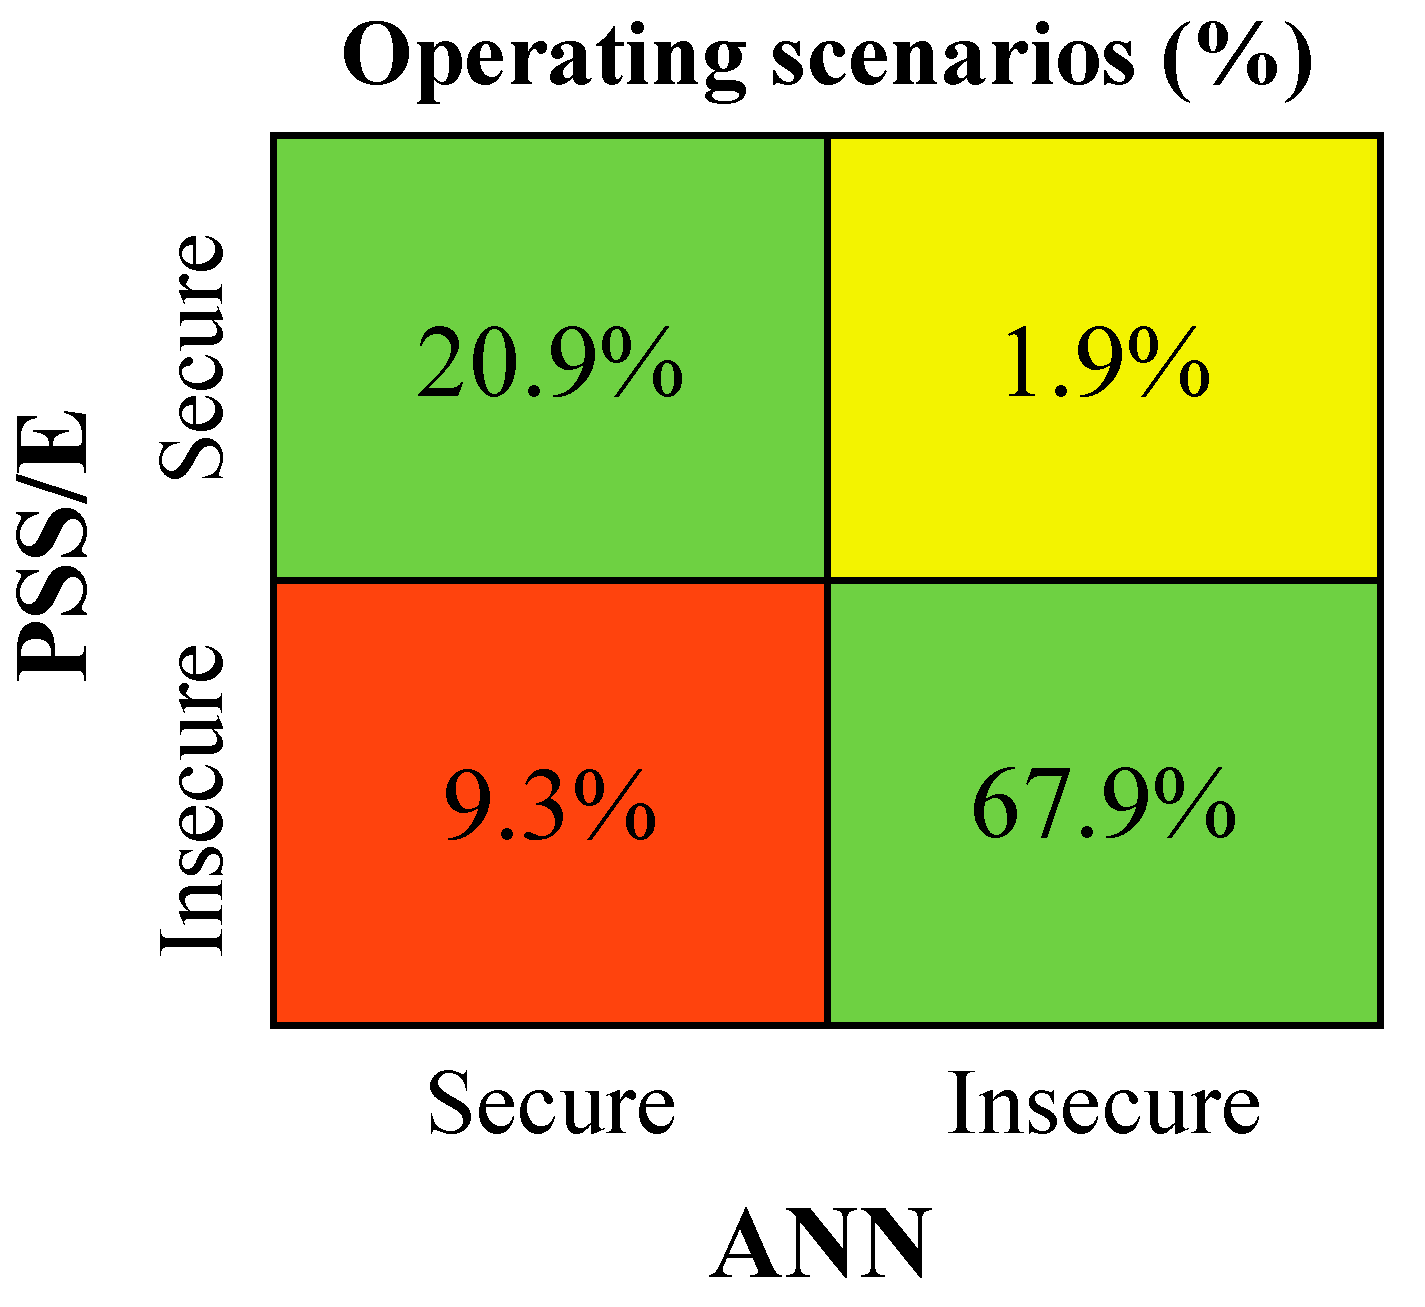
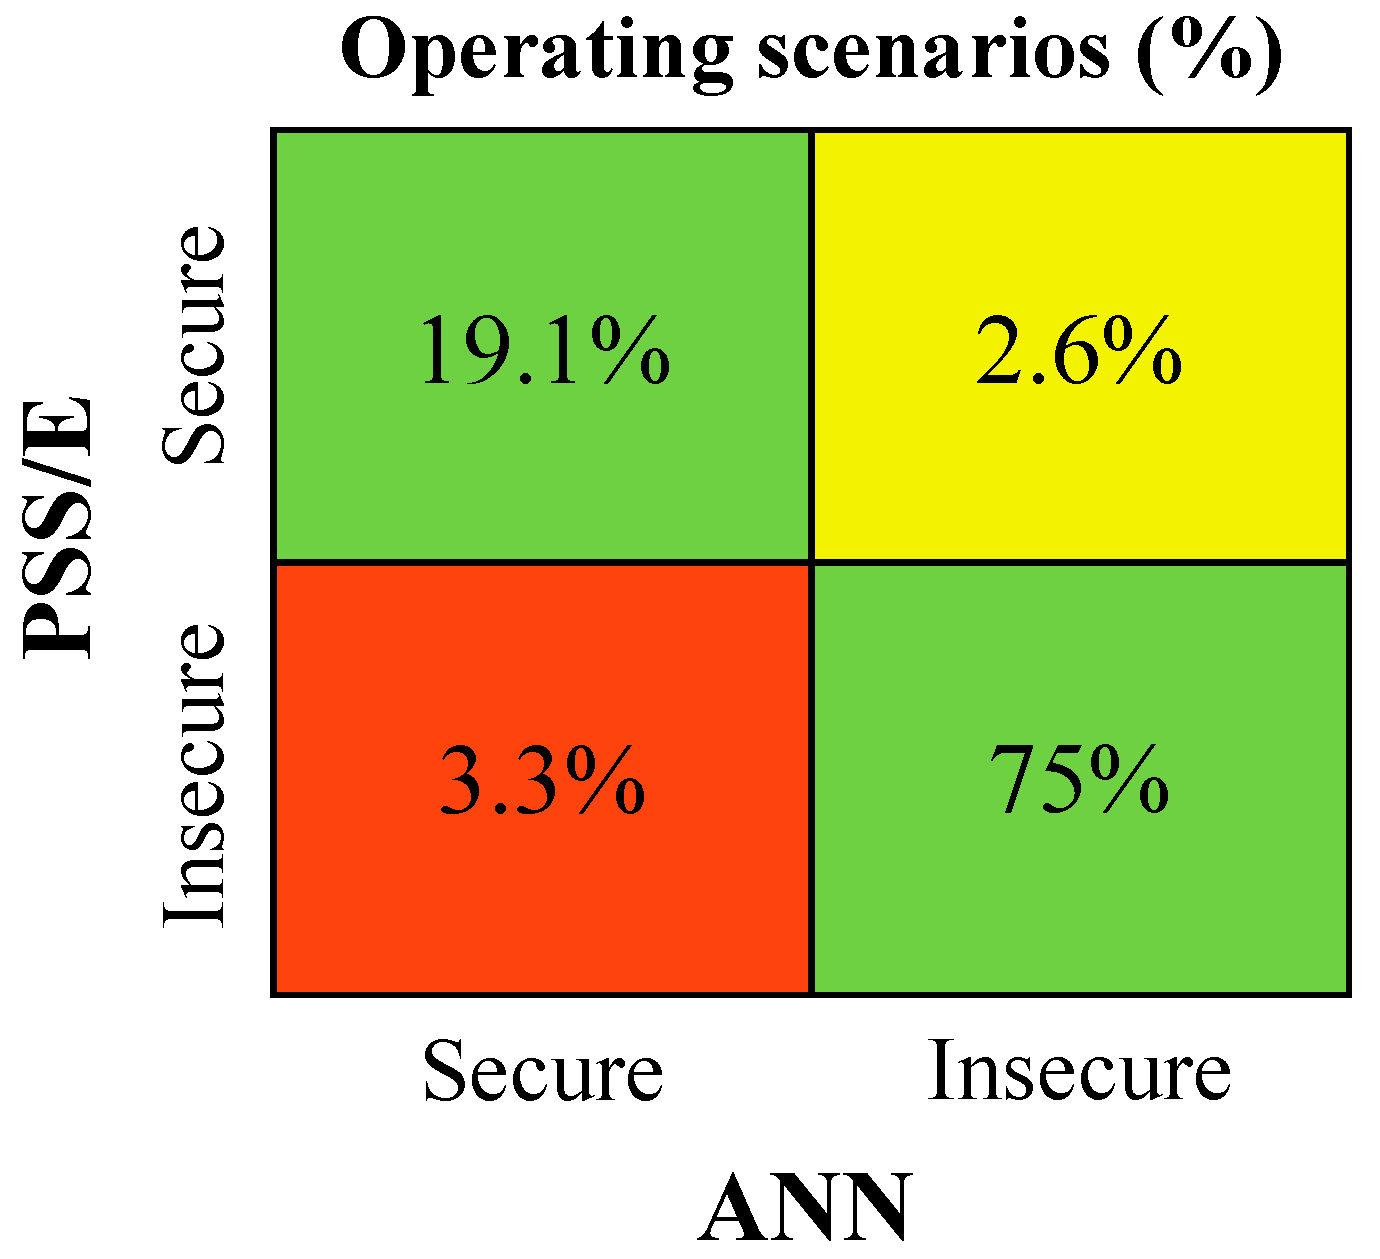
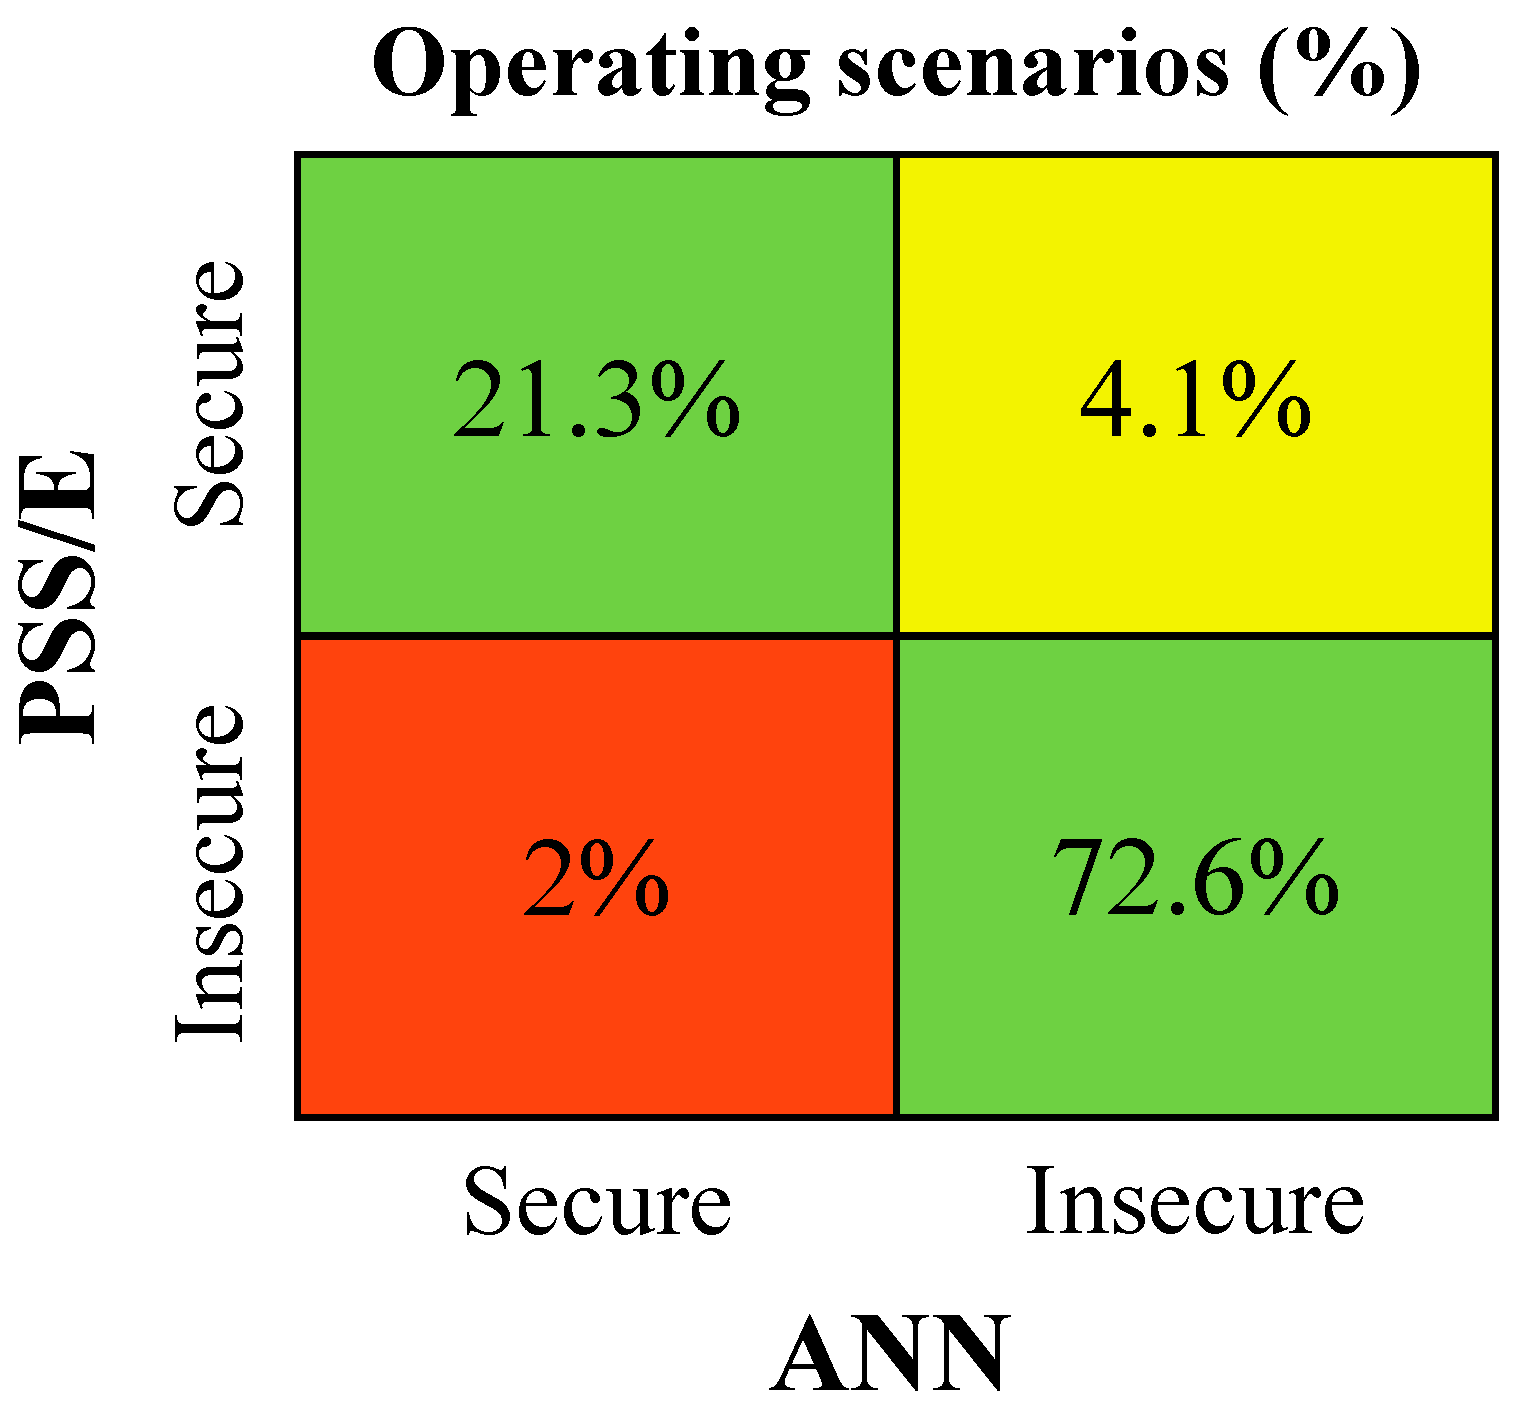
5.1. ANN Performance Evaluation

Regarding the ANN training process, 70% of the generated dataset was used, while 15% was used for validation and 15% for testing. The metric to evaluate the ANN training process was the root mean square error (RMSE)—which is computed in pu. Therefore, the ANN performance, evaluated using the testing dataset, is shown in Table 2.
Figure 13, Figure 14 and Figure 15 show the analysis with respect to the operating scenarios’ dynamic security classification. The green squares represent operating scenarios which were correctly classified by the ANN, representing 88.8–94.1% of the considered scenarios, depending on the disturbance event. In contrast, the yellow and red squares represent operating scenarios with prediction errors, which resulted in a wrong classification. However, the yellow squares represent scenarios which were classified as secure according to the PSS/E results and insecure by the ANN predictions. Despite the ANN prediction error, such cases will not jeopardize the dynamic stability of the system during its operation, in contrast to the red squares, which consists of false negative results. In such cases, the network is susceptible to dynamic security instability during its operation. In Figure 13, a considerable percentage of false negative predictions by the ANN was observed (9.3%). However, this security classification error does not necessarily reflect large errors in the ANN capability for inferring key frequency metrics for each scenario. For this particular case, the PSS/E dynamic simulation results of many scenarios were very close to the security boundaries (49.4 Hz and −2 Hz/s). In such cases, even a small ANN prediction error led directly to a wrong ANN dynamic security classification.

5.2. Influence of the Fault Location in the Dynamic Stability

In order to demonstrate the influence of the fault location on the dynamic stability, five distinct scenarios were selected from the testing set defined in Section 4.2. The scenarios’ characteristics are presented in Table 3 (note that SCs were not considered, and the inertia constant was converted for the system base power—100 MVA).
The results for the three ANNs (see Section 4.2) are presented in Table 4, Table 5 and Table 6 (the lines in red indicate that frequency violations occurred). Therefore, it was evidenced that there was no trend in the system dynamic response (e.g., in scenario 1 there was a frequency violation only for a network fault occurring in B9, while in scenario 4 the same occurred only for a network fault in the line connecting B1–B2). Hence, it was concluded that the short-circuits occurring in different grid locations could lead to different conclusions regarding the frequency dynamics. Moreover, a small error in the ANN output for each disturbance was observed with respect to the results computed using the full dynamic model of the Rhodes network.

5.3. Minimum Synchronous Inertia Evaluation

In this section the performance of the proposed algorithm to compute the minimum synchronous inertia to be added to the system is evaluated, as presented in Section 4.3. Therefore, for the cases of Section 5.2 (Table 4, Table 5 and Table 6), the minimum capacity of synchronous inertia which is required to secure the system was calculated, with the corresponding results presented in Table 7. Note that “Sc” refers to the considered scenario (see Table 3), “Ev” refers to the event number (see Table 2), SCad is the minimum required amount of SC capacity (a), H a d is the correspondent SC inertia constant (considering a 100 MVA system base power) and Htotal is the correspondent case total inertia (also in the 100 MVA system base power). Thus, for each scenario and for each disturbance event, the minimum capacity of additional synchronous inertia required to comply with the system frequency metrics are presented (note that only the final result of the iterative process described in Figure 12 is shown). Note that the final solution for each scenario—the row in the event “All” corresponds to the worst-case event—indicates the amount of inertia that should be effectively dispatched for each scenario.
The network dynamic behavior of event 1 (150 ms short-circuit occurring in the line connecting B1 and B2) occurring in scenario 5, computed using the full dynamic model of the Rhodes network, is presented in Figure 16. As observed, the scheduling of 23.74 MVA of additional SC capacity successfully contained the network frequency within the prescribed limits. In this case, a lower regulation effort to the BESS and to the thermal unit in operation was required.

6. Conclusions

In this work, we presented a novel approach for the quantification of the minimum synchronous inertia in isolated power systems with high integration of CI-RESs. As demonstrated, in operating scenarios with large shares of CI-RESs, short-circuits should be considered as the reference disturbance regarding the frequency stability. It was also verified that network faults in different locations could lead to distinct results with regard to the considered frequency indicators for the system stability assessment. Furthermore, in such conditions, BESSs may not be suitable to contain the observed frequency dynamics, thus requiring additional synchronous inertia to be used as a complementary resource. Taking the power system of Rhodes island as a case study, different ANN structures capable of inferring key frequency indicators were developed and trained offline, each one aiming to emulate the response of the full dynamic model of the Rhodes network following a specific contingency event. In the case of insecure operating conditions, the minimum amount of additional synchronous inertia which moves the system towards its dynamic security domain was quantified. This was done by computing the sensitivity of the ANN outputs with respect to the input defining the SC inertia.
The obtained results demonstrated that the proposed approach can provide an effective contribution of using SCs to secure frequency dynamics in isolated power grids rather than in operating conditions with increasing shares of CI-RESs. The performance of the obtained results needs to be further investigated with respect to the boundaries of the security region, where a slight lower performance of the ANN structure regarding the missed classification of insecure operating conditions was identified. Future research will address the development of dynamic security constrained unit commitment/economic dispatching tools considering frequency indicators as constraints to be evaluated by the ANN tool and inclusion of forecasts for both renewable generation and loads.

Author Contributions

J.G.: investigation, methodology, writing—original draft preparation. C.L.M.: conceptualization, methodology, writing—review and editing, supervision. J.A.P.L.: conceptualization, writing—review and editing, supervision. All authors have read and agreed to the published version of the manuscript.

Funding

This research was funded by the European Union’s Horizon 2020 program under the project Smart4RES, grant agreement number 864337.

Institutional Review Board Statement

Not applicable.

Informed Consent Statement

Not applicable.

Data Availability Statement

The data are unavailable due to confidentiality issues associated with the Smart4RES project, in which this work was developed.

Conflicts of Interest

The authors declare no conflict of interest. The funders had no role in the design of the study; in the collection, analyses or interpretation of data; in the writing of the manuscript; or in the decision to publish the results.

References

  1. Vasconcelos, H.; Moreira, C.; Madureira, A.; Lopes, J.P.; Miranda, V. Advanced Control Solutions for Operating Isolated Power Systems: Examining the Portuguese Islands. IEEE Electrif. Mag. 2015, 3, 25–35. [Google Scholar] [CrossRef]
  2. Margaris, I.D.; Papathanassiou, S.A.; Hatziargyriou, N.D.; Hansen, A.D.; Sorensen, P. Frequency Control in Autonomous Power Systems with High Wind Power Penetration. IEEE Trans. Sustain. Energy 2012, 3, 189–199. [Google Scholar] [CrossRef]
  3. Lagos, D.T.; Hatziargyriou, N.D. Data-Driven Frequency Dynamic Unit Commitment for Island Systems With High RES Penetration. IEEE Trans. Power Syst. 2021, 36, 4699–4711. [Google Scholar] [CrossRef]
  4. Psarros, G.N.; Karamanou, E.G.; Papathanassiou, S.A. Feasibility Analysis of Centralized Storage Facilities in Isolated Grids. IEEE Trans. Sustain. Energy 2018, 9, 1822–1832. [Google Scholar] [CrossRef]
  5. Beires, P.P.; Moreira, C.L.; Lopes, J.P.; Figueira, A.G. Defining connection requirements for autonomous power systems. IET Renew. Power Gener. 2019, 14, 3–12. [Google Scholar] [CrossRef]
  6. Gu, H.; Yan, R.; Saha, T.K. Minimum Synchronous Inertia Requirement of Renewable Power Systems. IEEE Trans. Power Syst. 2017, 33, 1533–1543. [Google Scholar] [CrossRef] [Green Version]
  7. Vasconcelos, H.; Fidalgo, J.N.; Lopes, J.A.P. A General Approach for Security Monitoring and Preventive Control of Networks with Large Wind Power Production. In Proceedings of the Power Systems Computation Conference (PSCC), Seville, Spain, 24–28 June 2002. [Google Scholar]
  8. Karapidakis, E.; Hatziargyriou, N. Online preventive dynamic security of isolated power systems using decision trees. IEEE Trans. Power Syst. 2002, 17, 297–304. [Google Scholar] [CrossRef]
  9. O’Sullivan, J.; O’Malley, M. A new methodology for the provision of reserve in an isolated power system. IEEE Trans. Power Syst. 1999, 14, 519–524. [Google Scholar] [CrossRef]
  10. Hatziargyriou, N.; Saenz, J.R.; Criado, R.; Rehtanz, C.; Handschin, E.; Caldecott, R.; Mazon, A.J.; Sebo, S.A.; Ostolaza, J.X.; Allan, R.N.; et al. Preliminary results from the More Advanced Control Advice Project for secure operation of isolated power systems with increased renewable energy penetration and storage. In Proceedings of the 2001 IEEE Porto Power Tech Proceedings, Porto, Portugal, 10–13 September 2001; Volume 4. [Google Scholar]
  11. Zhang, R.; Xu, Y.; Dong, Z.Y.; Meng, K.; Xu, Z. Intelligent systems for power system dynamic security assessment: Review and classification. In Proceedings of the 2011 4th International Conference on Electric Utility Deregulation and Restructuring and Power Technologies (DRPT), Weihai, China, 6–9 July 2011; pp. 134–139. [Google Scholar]
  12. Sun, K.; Likhate, S.; Vittal, V.; Kolluri, V.S.; Mandal, S. An Online Dynamic Security Assessment Scheme Using Phasor Measurements and Decision Trees. IEEE Trans. Power Syst. 2007, 22, 1935–1943. [Google Scholar] [CrossRef]
  13. Liu, C.; Sun, K.; Rather, Z.H.; Chen, Z.; Bak, C.L.; Thogersen, P.; Lund, P. A Systematic Approach for Dynamic Security Assessment and the Corresponding Preventive Control Scheme Based on Decision Trees. IEEE Trans. Power Syst. 2013, 29, 717–730. [Google Scholar] [CrossRef]
  14. Trovato, V.; Bialecki, A.; Dallagi, A. Unit Commitment with Inertia-Dependent and Multispeed Allocation of Frequency Response Services. IEEE Trans. Power Syst. 2019, 34, 1537–1548. [Google Scholar] [CrossRef]
  15. Zhang, Z.; Du, E.; Teng, F.; Zhang, N.; Kang, C. Modeling Frequency Dynamics in Unit Commitment with a High Share of Renewable Energy. IEEE Trans. Power Syst. 2020, 35, 4383–4395. [Google Scholar] [CrossRef]
  16. Ahmadi, H.; Ghasemi, H. Security-Constrained Unit Commitment with Linearized System Frequency Limit Constraints. IEEE Trans. Power Syst. 2014, 29, 1536–1545. [Google Scholar] [CrossRef]
  17. Badesa, L.; Teng, F.; Strbac, G. Simultaneous Scheduling of Multiple Frequency Services in Stochastic Unit Commitment. IEEE Trans. Power Syst. 2019, 34, 3858–3868. [Google Scholar] [CrossRef] [Green Version]
  18. Fernández-Guillamón, A.; Sarasúa, J.I.; Chazarra, M.; Vigueras-Rodríguez, A.; Muñoz, D.F.; Molina-García, A. Frequency control analysis based on unit commitment schemes with high wind power integration: A Spanish isolated power system case study. Int. J. Electr. Power Energy Syst. 2020, 121, 106044. [Google Scholar] [CrossRef]
  19. Wen, Y.; Li, W.; Huang, G.; Liu, X. Frequency Dynamics Constrained Unit Commitment with Battery Energy Storage. IEEE Trans. Power Syst. 2016, 31, 5115–5125. [Google Scholar] [CrossRef]
  20. Paturet, M.; Markovic, U.; Delikaraoglou, S.; Vrettos, E.; Aristidou, P.; Hug, G. Stochastic Unit Commitment in Low-Inertia Grids. IEEE Trans. Power Syst. 2020, 35, 3448–3458. [Google Scholar] [CrossRef] [Green Version]
  21. O’Sullivan, J.; Rogers, A.; Flynn, D.; Smith, P.; Mullane, A.; O’Malley, M. Studying the Maximum Instantaneous Non-Synchronous Generation in an Island System—Frequency Stability Challenges in Ireland. IEEE Trans. Power Syst. 2014, 29, 2943–2951. [Google Scholar] [CrossRef] [Green Version]
  22. Du, P.; Matevosyan, J. Forecast System Inertia Condition and Its Impact to Integrate More Renewables. IEEE Trans. Smart Grid 2018, 9, 1531–1533. [Google Scholar] [CrossRef]
  23. Li, W.; Du, P.; Lu, N. Design of a New Primary Frequency Control Market for Hosting Frequency Response Reserve Offers From Both Generators and Loads. IEEE Trans. Smart Grid 2018, 9, 4883–4892. [Google Scholar] [CrossRef]
  24. Ratnam, K.S.; Palanisamy, K.; Yang, G. Future low-inertia power systems: Requirements, issues, and solutions-A review. Renew. Sustain. Energy Rev. 2020, 124, 109773. [Google Scholar] [CrossRef]
  25. Beires, P.; Vasconcelos, M.H.; Moreira, C.L.; Peças Lopes, J.A. Stability of autonomous power systems with reversible hydro power plants: A study case for large scale renewables integration. Electr. Power Syst. Res. 2018, 158, 1–14. [Google Scholar] [CrossRef]
  26. Australian Energy Market Operator (AEMO). Renewable Integration Study Stage 1 Report. Appendix B: Frequency Control; AEMO: Sydney, Australia, 2020. [Google Scholar]
  27. Power Engineering International; ABB. Webinar: Deploying Synchronous Condensers to Boost Grid Quality and Resilience; ABB: Zürich, Switzerland, 2019. [Google Scholar]
  28. Kingma, D.P.; Ba, J.L. Adam: A Method for Stochastic Optimization. In Proceedings of the International Conference on Learning Representations (ICLR) 2015, San Diego, CA, USA, 7–9 May 2015. [Google Scholar]
Figure 1. Single-line diagram of the Rhodes power system.
Electricity 04 00008 g001
Figure 2. Sorted annual load and net load diagram.
Electricity 04 00008 g002
Figure 3. BESS capacity influence: system response in operating scenario 1.
Electricity 04 00008 g003
Figure 4. BESS capacity influence: system response in operating scenario 2.
Electricity 04 00008 g004
Figure 5. Synchronous condensers influence: system response in operating scenario 1.
Electricity 04 00008 g005
Figure 6. Synchronous condensers influence: system response in operating scenario 2.
Electricity 04 00008 g006
Figure 7. Influence of disturbance type and location in operating scenario 1.
Electricity 04 00008 g007
Figure 8. Influence of disturbance type and location in operating scenario 2.
Electricity 04 00008 g008
Figure 9. Overview of dynamic simulation results for all the scenarios regarding frequency behavior.
Electricity 04 00008 g009
Figure 10. Distribution of synchronous condensers installed capacity for each type of disturbance.
Electricity 04 00008 g010
Figure 11. Artificial neural network architecture.
Electricity 04 00008 g011
Figure 12. Preventive control algorithm flowchart applied to each artificial neural network.
Electricity 04 00008 g012
Figure 13. PSS/E vs. ANN dynamic security classification comparison: event 1.
Electricity 04 00008 g013
Figure 14. PSS/E vs. ANN dynamic security classification comparison: event 2.
Electricity 04 00008 g014
Figure 15. PSS/E vs. ANN dynamic security classification comparison: event 3.
Electricity 04 00008 g015
Figure 16. Network dynamic response following event 1 in scenario 5: effect of dispatching the minimum amount of SC.
Electricity 04 00008 g016
Table 1. Thermal units’ characteristics.
Thermal UnitS (MVA) P m i n / P m a x   (MW) H (s)Merit Order
S. S1–S2207/14.23.821, 15
S. D1–D215.353.07/11.12.4510–11
S. D3–D529.354.99/19.11.67412–14
S. G126.752.94/20.063.1816
S. G239.85.17/27.86317
S. G326.252.89/19.952.518
S. G447.55.23/27.61.52
S.R. D1–D721.3455.8/17.123–9
Table 2. Artificial neural network performance.
EventDescriptionRMSE
(RoCoF)
RMSE
(Nadir)
1Short-circuit: B1–B2 line0.00470.0023
2Short-circuit: B120.00360.0019
3Short-circuit: B90.00370.0020
Table 3. Scenarios analyzed.
ScenarioLoad (MW)Wind (MW)PV (MW)Inertia (s)
17642.429.31.48
251.7334.11.48
3122.748.4311.9
483.631.422.3
554.339.46.30.76
Table 4. Short-circuit occurring in B1–B2 line.
ScenarioANNPSS/E
RoCoF (Hz/s)Nadir (Hz)RoCoF (Hz/s)Nadir (Hz)
1−1.5149.75−1.549.68
2−0.8249.77−0.9749.78
3−3.6448.98−3.8448.83
4−2.2449.69−2.3749.64
5−3.2448.45−3.5448.43
Table 5. Short-circuit occurring in bus B12.
ScenarioANNPSS/E
RoCoF (Hz/s)Nadir (Hz)RoCoF (Hz/s)Nadir (Hz)
1−1.2349.4−1.249.4
2−1.6149.21−1.5849.21
3−2.248.91−2.2648.87
4−0.8549.59−0.8749.57
5−3.6348.18−4.4148.07
Table 6. Short-circuit occurring in bus B9.
ScenarioANNPSS/E
RoCoF (Hz/s)Nadir (Hz)RoCoF (Hz/s)Nadir (Hz)
1−1.4349.29−1.549.25
2−1.6849.17−1.6449.18
3−1.4849.26−1.6249.19
4−0.849.6−0.7649.62
5−3.7348.12−4.6247.96
Table 7. Minimum synchronous inertia calculation.
ScEv H t o t a l (s) H a d (s) S C a d (MVA) RoCoF (Hz/s)Nadir (Hz)
111.4800−1.5149.75
21.4800−1.2349.4
31.490.0080.12−1.5149.75
All1.490.0080.12
211.4800−0.8249.77
21.490.0120.17−0.8249.77
31.490.0140.2−0.8249.76
All1.490.0140.2
313.591.6924.17−1.9249.4
23.571.6723.86−1.9349.4
33.231.3318.95−1.9349.4
All3.591.6924.17
412.680.385.39−249.68
22.300−0.8549.59
32.300−0.849.6
All2.680.385.39
512.421.6623.74−1.2649.4
22.421.6623.73−1.2649.4
32.081.3218.84−1.2649.4
All2.421.6623.74
Disclaimer/Publisher’s Note: The statements, opinions and data contained in all publications are solely those of the individual author(s) and contributor(s) and not of MDPI and/or the editor(s). MDPI and/or the editor(s) disclaim responsibility for any injury to people or property resulting from any ideas, methods, instructions or products referred to in the content.

