1. Introduction
There is general agreement that lithium ion (Lion) EV batteries should be replaced once they degraded to less than about 70–80% [
1] of their original capacity. Eventually these used batteries will be recycled, but before that time, they can provide several years of service in energy storage applications.
Vast numbers of these batteries will be available in a few years [
1,
2,
3,
4,
5], and there is great interest in exploiting this second life (SL) market. It is estimated by [
1] that by 2030, the SL battery capacity will exceed 275 GWh worldwide, and there will be over 6 million EV batteries retiring from electric cars, buses, vans, and trucks.
However, a SL battery may have very different properties than it did in the original EV. In particular, it is predicted that the spread in cell capacities will be much wider than it was in the EV, but published data showing the actual size of this spread is very sparse. In fact, the only example found by the authors that was based on real-time data is
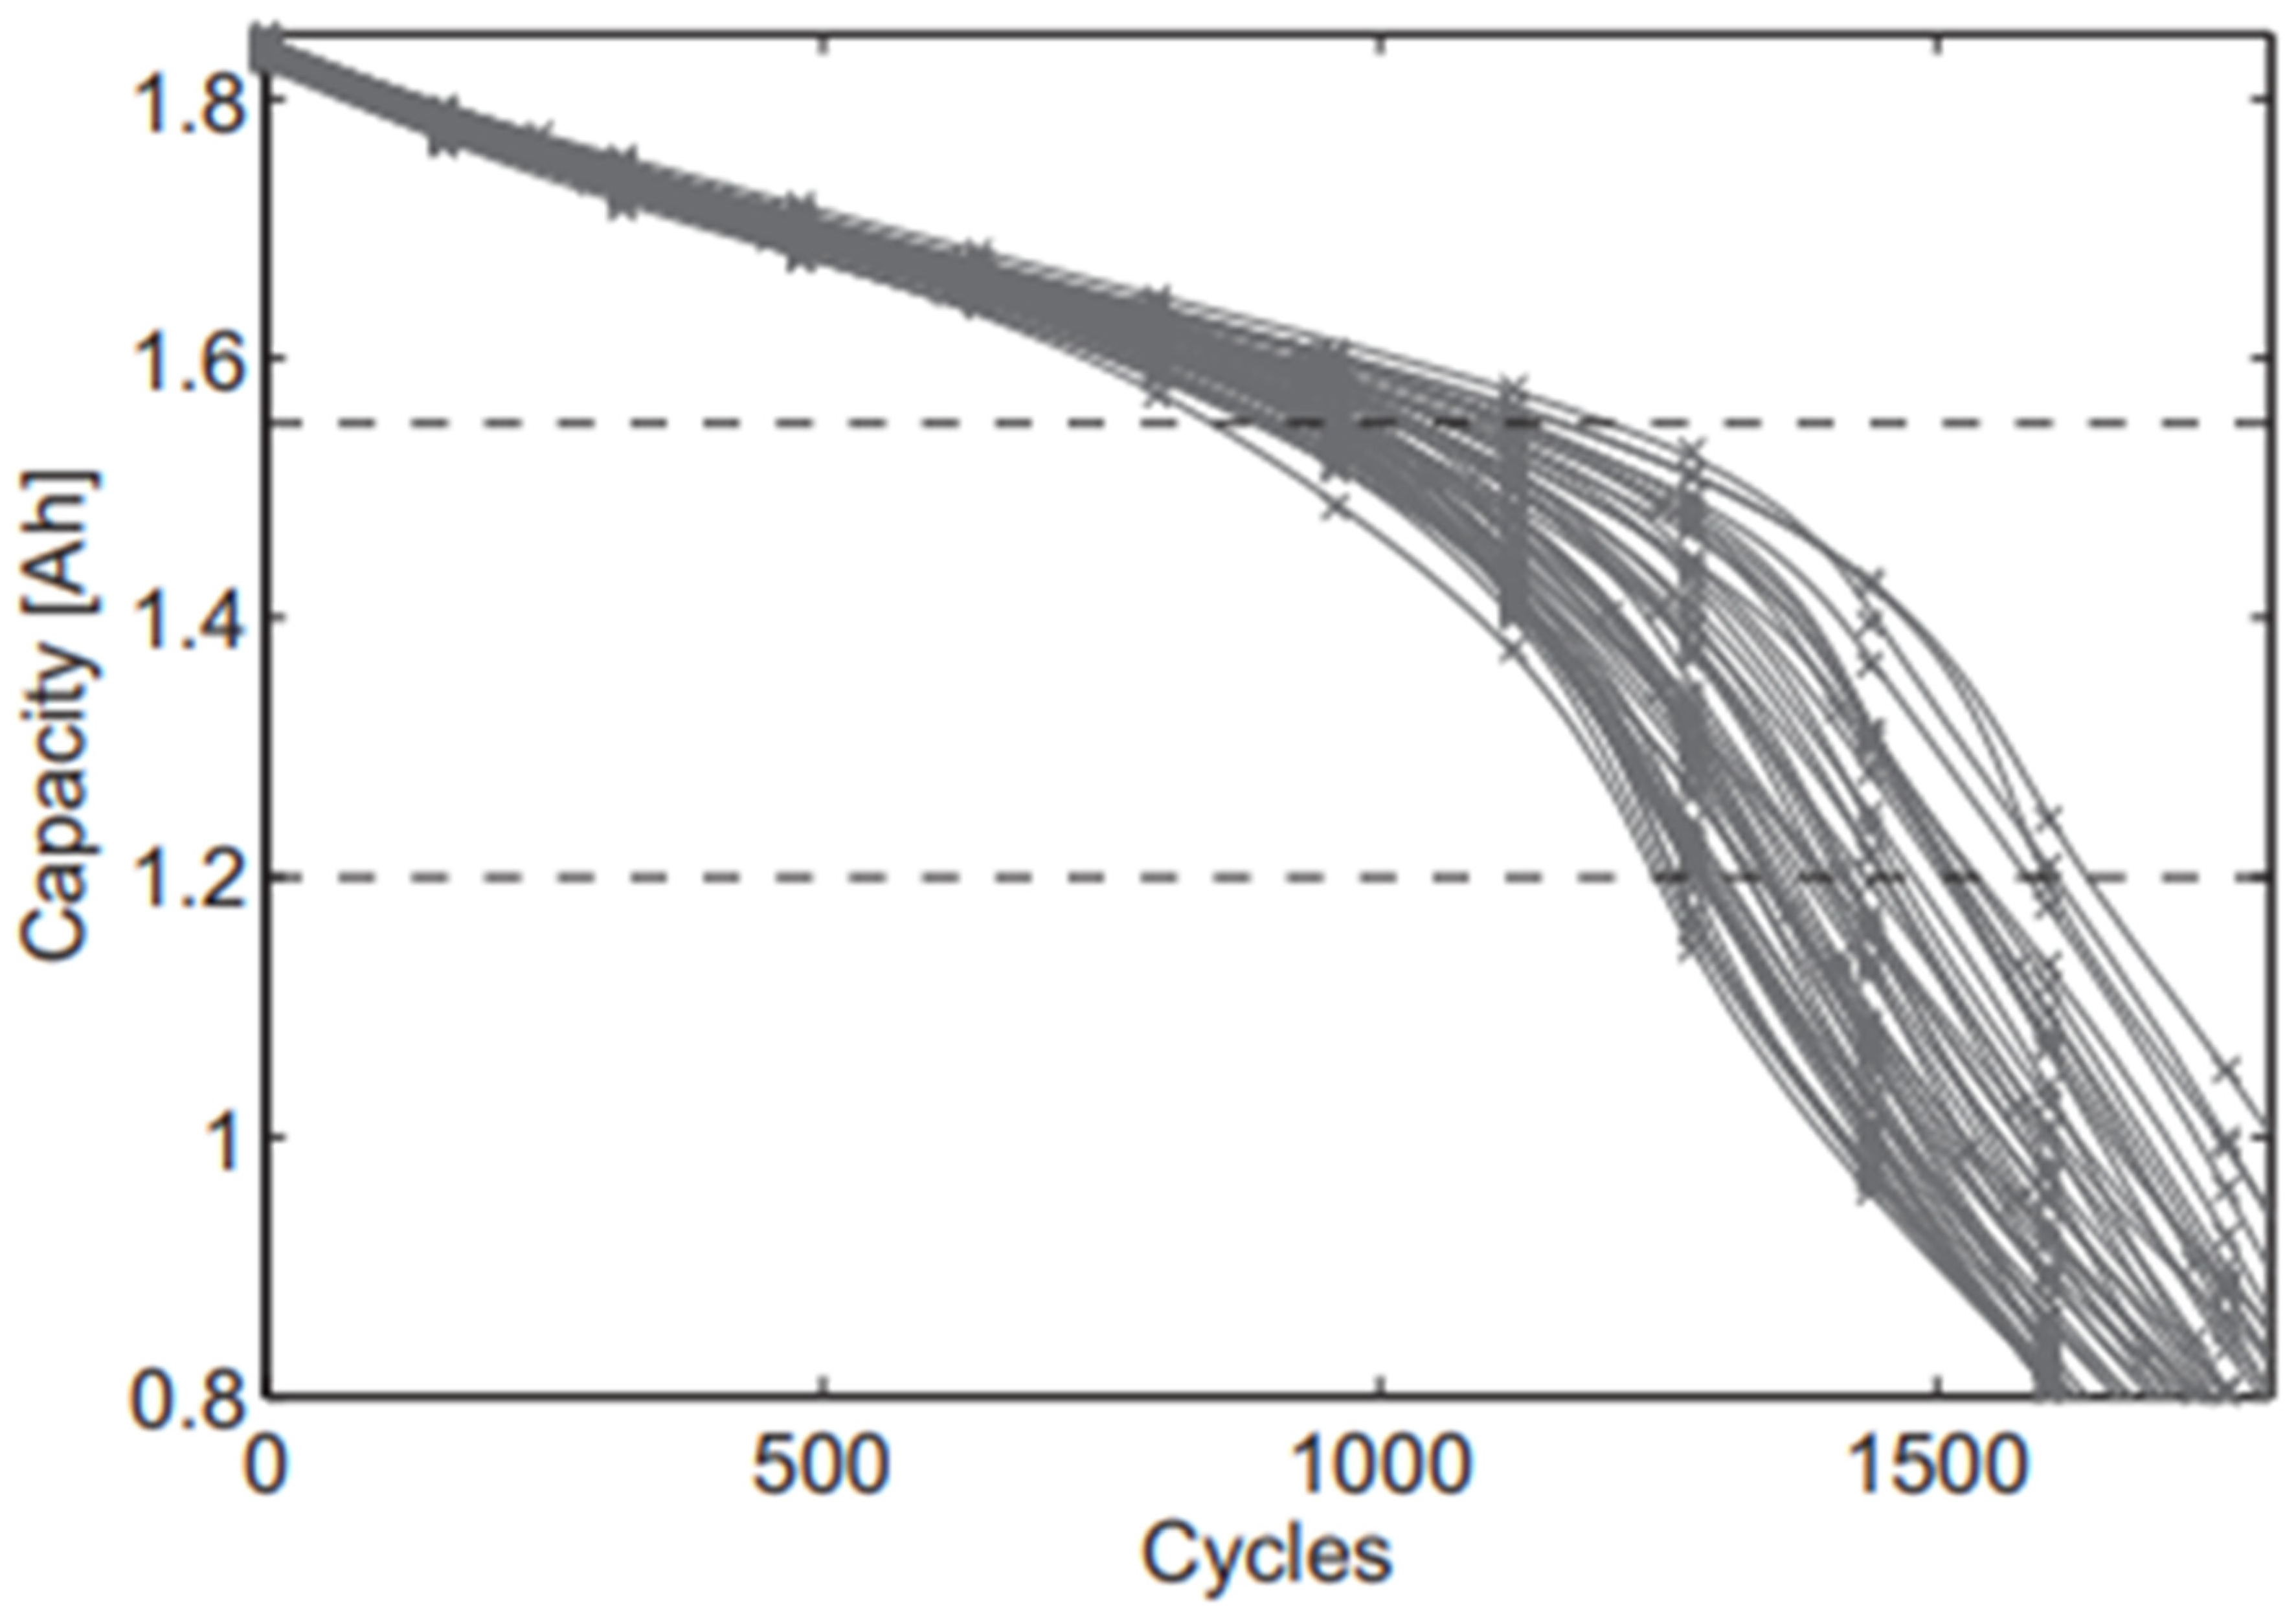
Figure 1 from [
6], which shows the results of a charge/discharge life test for 48 Sanyo/Panasonic UR18650E NMC cells. However, [
7] also shows a similar estimated plot, but not based on actual data, and [
8] shows results from an accelerated life test.
Although the plots in
Figure 1 are not based on an EV battery, the portion above 1.55 Ah might represent the EV region of operation and that between 1.55 and 1.2 Ah might be the SL region. The progressive reduction in the cell capacities is caused by capacity fade (CF), and the capacity spread becomes much larger in the SL region.
To reduce cost, the majority of EVs use a passive cell voltage equalizer (PEQ), which means that the battery capacity is equal to that of the worst cell in the pack. PEQs do an adequate job of compensating for differences in cell self-discharge (SD), but they do nothing to reduce CF since they cannot transfer charge between cells. Charge transfer requires an active equalizer (AEQ) or an AEQ/PEQ hybrid (HEQ) which is a combined AEQ and PEQ. If the EQU is large enough, it can provide a battery capacity close to the average of the cells. This is not much of an advantage in the EV region of
Figure 1 since the capacity spread there is narrow, but it can be very advantageous in the SL region where the spread is much wider. However, past AEQs did not prove to be cost effective, so most SL applications appear to plan to continue to use the original PEQs from the EVs.
However, there now is a more recent HEQ called the bilevel equalizer (BEQ) [
9,
10,
11,
12,
13,
14,
15,
16,
17] that also provides a battery capacity very close to the cell average, and the extra cost appears to be modest. The question is, will the SL capacity increase be enough to justify the extra cost of the BEQ? Before this question can be addressed, it is necessary to obtain some SL capacity plots for actual EV batteries. Unfortunately, obtaining such plots for every cell as in [
6] is very expensive and labor intensive, which probably explains why they are so scarce in the published literature.
However, if the purpose of this data is to decide between a PEQ and a BEQ, it is only necessary to plot the capacities of the worst cell and the cell average, i.e., the plots of the individual cells are not actually required. It will be shown that this can be done with an automated process using a BEQ, and this should greatly reduce the required expense and effort.
Since previous references, such as [
16], described the functionality and advantages of the BEQ, it should be emphasized that this is not the purpose of this present study. The goal here is to present a more efficient method for measuring the minimum and average cell capacities instead of depending on data similar to the more laborious method shown in
Figure 1 from [
6]. A BEQ is used to implement this new measurement method, but this is only a means to an end, since the BEQ was previously reported. However, the functionality of the BEQ is not widely understood, so it is necessary to include some of the BEQ details in order to explain this new measurement method.
2. Passive vs. Bilevel Equalizers
Because of restrictions on the cell voltages, all large Lion batteries require an electronic circuit to keep the voltages of the series connected cells close to the same value. These circuits are called equalizers (EQU) or balancers, and there are three basic types: passive (PEQ), active (AEQ), and hybrids (HEQ). PEQs use very simple resistive circuits that drain the cell voltages until all equal the minimum cell voltage. AEQs achieve equalization by transferring charge between cells or between the cells and another energy source. As expected, HEQs are a combination of PEQs and AEQs.
Lion cells have two main issues that cause cell voltage imbalance: self-discharge (SD) and capacity fade (CF). Differences in SD can cause the cell voltages to gradually diverge to wide extremes, so this must be prevented. All types of cell level EQUs can compensate for SD, but PEQs are almost universally used in EVs because they are adequate and lowest in cost. CF refers to an actual decrease in a cell’s storage capacity due to changes in its composition. Compensating for CF requires charge transfer between the cells while the battery is operating, so a PEQ is ineffective, and an AEQ or HEQ is required.
The cells used to obtain
Figure 1 were tested individually, so SD was not an issue, and the decreases in cell capacity were due to CF. If these cells were used in a battery with a PEQ, the battery capacity would only equal that of the worst cell since a PEQ cannot address CF. A cell level AEQ of adequate size conceivably could compensate for CF and provide a capacity close to the cell average, but AEQs, especially large ones, are very expensive. To address both CF and cost, a more recent type of HEQ, the bilevel EQU (BEQ) [
9,
10,
11,
12,
13,
14,
15,
16,
17] was also shown to provide a battery capacity close to the cell average, and it is much cheaper than an AEQ.
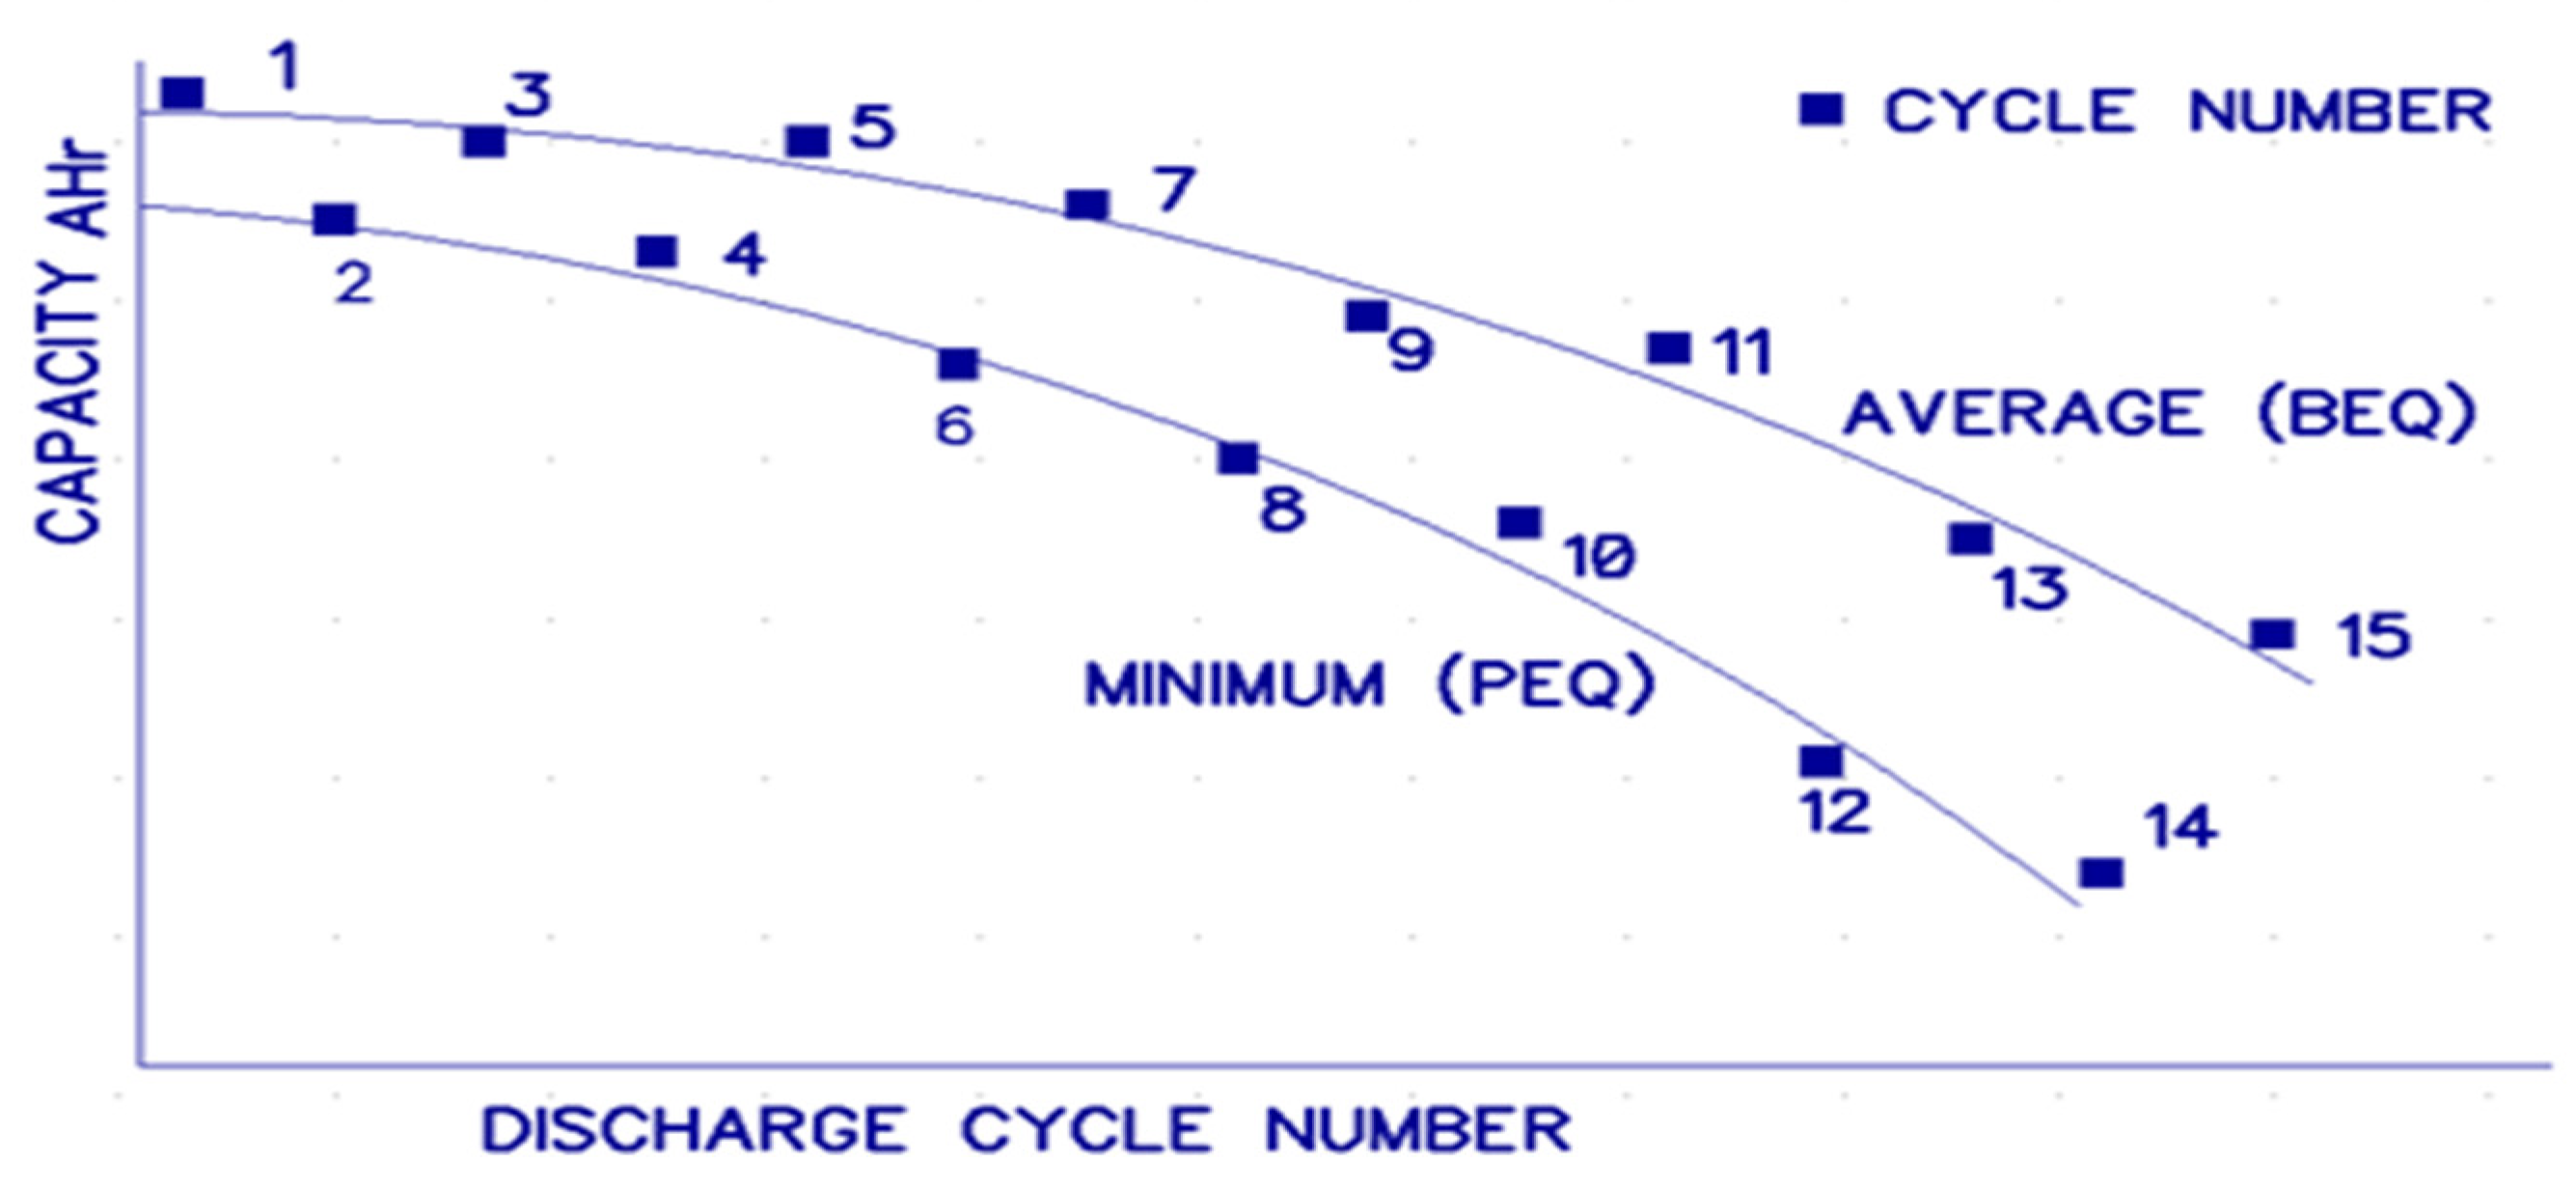
Figure 2 is an approximate diagram showing the EV and SL regions of operation for the minimum, average and maximum cell capacities for a battery. In this case, it is arbitrarily assumed that SL begins at 80% of the original capacity and ends at 40%. The capacity for a battery with a PEQ would follow close to the plot for the worst cell, A, and one with a BEQ would follow close to the average, B, as shown in [
12,
14,
15,
16,
17]. During EV operation plots, A and B are fairly close together and the BEQ would not provide much improvement over a PEQ, but in the SL region the spread between A and B becomes much larger, and the BEQ can provide much higher capacity and lifetime.
It is proposed that two criteria should be used to compare the PEQ vs. the BEQ:
Lifetime, i.e., the number of cycles before the battery capacity reaches its specified minimum, in this example, 40% of the original capacity.
Total capacity cycles (TCC). In this example, the TCC for the PEQ is the summation of the discharge capacities measured at each cycle between 1000 and 1375 cycles in
Figure 2. The TCC for the PEQ is also proportional to the area below curve A over this range. The TCC for the BEQ is the summation of the capacities measured at each cycle between 1000 and 1625 cycles, and it is proportional to the area below curve B. In this example, the BEQ would increase the SL lifetime by 66.7% above that for a PEQ, and the TCC would increase by about 61%. However, these are only hypothetical values since they are not based on an actual battery.
To compare the last example with one based on actual data, we return to the plots from [
6] in
Figure 1. As before, assume the upper dashed line indicates the start of SL operation, and the lower dashed line indicates the end of SL, i.e., SL begins at 1.55 Ah (84% capacity) and ends at 1.2 Ah (65% capacity). A battery with a PEQ would follow the worst cell plot, resulting in a SL lifetime of about 390 cycles. However, if the average is at the center of the 48 plots, a BEQ could provide a lifetime of about 584 cycles, for a 49.7% increase above the PEQ.
Although this second example indicates a BEQ can provide a large increase in SL lifetime, it should be noted that this was not based on an EV battery. Data similar to
Figure 1 for EV batteries will be needed for specifying the proper EQU but obtaining these plots for each cell can be a daunting and expensive task.
As noted earlier, deciding between a PEQ and BEQ for SL does not actually require the capacity for each cell, since all that is needed are plots of the minimum and average cell capacities in the SL region. If the capacity spread between the minimum and average is small, a PEQ may be adequate, but if it is large, a BEQ can greatly improve battery performance.
Regardless of whether a PEQ or a BEQ is chosen for a SL application, the EQU does not have to be a recurring cost. For instance, if a BEQ is used, it does not have to be replaced when its battery is eventually replaced, i.e., the same BEQ can be used over and over with future batteries.
3. Bilevel Equalizer Operation
The BEQ is a PEQ/AEQ hybrid that operates at two different voltage levels, hence the name, “bilevel”. The battery cells are divided into individual sections, each with a few series connected cells, as shown by the block diagram in
Figure 3 for a battery with 4 sections. Each section typically consists of 4 to 8 cells, but larger numbers also can be used. Each section also has a separate PEQ to equalize its own cells, and the section voltages are equalized by AEQs. Therefore, PEQs compensate for SD at the cell voltage level, and AEQs compensate for CF at the section voltage level. However, to achieve CF compensation, the AEQs must be operated while the battery is being charged and discharged.
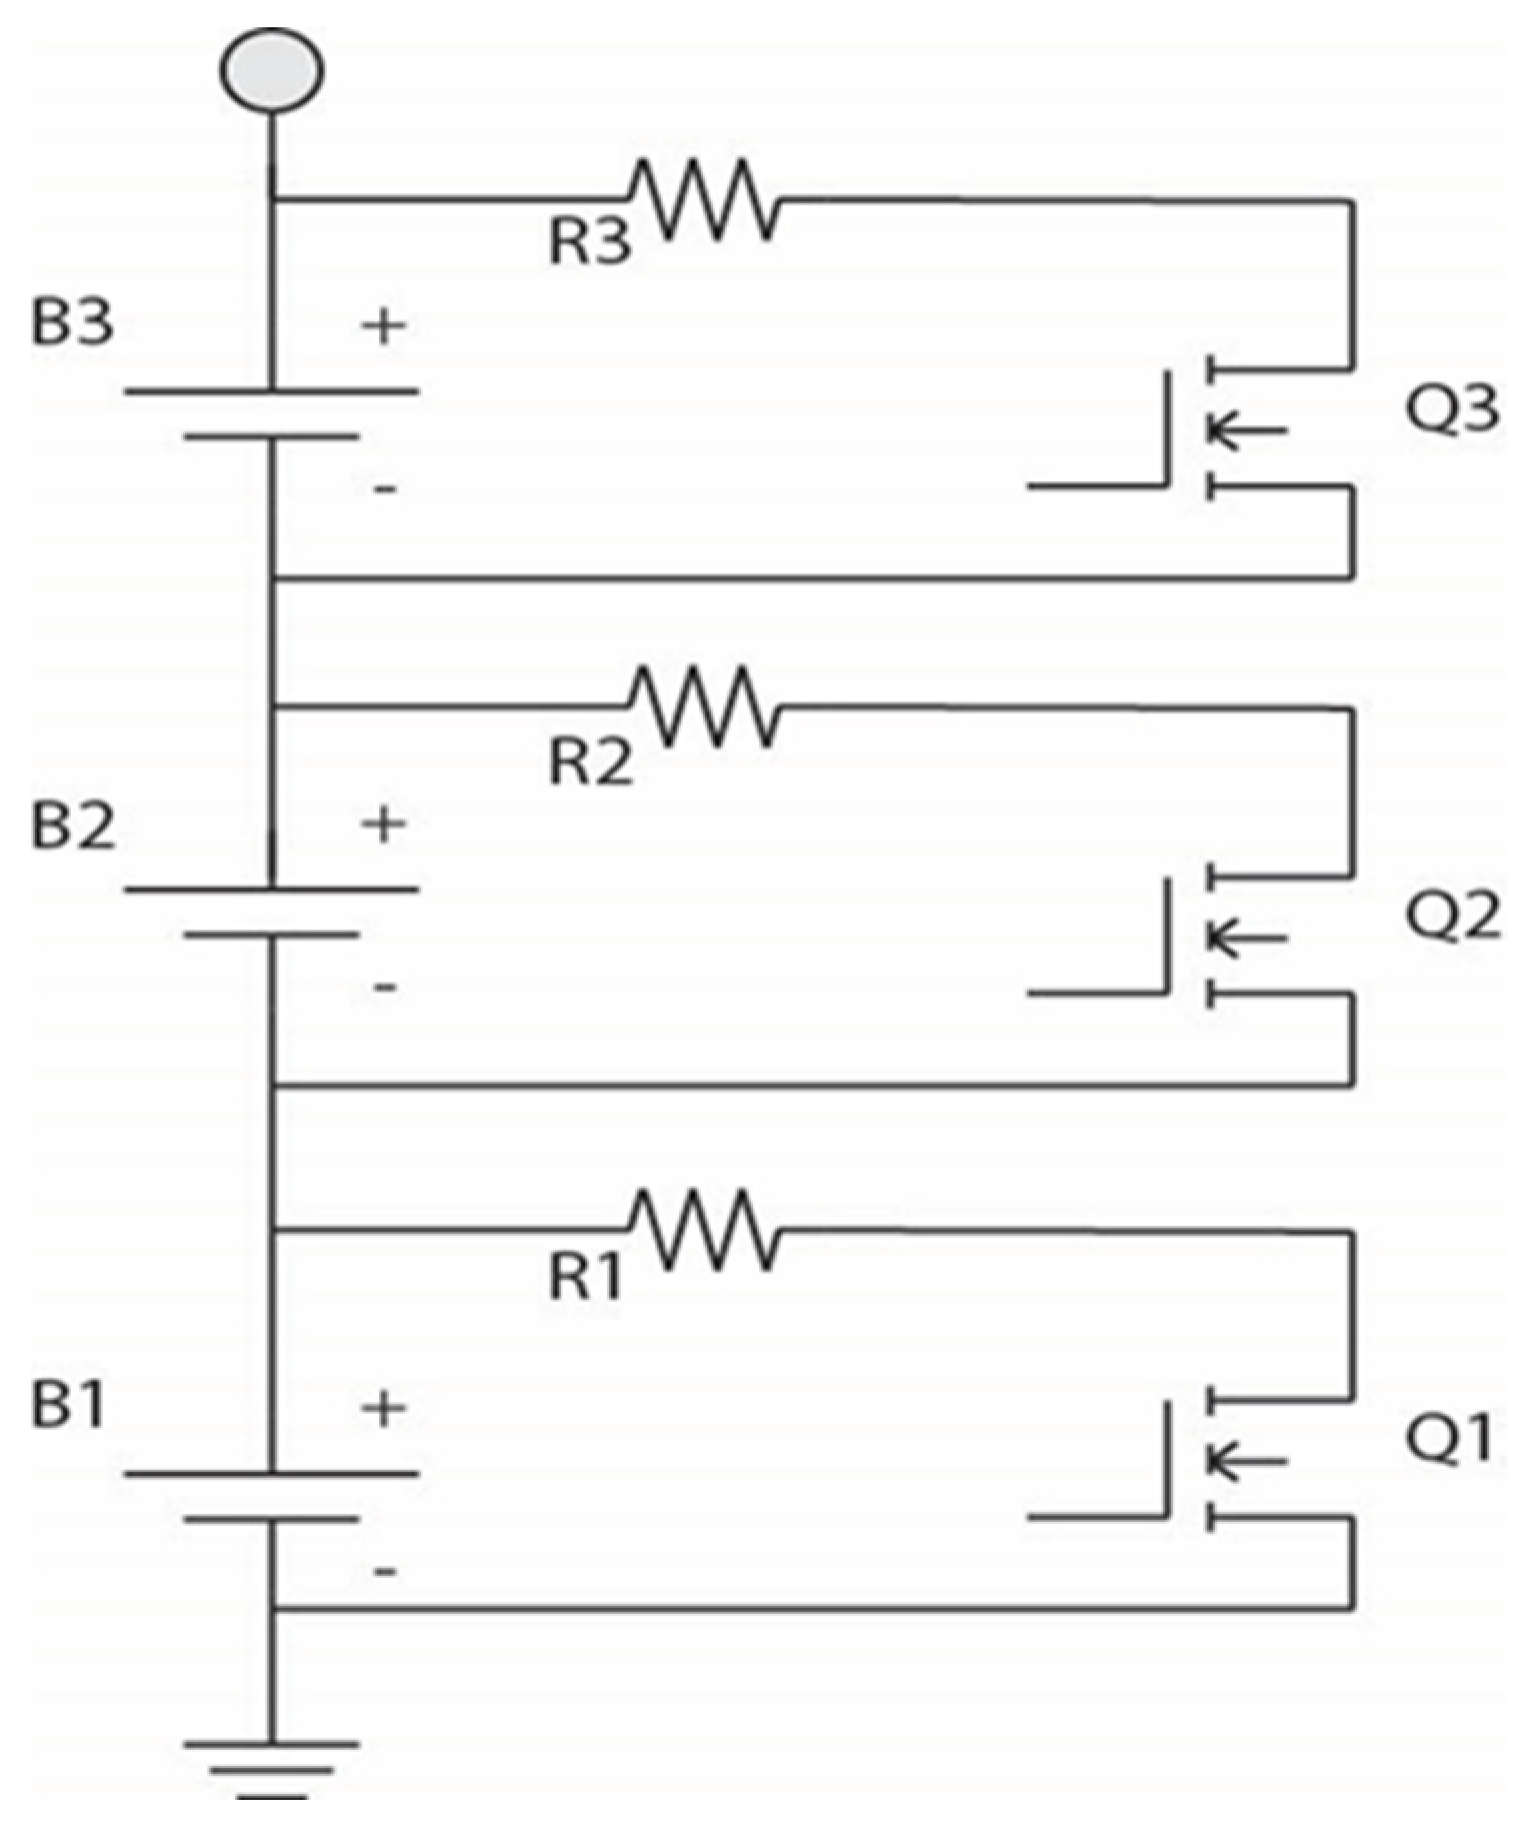
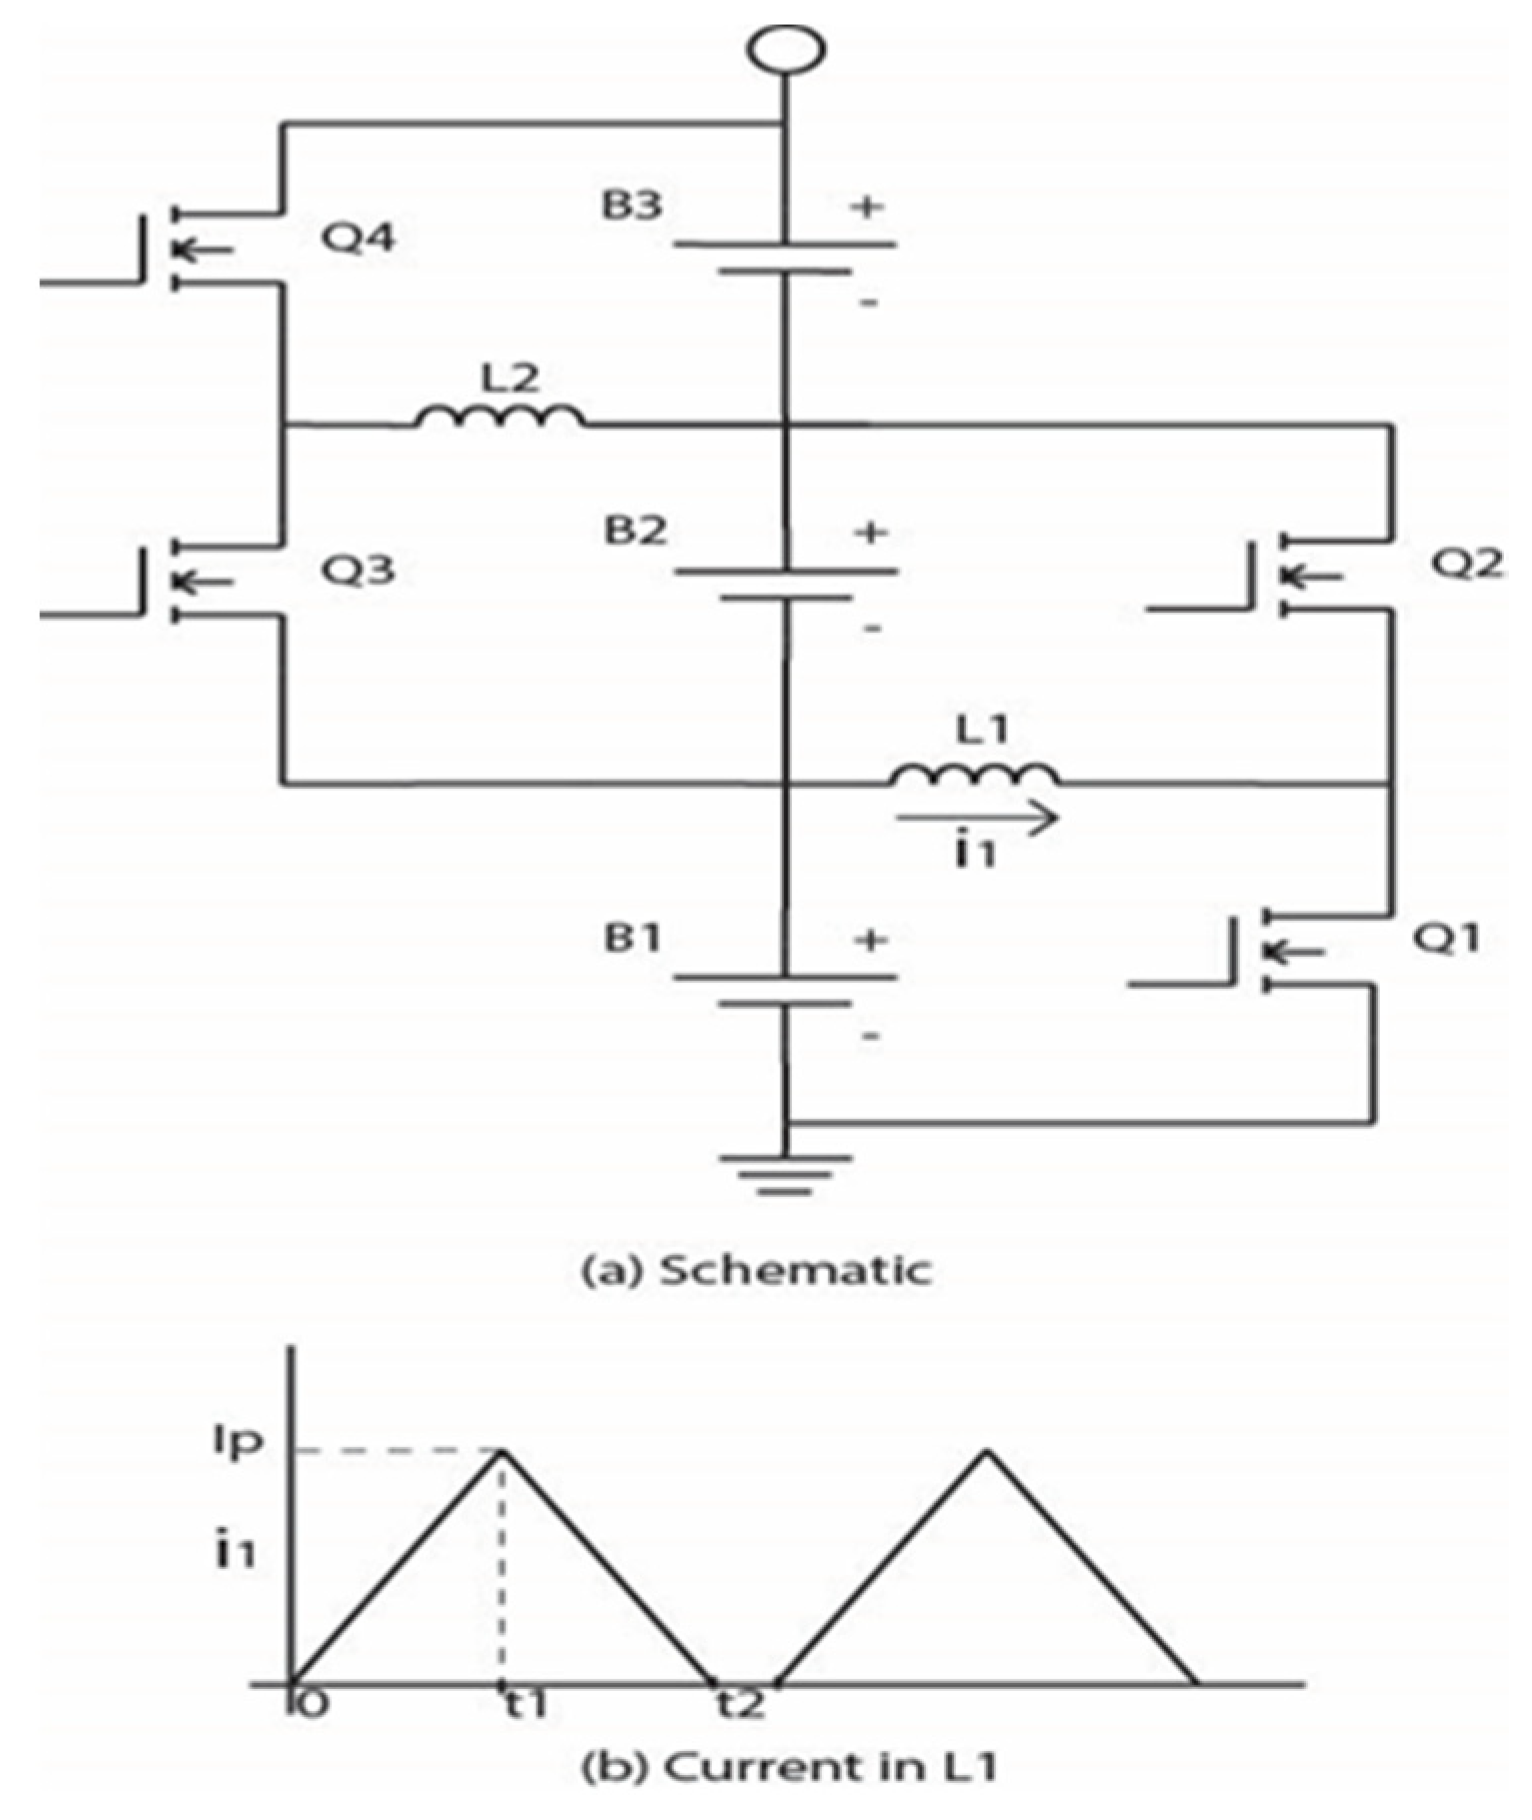
Figure 4 shows the schematic for the PEQs for three cells, and
Figure 5a shows the schematic for three sections with two AEQ drivers, each containing an inductor and two FETs, e.g., the first driver consists of L1, Q1, and Q2.
Figure 5b shows the inductor current waveform for one of the AEQ drivers. There are several different types of AEQs [
18,
19,
20,
21,
22,
23,
24,
25,
26,
27,
28,
29] that can be used, but the inductive type shown here was chosen to minimize cost.
PEQs are relatively cheap, so most of the BEQ expense is the cost of the AEQ drivers. This explains why the BEQ uses AEQs at the section level instead of the cell level. If N = the number of sections, the required number of inductive AEQ drivers is N − 1. Therefore, a BEQ for a 96-cell battery with 16 sections of 6 cells each would only require 15 drivers. However, an inductive AEQ operating at the cell level would require 95 drivers. It might seem that the higher voltage section driver would cost more than a cell level driver, but this is not clear. This is because each driver is powered by its cells, and the voltage for a cell level driver is too low to efficiently switch its FET gates. This means a cell level driver would require an extra circuit to boost the gate drive voltage. Since the PEQs and AEQs are separate, it also should be possible to convert from a PEQ to a BEQ by adding an AEQ retro kit to the PEQ and reprograming the software.
As noted previously, to compensate for CF, the AEQs must operate while the battery is charging and discharging, and the AEQ currents, such as I1 in
Figure 5b, must be much higher than those in a typical PEQ that only needs to compensate for SD. However, these AEQ currents are still much smaller than the battery current and are economical to achieve. Some example calculations for the required AEQ currents are shown in the Experimental Results section. These calculations also show that the battery capacity is almost equal to the average of the section capacities, which in turn depend on the capacities of their cells. Additionally, note that since the AEQ drivers are current sources, it is simple to connect two or more drivers in parallel to obtain higher equalization currents.
4. Measurement of Minimum and Average SL Cell Capacity
The plots in
Figure 1 and
Figure 2 show that if the SL capacity spread between the worst cell and the cell average is wide, there is a large difference in the minimum and average lifetimes and TCCs. However, as noted earlier, measuring the capacity for each cell in a large battery is very labor intensive and expensive.
Before committing to this measurement, one needs to consider how this data is to be used. If the SL battery will be using a PEQ, the only pertinent information is the capacity plot for the worst cell, and for a BEQ, the only pertinent data is the plot for the average capacity of the cells. Neither requires the individual capacities of all the cells.
Therefore, before deciding between a PEQ or a BEQ, it is only necessary to measure the minimum and average cell capacities. In this case, a BEQ can be used to take both measurements during the same life test, as explained below.
During normal BEQ usage, the PEQ and AEQ drivers in
Figure 3 operate simultaneously, but the PEQs also can be operated separately. In this latter case, the AEQs are disabled, and the PEQs are programmed to equalize all the battery cells together instead of just those in their section. Therefore, the following procedure can be used to measure the PEQ and BEQ discharge capacities on alternate charge/discharge cycles during an SL life test.
Figure 6 shows a block diagram of the test fixture, and
Figure 7 shows the battery management system (BMS) program flow chart. In an actual test fixture, it would be preferable to replace the resistive load in
Figure 6 with a grid-connected inverter to reduce energy consumption.
Since the BEQ and PEQ are used on alternate charge/discharge (C/D) cycles, the BMS will alternate the BEQ and PEQ control programs. Note from
Figure 2 that the PEQ plot reaches the lower SL capacity limit before the BEQ plot. Therefore, as shown in
Figure 7, the PEQ and BEQ cycles alternate until the PEQ plot reaches the lower capacity limit. Thereafter, the battery is only cycled using the BEQ until the lower capacity limit is reached.
Selection of PEQ or BEQ and selection of charge or discharge is controlled by the BMS program flowchart in
Figure 7. This shows how the BMS controls the test fixture in
Figure 6. Bcap = capacity on each BEQ discharge cycle, and Pcap = capacity on each PEQ discharge cycle.
Data from the procedure in
Figure 7 provides the following:
PEQ lifetime = number of cycles before Pcap reaches the lower limit
BEQ lifetime = number of cycles before Bcap reaches the lower limit.
PEQ TCC = Sum of the Pcap values for each even-numbered discharge cycle (analogous to the area under the SL plot A in
Figure 2). Therefore,
BEQ TCC = Sum of the Bcap values for each odd-numbered discharge cycle (analogous to the area under the SL plot B in
Figure 2). Therefore,
Of course, this procedure is just a side-by-side comparison of a PEQ and a BEQ using the same battery. Each PEQ discharge cycle records the capacity of the worst cell, and each BEQ discharge cycle records a value close to the cell average. The discharge capacity with the BEQ, Bcap, is recorded on the odd-numbered cycles and the PEQ discharge capacity, Pcap, is recorded on the even-numbered cycles. However, each PEQ and BEQ charge cycle is affected by a previous discharge cycle of the other type, and this slightly alters the charging capacities. Therefore, the charging capacities are not recorded. However, each discharge cycle is always preceded by a charge cycle of the same type, so the discharge capacity values are not affected by alternating the PEQ and BEQ. Using the same battery for both the PEQ and BEQ tests removes any ambiguities caused by testing with two different batteries.
Figure 8 shows an example of how the capacities for the PEQ and BEQ would be plotted using every other capacity data point.
Without
Figure 1 [
6] there would be no published data about cell capacity spread due to differences in cell CF, but obtaining these results required the measurement of the capacity of each cell after each C/D cycle over the battery lifetime. This study in [
6] was an important contribution to the state of the art, but the measurement method was very labor intensive and expensive. The advantage of this new proposed method using a BEQ is that it can be automated, thus avoiding the high labor cost. Of course, it requires the construction of a BEQ test fixture, but this is minor in comparison to the cost of the previous method. Although the BEQ method only measures the worst cell and the cell average instead of all the cells, this actually seems be an advantage since this is the exact data required to compare a PEQ with a BEQ. Once this data is known, the BEQ cost can be compared to the cost savings from the increased battery capacity and lifetime. This data also determines the proper size for the BEQ.
5. Experimental Results
Our research lab did not have a used EV battery to test, but we did have a 24-cell battery described below that could be used to demonstrate the test procedure. Although we could not conduct a relevant SL battery life test ourselves, perhaps the procedure shown here can be used by others that do have actual used EV batteries to test.
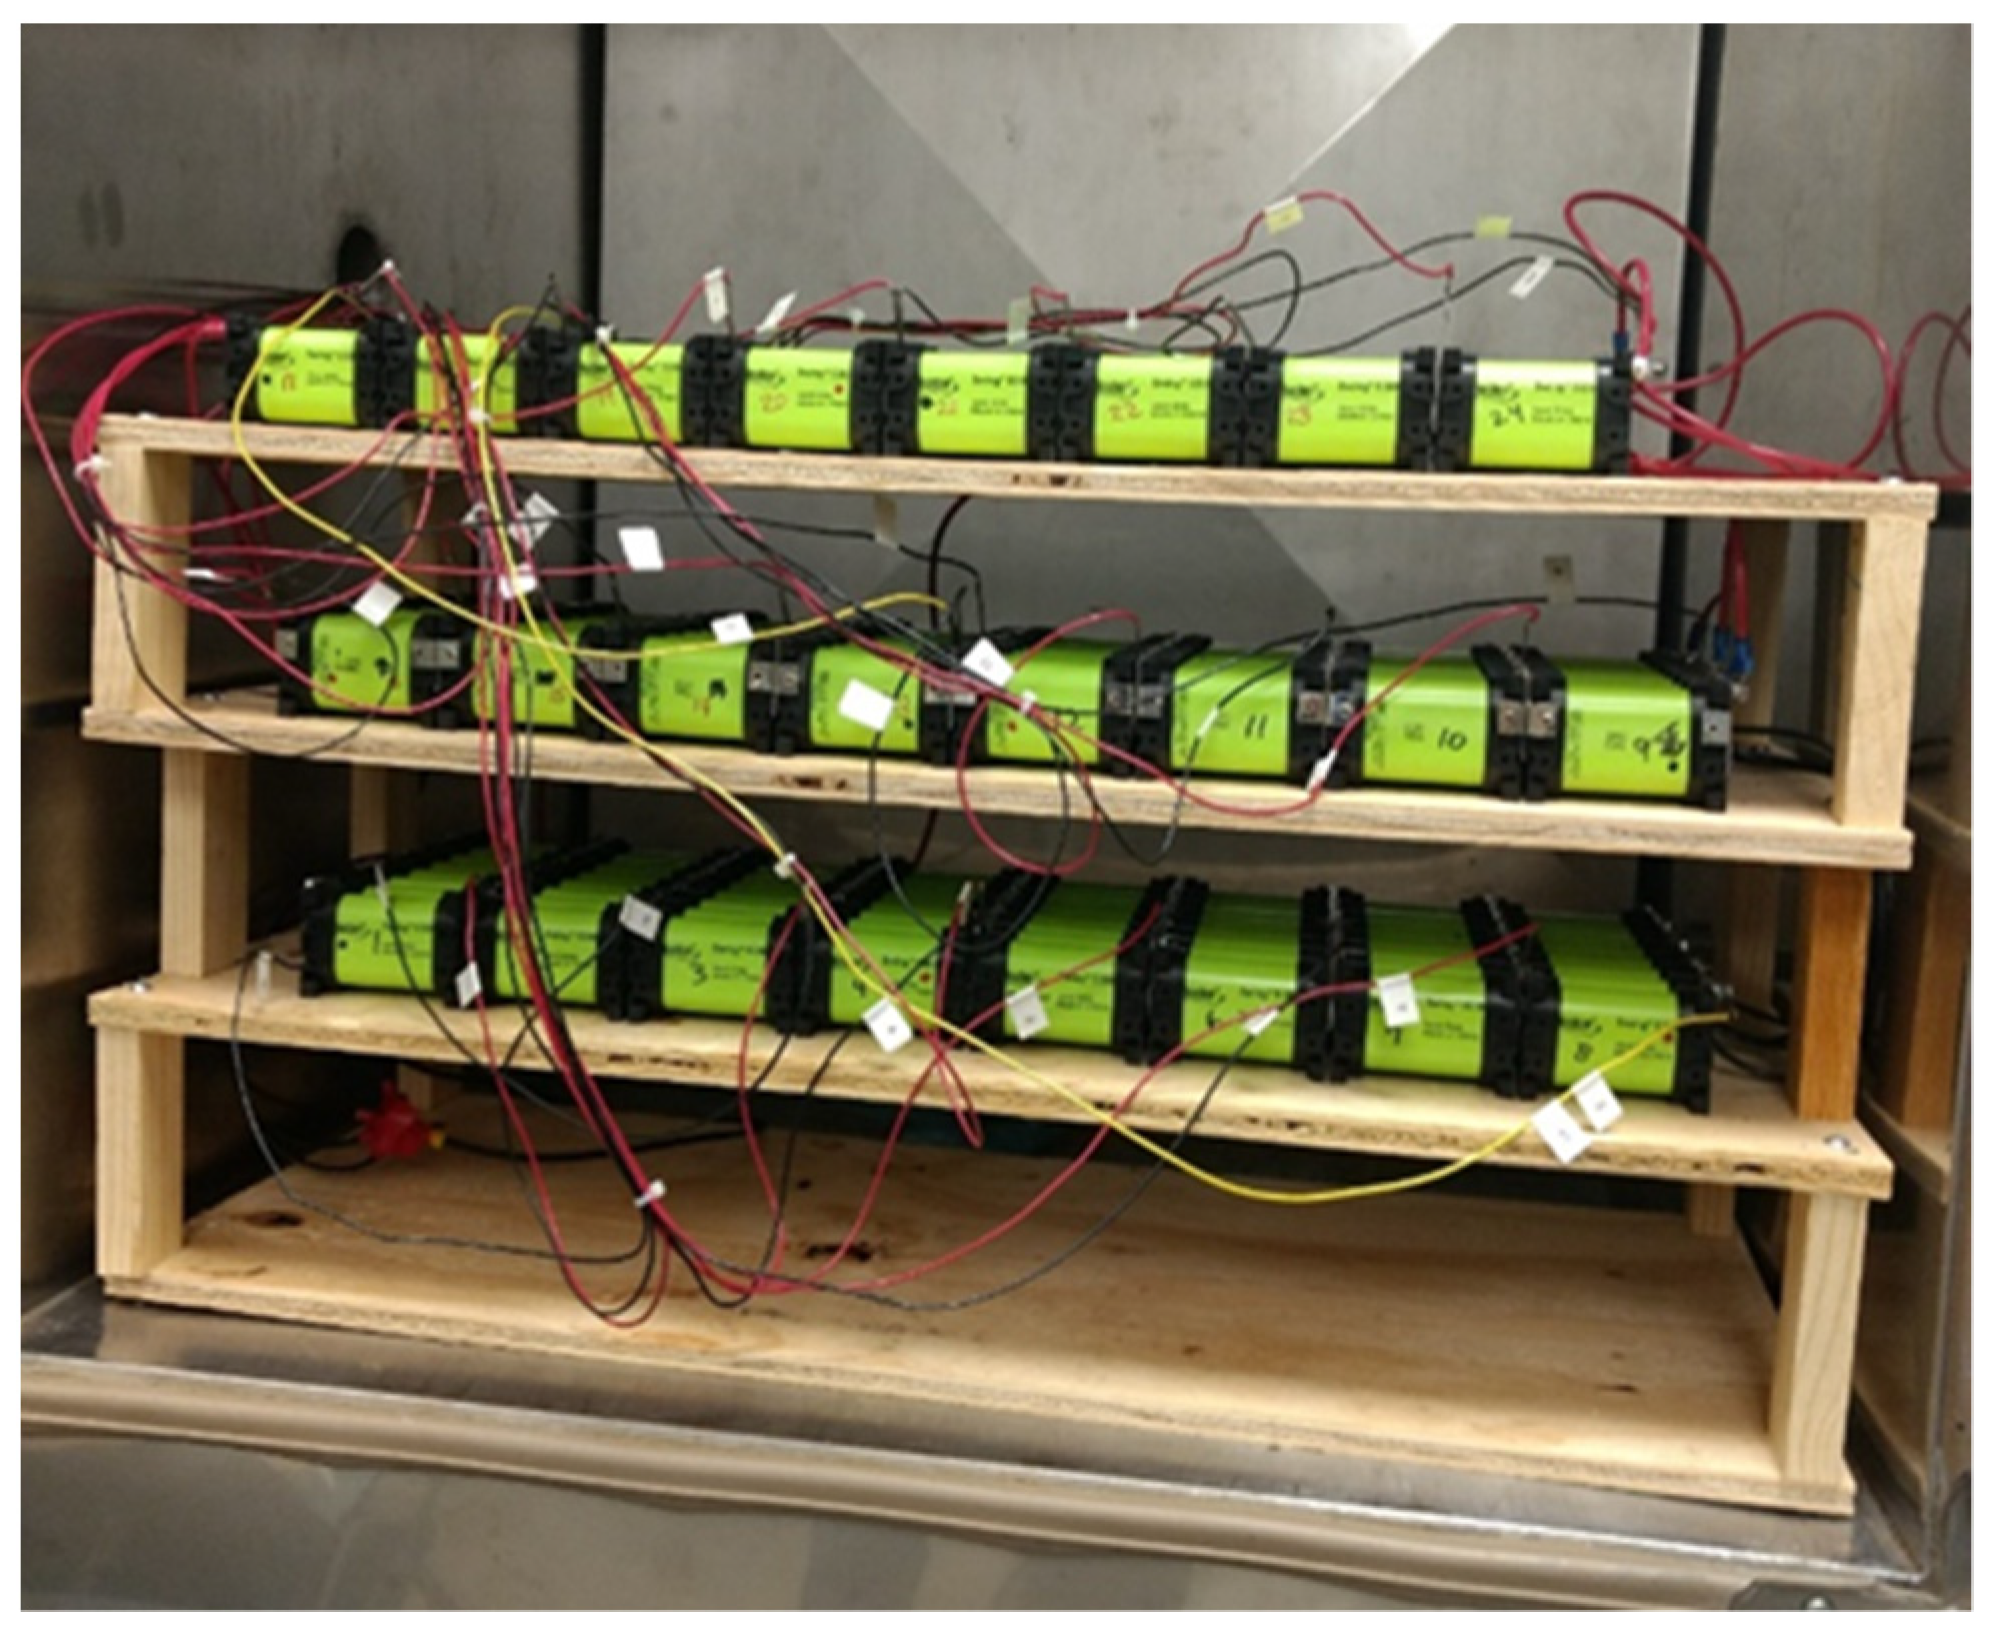
A BEQ lab prototype was developed and tested with a cobalt oxide Li-ion battery with 24S-8P modules, i.e., there were 24S modules, each with 8P small cells. As before, these modules will be referred to as cells, and each consists of eight Boston Power Swing 5300 cobalt oxide “small cells” connected in parallel. Each of these Swing 5300 small cells will now be referred to as blocks, and each has a manufacturer’s C/5 rated capacity of 5 Ah each. These blocks were about 4 or 5 years old and experienced numerous charge/discharge cycles. A typical cell with 8P blocks is shown in
Figure 9, and the 24S battery using these cells is shown in
Figure 10. During testing, the battery was housed in a closed temperature chamber to ensure safety.
When new, each block had a C/5 rating of 5Ah, so a cell with 8P blocks would have a C/5 rating of 40 Ah. This corresponds to a C/5 discharge current of 8 Adc:
Since ID = C/2.67, the discharge capacity was considerably less than the C/5 value of 40 Ah. Additionally, the cells degraded somewhat due to usage. Therefore, an estimated C/2 value of 26 Ah was chosen, based on manufacturer’s data. Actually, the calculations of the equalization currents only depend on ID, the degree and location of the section capacity imbalance, and the AEQ efficiency, i.e., they depend on the capacity imbalance but not the capacity itself.
To provide a capacity imbalance for the test, four blocks were removed from cell #9 in section #3. Therefore, the estimated capacity of sections #1, 2 and 4–6 was 26 Ah, and that of section #3 was 13 Ah.
BEQ specifications:
Number of AEQ drivers: 5
Maximum average AEQ equalization current: Ieq = 3 Adc (this is the current flowing out of a section).
AEQ efficiency at a section voltage of 14 Vdc: η = 75%
Nominal AEQ frequency is 16 kHz, but this varies with the average section voltage in order to regulate the equalization current, i.e., the frequency is determined by a voltage-controlled oscillator.
Since the voltage of each of the cells used in this study is proportional to its state of charge (SOC), the cell voltages were used to identify the relative SOCs. During charging, lower capacity cells will charge faster and thus will have higher voltages. During discharge, the lower capacity cells will discharge faster and will have lower voltages. Interconnections between the cells were kept very short and uniform, so we saw no evidence that these interconnections caused any significant voltage measurement errors.
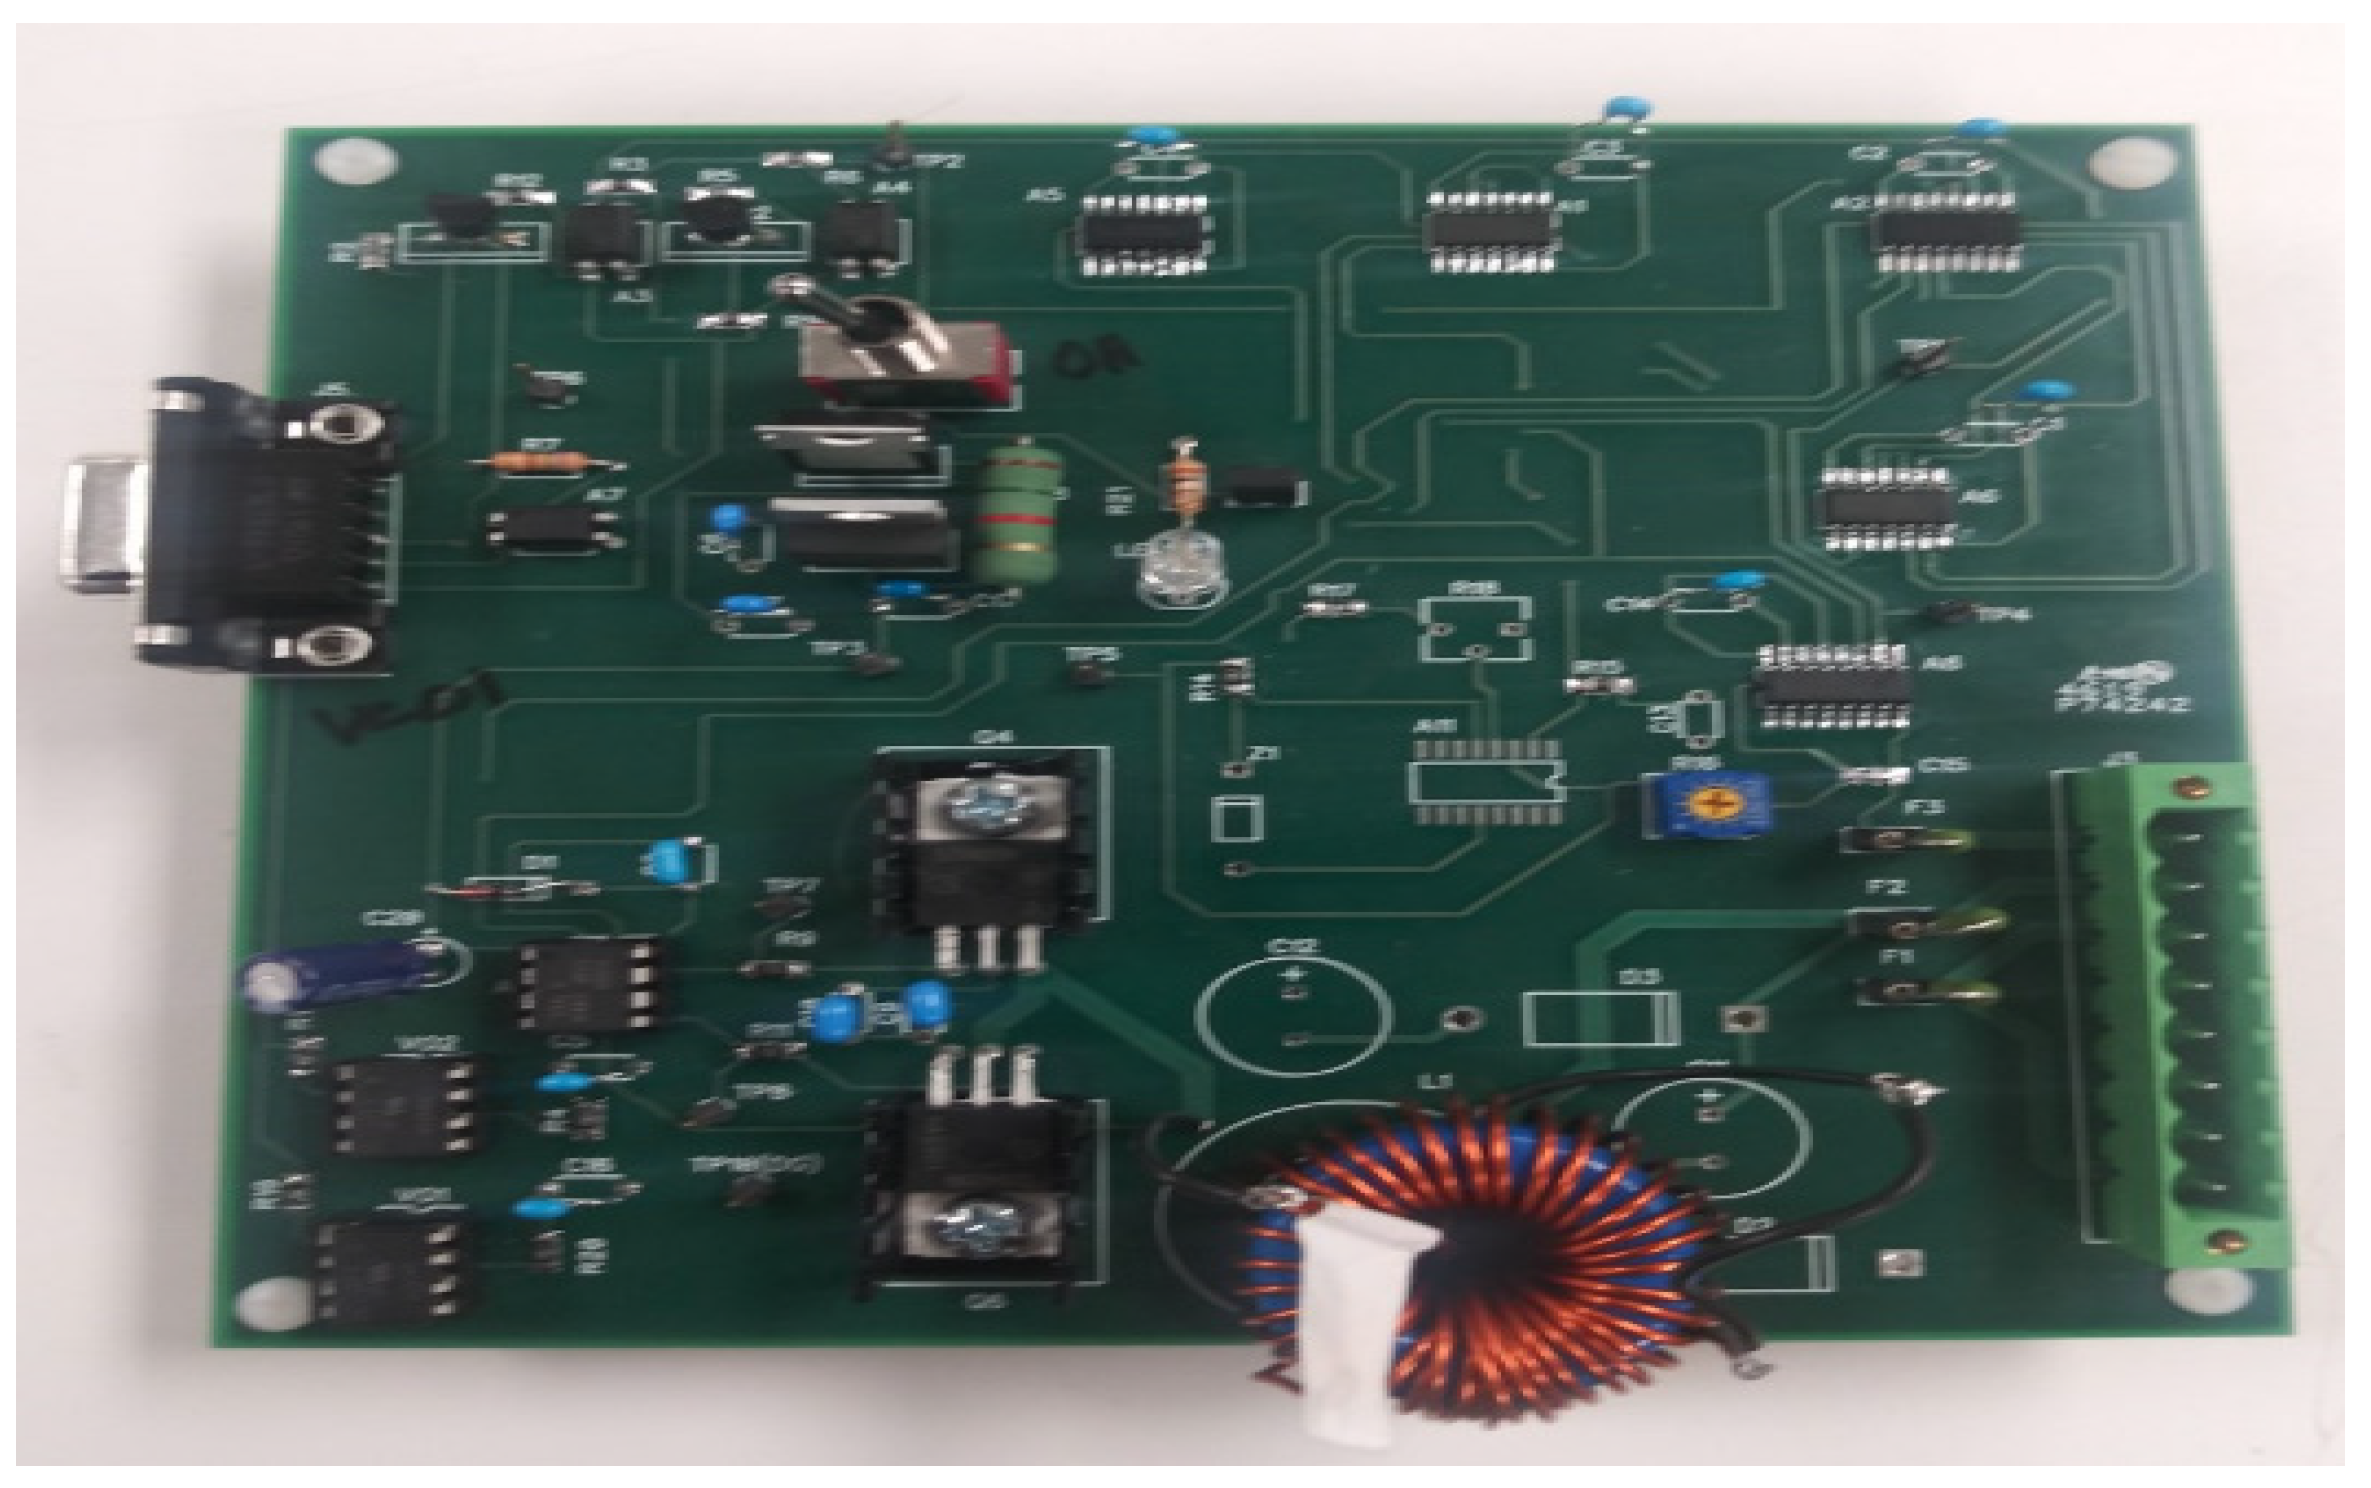
One of the five AEQ drivers is shown in
Figure 11.
Figure 5 shows three cells connected to two drivers, one driver consisting of Q1, Q2, and L1, and the other consisting of Q3, Q4, and L2. The example calculations shown below indicate that the equalization currents can be in the range of 33% of the battery current, so the FETs and inductors must be rated accordingly. This board did not include one of the additional features, so some of the component footprints are vacant. Further circuit details are shown in [
12,
13,
14,
15,
16,
17].
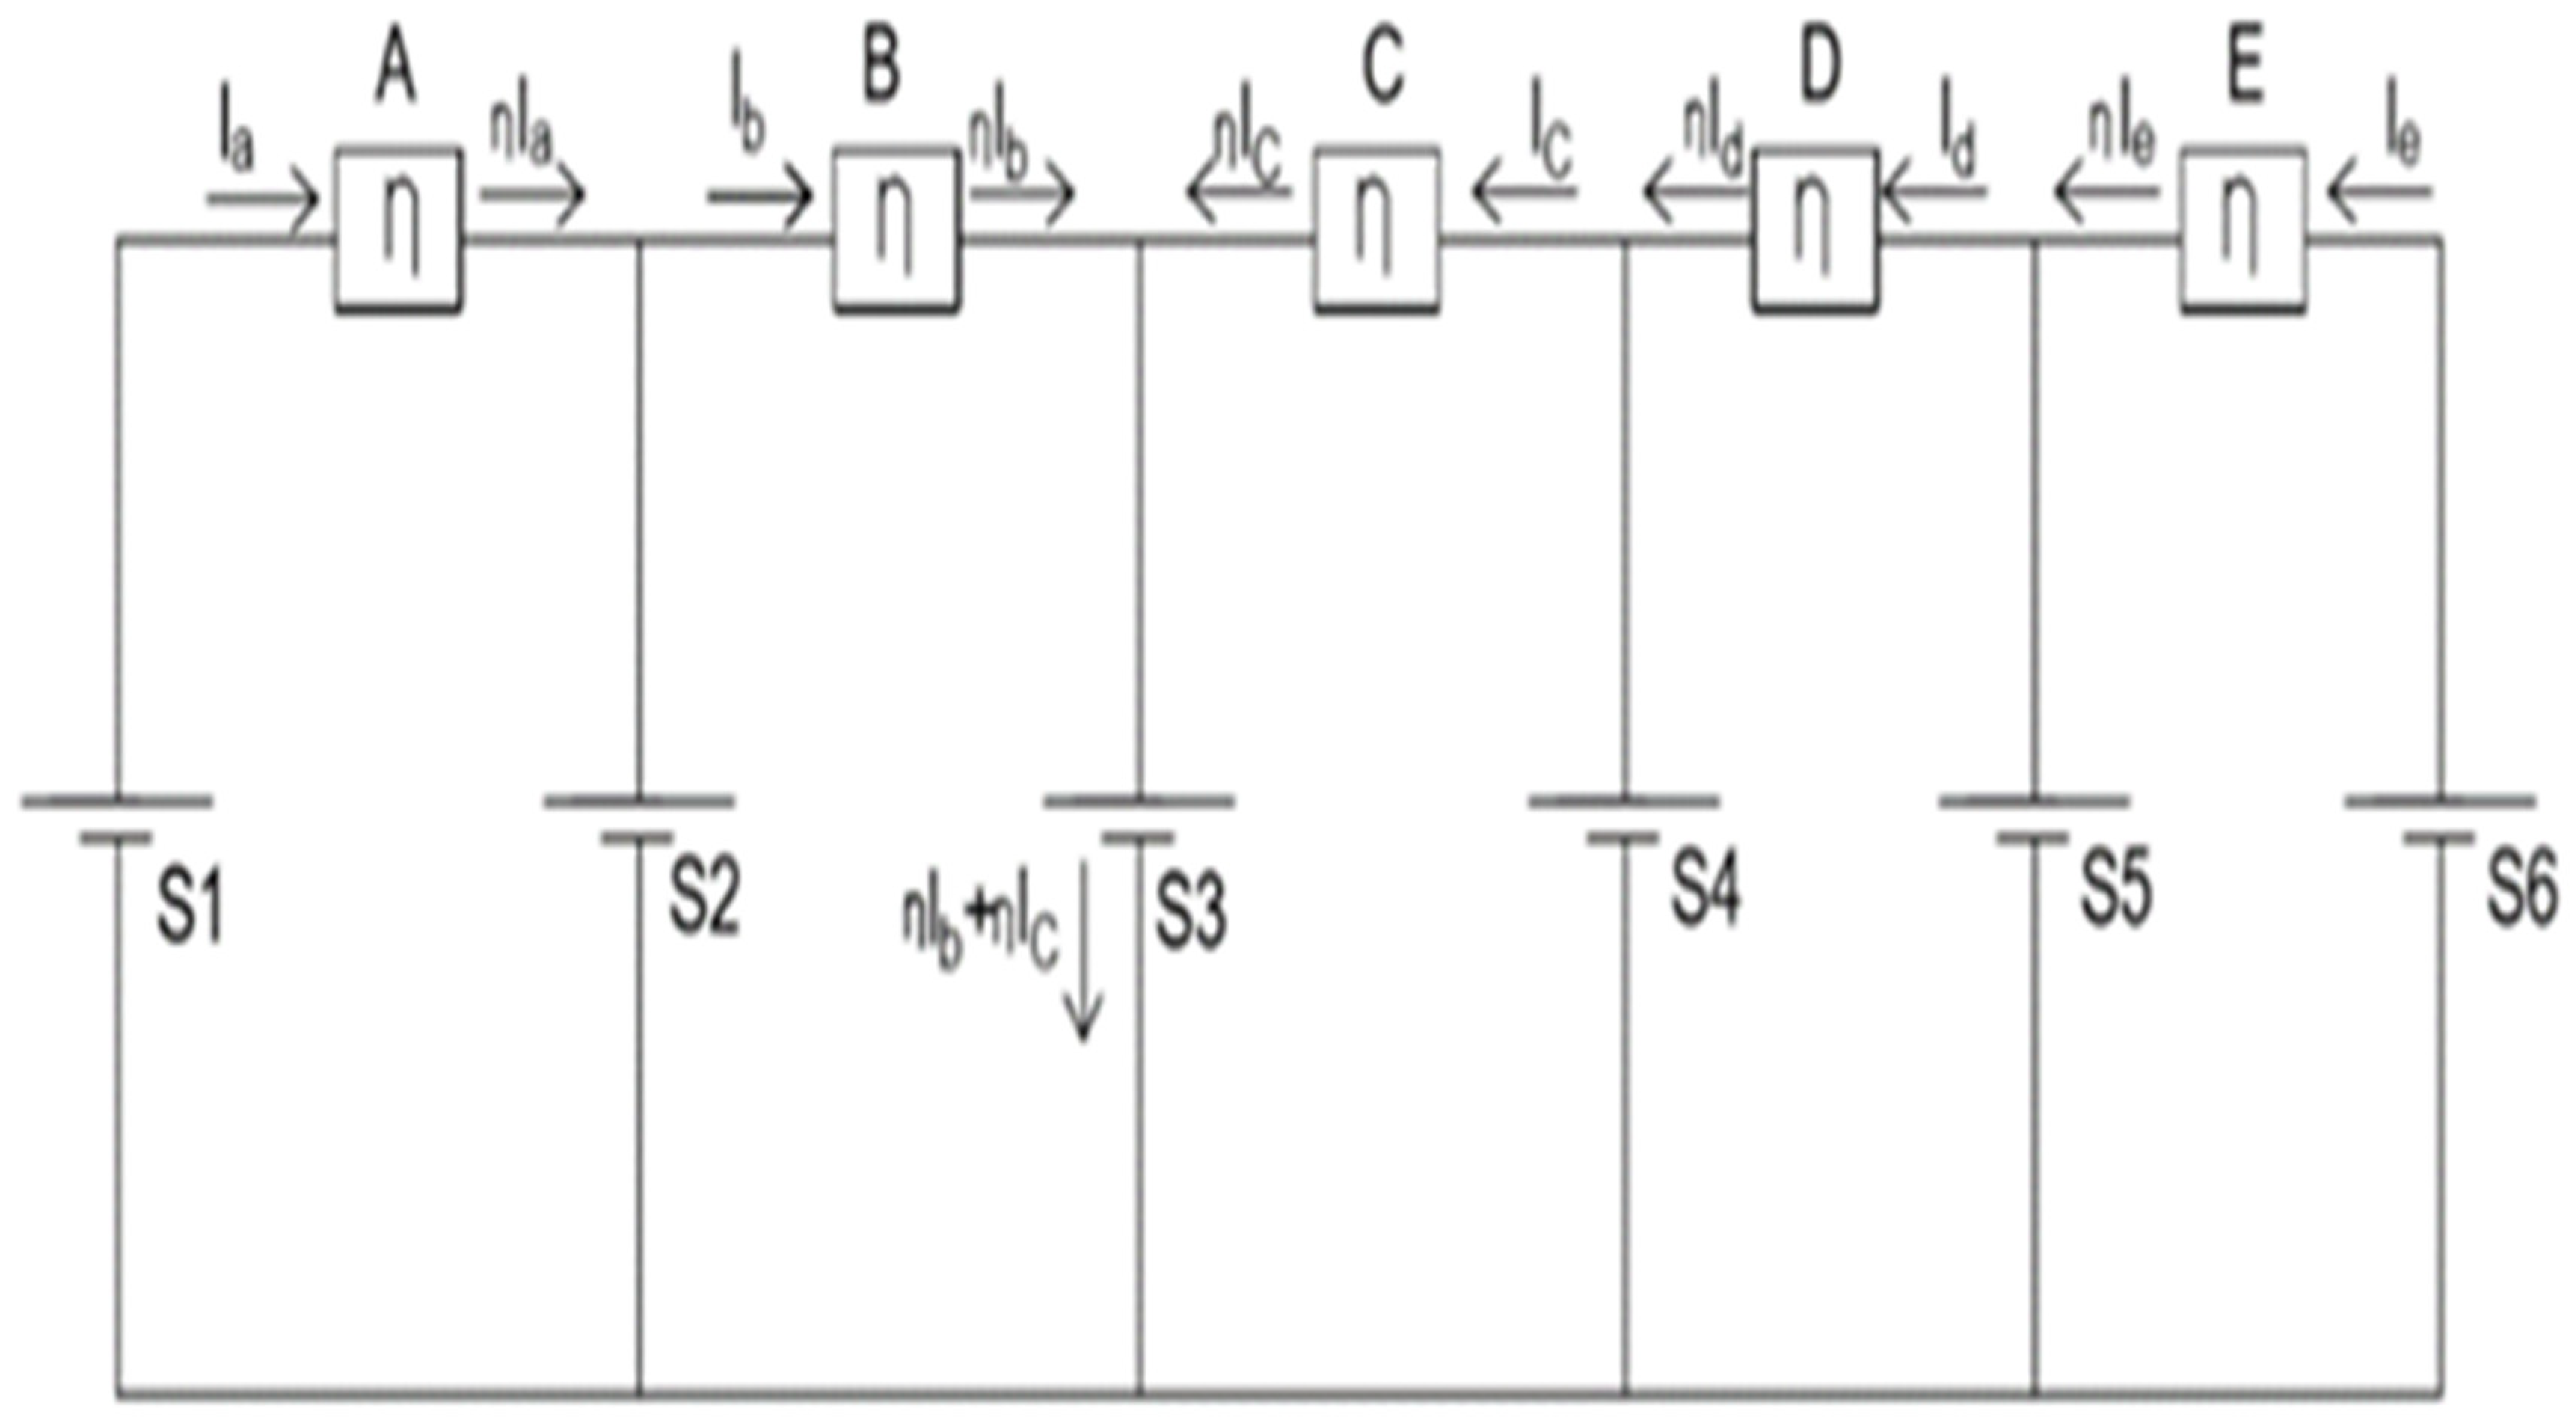
Figure 12 shows a flow diagram for the BEQ currents, Ia–Ie, during discharge for the six sections of cells, S1–S6. Since S3 contains cell #9, which has a much lower capacity than the other cells, the currents will all flow toward S3 during discharge and away from S3 during charge.
To maximize the battery capacity, all sections should reach full discharge simultaneously at the same time: T. Therefore, (3)–(8) can be used to find T and Ia–Ie. Other examples and additional details are shown in [
12,
13,
14,
15,
16,
17].
Solving (3)–(8) for ID = 15 Adc, η = 75, AH3 = 13 Ah, and AH1 = AH2 = AH4 = AH5 = AH6 = 26 Ah, yields:
T = 1.52 hr, Ia = 2.11 Adc, Ib = 3.7Adc, Ic = 4.89 Adc, Id = 3.7 Adc, and Ie = 2.11 Adc.
The average section capacity = 23.8 Ah, and the battery capacity = 1.52 hr × 15 A = 22.8 Ah, or 95.8% of the section average, which is very close, as predicted. The difference is due to AEQ losses since η = 75. If a PEQ were used instead of a BEQ, the battery capacity would only be 13 Ah, so for this highly unbalanced case the BEQ provides a capacity increase of 75.4%.
This shows the actual BEQ maximum value of Ieq = 3 Adc is smaller than the calculated values for Ib, Ic, and Id. This means this BEQ is too small to maximize the battery capacity for these conditions; however, it is still large enough to provide a significant capacity increase above the PEQ, as will be shown by the experimental data.
Figure 13 shows plots of the battery capacity vs. the number of discharge cycles for a few data points. The average capacity values with the BEQ were 19.62 Ah, and the average with the PEQ was 14.54 Ah, so the BEQ increased the capacity by about 35%. Although this was a significant increase, it was much lower than the calculated value of 75.4%, since the maximum Ieq was only 3 Adc instead of the calculated value of 4.89 Adc. The capacity values with the BEQ varied from 19.26 to 19.95 Ah, and those with the PEQ varied from 14.48 to 14.58 Ah, indicating good repeatability.
Due to time constraints and the absence of a used EV battery, no attempt was made to perform an actual life test for the SL region. Instead, the real purpose of this study was to propose a more efficient method that could be used to measure the minimum (PEQ) and average (BEQ) SL capacity plots for an actual used EV battery. Even if a used EV battery was available, such a life test might take may months or even a few years to complete using the resources we had available. Rather than delay the disclosure of the test method, it seemed preferable to present it as a proposal. In this way, other researchers that have access to actual used EV batteries can use it to measure the two plots to determine the choice between a PEQ or a BEQ.
The plots in
Figure 13 show that the BEQ provides about 36% more capacity than the PEQ for an average ID = 15 Adc. This value increased to 43.2% when ID was reduced to 10 Adc, but the 15 Adc value was retained to reduce the cycling time.
Since the PEQ plot equals the capacity of the worst cell (#9),
Figure 13 indicates that the capacity of #9 was about 14.5 Ah. Since the #9 capacity was about 50% of the other cells, this indicates the average of the other cells was closer to 29 Ah instead of the assumed 26 Ah.
The sum of the Pcap values for the even-numbered discharge cycles is found from (1) and the PEQ data in
Figure 13.
And the sum of the Bcap values for the odd-numbered discharge cycles is found from (2) and the BEQ data in
Figure 13.
This indicates that for this very limited number of cycles, the BEQ provided about 35% more total capacity cycles (TCC) than the PEQ, even though the actual Ieq = 3 Adc was much smaller than the calculated value of 4.89 Adc. It should be noted that the calculated values are the required average currents. However, the maximum value, Ic in this case, does not flow continuously, but may be switched on and off as the section voltages vary slightly during charge and discharge. Therefore, to ensure that Ic can reach the average value of 4.89 Adc, Ieq should be somewhat larger than 4.89, perhaps 6 Adc.


