Review

Achieving 100% Renewable and Self-Sufficient Electricity in Impoverished, Rural, Northern Climates: Case Studies from Upper Michigan, USA

by
Adewale A. Adesanya
1,2,*,
Nelson Sommerfeldt
3 and
Joshua M. Pearce
4
1
Energy and Environmental Analysis Group, New York State Energy Research and Development Authority (NYSERDA), Albany, NY 12203, USA
2
Havenergy Consulting Inc., Albany, NY 12203, USA
3
Department of Energy Technology, KTH Royal Institute of Technology, 10044 Stockholm, Sweden
4
Department of Electrical and Computer Engineering, Ivey School of Business, University of Western Ontario, London, ON N6A 5B9, Canada
*
Author to whom correspondence should be addressed.
Electricity 2022, 3(3), 264-296; https://doi.org/10.3390/electricity3030016
Submission received: 16 May 2022 / Revised: 29 June 2022 / Accepted: 5 July 2022 / Published: 9 July 2022
(This article belongs to the Special Issue Innovative Electricity Markets and Energy Transition)

Abstract

:
The development of 100% renewable electricity (RE) systems play a pivotal role in ensuring climate stability. Many municipalities blessed with wealth, an educated and progressive citizenry, and large RE resources, have already reached 100% RE generation. Impoverished municipalities in unwelcoming environments both politically and climatically (e.g., northern latitudes with long, dark winter conditions) appear to be incapable of transitioning to renewables. This study challenges that widespread assumption by conducting a detailed technical and economic analysis for three representative municipalities in the Western Upper Peninsula of Michigan. Each municipality is simulated with their own hourly electricity demand and climate profiles using an electrical supply system based on local wind, solar, hydropower, and battery storage. Sensitivities are run on all economic and technical variables. Results show that transition to 100% RE is technically feasible and economically viable. In all baseline scenarios, the 100% RE systems produced a levelized cost of electricity up to 43% less than the centralized utility rates, which are predominantly fueled by gas and coal. Current policies, however, prevent such self-sufficient systems from being deployed, which are not only detrimental to the global environment, but also aggravate the economic depression of such regions. Potential energy savings advance the prohibitive energy justice principle.

1. Introduction

1.1. Motivation

The recent reports from the 25th Conference of Parties (COP25) of the United Nations Framework Convention on Climate Change (UNFCCC) in 2019 show that global warming, which is mainly the result of greenhouse gas (GHG) emissions from fossil fuel combustion, requires immediate action to avoid impending catastrophes. This is based on previous scientific reports from the Intergovernmental Panel on Climate Change (IPCC), demonstrating that the world has about a decade to limit global warming below 2 °C to prevent irreversible change [1,2,3].
To meet this target before 2030, each country is required to achieve an annual emission reduction of 7.5% from their current emission status. Although average global emissions for the year 2019 experienced about a 17% reduction in CO2 emissions at the end of first quarter of 2020 due to COVID-19, recent research has shown a rebound in countries easing out on lockdown and corresponding surge in socioeconomic activities [4]. Achieving 7.5% reductions in emissions still requires more aggressive strategies to change the global energy system.
The largest portion of global GHG emissions comes from the combination of electricity and heat sectors. About a quarter of global total GHG are the result of burning coal, oil and natural gas for generating electricity and heat [5]. About 92% of U.S. emissions from the electric power sector came from coal and natural gas in 2016 [6]. There is thus an immediate need to transition the U.S. electricity sector from the current dominant sources to clean and renewable resources.
Achieving such a transition is challenging in the face of the country’s complex, inconsistent energy policies and the U.S. decision to pull out from the global climate pact. While the policy irregularities hinder definite steps towards transition at the federal level, efforts from state and local policies have been more useful. However, five municipalities in the U.S. (Aspen, CO; Rock Port, MS; Greensburg, KS; Burlington, AR and Georgetown, TX) have already transitioned to a 100% RE supply for electricity [7,8]. This transition may be replicated in many other municipalities or counties in the U.S. that are interested in switching to renewables. The achievement by each of the municipalities is arguably in part due to the technical feasibility of harnessing available energy resources.
To probe that assumption, this study investigates a challenging northern climate region. In general, many of the municipalities and counties in the northern rural part of U.S. are facing challenges with their energy systems. For example, Upper Peninsula (UP) residents within the Upper Peninsula Power Company’s (UPPCO) service territory, have $0.2350/kWh electricity prices [9], twice as much as the national average (Figure 1). Utilities face large costs for serving sparsely populated households creating higher distribution costs, which raise electricity costs. When coupled with the population’s relatively low-income levels and the corresponding hardship of paying electricity bills, a higher-than-average utility bill nonpayment is observed [10]. Thus, the main concern in this community is to have an electricity system that will be more flexible, affordable, and reliable.
Against these backdrops, the main aim of this paper is to investigate technical feasibility and economic viability of 100% RE in the extremely weather challenged northern region of the United States. A secondary purpose is to compare the cost of the existing fossil fuel dominated system with 100% RE system to investigate the energy burden reduction and provision of a just service to residents. Finally, it focuses on assessing self-sufficiency of isolated rural communities in achieving 100% RE transition and the conditions with which that can be achieved.

1.2. Literature Review

Coal and natural gas are the main sources of electrical generation for the utility serving the UP. The utility’s generation mix constitutes 17.2% from hydroelectricity generation facilities, while 82.7% are purchased from the Midcontinent Independent System Operator (MISO) [11]. With less RE being deployed for electricity supply by the utility, this may form an integral part of why its rate is among the highest in the U.S. Prehoda et al. [12] have found that all households would save money with deployment of customer-owned solar photovoltaic (PV) systems, yet utilities have used various techniques to minimize customer-owned distributed generation, including a generation cap in UPPCO territory. In areas that are allowed to deploy RE, integration of RE is increasing, with the community of L’Anse in the western UP region adopting community solar [13,14,15].
There is clearly an economic case for small-scale distributed generation of RE technologies in the region, but RE may not be technically or economically viable with greater penetration rates. The objective of this study is to determine the techno-economic feasibility of 100% RE supply and sufficiency in a northern region. These regions can be classified as unlikely for RE transition due to extreme weather and long winters with up to eight months of snowfall, which also has effects on socioeconomic activities [16]. Hourly electricity load profiles are modeled with 100% RE supply based on local wind, solar, hydropower, and battery storage, including sensitivities on component costs, discount rates, effect of load reduction, and snow losses. The results are presented and discussed in the context of both technical and economic viability of 100% RE for northern communities.

1.2.1. 100% RE Transition and Concerns for Unlikely Places

Scholars have raised concerns about the absence of some important socio-technical elements in some rural places, making them unlikely to independently achieve a renewable energy transition [17,18]. Socially, rurality (of rural communities) has been characterized by population loss, economic decline, and continuous poverty [17]. Homsy [18] describes U.S. rural areas as smaller, poorer, and less progressive municipalities in the country, which are statistically modelled to be least likely to take climate action. This is due to different forms of capital (e.g., economic (finance)—human (technical know-how) and natural (weather related))—being presumed to be relatively inadequate to lead to RE transitions in rural places.
In addition, in northern rural communities, there are technical challenges of extreme weather conditions with long cloudy winters and corresponding low solar penetration such as the case for the UP of Michigan, U.S [10,16] and Nunavut, Canada [19]. The same argument holds for other rural places in the arctic region (e.g., Russia, Norway, Sweden, Finland, Greenland, Iceland, and the northern U.S). This is true of both fixed and nomadic communities in the north [20]. In such rural isolated communities with extreme cold climates there is a presumed limitation to RE transition potential. Apart from the extreme weather, more frequent weather events such as ice and windstorms are a threat to residents of the state of Michigan under the current, centralized energy infrastructure [21].
Winkler et al. [22] describe how art can be used to invigorate rural areas. If art is closely linked to the expression of beauty and attraction to nature, then some RE infrastructure could fit into such a category. For instance, hydropower plants and the waterfalls accompanying them attract people and tourists just like other art works [23,24]. The same has been discussed regarding wind tourism [25] and solar tourism [26] particularly for rural regions using agrivoltaics [27], which is the co-location of agriculture and PV [28]. Such scenic beauty and outdoor recreation potential are drivers of population and economic growth [17].

1.2.2. Community-Based 100% RE Modeling

Recently, the modeling of 100% RE systems for communities has been increasing as there are calls for climate action [29], the Russian invasion of Ukraine makes renewable energy a national security priority [30], and the clear need for considering more cost-effective alternative energy deepens [31]. Grid connected systems [32] are an example among numerous studies where 100% RE has been modeled for remote communities using Hybrid Optimization of Mixed Energy Resources (HOMER) Pro software. Resources include hybrid systems of solar, wind, hydro, battery, and power to hydrogen for grid and off grid applications. Nonetheless, most of these studies modeled their 100% RE system using computed estimated load [33,34] or generic load data from HOMER Pro [35]. Other grid connected case studies such as [36,37], which utilized real energy data in their model, only involved a few buildings from the selected sites. Such scholarship is gaining traction across the world due to an increasing focus on clean and renewable energy technologies with an aim to meet climate goals, provide energy security, and rein in volatile fossil fuel costs.

1.2.3. 100% RE Transitions and Energy Justice Concern

Another dimension to the transition to renewable energy is the concern of how injustice is perpetuated in the generation and distribution of energy in rural places. This concern is rooted in interdisciplinary energy justice research. Energy justice is an emerging concept in energy discourse that considers equitable distribution of energy services as the minimum requirement of an individual in attaining basic goods and services needed for life [38,39]. Two energy justice principles—affirmative; energy as derivative to the human right to basic goods, and prohibitive principles; the non-interference of that personal right [40]—provide grounds for the discussion of energy justice in 100% renewable electricity research, such as this paper.
Isolated northern residents are more sensitive to energy security to meet their basic needs, cutting across electricity, heating, cooling, and mobility (transportation). In the long, cold winter that usually lasts up to eight months, electricity service can be crucial for cooking, lighting, and sometimes for heating. The same needs are met in the short, but warm summer with requirements for cooling rather than heating. Thus, the absence of such an energy service is a threat to life, which is a fundamental right of every human [41]. High electricity costs in low-income and northern regions can challenge or interfere with the fundamental rights of rural citizens and thus requires an investigation into the potential of having clean, affordable, and reliable electrical energy. These energy justice issues are being exacerbated by the COVID-19 pandemic [42]. It is important to emphasize the impact of higher energy costs on people, especially those in rural communities in terms of economic burden. There is a direct proportionality between the cost of energy services delivered and the experience of energy burden inflicted on the consumers of such services. In the presence of cost competitive alternatives, the continuous infliction of such a burden through high-cost energy services is considered to be an injustice [43,44].

1.3. Main Contributions

This paper strengthens the argument for the possibility of a wholly renewable electricity transition in many unlikely places such as the UP of Michigan, characterized by extreme weather conditions. Although there have been various studies and modeling on 100% RE for islands and other isolated communities, most of them are done using generic load data or, at best, some interpolation of energy data from few sample buildings to represent the larger community, with some assumptions to bring the system model close to reality. For this study, actual 8760 h’ utility load data of an entire service territory is used in modeling complex and climatic northern communities of study. Thus, the results and analysis from this study are closer to reality and can be directly utilized by utilities, policymakers, stakeholders, and researchers in planning for multiple tens of MW municipal or a community wide 100% RE scenario. This is more important with growing local, state, and national level clean energy plans with distributed renewable energy resources being the cynosure of the goals. This approach stands in stark contrast to the current model that uses distributed RE sources as minor players in a conventional, centralized grid primarily dependent on large scale fossil fuel or nuclear power plants.
The study builds on existing claims from the literature on challenges and the unlikelihood of locations, such as the cases considered in this study, to transition to a 100% RE. It also projects some conditions under which a 100% RE system can remain cost competitive against a fossil fuel-based system for isolated rural areas. Electrification across the building (heating) and the transport sector is a clear trend. Thus, this paper calls for decarbonization through electrification.
Lastly, and most importantly, this paper brings to fore the need for considering 100% RE as a means of achieving energy justice through the lens of affirmative and prohibitive principles of energy justice. Despite the popularity gain of past research on techno-economic modeling of 100% RE for municipalities and local communities, there is very little connection to how such systems support the achieving energy justice. In this paper, the results provide a strong argument for the prohibitive justice principle of energy justice by comparing potential savings that customers (or residents) of the understudied municipal utilities can achieve. This integration of the qualitative analysis of justice in energy systems modeling is germane to the discussions of needs for, and the impact of, energy transition to RE.

1.4. Paper Structure
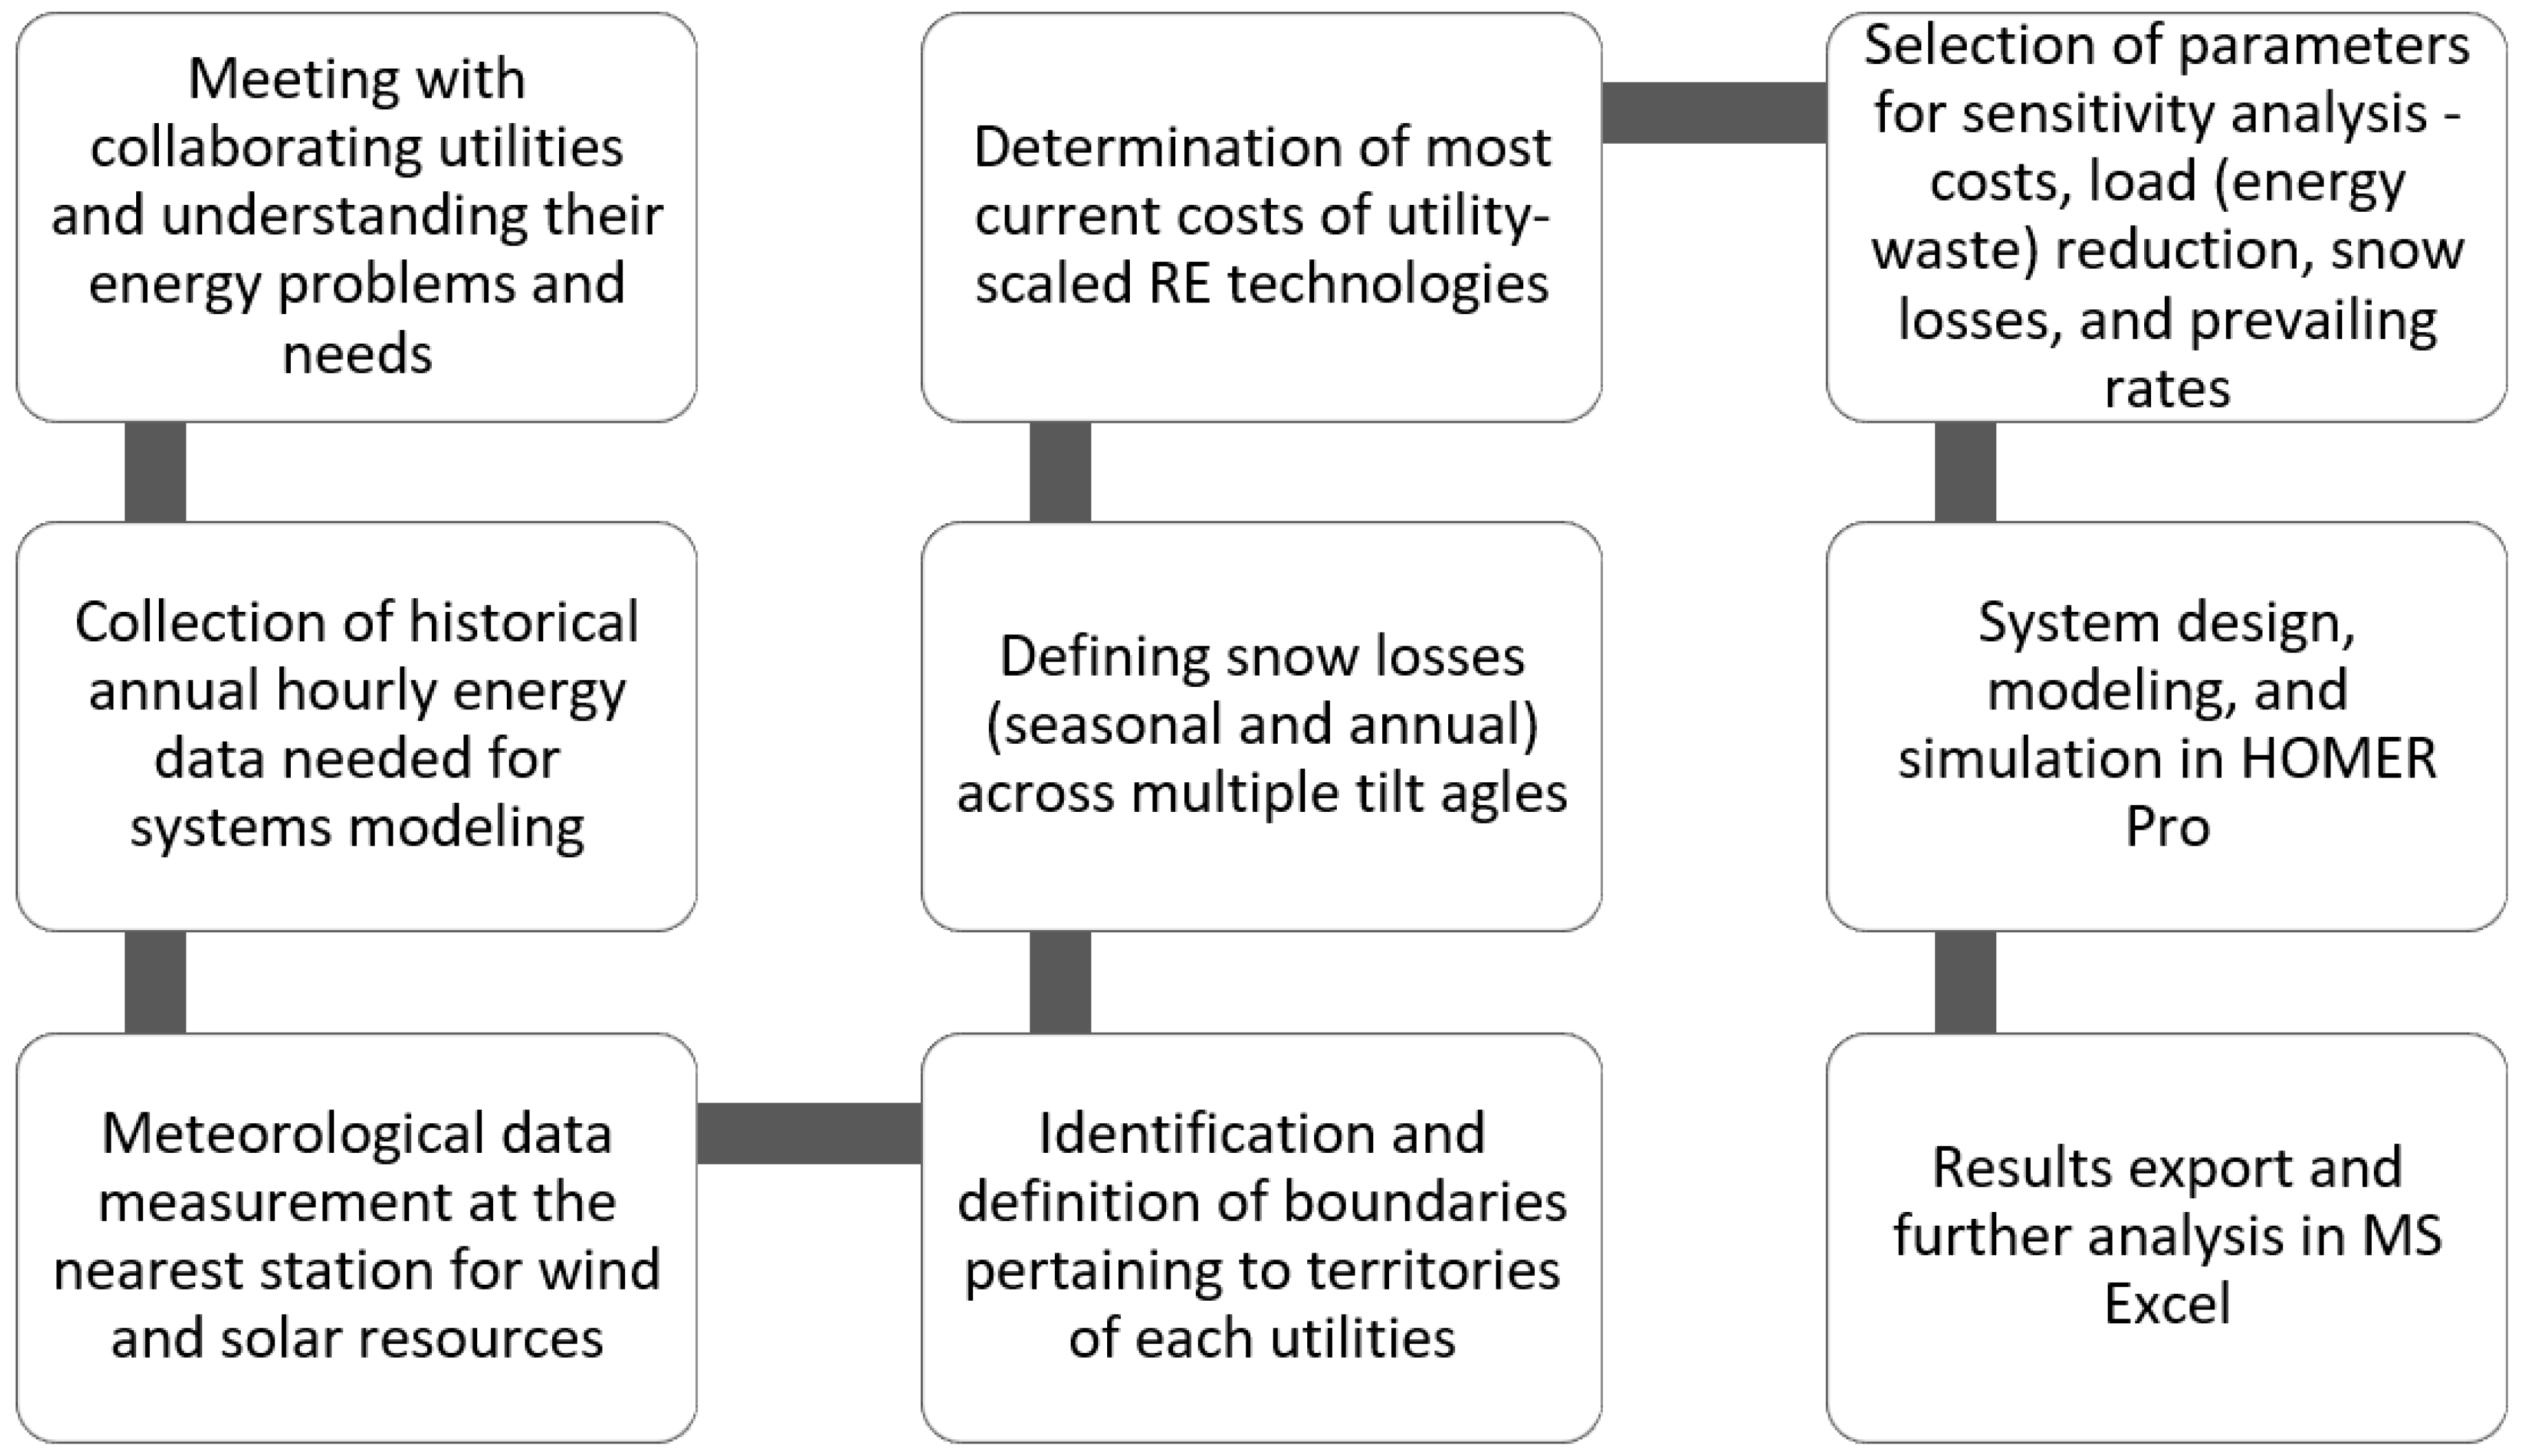
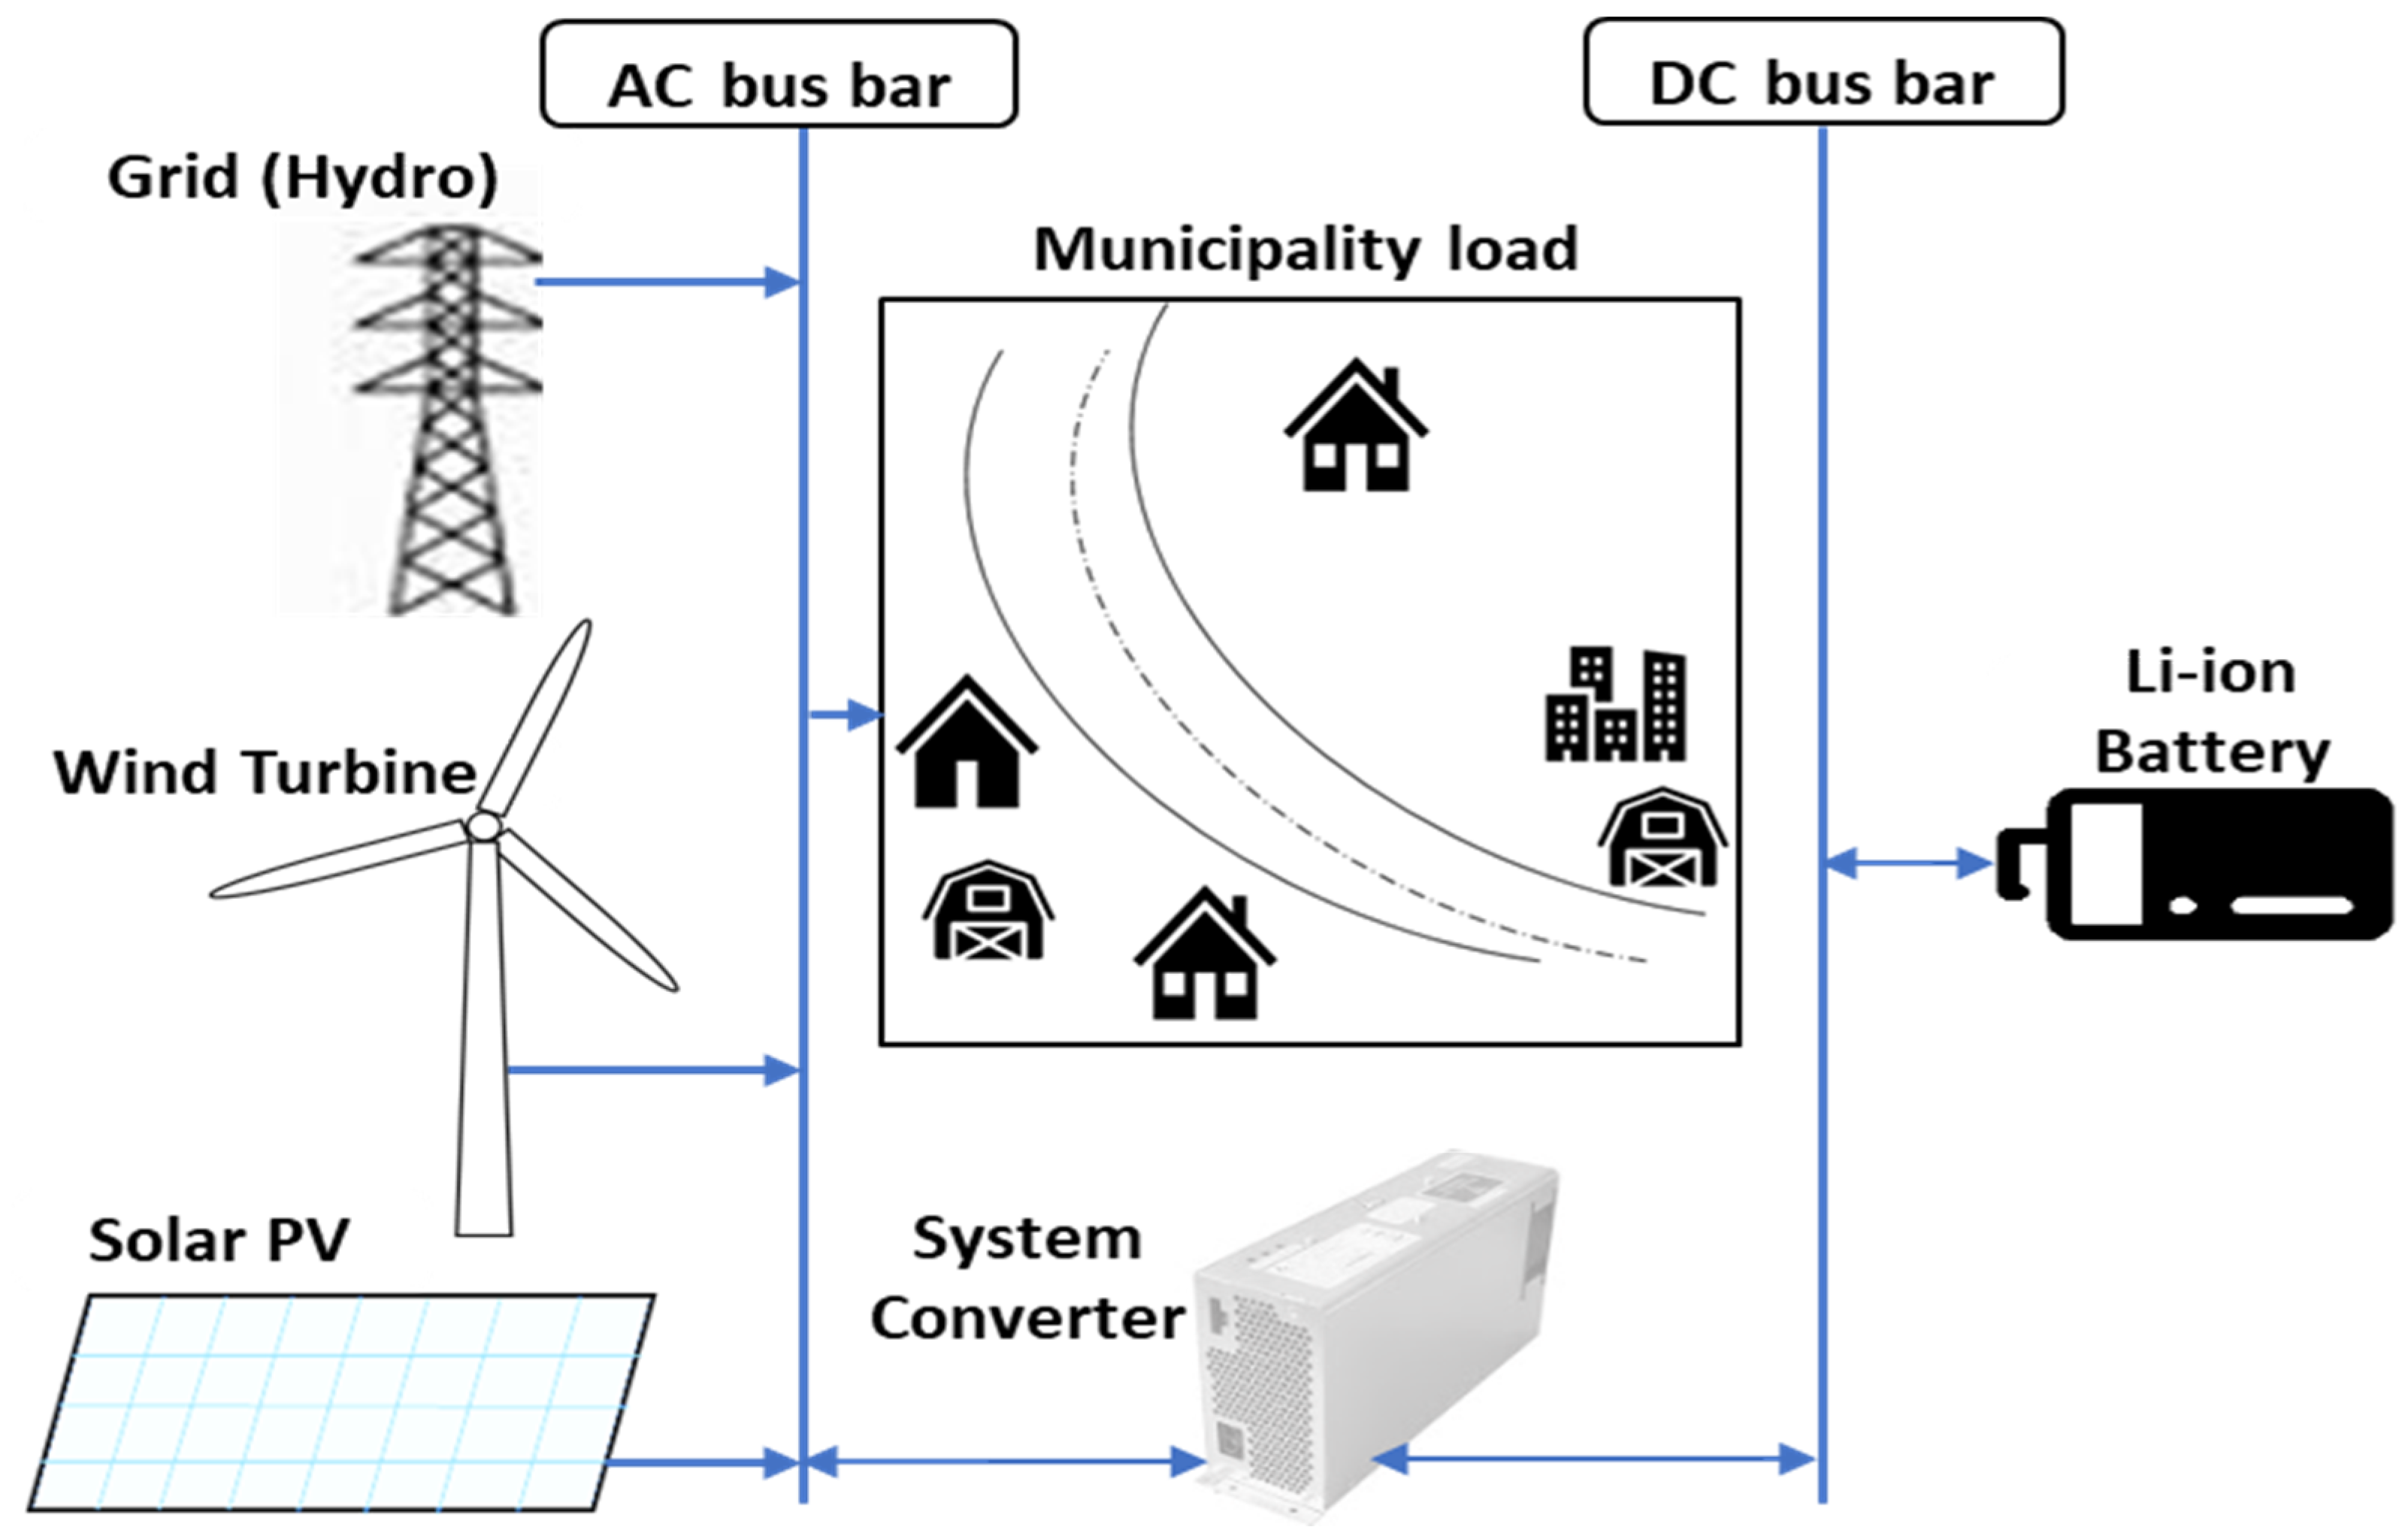
Section one of this paper provides a general overview of the underlining motivations and rationales for considering 100% RE transition research in Michigan’s UP, while the technical feasibility and economic viability of such system in this region is investigated. This is in part due to the weather situation in this area that calls for such an investigation. The need for this transition based on energy affordability and justice concept nexus is introduced. The section also includes a review of literature to strengthen the need for 100% RE in the UP, as well as the contributions of this paper to energy transition scholarship.
In section two, the method of data collection and assumptions made in designing and modeling 100% RE systems for three case studies with different utilities (electricity providers) are discussed. This includes a schematic diagram of composition, key performance indicators, weather data, and cost assumptions of the system. Results are presented in Section 3 for the base case of cost and sensitivity analysis with different cost variables. In Section 4, the feasibility and economic justification of 100% RE transition in the three case study municipalities are discussed. Policy and program mixes are suggested to support this transition’s competitiveness across assumptions that are embedded in the system design, modeling, and extended consumption through increased electrification of various sectors.

2. Method

The electricity systems from utilities of three municipalities from Michigan’s Upper Peninsula: Negaunee, L’Anse, and one that requests to remain anonymous, are used as a representative sampling of the Western UP (WUP). Each municipality is simulated with its own hourly electricity demand and climate profile. Electricity supply systems based on local wind, solar, hydropower, and battery storage are simulated using the Hybrid Optimization of Mixed Energy Resource Professional (HOMER Pro) software [45]. The applicability of this software spans private sector captive hybrid systems deployed by [46,47,48] and microgrid distributed energy systems for rural communities by [49].
The UP is rich in natural resources and today already utilizes a broad range of renewable energy technologies, including solar, wind, hydro, and biomass. In this study, only solar, wind, and hydro are investigated, which are the three leading electricity generating RE technologies globally [50,51] due to low and falling component costs [52]. Lithium-ion batteries are the only storage technology considered in this study, given their locational flexibility. They are also increasingly available at different scales based on their various deployment for mobility and electricity at the utility, commercial, and standalone scales [53,54].
A number of sensitivity analyses, including component costs, discount rates, effect of load reduction, and snow losses at various tilt angles are performed to quantify the high amount of both short-term and long-term uncertainties. Short-term uncertainties relate to the installed costs of renewable technologies, which can change rapidly due to policies (e.g., subsidies or tariffs) or the general reduction in costs due to learning and scale. Long-term uncertainties relate to the cost of capital, energy efficiency/load reduction, and pricing in the electricity market. A simple schematic of the modeling process is provided in Figure 2. Further details on each technology are provided in subsequent sections.
The system diagram used for each municipality is shown in Figure 3, where each component is simulated with one representative alternative. Due to a lack of data regarding hydrological resources, hydropower is not explicitly modeled in HOMER, but represented using the grid connection. Each community has access to a proportional share of existing hydro resources, which is explained in Section 2.7.
The communities are treated like prosumers rather than merchant energy providers, meaning that their 100% RE systems should be designed to supply their own load and not build overcapacity when it is potentially profitable to do so. To force HOMER to prioritize electricity supply to the community, grid exports are prevented in the simulations. This leads to the appropriate PV, wind, and battery capacities needed for a 100% self-sufficient community, but undervalues the sales potential of excess generation; therefore, revenues from grid sales are removed from the energy cost post-process.
Cost-optimal component capacities are found using HOMER’s optimization algorithm. All systems are considered to be community scale, i.e., several megawatts in capacity, which is the underlying driver of specific components and their cost assumptions. The economic lifetime of the system is 30 years; however, only single-year energy simulations are run due to the use of HOMER’s optimizer. The remainder of this section includes detailed boundary conditions for each component and system simulation, and a complete listing of input parameters and references can be found in Appendix A.

2.1. Key Performance Indicators

Component sizing is optimized by HOMER for minimal total net present cost (NPC), described by:
N P C = C 0 + y = 1 L C y + O y R y S L 1 + d y ,
which discounts costs occurring in year (y) with rate (d) over the lifetime (L) back to the present, including initial capital expenditures for building the system (C0), the replacement of equipment (Cy), operational expenditures (Oy), revenues earned from the sale of overproduction to the grid (Ry), and salvage value of equipment that has not reached its end of useful life (SL).
To make NPC results relatable, costs are presented as the levelized cost of energy (LCOE), defined by:
L C O E = N P C E y d 1 + d y 1 + d y 1
This form of LCOE is suitable for systems with constant annual energy generation or demand over time. HOMER has an internal LCOE calculation (labeled cost of energy, COE) which uses Equation (2) and includes all generation from the system for annual electricity, including that which is sold to the grid.
For this study, grid sales are not considered relevant to the supply of the community, only an economic benefit towards reducing costs. Therefore, LCOE is calculated post-process so that annual electricity (Ey) is limited to the community’s annual demand and does not include overproduction. The bracketed portion of LCOE is the uniform capital recovery factor, applicable when annual electricity is constant over the lifetime of the system.
Economic results are also compared considering the initial capital costs. Technical results are shown using the installed capacities for solar, wind, and batteries, as well as the fraction of total generation sold to the grid, labeled here as excess generation.

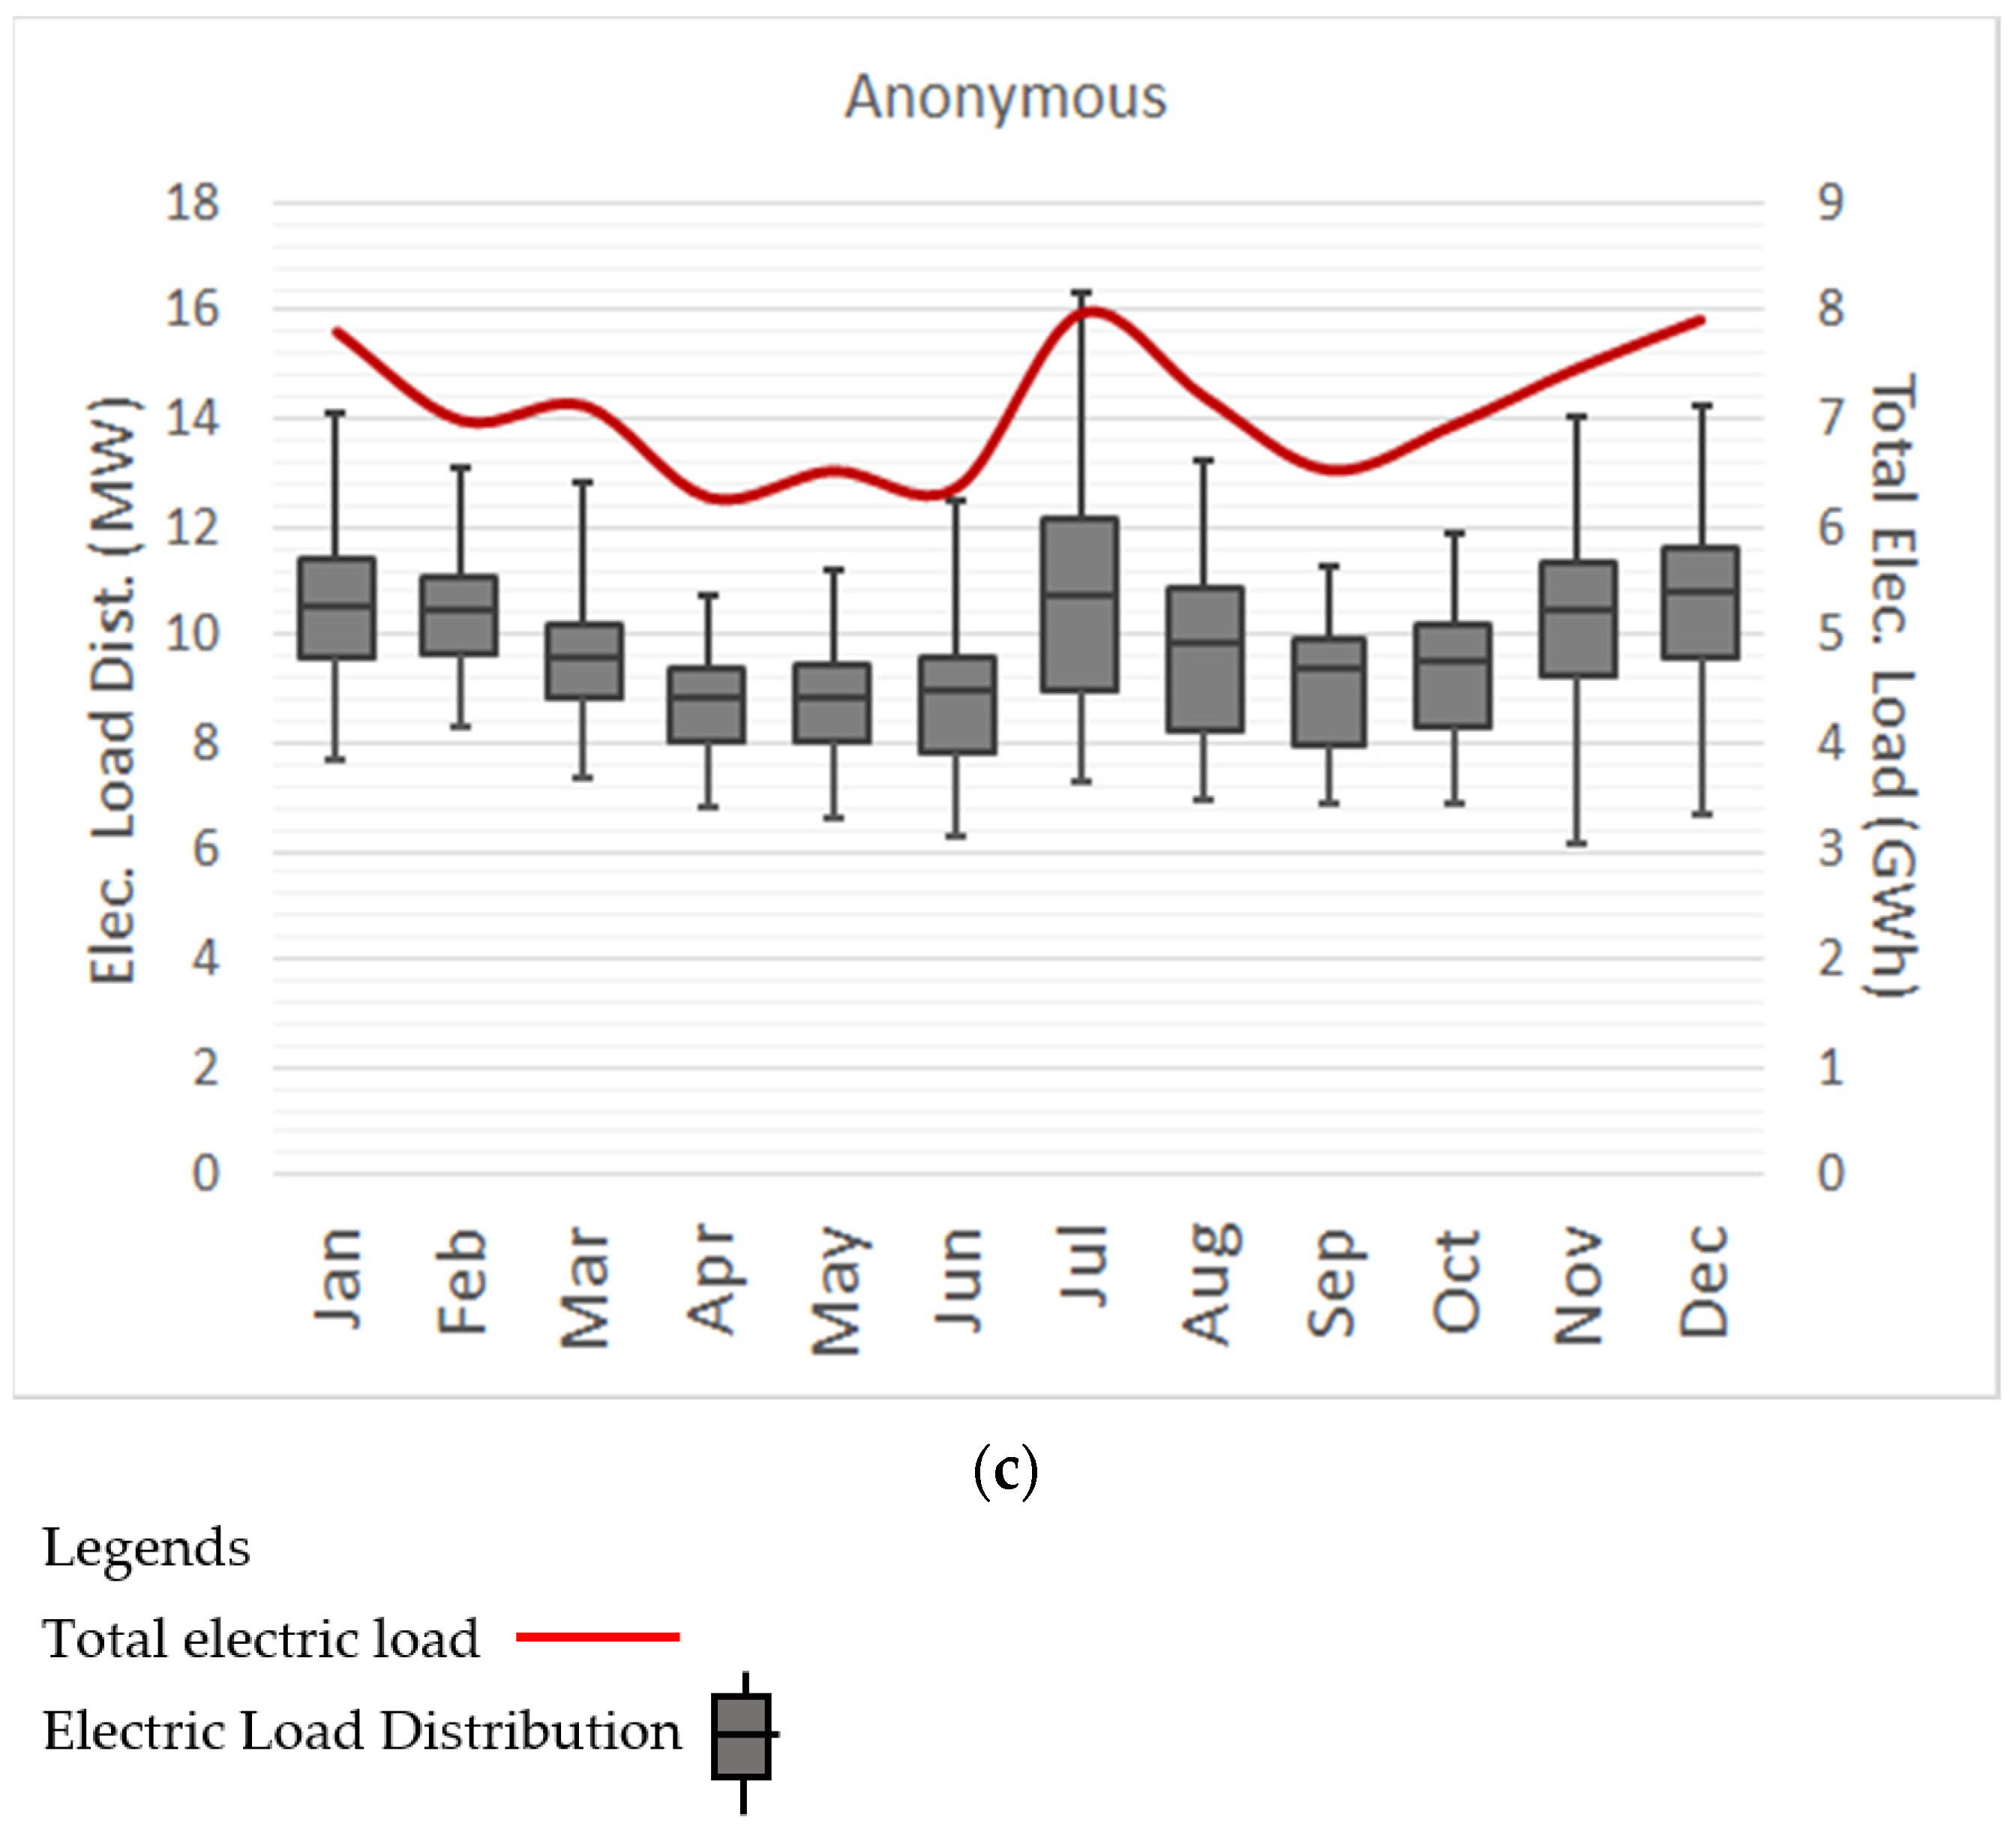
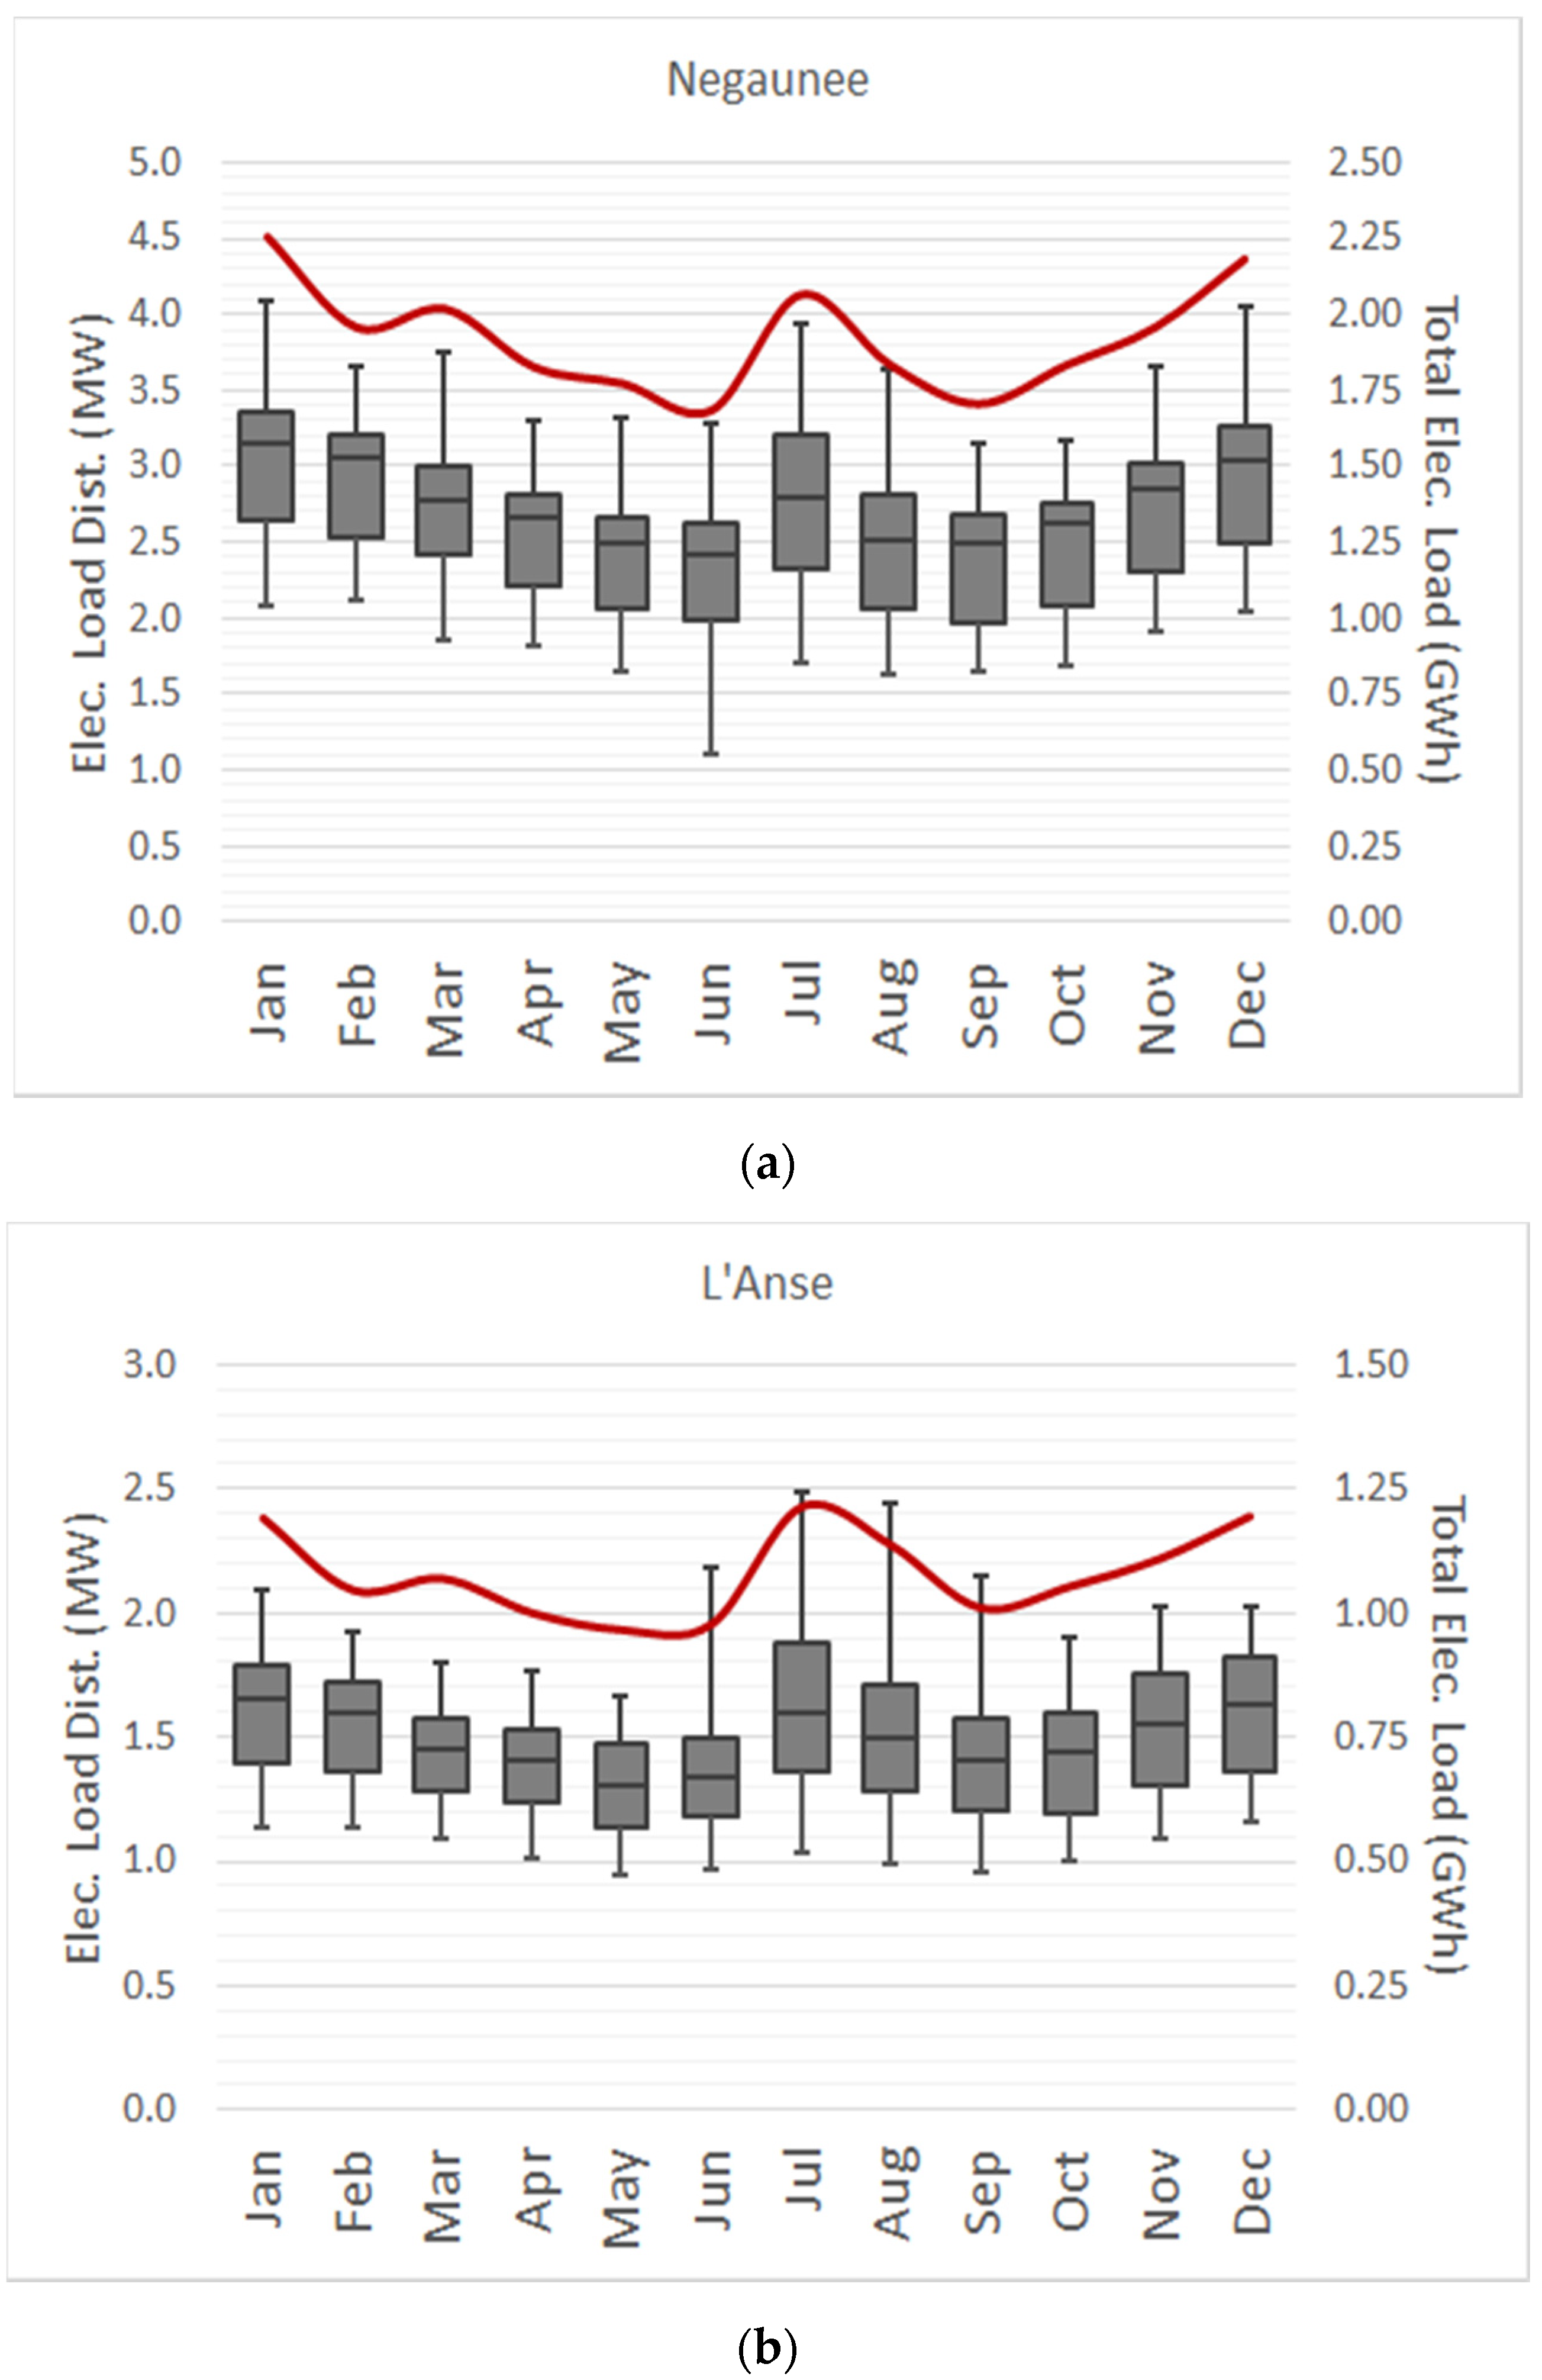
2.2. Electricity Demand
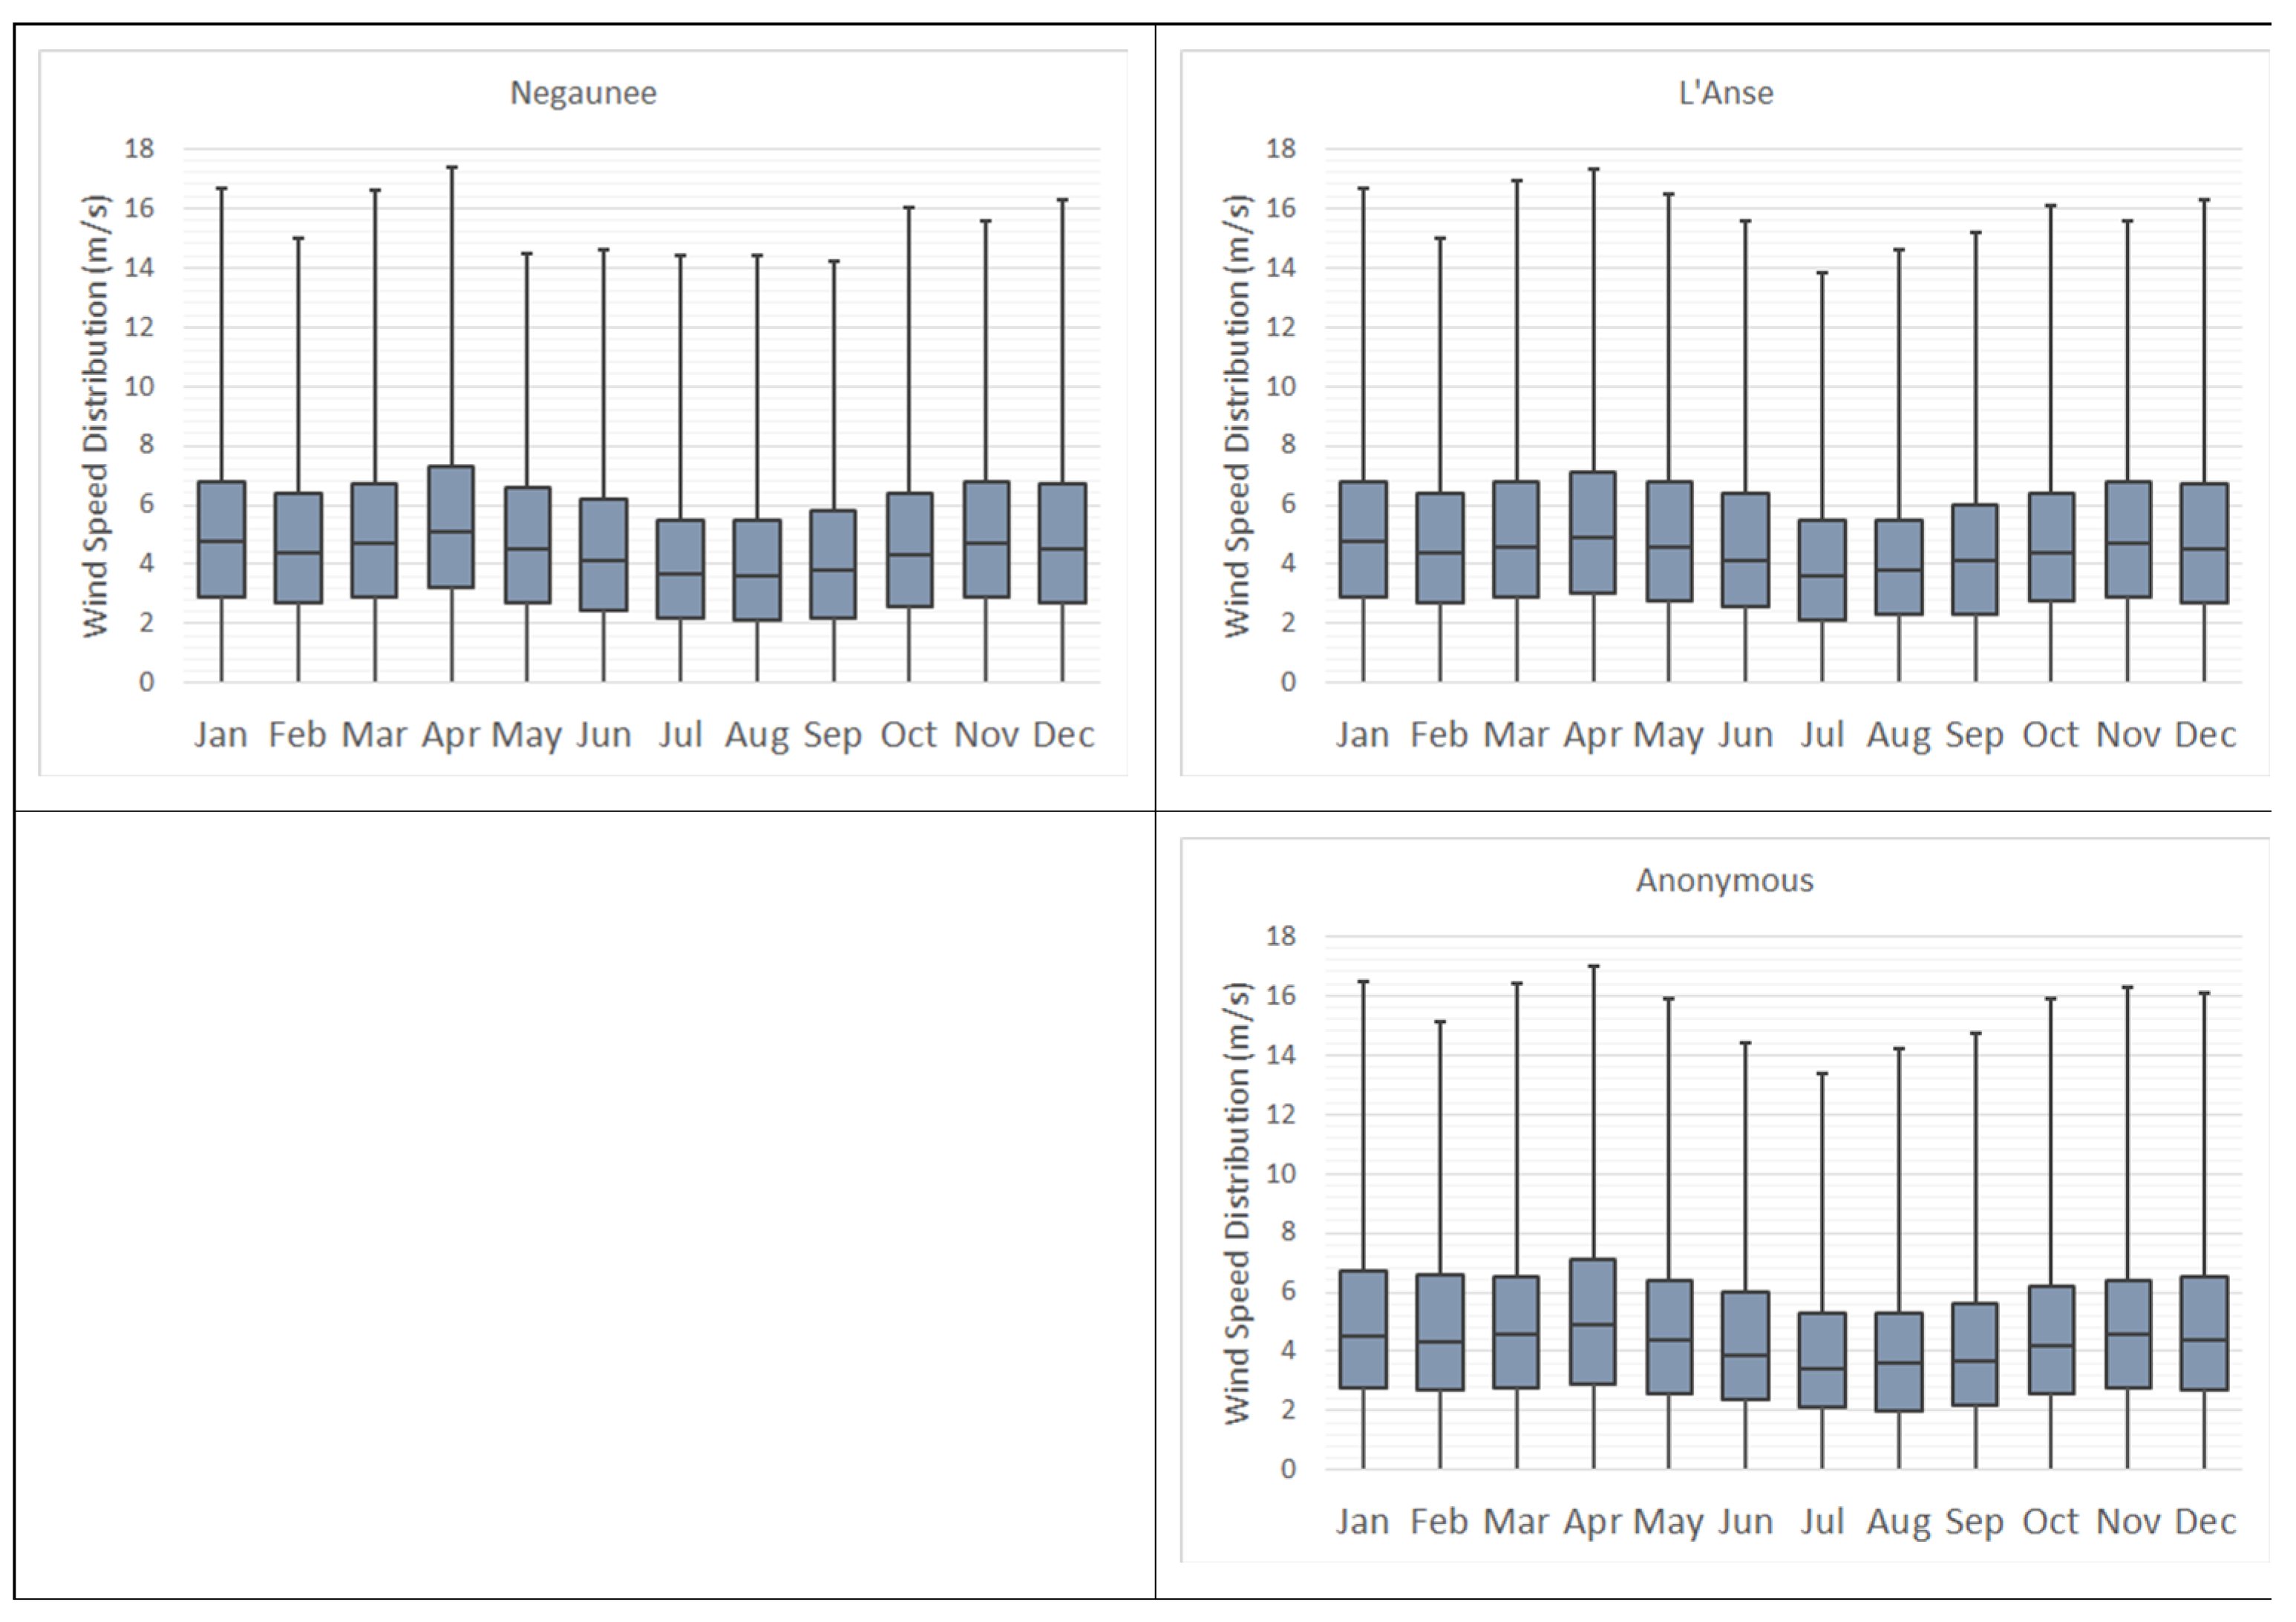
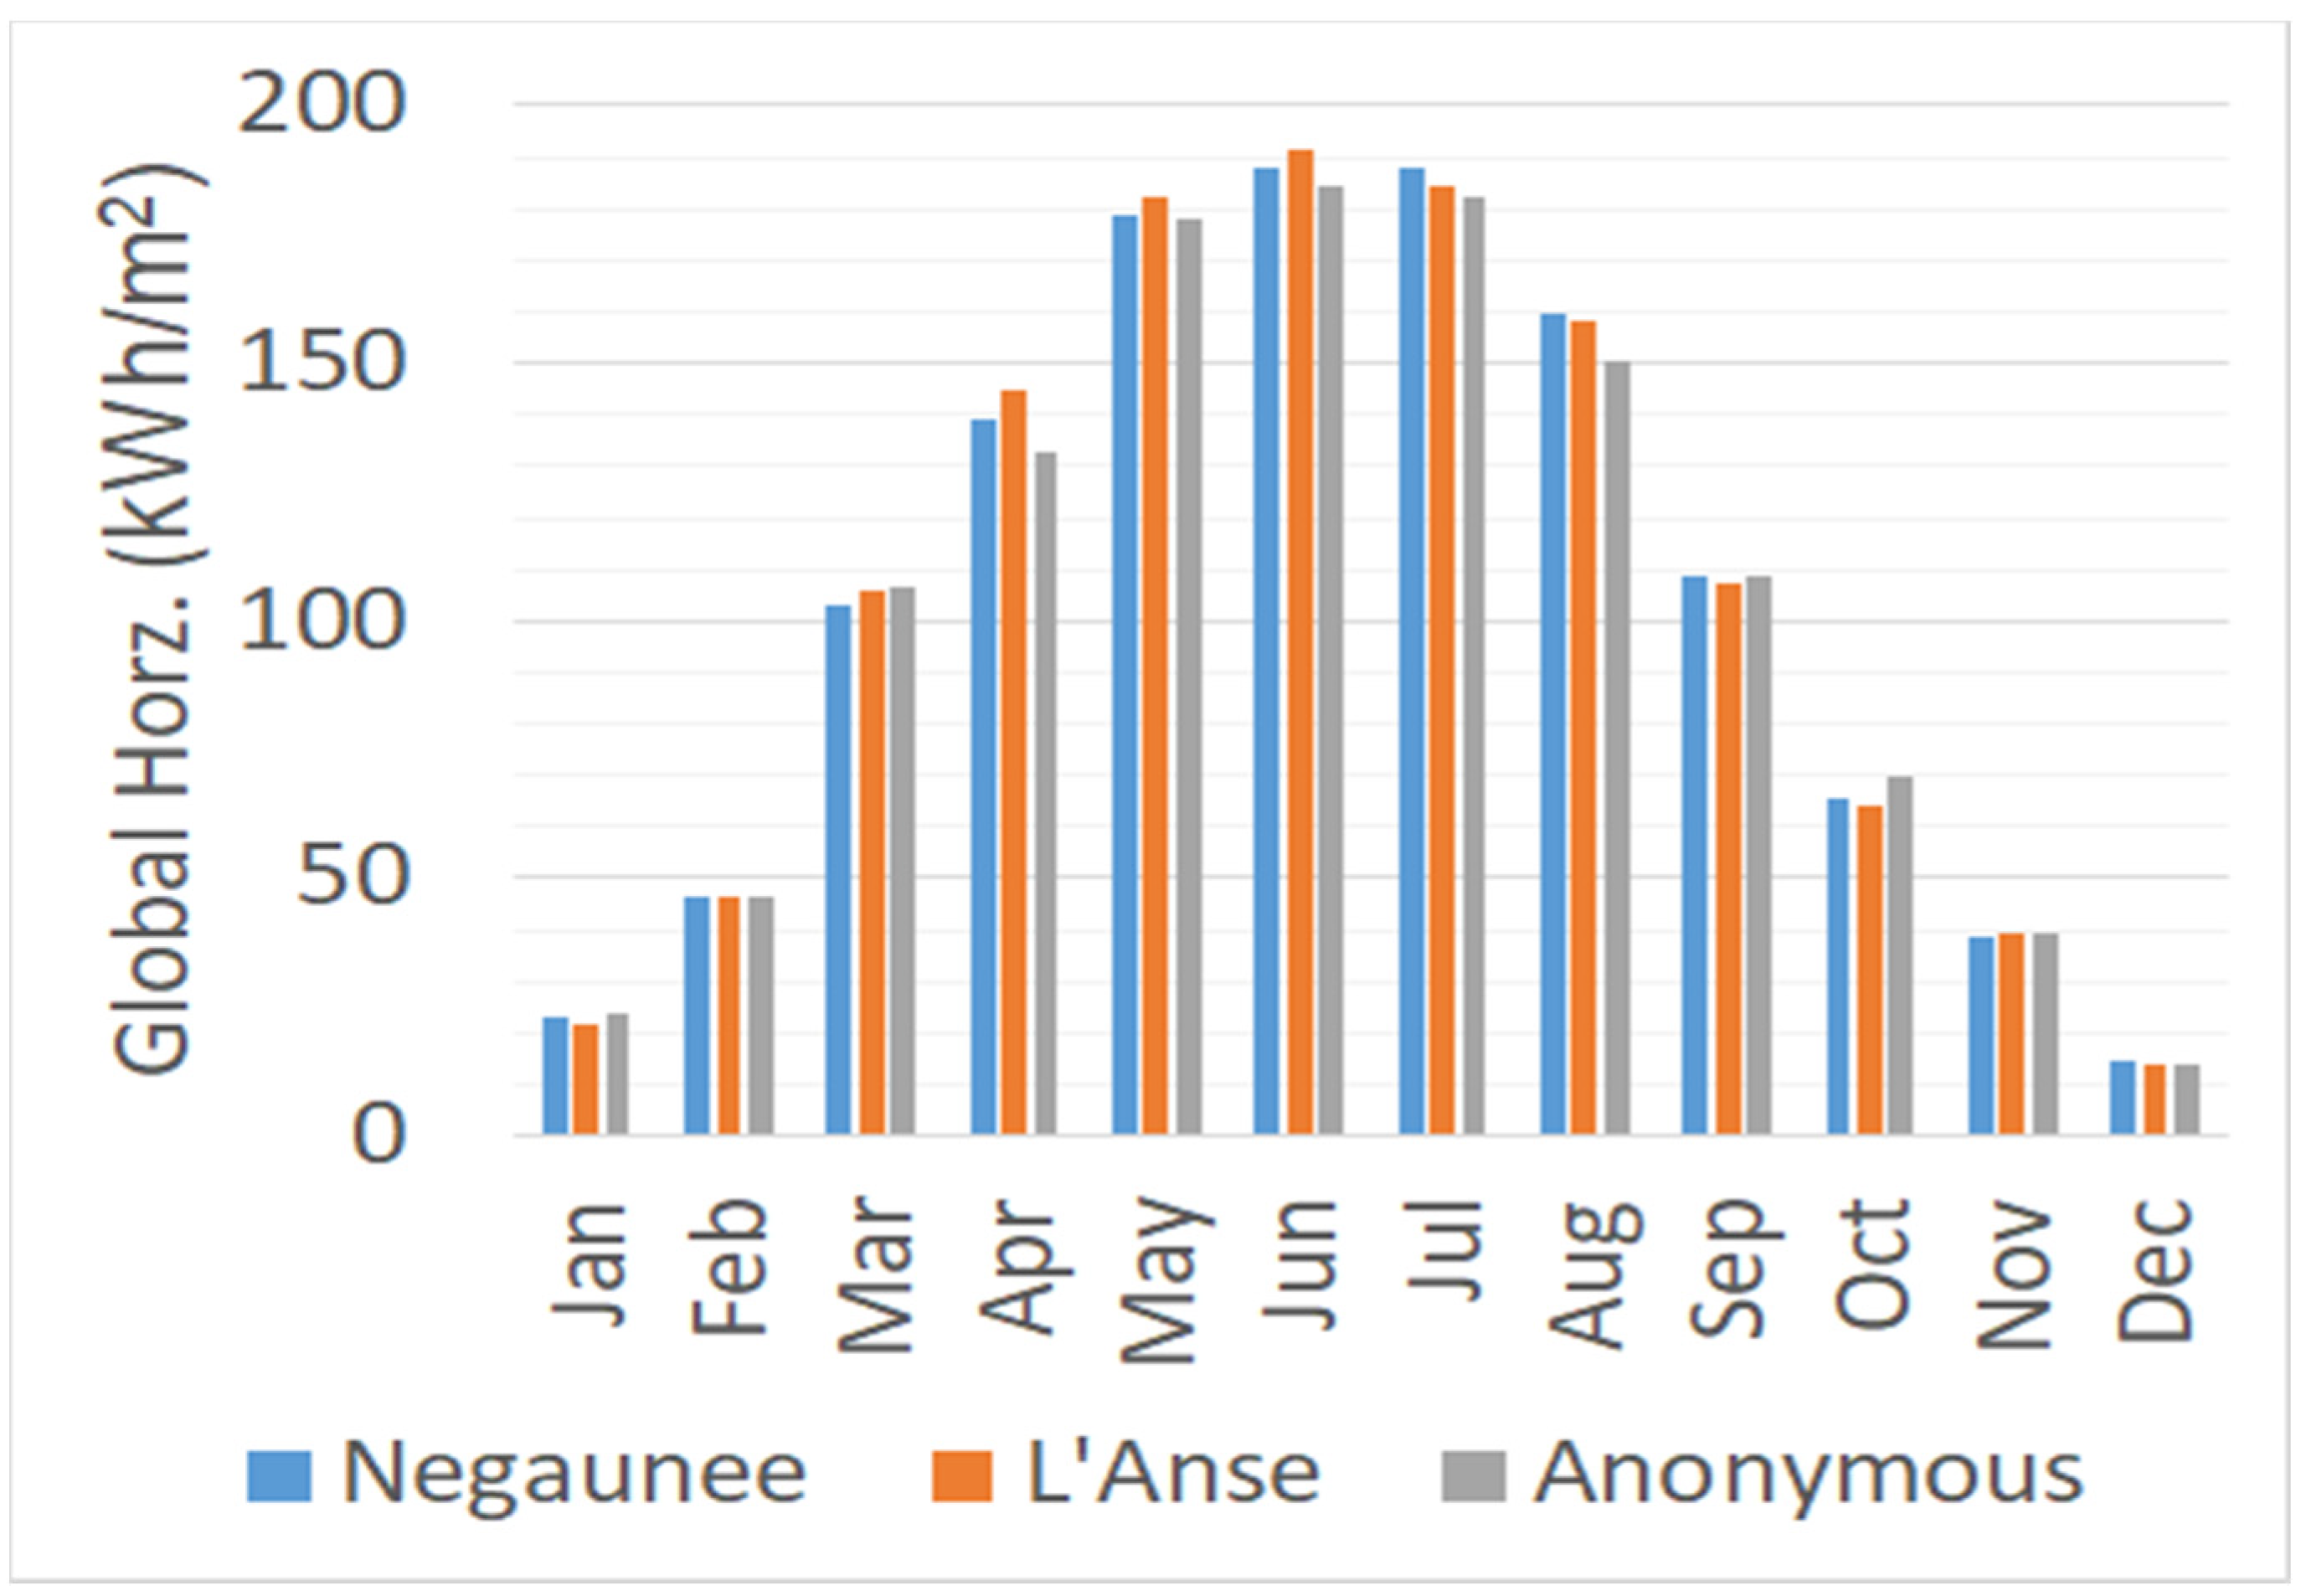
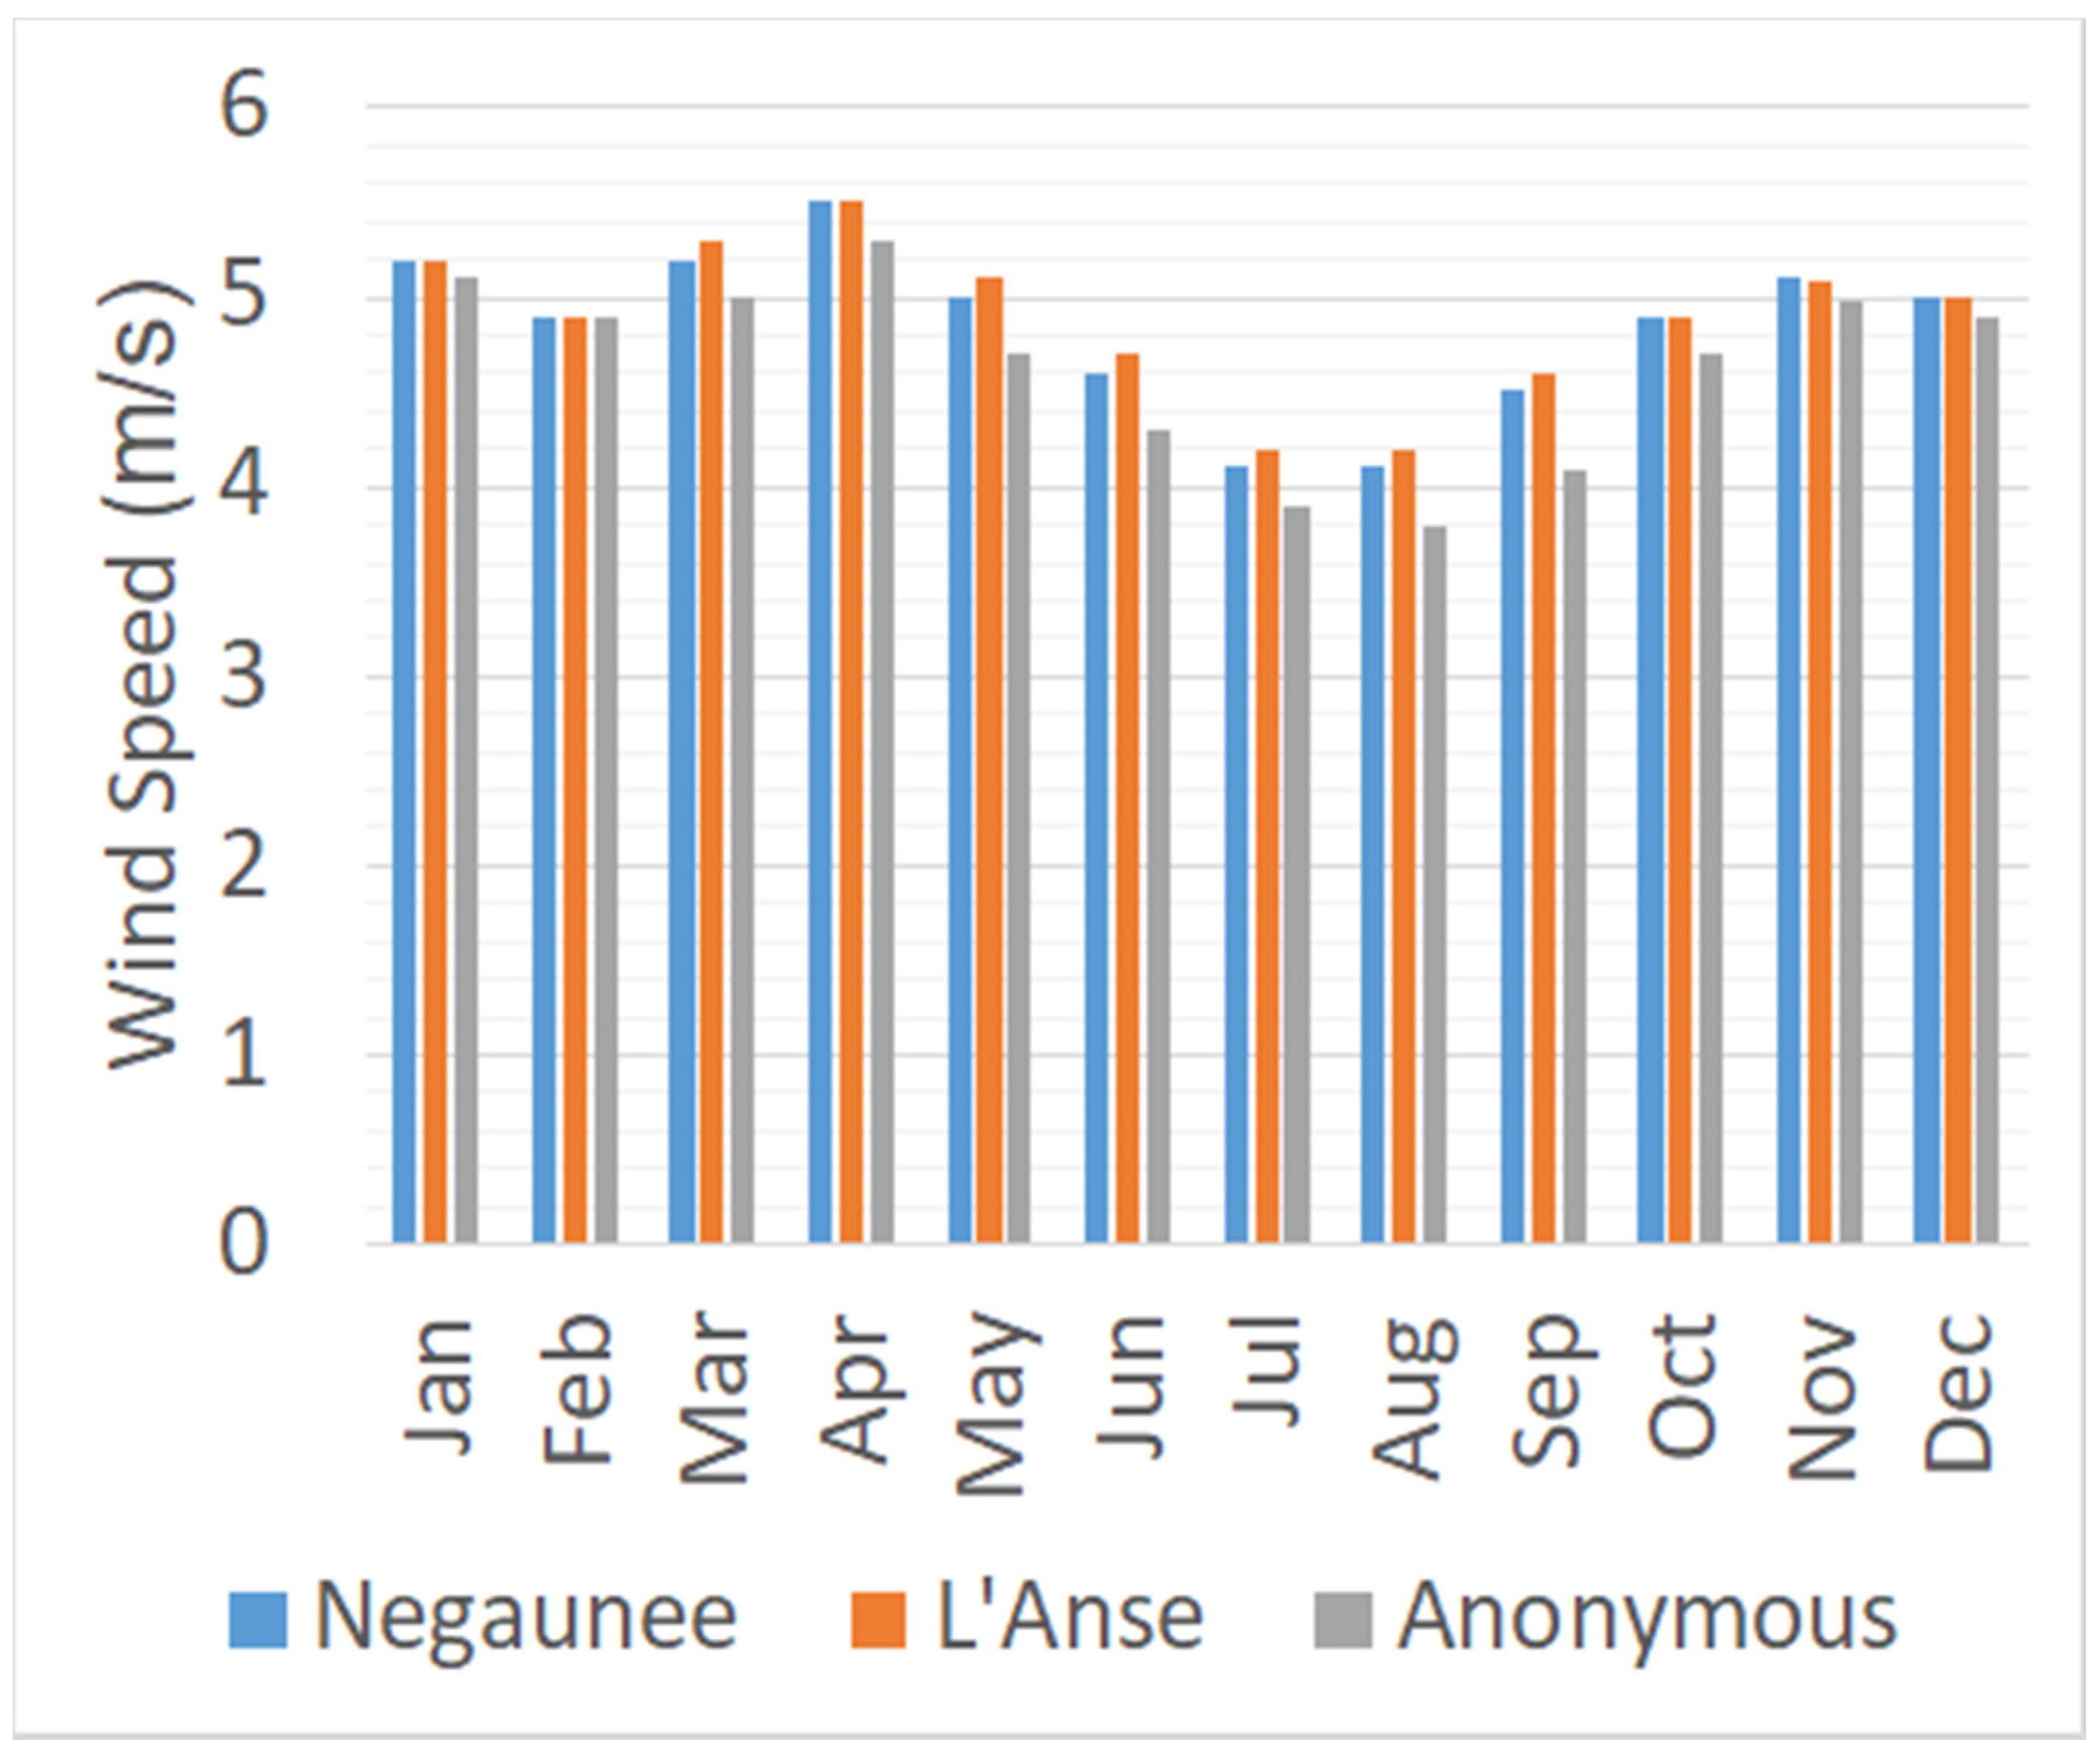
Each of the communities being simulated uses hourly electricity demand profiles from 2019, provided by the current supplier. In the interest of anonymity, not all the communities are identified by name and specific location. However, their total population and load profiles are provided in Table 1. Figure 4 shows the distribution of loads for each location by month using standard box plots and the summation shown with a line curve. The general load patterns show higher loads in the winter, except for a spike in cooling in July and August.

2.3. Climate

Typical meteorological year (TMY) climate data is generated using Meteonorm 7.3.1 with temperatures from 2000–2009 and radiation from 1991–2010 [55]. The latitudes and longitudes for the locations under study are given in Table 1 and the average monthly temperatures, total global horizontal irradiation (GHI) with snow losses removed, and average monthly wind speeds (at 10 m height) are given in Figure 5, Figure 6 and Figure 7, respectively.
The WUP has particularly high annual snowfall, causing a meaningful reduction in annual PV generation [56,57,58]. The accumulation and shedding of snow is a complex process that is difficult to model on an hourly basis with common weather station data [56,58]. With detailed experimental data from a study in the WUP [57], a simplified approach is used here where snowfall is assumed to cause a fixed percentage of losses for an entire day, which are selected randomly during a month. The resulting losses for 30° and 45° tilts have comparable daily loss patterns to empirical measurements and total seasonal and annual losses from unobstructed modules [57]. Given that the measurements by [57] were made from an area of the WUP with relatively high snowfall as compared to the communities studied here, these losses are considered conservative. A 60° test is not included in [57]; however, measurements by [58] show snow losses at 60° to be approximately half those at 40°, and therefore a similar pattern from 45° to 60° is applied here. The seasonal and annual losses for each location and tilt angle are given in Table 2, and the monthly GHI for the 45° tilt with snow losses removed is given in Figure 7. In addition, monthly GHI distributions and totals of each case with their corresponding snow losses at a 30 tilt are provided in Figure A1 in the Appendix A.
Wind speeds are highly localized due to terrain and nearby objects (i.e., forests or buildings), which leads wind farm developers to use short-term, site-located measurements in early planning stages. This approach is cost prohibitive in feasibility studies and a known limitation [59]. Therefore, studies rely on measured wind speeds from nearby meteorological stations [60,61] or, more commonly, synthetic time series data based on long-term historic measurements and local site conditions [62,63,64,65].
Meteonorm generates synthetic data by leveraging nearby weather stations for wind speed distributions and applying these to a stochastic model in combination with the user-specified terrain (all locations in this study are “open” terrains). The sites are not specifically proposed for wind farms but are indicative of the potential for wind power in the region. As a check on the feasibility of results, wind turbine capacity factors are compared to the Heritage Garden wind farm—the first large wind facility located in the WUP [66]. Table A1 in the Appendix A.1.2. provides corresponding power output to each wind speed. Figure A2 in Appendix A.2.2 shows the monthly wind speed distributions for each case study. Monthly air temperature distributions for each case study can be found in Figure A3 in Appendix A.2.3.

2.4. Solar Photovoltaics

The PV modules are modeled with specifications from SunPower’s E20-327 [67], which has a standard test conditions efficiency of 20.4%. To simplify the simulations and reduce configuration counts, the PV is modeled on the AC bus under the assumption that any community scale system will have a co-located inverter. The inverter is not explicitly modeled, but rather the total system efficiency (excluding snow losses discussed above) is assumed at 85%, which is comparable to modern installations [68,69].
The modules are assumed to be ground mounted with a fixed orientation, positioned at 30°, 45°, and 60° tilt angles and an azimuth of 0° (i.e., due south). Losses due to temperature are included using a nominal operating cell temperature of 45 °C and −0.35%/°C loss coefficient [70]. Since single-year simulations are used, no degradation rate is applied. Further, the selected PV module used in our model is tested to be free from potential-induced degradation [67]. Thus, degradation is taken to be 0% and not included in the simulations.
Given the target solution is a community scale, ground mounted PV system, it can be assumed that there are small changes in economies of a scale relative to other uncertainties, and a single specific capital cost figure is applied. The baseline installed cost is $2000/kWp, which is typical for medium sized commercial/community scale systems [71,72,73,74] and is tested down to $1200/kWp in the sensitivity analysis. The lower cost is already common in utility scale systems (i.e., 100 MWp or larger) and indicative of potential developments in the near-to-mid-term for community scale systems. The low-end cost can be reached in a number of ways, including continued hard or soft cost declines and/or continuation of the federal investment subsidy.
Long-term system monitoring suggests PV module lifetimes of 30 or more years are possible [75,76], so in conjunction with previous studies [71,77,78,79] and the majority of project developers [80], a 30-year lifetime is used here. Annual operation and maintenance costs are assumed at $13/kWp/year and includes inspection, insurance, land, and one inverter replacement [80,81].

2.5. Wind Turbines

Enercon wind turbine, E-82 E2 of 2 MW capacity, and a hub height of 85 m is selected [82]. A high capital cost of $1.5/Wac is used based on NREL reports for onshore turbines [83]. Due to falling costs of the renewable energy technologies, a five-step cost drop is modelled, giving the lowest assumed cost to $0.9/Wac. However, the lower range is taken as an optimistic capital cost achievable in the immediate implementation scenario.
For O&M, an upper-cost range of $36/kW/year is used in line with [71]. Generally, 20–25 years are used as the wind turbine lifetime [84,85]. Recent research on a lifetime extension of up to 15 years has been reported as feasible and within the safety margin [86]. This assumes a wind turbine lifetime of 35 years to be possible with development in wind research, so a 30-year lifetime is used here.

2.6. Battery Storage

Battery plants are modeled using HOMER’s idealized battery model and technical specifications from Tesla’s Powerpack [75]. The base unit is 232 kWh and 56 kW to provide a 4-h duration. HOMER only allows batteries to be connected to a DC bus; the diagrams in Figure 2 show they are the only DC component. Therefore, the converter is considered exclusive to the battery system. Tesla lists an 89.5% AC round trip efficiency, which is applied at the battery in DC and a 100% conversion efficiency applied to the converter [87]. The capital and replacement costs for the converter are included with the cost of the batteries. Tesla does not publish battery lifetimes; however, 1000–2000 cycles are typical for lithium-ion batteries [88]. A conservative 1000 cycles are used here (232 MWh) with a float life assumed at 15 years if the cycle lifetime is not met [88].
Capital costs for lithium-ion cells and plants are falling rapidly [89,90] and vary widely depending on type, location and system configuration. For example, longer duration plants (i.e., 4 h vs. 0.5 h) have lower specific storage capacity costs ($/kWh) due to savings on power conversion equipment [91]. High and low battery cost developments are tested using a linked sensitivity, with capital costs taken from 2020 and replacement costs from 2035, based on modeled cost projections from [92], and shown in Table 3. These projections capture the range of estimated cost developments from 25 previous publications, which demonstrate the considerable uncertainty around battery development [92].

2.7. Existing Hydropower

There are 27 existing hydropower facilities in Upper Michigan, consisting of both traditional reservoir and run-of-river types, and a total rated capacity of 212 MW [66]. No new hydropower is proposed in this study; however, the existing capacity is assumed to be available in a future 100% RE system and is distributed equally among the approximately 300,000 UP residents. Therefore, the hydro resources available for the purposes of modeling to each community are directly proportional to their population. In the occurrence of hydro absence, it is expected that the wind and battery storage capacity will need to shoulder demand. However, this is a rare case, as the hydro resource is well harnessed for power generation by utilities serving customers in this region, which is largely surrounded by water bodies.
14 of the 27 plants are located on the Michigan/Wisconsin border and owned by utilities not primarily serving the UP. To avoid system boundary conflicts with resource allocation, only facilities that are located wholly inside Upper Michigan’s borders are included, which results in a total capacity of 123 MW. Annual generation from these facilities ranges between 421 and 664 GWh/yr, corresponding to capacity factors of 38.9 and 61.4%, respectively [66]. It is beyond the scope of this study to model inter-year variability in renewable supply; therefore, a conservative 40% capacity factor is used, resulting in 431 GWh/yr available for all UP residents.
Due to a lack of access to inflow/outflow rates and reservoir sizes, hydropower as a resource is not modeled directly in HOMER, meaning the potential for capacity integration with non-dispatched renewables is missing in the results. Instead, hydro is modeled as a grid connection with limits on capacity and energy supply over the year. This allows HOMER to control the amount of hydropower used without exceeding the limits of generation. The peak capacity (kW) and annual hydro allocation (GWh/yr) for each community are listed in Table 4. The allocation is limited by setting the minimum renewable fraction, also shown in Table 4, which is the inverse of hydro supply since the grid is always considered to be 0% renewable in HOMER.
Based on a recent UPPCO integrated resource plan (IRP), the rate for the utility’s hydro facility is $24.514/MWh [93]. Thus, a rate of $0.0245/kWh is applied in HOMER as the grid purchase price representing available hydro.

2.8. Grid Connection

When purchasing electricity, the grid connection is limited to only representing hydropower resources within the UP; however, the grid also provides an opportunity to sell excess renewable electricity generation. Like other economic sensitivities, the price at which a community could sell excess power is highly uncertain, particularly in this study where the proposed systems have no local precedent. The latest MPSC approved prices for on- and off-peak sales of parallel generation for UPPCO’s Primary industrial customers are 0.0349 and 0.0278 $/kWh, respectively [94]. As a conservative assumption, only the off-peak price is applied here.
It is also important to include the cost of grid access to deliver hydropower; however, it is outside the scope of this study to consider all possible regulatory or market negotiation positions for a community energy system. Therefore, large industrial customers are used as a price source given that the peak loads and annual demands of the communities are comparable to many of the heavy industrial customers in the region (e.g., paper mills, mining, manufacturing).
Capacity pricing for UPPCO’s industrial customers is based on the peak demand for a given month and is separated into on- and off-peak periods [95]. The on-peak price is $6.30/kWp/mo and off-peak set to $3.07/kWp/mo, where the on-peak is considered to be 7:00–23:00. Finally, an annual fixed charge of $3900 is also applied, consistent with the current industrial pricing scheme [95].
This pricing approach is relatively simple and may not consider the complete cost of operating the regional transmission and distribution grid; however, it is assumed to be adequate for a feasibility study. A more detailed analysis would require a higher-level study of existing stakeholders, resources, and market structure, which is outside the scope of this work.

2.9. Energy Efficiency

Energy efficiency (EE) is an important factor in the discourse of 100% renewable electricity transitions. In achieving 100% renewable electricity, such as with the case in Burlington, Vermont [7], the role of EE is evident. Assumptions in a previous study on the reliability and feasibility of 100% RE study in other communities in Michigan have included EE [96], which negates/neutralizes the impact of future demand rise.
To account for potential energy efficiency and conservation, load reductions of 1.75% and 10% from the current demand are tested. In HOMER, this is applied as a load reduction at the corresponding percentage at each time step. The reason for this consideration is that EE is one of the requirements by MPSC for regulated utilities’ IRP on energy waste reduction (EWR), which is a medium plan to reduce existing waste both from generation and consumption by a certain percent [11]. The EWR is a program targeted at energy demand side management, in which utilities are deployed to reduce energy demand. For instance, MPSC requested UPPCO to have an EWR of 1.75% by 2021 [11]. Also, the MPSC in the statewide energy assessment (SEA) report targets 10% EWR to meet 35% clean energy by the year 2025 [21]. This shows how important EE is both for the utility and customers.

2.10. System Level Parameters

Load following (LF) dispatch strategy is applied for each system to optimize RE (PV and wind) production to meet demand in the day and charge battery storage for serving night load. Although LF is not fundamentally needed in the case of 100% RE, HOMER requires a control strategy as a prerequisite to run simulations.
The cost of capital is highly uncertain; therefore, a range of real discount rates (i.e., not including inflation) is tested. The baseline real discount rate is 2% and the highest is 8%, consistent with typical market rates before the global pandemic of COVID-19 [97]. In previous research on technical modelling for small and medium enterprises in the UP, a rate of 2.66% was used [46]. A summary of the tested sensitivity parameters and their ranges is given in Table 5.
Multi-year simulations, while available in HOMER, are not possible to combine with the optimization tool. Each community has 2700 sensitivity analyses to optimize, meaning manually sized capacities are impractical. The only boundary condition affected by this limitation here is PV degradation. With capacities found using HOMER’s optimization, a test of the impact multi-year simulations found that PV capacity would increase by 10 to 15%, increasing total cost by 1.5 to 2%. This is an acceptable error considering the range of economic uncertainty captured by the tested sensitivities and shown in the results.

3. Results

A community energy project on this scale would realistically not be developed until 2025 at the earliest; however, the base case economic scenario is defined with plausible values for the 2020 market, including a 2% real discount rate, 45° PV tilt angle, PV cost of $1800/kW, wind cost of $1350/kW, and medium battery cost of $330/kWh. This makes the base case reasonably conservative, with future cost reduction potential described by the sensitivity analysis.

3.1. Baseline Results

The baseline results are given in Table 6, including the cost-optimized PV, wind, and battery capacities, initial capital, and LCOE for each community. Due to the relatively nascent grid-scale battery industry and associated uncertainty in pricing, all three battery costs are shown as baseline results.
For the mid-cost battery results, the LCOE for L’Anse, Negaunee and the Anonymous municipality are 0.1813, 0.1516, and 0.2096 $/kWh, respectively. The prevailing residential grid price in the region is $0.2350/kWh; therefore, these LCOE values represent a 23%, 35%, and 14% price reduction for L’Anse, Negaunee and Anonymous, respectively. As compared to the prevailing commercial rate of $0.1290/kWh, these prices are 40%, 18%, and 62% higher.
Demand is met primarily with wind generation, which has both higher installed capacities, as well as higher capacity factors that range from 28 to 31%, as compared to 12% to 13% for PV. For L’Anse and Negaunee, approximately 50% and 40%, respectively, of the total generation is excess sold to the grid across the baseline. Excess occurs throughout the year but is greatest during the spring and fall seasons. Only in the Anonymous community does the cost of batteries have a notable impact on capacities, where higher costs lead to fewer batteries and more renewable generation. There is also a shift away from PV and towards wind, with higher battery costs due to the lower LCOE for wind power. This has an impact on excess generation, which increases from 41 to 46% and 62% for the low, mid, and high battery costs, respectively.
Focusing on L’Anse, the LCOE with low battery cost is $0.1582/kWh for 1.7 MW of installed PV, four wind turbines totaling 8 MW of installed capacity, and 70 MWh of Li-ion battery storage. This indicates that a 100% RE system could reduce energy costs by up to 33% for residential customers, as compared to the current grid rate. Moving from the low to mid to high battery costs, there is a 14% increase in LCOE, meaning the savings to residential rates are 33%, 23%, and 13% for low, mid, and high battery costs, respectively. For commercial customers, the lowest rate is still 23% higher than today, suggesting that if this system were implemented as is, rate design between customer groups would be a critical factor.
In Negaunee, the lowest cost solution has $0.1348/kWh for approximately 4.8 MW of PV, 10 MW, and 94 MWh of batteries. This is 43% less than the prevailing residential rate, and only 4% higher than the commercial rate, suggesting that a rate design that saved all customers money would be feasible. Moving from the low- to high-cost battery systems provides residential energy cost savings of 43%, 35%, and 29%, respectively. The results also indicate that 100% renewable electricity is more economically viable in Negaunee than in the other two cases. It should be noted, however, that Negaunee benefited from having a wind capacity that better fit the load profile, so there was less overproduction. This is largely a function of large wind turbines. If future work used a generic, 1 kW wind turbine so that HOMER could much more precisely select the amount of wind to apply, the overproduction for each community would be closer and the LCOEs would likely be closer as well.
The third case, Anonymous, has the highest LCOE among the three municipalities, being $0.1879/kWh for 34.9 MW of PV, 38 MW wind turbine capacity, and 528 MWh of battery at low battery costs. The highest LCOE is $0.2195/kWh, a 17% increase over the low cost. In comparison to the prevailing residential rates from the grid, 100% renewable electricity could provide a 9% to 20% cost savings depending on battery costs.

3.2. PV Tilt Angle

At the UP’s latitude, optimal PV production occurs at approximately 40° [98], as the latitude is around 46° for the western UP. However, system optimization considering snow increases the tilt angle. In Table 7, it can be seen that increasing tilt angles to 45° and even 60° can actually reduce LCOEs. In both Negaunee and Anonymous, LCOE is reduced by 13% moving from a 30° to 60° tilt, equivalent to $0.0219/kWh in Negaunee and $0.0288/kWh in Anonymous. This is largely due to the reduction in initial capital costs, which are reduced by 10% in Negaunee and 12% in Anonymous when comparing 30° to 60°, and the critical hours for supply occurring in winter when snow losses play a large role. Increasing the tilt angle allows for snow to clear more quickly, reducing the need for batteries and thereby reducing LCOE.
L’Anse does not follow the same trends, however, with LCOE staying largely constant, battery capacities and capital costs increasing with tilt angle, and a solution without PV at 60° tilt. This could be due to coincidental effects of snow losses and wind speeds, and so further investigation into worst-case scenarios is needed. The increased tilt angles do not always lead to less generation, as shown by the percentage of generation sold as excess to the grid. The relatively high cost of batteries is more critical to cost savings than excess sales from low-cost wind and solar.

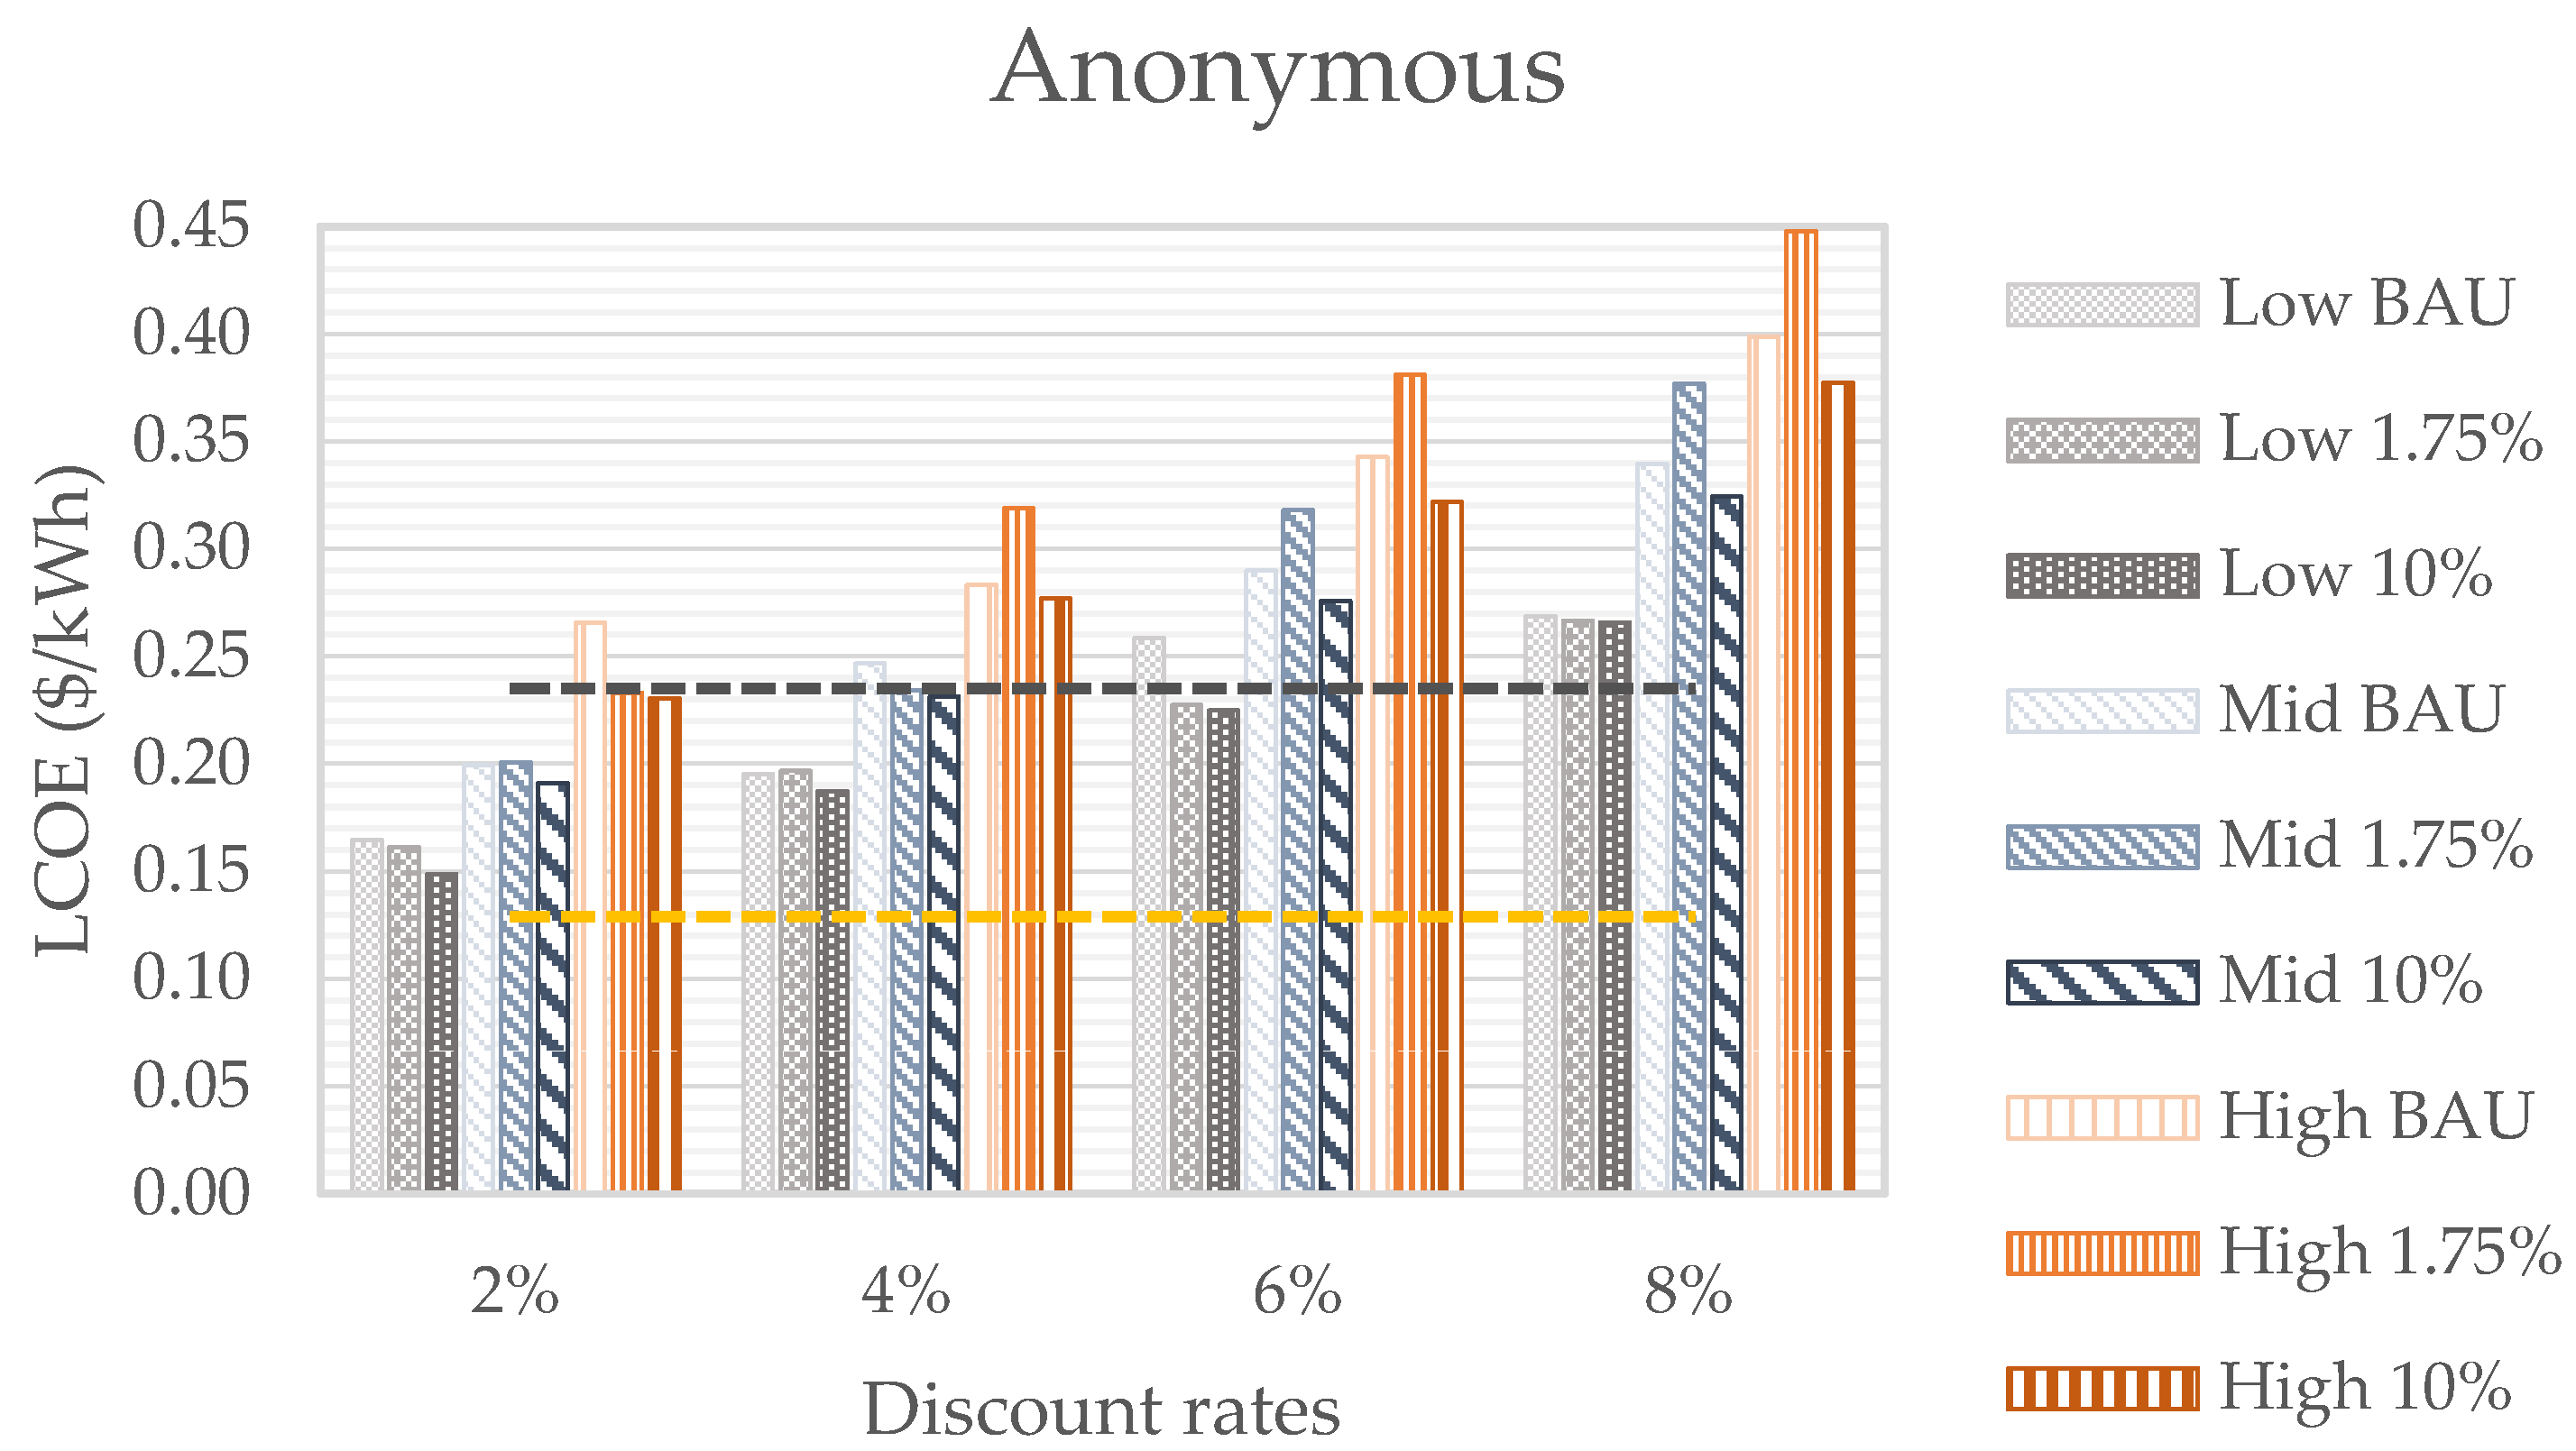
3.3. Sensitivity Analysis

The effects of energy efficiency, real discount rate, and equipment costs on LCOE are presented in this section. Each community is shown on its own figure, with L’Anse, Negaunee, and Anonymous corresponding to Figure 8, Figure 9 and Figure 10, respectively.
The results are clustered primarily by discount rate on the x-axis. Within each discount rate are clusters representing three equipment cost scenarios, Low, Mid, and High. The low scenario corresponds to PV, wind, and battery costs of $1200/kW, $900/kW, and $297/kWh, respectively. The corresponding medium scenario is $1600/kW, $1200/kW, and $330/kWh, and the high scenario is defined as $2000/kW, $1500/kW, and $359/kWh. The clusters within each equipment cost scenario are for the load reductions, where business as usual (BAU) represents the existing loads, with 1.75% and 10% representing the associated reductions in annual demand. All results are shown for design scenarios with a PV tilt angle of 45°.
In L’Anse and Negaunee, LCOE is relatively insensitive to load reduction within the same discount rate and equipment cost scenarios but can still be up to a 10% reduction. In absolute terms, the difference is less than $0.01/kWh and at most $0.02/kWh. The patterns are more dramatic for the Anonymous community, where the 1.75% reduction can cause up to a 12%, or $0.05/kWh, increase in LCOE. This is in large part due to wind-only portfolios being selected in these cases, leading to high excess generation. Again, it is likely that more consistent trends would be present with smaller wind turbine capacities.
Within a single discount rate, however, the trend is different for load reduction scenario. The general trend shows that up to a 2-cent drop in the LCOE can be achieved, moving from BAU to 10% in both L’Anse and Negaunee. In the Anonymous municipality case, up to a 6-cent drop can be observed. This is especially so for higher discount rates from 4% to 8%.
Moving from the low to high equipment cost scenarios, LCOE is generally increased by 17 to 20% at each step for a given load profile. The trend is less consistent in the Anonymous community, as noted above. A similar increase in relative LCOE is found moving up from the 2% discount rate, which can lead to much higher costs at the 8% rate. For instance, in the L’Anse BAU load with low component cost, corresponding LCOE increased by 71.4%. A similar increment is observed for both load reduction scenarios and component cost sensitivities in the other two municipalities.
These results highlight the criticality of both equipment and financing costs, given that approximately half of the sensitivities across all municipalities are below the prevailing residential rate (Res. Rate). The low-cost scenarios can be considered plausible within the next 5–7 years, which would be a reasonable development period for such projects started in 2020. If these prices were secured and financing rates remained as low as today, these municipalities could even approach the prevailing commercial rates (Com. Rate) for the region, and in the case of Negaunee actually fall below the commercial rate in the low-cost scenario. This is particularly notable given that these LCOEs are less than the $0.12/kWh average national residential price for electricity, shown in Figure 1.

4. Discussion

As the research examines scenarios that exist outside of the current regulatory framework, policies to facilitate transition to 100% renewably sourced electricity are investigated to inform statewide energy policy with specific recommendations. Conditions for technical feasibility and policy implications for achieving this 100% RE are discussed in this section.

4.1. Feasibility and Economic Justification of 100% RE Transition

The different scenarios and sensitivity considered in this research show routes that each municipality can take to achieve the 100% RE for electricity generation. Overall, it is clear that northern rural areas can move to RE systems at costs less than the residential electricity rates already in 2020. The sensitivities show that LCOEs lower than commercial rates are plausible within the next 5 years, given the ongoing cost reductions in renewable generation and battery storage, which would make 100% RE an easier choice for rural UP communities. A risk to these results is the cost of financing, which has been relatively low for the past decade and is highly beneficial to renewable investments [99].
Most system solutions resulted in 40–60% of the generation not being used within the communities, highlighting the opportunities for longer-term storage, such as pumped hydro or hydrogen, and the electrification of transport [100,101]. For instance, there is an increasing interest in pumped hydro storage from abandoned mines, which are common in the UP [102,103]. Electric vehicle (EV) technology, sales, and charging stations are growing rapidly, with the expectation that EVs will have a 30% market share in 2030 [104]. Replacing gas boilers with heat pumps can also increase renewable utilization, particularly in a cold climate where heat is the largest energy demand in buildings [105]. Electrifying all buildings will cause a considerable increase in electricity demand and can potentially lead to higher peak loads [106]; however, the flexibility offered by hot water tanks and building mass, combined with smart controls, make load shifting and peak reductions increasingly possible [107,108,109,110].
From an economic perspective, increasing local utilization of renewable generation will help to reduce costs from the results presented here. Here, the value of excess generation is only $0.0278/kWh, whereas higher prices could be set if this energy was being delivered to EVs or heat pumps. From a climate perspective, shifting generation from regional gas and coal plants to local renewables will dramatically reduce emissions, and even much more so if transport and heating can be electrified [111,112]. Through a bottom-up approach, rural northern regions thus have the capability to lead in meeting 7.5% annual national emissions reduction and limiting global warming to 2 °C by transitioning to 100% renewable electricity. Perhaps most importantly, such rural regions can take this leading environmental position while reducing costs.
The equal distribution of hydro resources throughout the population is a core assumption for this study and works to reduce LCOEs, as compared to having no access to hydropower. However, municipalities do not currently have the capability to directly procure the UP’s hydropower, only indirectly through existing utilities. The production of an entire plant’s generation can be purchased exclusively for use by a single, large consumer, i.e., a manufacturing facility. Utilities located outside the region can also secure UP resources; for example, Detroit, Michigan based utility DTE will take ownership of a 72 MW wind farm in the UP for their customers in the Lower Peninsula [113]. Local renewable resources are not allocated to the residents, while in the current market structure they are an easily privatized, exportable product. This can be a positive economic aspect for landowners who earn rent, residents with new jobs, and communities through increased tax revenues [114,115]. However, the opportunity cost to residents who could have had lower energy prices through municipal ownership also needs to be considered as part of a holistic and not just economic development plan [116,117].
There is also a conflict between the political boundaries of states, as compared to the boundaries of utility companies and markets, and as signified by the omission of hydro facilities on the Michigan/Wisconsin border. It is certainly possible to create alternative distributions of hydro resources based on various system boundaries or market designs, which will have a significant impact on the cost of energy given hydro’s low marginal cost and dispatchable generation. Only 62% of the UP’s hydro capacity is included in the model, meaning it is possible that more generation from plants at the Wisconsin/Michigan border could serve UP customers and reduce costs. Additionally, conservative capacity factors are assumed for the hydro plants, whereas higher capacity factors will yield lower LCOE compared to results presented here.
While an attempt is made to maintain conservative yet plausible assumptions for both technical and economic boundary conditions, it should also be restated that the LCOEs found here are likely to be 1 to 2% higher in all cases due to the lack of PV degradation in the HOMER model. However, given the sensitivity results of Section 4, this uncertainty is relatively minor and does not alter the conclusions.

4.2. Policy Implications and Future Work

The renewable generation portfolios developed in this research assume that each community is capable of transitioning from a group of co-located customers of a single, regulated utility into a single prosumer (producer and consumer). It is important to note that under current Michigan regulations, WUP communities are unable to self-organize, form municipal utilities, and procure their own energy as only 2% of utility’s average in-state load on the distributed program are allowed [118]. This rule applies to only individual customers who are able to build local RE systems.
Successful transitioning of municipalities to 100% RE for electricity supply can be facilitated by state and local policies, which motivates local energy ownership and municipalization of utility [119]. Policies that have proven to be successful in the expansion of renewable electricity are combinations of renewable portfolio standard (RPS), the distributed energy system, and net-metering [120]. While these policies have or do exist in the state of Michigan, they are constrained by current distributed generation caps and other legislation favoring electric monopolies. For instance, Michigan’s current 15% RPS could be substantially increased after 2021, considering 14 other states in the U.S. have at least a 50% target [121]. Policies enabling distributed renewable energy technologies to simply compete with existing utilities will give the municipalities the ability to self-organize, promote, and locally fund the development of clean and affordable distributed energy resources for successful and profitable energy transition.
Concerning excess electricity produced by the system, policies to increase the adoption of electric vehicles and heating will help reduce energy waste and costs. Federal rebates already exist for both products; however, these programs are less effective in a region with low income where residents cannot make large investments [122,123,124]. Business models and/or market regulations that reduce the cost of energy without high upfront costs will be far more effective, as has already been demonstrated in the U.S. PV market [72,125,126]. In addition to electricity, the need for competitive and sustainable heating is already the focus of the Michigan governor’s UP-Energy Task Force [127], which is seeking alternatives to propane, and more work on the individual investment economics are needed to support specific policy initiatives.
For electric vehicles, expansive infrastructural development of charging stations is another way of using the excess generation from RE technologies. Across Michigan, EV charging sites are growing with the help of economic support from the state, including two dozen locations in Upper Michigan [128]. Stakeholders and residents will play critical roles in such decision-making processes. For instance, large commercial customers such as Walmart [129] can be a host to municipal EV charging stations through a carefully developed memorandum of understanding.
Since lower supply costs are achieved with a 10% reduction in average annual load, the municipalities should devise plans for aggressive energy efficiency programs. This might require changes in social practices among individuals and organizations, which can shape demand for energy resources and lead to a sustainable energy transition [130]. Examples include the use of energy saving devices (EnergyStar appliances, smart/programmable thermostats, LED lighting, smart power strips, high performance HVAC upgrades), home renovations (e.g., weatherization, energy efficient windows, insulation) to reduce heating demand, and the use of motion-sensor lighting. Energy efficiency is particularly important in northern regions when the RE resources are not in abundance, due to the annual long and dark winter period.
This analysis is considered a regional feasibility study for 100% RE supply; it is not an investment analysis and does not capture all the interests and motives of the diverse set of stakeholders required to construct the simulated systems. By providing a thorough sensitivity analysis, uncertainties surrounding unknown costs are captured, which can now be utilized for future stages of development in the region. To build on this work, more detailed stakeholder analysis should be done towards the realization of 100% RE supply. These studies can test specific market structures, regulations, and business models to perform relevant investment analyses for individual stakeholders.

5. Conclusions

In light of the societal goals of environmental conservation and the energy justice concern of high energy costs, this study assesses the technical and economic feasibility for 100% renewable and self-sufficient electricity supply in three municipalities representative of northern rural areas. The results show that 100% RE is technically feasible and economically competitive with prevailing residential rates under conservative assumptions. If the cost decline for wind, solar, and batteries continue as expected within the upcoming 5 to 7 years, 100% RE systems could have lower costs than the prevailing commercial rates. Utilities in these municipalities can, therefore, facilitate reduction of energy cost burdens on residents and businesses through the provision of low-cost energy services from RE resources. With that, the prohibitive principle of energy justice would be upheld.
The flexibility provided by existing hydropower is a crucial component for the reduction of battery storage capacity and cost; therefore, significant attention must be paid to the equitable distribution of existing hydro usage. Today, the majority of hydro capacity is owned by private energy utilities, leaving residents indirect access to these resources. If municipalities were able to self-organize and invest through community-based renewable energy, it could increase direct access for individual residential and commercial customers and lower costs. However, this scenario requires changes to Michigan’s utility regulations that currently prohibit defection from electric utility monopolies.
The 100% self-sufficiency model structure used here results in high levels of excess electricity, even with large battery storage capacity. The sales price applied is commensurate with current regulations; however, it is still lower than retail or wholesale market prices. If load curves could be flexibly adapted to electrify heating and transport to reduce excess sales, prices for that generation would likely increase, further improving economic conditions. Conversely, policies to encourage energy efficiency can also reduce LCOEs so long as excess generation is reduced.
The development of 100% RE can play a pivotal role in meeting the challenges of GHG emission reductions. This research has shown that such a transition is technically feasible and economically viable in rural northern regions, which can improve energy justice, but require a reexamination of current energy policies that favor monopoly utilities. Further, regarding energy justice consideration, there is need for policy design and regulatory framework that strengthens local energy resources usage by and for the utmost benefits of local communities as well as local energy ownership.
Transitioning the electricity outlook of the region to 100% RE also carries solutions to current energy crisis in the state and government’s focus to ensure that residents have clean, affordable and reliable energy. This research has shown that 100% renewable electricity can achieve such a goal for the electricity concerns in the region. Thus, the UP-Energy Task force should consider the results in this research as a matter of urgency that their work requires.
In general, scholarly misconceptions and ideologies about the unlikeliness of a rural region’s capability to transition to renewable energy requires substantial review. This is especially true when premised on constraints that include climatic situations, technical feasibility, and the economic viability of such. This research, alongside previous work, has established that rurality status is not tantamount to incapability in achieving an energy transition, such as 100% renewable electricity.
The results of this study can be leveraged for future planning by the municipalities in the region as well as by research institutions studying the RE transition in northern communities for further development of 100% RE scenarios in other contexts. The research results can also be relevant for governments, utilities, mayors, utilities, and policy and decision makers with interest in sustainable energy for solving local energy challenges. Other places across the globe with similar energy, climatic, and socioeconomic status, can also find this research useful. Further, community leadership and stakeholders will be able to use information from this research in making local decisions on feasibility of transition to renewable energy for electricity generation.

Funding

This research did not receive any specific grant from funding agencies in the public, commercial, or not-for-profit sectors.

Institutional Review Board Statement

Not applicable.

Informed Consent Statement

Not applicable.

Data Availability Statement

Not applicable.

Acknowledgments

The authors would like to appreciate the support of Brett Niemi and WPPI for providing annual load data of some of the municipalities and support from the Thompson Endowment.

Conflicts of Interest

The authors declared that there is no conflict of interest.

Appendix A

To maintain a concise and readable main paper, detailed documentation of all relevant boundary conditions as they are applied in HOMER are given here. The structure follows the tab format in HOMER for convenient repeatability. Citations are given on most inputs and all critical inputs, which are also given in the main text. Inputs without citation are required for simulation but either not relevant, insignificant, and assumed, or a function of the modeling assumptions. Full context on the modeling approach is given in the main text and specific tables/chapters are referred to in this list.

Appendix A.1. Components

Appendix A.1.1. Photovoltaics

  • SunPower E20-327 [60]
    Nominal Efficiency: 20.4%
    Nominal Operating Cell Temperature: 45 °C
    Temperature Coefficient: −0.35%/°C
  • Electrical Bus
    AC
  • Site Specific Input
    Derating Factor: 85% [68,69]
  • Cost
    Capacity: 1 kWp
    Capital: 1200–2000 $/kWp [71,72,73,74] (See Table 5)
    Replacement: N/A
    O&M: 13 $/kWp/year [80,81]
    Lifetime: 30 years [74,75]
  • Sizing
    HOMER Optimizer
  • Advanced Settings
    Inverter not explicitly modeled
    Orientation
    Ground Reflectance: 20%
    No Tracking
    Panel Slope: 30°, 45° and 60°
    Panel Azimuth: 0°
    Temperature effects are considered, parameters given with module specifications

Appendix A.1.2. Wind Turbines

  • Enercon E-82 E2 [82]
    Rated Capacity: 2 MW
  • Site Specific Input
    Lifetime: 30 years [84,85,86]
    Hub Height: 85 m
    Ambient temperature effects are considered
  • Electrical Bus
    AC
  • Costs
    Quantity: 1 turbine
    Capital: $1.8 M–$3 M per turbine [83] (See Table 5)
    Replacement: N/A
    O&M: $72 k per turbine/year [71]
  • Sizing
    HOMER Optimizer
  • Advanced Properties
    Power Curve [82]
Table A1. Wind speed and corresponding power output.
Wind Speed (m/s)Power Output (kW)
10
23
325
482
5174
6321
7532
8815
91180
101580
111810
122080
132050
142050
152050
162050
172050
182050
192050
202050
212050
222050
232050
242050
252050
Turbine Losses
Availability Losses: 0%
Wake Effect Losses: 0%
Turbine Performance Losses: 2%
Electrical Losses. 2%
Environmental Losses: 0%
Curtailment Losses. 0%
Other Losses. 0%
Maintenance Table
No maintenance schedule considered

Appendix A.1.3. Battery

  • Idealized battery model w/Tesla Powerpack [87]
    Nominal Voltage: 380 V
    Nominal Capacity: 232 kWh
    Nominal Capacity: 611 Ah
    Roundtrip Efficiency: 89.5%
    Maximum Charge Current: 152 A
    Maximum Discharge Current: 152 A
  • Cost
    Quantity: 1
    Capital: $297–$359 [92] (See Table 3)
    Replacement: $112–$291 [92] (See Table 3)
    O&M: $500/unit/yr [92]
  • Lifetime
    Years: 15 [88]
    Throughput: 232,000 kWh [88]
  • Site Specific Input
    String Size: 1
    Initial State of Charge: 100%
    Minimum State of Charge: 0%
    No minimum storage life
    No maintenance schedule considered
  • Sizing
    HOMER Optimizer

Appendix A.1.4. Converter

The converter is an integral part of the battery and drive the input parameters, see Section 2.10.
  • Generic large, free converter (from HOMER catalog)
  • Costs
    Capacity: 1 kW
    Capital: $0
    Replacement: $0
    O&M: 0 $/kW/year
  • Inverter Input
    Lifetime: 15 years
    Efficiency: 100%
  • Rectifier Input
    Relative Capacity: 100%
    Efficiency: 100%
  • Capacity Optimization
    Search Space
    0 kW
    9,999,999 kW

Appendix A.1.5. Grid Connection

The grid connection in HOMER is used to represent both hydropower and the grid, see Section 2.7 and Section 2.8
  • Modeled using Scheduled Rates
  • Parameters
    Sale Capacity: 0 kW
    Annual Purchase Capacity: 590, 1432, 3150 kW (See Table 4)
    No net metering considered
    No maximum net grid purchases considered
    Grid Extension Charges
    Grid Capital Cost: 0 $/km
    Distance: 0 km
    Distributed Generation Costs
    Interconnection Charge: $0
    Standby Charge: 3900 $/year (represents fixed annual fees) [95]
  • Rate Definition
    Buy Price: $0.0245/kWh [93] (represents existing hydropower)
    Sell Price: N/A (added post-process with prices from [94])
    Prohibit grid from charging battery
    Prohibit grid sales from battery
  • Demand Rates [95]
    On Peak
    7:00–23:00 on weekdays
    Price: 6.30 $/kW/mo
    Off Peak
    All other times of day/week
    Price: 3.07 $/kW/mo
    For both rate periods
    No system dispatch override considered
  • Reliability
    No outages considered (100% grid reliability)
  • Emissions
    Ignored for this study

Appendix A.2. Resources

All solar, wind, and air temperatures are generated using Meteonorm 7.3.1 [55] and imported into HOMER as hourly time series profiles. To compliment the column charts shown in Section 3, the figures below show the distribution of values for each location by month using standard box plots (min, 25%, median, 75%, max). Solar also includes total irradiation per month, shown with a line curve, and for brevity is limited to only the 30° tilt with snow losses. Other tilt angles have similar patterns, but with slightly higher quartiles in the winter season.

Appendix A.2.1. Solar GHI

Figure A1. Monthly GHI distributions and totals with snow losses at a 30 tilt.
Electricity 03 00016 g0a1

Appendix A.2.2. Wind Speed

Figure A2. Monthly wind speed distributions for each case study.
Electricity 03 00016 g0a2
  • Parameters [55]
    Altitude above sea level: 175–444 m
    Anemometer height: 10 m
  • Variation with Height
    Wind speed profile: Logarithmic
    Surface roughness length: 0.010 m
  • Advanced Parameters not applicable due to imported time series

Appendix A.2.3. Air Temperature

Figure A3. Monthly air temperature distributions for each case study.
Electricity 03 00016 g0a3

Appendix A.2.4. Project

Economics

  • Nominal Discount Rate: 2–8% [97] (See Table 5)
  • Expected Inflation Rate: 0% (Discount rates and prices are real)
  • Project Lifetime: 30 years
  • System fixed capital cost: $0
  • System fixed O&M cost: $0/year
  • Capacity shortage penalty: $0/kWh

Constraints

  • Maximum annual capacity shortage: 0%
  • Minimum renewable fraction: 75.6%, 82.1%, 85.4% (See Table 4)
  • Operating Reserve
    As a percentage of load
    Load in current time step: 0%
    Annual peak load: 0%
    As a percentage of renewable output
    Solar power output: 0%
    Wind power output: 0%

Emissions

  • No penalties or limits considered

Optimization

  • Minutes per time step: 60
  • Maximum simulations per optimization: 10,000
  • System design precision: 0.0100
  • NPC precision: 0.0100
  • Focus factor: 50.00
  • Category winners are optimized

Multi-Year

  • No multi-year settings are enabled

References

  1. Rehfeldt, M.; Worrell, E.; Eichhammer, W.; Fleiter, T. A review of the emission reduction potential of fuel switch towards biomass and electricity in European basic materials industry until 2030. Renew. Sustain. Energy Rev. 2020, 120, 109672. [Google Scholar] [CrossRef]
  2. Masson-Delmotte, V.; Zhai, P.; Pörtner, H.-O.; Roberts, D.; Skea, J.; Shukla, P.R.; Pirani, A.; Moufouma-Okia, W.; Péan, C.; Pidcock, R.; et al. Global Warming of 1.5 °C. An IPCC Special Report on the Impacts of Global Warming of 1.5 °C Above Pre-Industrial Levels and Related Global Greenhouse Gas Emission Pathways, in the Context of Strengthening the Global Response to the Threat of Climate Change, Sustainable Development, and Efforts to Eradicate Poverty; IPCC: Geneva, Switzerland, 2019. [Google Scholar]
  3. Allen, M.; Antwi-Agyei, P.; Aragon-Durand, F.; Babiker, M.; Bertoldi, P.; Bind, M.; Brown, S.; Buckeridge, M.; Camilloni, I.; Cartwright, A.; et al. Technical Summary: Global Warming of 1.5 °C. An IPCC Special Report on the Impacts of Global Warming of 1.5 °C above Pre-Industrial Levels and Related Global Greenhouse Gas Emission Pathways, in the Context of Strengthening the Global Response to the Threat of Climate Change, Sustainable Development, and Efforts to Eradicate Poverty; IPCC: Geneva, Switzerland, 2018; pp. 31–94. Available online: https://www.ipcc.ch/site/assets/uploads/sites/2/2019/06/SR15_Full_Report_Low_Res.pdf (accessed on 2 February 2020).
  4. Le Quéré, C.; Jackson, R.B.; Jones, M.W.; Smith, A.; Abernethy, S.; Andrew, R.M.; De-Gol, A.J.; Willis, D.R.; Shan, Y.; Canadell, J.G.; et al. Temporary reduction in daily global CO2 emissions during the COVID-19 forced confinement. Nat. Clim. Chang. 2020, 10, 647–653. [Google Scholar] [CrossRef]
  5. EPA. Global Greenhouse Gas Emissions Data. 2019. Available online: https://www.epa.gov/ghgemissions/global-greenhouse-gas-emissions-data (accessed on 2 February 2020).
  6. EIA. Power Sector Carbon Dioxide Emissions Fall below Transportation Sector Emissions. 2017. Available online: https://www.eia.gov/todayinenergy/detail.php?id=34192 (accessed on 12 February 2020).
  7. Adesanya, A.A.; Sidortsov, R.V.; Schelly, C. Act locally, transition globally: Grassroots resilience, local politics, and five municipalities in the United States with 100% renewable electricity. Energy Res. Soc. Sci. 2020, 67, 101579. [Google Scholar] [CrossRef]
  8. Sierra-Club. 100 Percent Clean Energy: The New Normal. Available online: https://www.sierraclub.org/articles/2019/05/100-percent-clean-energy-new-normal (accessed on 15 August 2019).
  9. MPSC. Comparison of Monthly Residential Bills * for Mpsc-Regulated Michigan Electric Utilities; State of Michigan: Lansing, MI, USA, 2008. [Google Scholar]
  10. Kantamneni, A.; Winkler, R.; Gauchia, L.; Pearce, J.M. Emerging economic viability of grid defection in a northern climate using solar hybrid systems. Energy Policy 2016, 95, 378–389. [Google Scholar] [CrossRef] [Green Version]
  11. MPSC. UPPCO IRP; Case No: U-20350; Upper Peninsula Power Company: Marquette, MI, USA, 2019. [Google Scholar]
  12. Prehoda, E.; Pearce, J.; Schelly, C. Policies to Overcome Barriers for Renewable Energy Distributed Generation: A Case Study of Utility Structure and Regulatory Regimes in Michigan. Energies 2019, 12, 674. [Google Scholar] [CrossRef] [Green Version]
  13. Prehoda, E.; Winkler, R.; Schelly, C. Putting Research to Action: Integrating Collaborative Governance and Community-Engaged Research for Community Solar. Soc. Sci. 2019, 8, 11. [Google Scholar] [CrossRef] [Green Version]
  14. Barnett, B.; Prehoda, E.W.; Kantamneni, A.; Winkler, R.L.; Schelly, C. Applying transdisciplinary research to enhance low-to-moderate income households’ access to community solar. In A Research Agenda for Environmental Management; Halvorsen, K.E., Schelly, C., Handler, R.M., Pischke, E.C., Knowlton, J.L., Eds.; Edward Elgar: Cheltenham, UK, 2019. [Google Scholar]
  15. Dunn, K.; Jhaveri, K.; Lin, K.; Michalski, J.; Rego, B. Sun Power Examining the Costs and Benefits of Community Solar in the Keweenaw Bay Region of Michigan’s Upper Peninsula; University of Michigan: Ann Arbor, MI, USA, 2018. [Google Scholar] [CrossRef]
  16. Pettersen, C.; Kulie, M.S.; Bliven, L.F.; Merrelli, A.J.; Petersen, W.A.; Wagner, T.J.; Wolff, D.B.; Wood, N. A Composite Analysis of Snowfall Modes from Four Winter Seasons in Marquette, Michigan. J. Appl. Meteorol. Clim. 2020, 59, 103–124. [Google Scholar] [CrossRef]
  17. Winkler, R. Living on Lakes: Segregated Communities and Inequality in a Natural Amenity Destination. Sociol. Q. 2013, 54, 105–129. [Google Scholar] [CrossRef]
  18. Homsy, G.C. Unlikely pioneers: Creative climate change policymaking in smaller US cities. J. Environ. Stud. Sci. 2018, 8, 121–131. [Google Scholar] [CrossRef]
  19. McDonald, N.C.; Pearce, J. Community Voices: Perspectives on Renewable Energy in Nunavut. Arctic 2013, 66, 94–104. [Google Scholar] [CrossRef]
  20. Obydenkova, S.V.; Pearce, J.M. Technical viability of mobile solar photovoltaic systems for indigenous nomadic communities in northern latitudes. Renew. Energy 2015, 89, 253–267. [Google Scholar] [CrossRef] [Green Version]
  21. Talberg, S.A.; Saari, N.J.; Scripps, D.C. Michigan Statewide Energy Assessment; Michigan Public Service Commission: Lansing, MI, USA, 2019; p. 247. [Google Scholar]
  22. Winkler, R.; Oikarinen, L.; Simpson, H.; Michaelson, M.; Gonzalez, M.S. Boom, Bust and Beyond: Arts and Sustainability in Calumet, Michigan. Sustainability 2016, 8, 284. [Google Scholar] [CrossRef] [Green Version]
  23. Bagher, A.M.; Vahid, M.; Mohsen, M.; Parvin, D. Hydroelectric Energy Advantages and Disadvantages. Am. J. Energy Sci. 2015, 2, 17–20. [Google Scholar]
  24. Frey, G.W.; Linke, D.M. Hydropower as a renewable and sustainable energy resource meeting global energy challenges in a reasonable way. Energy Policy 2002, 30, 1261–1265. [Google Scholar] [CrossRef]
  25. Beer, M.; Rybár, R.; Kaľavský, M. Renewable energy sources as an attractive element of industrial tourism. Curr. Issues Tour. 2017, 21, 2139–2151. [Google Scholar] [CrossRef]
  26. Michalena, E.; Tripanagnostopoulos, Y. Contribution of the solar energy in the sustainable tourism development of the Mediterranean islands. Renew. Energy 2010, 35, 667–673. [Google Scholar] [CrossRef]
  27. Irie, N.; Kawahara, N.; Esteves, A.M. Sector-wide social impact scoping of agrivoltaic systems: A case study in Japan. Renew. Energy 2019, 139, 1463–1476. [Google Scholar] [CrossRef]
  28. Dinesh, H.; Pearce, J.M. The potential of agrivoltaic systems. Renew. Sustain. Energy Rev. 2016, 54, 299–308. [Google Scholar] [CrossRef] [Green Version]
  29. Tosun, J. Addressing climate change through climate action. Clim. Action 2022, 1, 1. [Google Scholar] [CrossRef]
  30. Pearce, J.M. Strategic Investment in Open Hardware for National Security. Technologies 2022, 10, 53. [Google Scholar] [CrossRef]
  31. Xu, J.; Akhtar, M.; Haris, M.; Muhammad, S.; Abban, O.J.; Taghizadeh-Hesary, F. Energy crisis, firm profitability, and productivity: An emerging economy perspective. Energy Strategy Rev. 2022, 41, 100849. [Google Scholar] [CrossRef]
  32. Dawood, F.; Shafiullah, G.; Anda, M. Stand-Alone Microgrid with 100% Renewable Energy: A Case Study with Hybrid Solar PV-Battery-Hydrogen. Sustainability 2020, 12, 2047. [Google Scholar] [CrossRef] [Green Version]
  33. Zahboune, H.; Zouggar, S.; Krajacic, G.; Varbanov, P.S.; Elhafyani, M.; Ziani, E. Optimal hybrid renewable energy design in autonomous system using Modified Electric System Cascade Analysis and Homer software. Energy Convers. Manag. 2016, 126, 909–922. [Google Scholar] [CrossRef]
  34. Pascasio, J.D.; Esparcia, E.A., Jr.; Castro, M.T.; Ocon, J.D. Comparative assessment of solar photovoltaic-wind hybrid energy systems: A case for Philippine off-grid islands. Renew. Energy 2021, 179, 1589–1607. [Google Scholar] [CrossRef]
  35. Kalinci, Y. Alternative energy scenarios for Bozcaada island, Turkey. Renew. Sustain. Energy Rev. 2015, 45, 468–480. [Google Scholar] [CrossRef]
  36. Abdin, Z.; Mérida, W. Hybrid energy systems for off-grid power supply and hydrogen production based on renewable energy: A techno-economic analysis. Energy Convers. Manag. 2019, 196, 1068–1079. [Google Scholar] [CrossRef]
  37. Baseer, M.; Alqahtani, A.; Rehman, S. Techno-economic design and evaluation of hybrid energy systems for residential communities: Case study of Jubail industrial city. J. Clean. Prod. 2019, 237, 117806. [Google Scholar] [CrossRef]
  38. Akter, H.; Howlader, H.O.R.; Nakadomari, A.; Islam, R.; Saber, A.Y.; Senjyu, T. A Short Assessment of Renewable Energy for Optimal Sizing of 100% Renewable Energy Based Microgrids in Remote Islands of Developing Countries: A Case Study in Bangladesh. Energies 2022, 15, 1084. [Google Scholar] [CrossRef]
  39. Sovacool, B.K.; Heffron, R.J.; McCauley, D.; Goldthau, A. Energy decisions reframed as justice and ethical concerns. Nat. Energy 2016, 1, 16024. [Google Scholar] [CrossRef] [Green Version]
  40. Heffron, R.J.; McCauley, D.; Sovacool, B.K. Resolving society’s energy trilemma through the Energy Justice Metric. Energy Policy 2015, 87, 168–176. [Google Scholar] [CrossRef]
  41. Sidortsov, R.; Heffron, R.J.; Mose, T.M.; Schelly, C.; Tarekegne, B. In search of common ground: Energy justice perspectives in global fossil fuel extraction. Res. Agenda Environ. Manag. 2019, 12, 134–144. [Google Scholar]
  42. Brosemer, K.; Schelly, C.; Gagnon, V.; Arola, K.L.; Pearce, J.M.; Bessette, D.; Olabisi, L.S. The energy crises revealed by COVID: Intersections of Indigeneity, inequity, and health. Energy Res. Soc. Sci. 2020, 68, 101661. [Google Scholar] [CrossRef]
  43. Brown, M.A.; Soni, A.; Lapsa, M.V.; Southworth, K.; Cox, M. High energy burden and low-income energy affordability: Conclusions from a literature review. Prog. Energy 2020, 2, 042003. [Google Scholar] [CrossRef]
  44. Voogt, M.H.; Uyterlinde, M.A.; de Noord, M.; Skytte, K.; Nielsen, L.H.; Leonardi, M.; Whiteley, M.; Chapman, M. Renewable Energy Burden Sharing REBUS. Effects of Burden Sharing and Certificate Trade on the Renewable Electricity Market in Europe; ECN: Schagen, The Netherlands, 2001. [Google Scholar]
  45. Homer Energy. Available online: https://www.homerenergy.com/ (accessed on 20 December 2019).
  46. Peffley, T.B.; Pearce, J.M. The potential for grid defection of small and medium sized enterprises using solar photovoltaic, battery and generator hybrid systems. Renew. Energy 2020, 148, 193–204. [Google Scholar] [CrossRef]
  47. Adesanya, A.A.; Pearce, J.M. Economic viability of captive off-grid solar photovoltaic and diesel hybrid energy systems for the Nigerian private sector. Renew. Sustain. Energy Rev. 2019, 114, 109348. [Google Scholar] [CrossRef]
  48. Adesanya, A.A.; Schelly, C. Solar PV-diesel hybrid systems for the Nigerian private sector: An impact assessment. Energy Policy 2019, 132, 196–207. [Google Scholar] [CrossRef]
  49. Weber, J.A.; Gao, D.W.; Gao, T. Affordable mobile hybrid integrated renewable energy system power plant optimized using HOMER Pro. In Proceedings of the 2016 North American Power Symposium (NAPS), Denver, CO, USA, 18–20 September 2016; IEEE: Piscataway, NJ, USA, 2016; pp. 1–6. [Google Scholar]
  50. Banerjee, A.; Prehoda, E.; Sidortsov, R.; Schelly, C. Renewable, ethical? Assessing the energy justice potential of renewable electricity. AIMS Energy 2017, 5, 768–797. [Google Scholar] [CrossRef]
  51. Shaner, M.R.; Davis, S.J.; Lewis, N.S.; Caldeira, K. Geophysical constraints on the reliability of solar and wind power in the United States. Energy Environ. Sci. 2018, 11, 914–925. [Google Scholar] [CrossRef] [Green Version]
  52. Kroposki, B.; Johnson, B.; Zhang, Y.; Gevorgian, V.; Denholm, P.; Hodge, B.-M.; Hannegan, B. Achieving a 100% Renewable Grid: Operating Electric Power Systems with Extremely High Levels of Variable Renewable Energy. IEEE Power Energy Mag. 2017, 15, 61–73. [Google Scholar] [CrossRef]
  53. Stan, A.-I.; Swierczynski, M.; Stroe, D.-I.; Teodorescu, R.; Andreasen, S.J. Lithium ion battery chemistries from renewable energy storage to automotive and back-up power applications—An overview. In Proceedings of the 2014 International Conference on Optimization of Electrical and Electronic Equipment (OPTIM), Bran, Romania, 22–24 May 2014; IEEE: Piscataway, NJ, USA, 2014; pp. 713–720. [Google Scholar] [CrossRef]
  54. Diouf, B.; Pode, R. Potential of lithium-ion batteries in renewable energy. Renew. Energy 2015, 76, 375–380. [Google Scholar] [CrossRef]
  55. Remund, J.K.S. Meteonorm 7.3.1. 2018. Available online: https://meteonorm.com/en/ (accessed on 20 December 2018).
  56. Townsend, T.; Power, L. Photovoltaics and snow: An update from two winters of measurements in the SIERRA. In Proceedings of the 2011 37th IEEE Photovoltaic Specialists Conference, Seattle, WA, USA, 10–24 June 2011; pp. 003231–003236. [Google Scholar] [CrossRef]
  57. Heidari, N.; Gwamuri, J.; Townsend, T.; Pearce, J.M. Impact of Snow and Ground Interference on Photovoltaic Electric System Performance. IEEE J. Photovolta. 2015, 5, 1680–1685. [Google Scholar] [CrossRef] [Green Version]
  58. Andrews, R.W.; Pollard, A.; Pearce, J.M. The effects of snowfall on solar photovoltaic performance. Sol. Energy 2013, 92, 84–97. [Google Scholar] [CrossRef] [Green Version]
  59. Khare, V.; Nema, S.; Baredar, P. Solar–wind hybrid renewable energy system: A review. Renew. Sustain. Energy Rev. 2016, 58, 23–33. [Google Scholar] [CrossRef]
  60. Firtina-Ertis, I.; Acar, C.; Erturk, E. Optimal sizing design of an isolated stand-alone hybrid wind-hydrogen system for a zero-energy house. Appl. Energy 2020, 274, 115244. [Google Scholar] [CrossRef]
  61. Sarkar, T.; Bhattacharjee, A.; Samanta, H.; Bhattacharya, K.; Saha, H. Optimal design and implementation of solar PV-wind-biogas-VRFB storage integrated smart hybrid microgrid for ensuring zero loss of power supply probability. Energy Convers. Manag. 2019, 191, 102–118. [Google Scholar] [CrossRef]
  62. Soman, S.S.; Zareipour, H.; Malik, O.; Mandal, P. A review of wind power and wind speed forecasting methods with different time horizons. In Proceedings of the North American Power Symposium 2010, Arlington, TX, USA, 26–28 September 2010; pp. 1–8. [Google Scholar]
  63. Qolipour, M.; Mostafaeipour, A.; Tousi, O.M. Techno-economic feasibility of a photovoltaic-wind power plant construction for electric and hydrogen production: A case study. Renew. Sustain. Energy Rev. 2017, 78, 113–123. [Google Scholar] [CrossRef]
  64. Carapellucci, R.; Giordano, L. A methodology for the synthetic generation of hourly wind speed time series based on some known aggregate input data. Appl. Energy 2013, 101, 541–550. [Google Scholar] [CrossRef]
  65. Chen, J.; Rabiti, C. Synthetic wind speed scenarios generation for probabilistic analysis of hybrid energy systems. Energy 2017, 120, 507–517. [Google Scholar] [CrossRef] [Green Version]
  66. EIA. U.S. States Michigan State Profile and Energy Estimates. 2020. Available online: https://www.eia.gov/state/?sid=MI (accessed on 23 November 2020).
  67. SUNPOWER. SunPower® E-Series: E20-327|E19-320 Datasheet. Available online: https://us.sunpower.com/sites/default/files/media-library/data-sheets/ds-e20-series-327-residential-solar-panels.pdf (accessed on 10 August 2020).
  68. Van Sark, W.G.J.H.M.; Reich, N.H.; Müller, B.; Armbruster, A.; Kiefer, K.; Reise, C. Review of PV performance ratio development. World Renew. Energy Congr. 2012, 6, 4795–4800. [Google Scholar]
  69. Green, M.A.; Emery, K.; Hishikawa, Y.; Warta, W.; Dunlop, E.D.; Barkhouse, D. Solar cell efficiency tables (version 40). IEEE Trans. Fuzzy Syst. 2012, 20, 1114–1129. [Google Scholar] [CrossRef]
  70. Reil, F.; Baumann, I.; Althaus, J.; Gebhard, S. Evaluation of current standards and practices for the simulation of wind-blown sands and their applicability as accelerated ageing tests for PV modules. In Proceedings of the 2013 IEEE 39th Photovoltaic Specialists Conference (PVSC), Tampa, FL, USA, 10 June 2013; IEEE: Piscataway, NJ, USA, 2013; pp. 1537–1541. [Google Scholar] [CrossRef]
  71. Lazard. Lazard’s Levelized Cost of Storage Analysis—Version 5.0. Available online: https://www.lazard.com/media/451087/lazards-levelized-cost-of-storage-version-50-vf.pdf (accessed on 21 May 2020).
  72. Masson, G.; Kaizuka, I. Trends in Photovoltaic Applications 2019 24th; Report IEA PVPS T1-36:2019; International Energy Agency: Paris, France, 2019. [Google Scholar]
  73. Fu, R.; Feldman, D.; Margolis, R.U.S. Solar Photovoltaic System Cost Benchmark: Q1 2018; NREL/TP-6A20-72399. Tech Rep NREL/TP-6A20-72399 2018; National Renewable Energy Laboratory: Gloden, CO, USA, 2018. [Google Scholar]
  74. Barbose, G.; Naïm, D. Primary Authors Tracking the Sun; Lawrence Berkeley National Laboratory: Berkeley, CA, USA, 2019; pp. 3–52. [Google Scholar]
  75. Lopez-Garcia, J.; Sample, T. Evolution of measured module characteristics versus labelled module characteristics of crystalline silicon based PV modules. Sol. Energy 2018, 160, 252–259. [Google Scholar] [CrossRef]
  76. Annigoni, E.; Virtuani, A.; Caccivio, M.; Friesen, G.; Chianese, D.; Ballif, C. 35 years of photovoltaics: Analysis of the TISO-10-kW solar plant, lessons learnt in safety and performance—Part 2. Prog. Photovolta. Res. Appl. 2019, 27, 760–778. [Google Scholar] [CrossRef]
  77. Brown, P.R.; O’Sullivan, F.M. Spatial and temporal variation in the value of solar power across United States electricity markets. Renew. Sustain. Energy Rev. 2019, 121, 109594. [Google Scholar] [CrossRef]
  78. Sommerfeldt, N.; Madani, H. Revisiting the techno-economic analysis process for building-mounted, grid-connected solar photovoltaic systems: Part two—Application. Renew. Sustain. Energy Rev. 2017, 74, 1394–1404. [Google Scholar] [CrossRef]
  79. Litjens, G.; Worrell, E.; van Sark, W. Lowering greenhouse gas emissions in the built environment by combining ground source heat pumps, photovoltaics and battery storage. Energy Build. 2018, 180, 51–71. [Google Scholar] [CrossRef]
  80. Wiser, R.; Bolinger, M. Benchmarking Anticipated Wind Project Lifetimes: Results from a Survey of U. S. Wind Industry Professionals; Electricity Markets and Policy: Berkeley, CA, USA, 2019; pp. 1–8. [Google Scholar]
  81. Walker, A. PV O & M Cost Model and Cost; NREL: Gloden, CO, USA, 2017; pp. 1–27. [Google Scholar]
  82. Enercon. Enercon Wind Turbine—Product Overview; Enercon: Aurich, Germany, 2015; pp. 1–19. [Google Scholar]
  83. Stehly, T.J.; Beiter, P.C. 2018 Cost of Wind Energy Review; NREL: Gloden, CO, USA, 2020; pp. 1–71. [Google Scholar] [CrossRef]
  84. Ziegler, L.; Gonzalez, E.; Rubert, T.; Smolka, U.; Melero, J.J. Lifetime extension of onshore wind turbines: A review covering Germany, Spain, Denmark, and the UK. Renew. Sustain. Energy Rev. 2018, 82, 1261–1271. [Google Scholar] [CrossRef] [Green Version]
  85. DNV GL AS. DNVGL-ST-0437: Loads and Site Conditions for Wind Turbines; DNV GL—Stand: Greater Oslo, Norway, 2016; p. 108. [Google Scholar]
  86. Rubert, T.; Zorzi, G.; Fusiek, G.; Niewczas, P.; McMillan, D.; McAlorum, J.; Perry, M. Wind turbine lifetime extension decision-making based on structural health monitoring. Renew. Energy 2019, 143, 611–621. [Google Scholar] [CrossRef]
  87. PowerPack, T. Utility and Business Energy Storage Inside the Powerpack. Available online: https://www.tesla.com/es_ES/powerpack (accessed on 21 May 2020).
  88. Hu, X.; Xu, L.; Lin, X.; Pecht, M. Battery Lifetime Prognostics. Joule 2020, 4, 310–346. [Google Scholar] [CrossRef]
  89. Zubi, G.; Dufo-López, R.; Carvalho, M.; Pasaoglu, G. The lithium-ion battery: State of the art and future perspectives. Renew. Sustain. Energy Rev. 2018, 89, 292–308. [Google Scholar] [CrossRef]
  90. Nykvist, B.; Nilsson, M. Rapidly falling costs of battery packs for electric vehicles. Nat. Clim. Chang. 2015, 5, 329–332. [Google Scholar] [CrossRef]
  91. Fu, R.; Remo, T.; Margolis, R. 2018 US.Utility-Scale Photovoltaics—Plus-Energy Storage System Costs Benchmark; NREL: Gloden, CO, USA, 2018; p. 32. [Google Scholar]
  92. Cole, W.; Frazier, A.W. Cost Projections for Utility—Scale Battery Storage Cost Projections for Utility—Scale Battery Storage; NREL/TP-6A20-73222; NREL: Gloden, CO, USA, 2019. [Google Scholar]
  93. MPSC. Notice of Proposal for Decision; Case No. U-18094; State of Michigan: Lansing, MI, USA, 2017. [Google Scholar]
  94. UPPCO. D2. Parallel Generation—Purchase by UPPCO (Price Schedule). MPSC Vol No 8-Electric, 8th Rev Sheet No D-7220. 2020. Available online: https://www.uppco.com/wp-content/uploads/2020/05/UD2-D72.70-Parallel-Generation-Purchase-by-UPPCO-PG-4.pdf (accessed on 7 July 2020).
  95. UPPCO. D2. Large Commercial & Industrial Service (Price Schedule); MPSC Vol No 8-Electric, 6th Rev Sheet No D-2520 2020. 2020. Available online: https://www.uppco.com/wp-content/uploads/2019/07/UD2-D25.10-Large-C-I-Cp-U.pdf (accessed on 7 July 2020).
  96. Liu, L.; Walchale, A. 100 percent Renewable Electricity Plan for Leelanau County, Michigan. Master’s Thesis, University of Michigan, Ann Arbor, MI, USA, 2019. [Google Scholar]
  97. Trading Economics. United States Fed Funds Rate. Available online: https://tradingeconomics.com/united-states/interest-rate (accessed on 12 May 2020).
  98. Calabrò, E. Determining optimum tilt angles of photovoltaic panels at typical north-tropical latitudes. J. Renew. Sustain. Energy 2009, 1, 033104. [Google Scholar] [CrossRef]
  99. Schmidt, T.S.; Steffen, B.; Egli, F.; Pahle, M.; Tietjen, O.; Edenhofer, O. Adverse effects of rising interest rates on sustainable energy transitions. Nat. Sustain. 2019, 2, 879–885. [Google Scholar] [CrossRef]
  100. MPSC. Order Opening Docket; State of Michigan: Lansing, MI, USA, 2020. [Google Scholar]
  101. Liu, Z.; Wen, F.; Ledwich, G. Optimal Planning of Electric-Vehicle Charging Stations in Distribution Systems. IEEE Trans. Power Deliv. 2013, 28, 102–110. [Google Scholar] [CrossRef]
  102. State of Michigan. Integrating Energy Storage into the Michigan Electric Market. Available online: http://legislature.mi.gov/doc.aspx?2018-SR-0170 (accessed on 3 July 2020).
  103. City of Negaunee. Press Release—Michigan Tech and City of Negaunee Explore Using Abandoned Mines for Electrical Energy Storage. Available online: https://cityofnegaunee.com/2019/01/24/press-release-michigan-tech-and-city-of-negaunee-explore-using-abandoned-mines-for-electrical-energy-storage/ (accessed on 12 December 2019).
  104. IEA. Global EV Outlook 2020, IEA, Paris. 2020. Available online: https://www.iea.org/reports/global-ev-outlook-2020 (accessed on 15 August 2020).
  105. Waite, M.; Modi, V. Potential for increased wind-generated electricity utilization using heat pumps in urban areas. Appl. Energy 2014, 135, 634–642. [Google Scholar] [CrossRef]
  106. Fischer, D.; Surmann, A.; Lindberg, K.B. Impact of emerging technologies on the electricity load profile of residential areas. Energy Build. 2019, 208, 109614. [Google Scholar] [CrossRef]
  107. Fischer, D.; Madani, H. On heat pumps in smart grids: A review. Renew. Sustain. Energy Rev. 2017, 70, 342–357. [Google Scholar] [CrossRef] [Green Version]
  108. Vanhoudt, D.; Geysen, D.; Claessens, B.; Leemans, F.; Jespers, L.; Van Bael, J. An actively controlled residential heat pump: Potential on peak shaving and maximization of self-consumption of renewable energy. Renew. Energy 2014, 63, 531–543. [Google Scholar] [CrossRef]
  109. Dar, U.I.; Sartori, I.; Georges, L.; Novakovic, V. Advanced control of heat pumps for improved flexibility of Net-ZEB towards the grid. Energy Build. 2014, 69, 74–84. [Google Scholar] [CrossRef]
  110. Psimopoulos, E.; Bee, E.; Widén, J.; Bales, C. Techno-economic analysis of control algorithms for an exhaust air heat pump system for detached houses coupled to a photovoltaic system. Appl. Energy 2019, 249, 355–367. [Google Scholar] [CrossRef]
  111. MISO. Futures. Strawman Proposal MISO Futures; Midcontinent Independent System Operator: Carmel, IN, USA, 2020; pp. 1–34. [Google Scholar]
  112. Steinberg, D.; Bielen, D.; Eichman, J.; Eurek, K.; Logan, J.; Mai, T.; McMillan, C.; Parker, A.; Vimmerstedt, L.; Wilson, E. Electrification and Decarbonization: Exploring U.S. Energy Use and Greenhouse Gas Emissions in Scenarios with Widespread Electrification and Power Sector Decarbonization; NREL/TP-6A20-68214; U.S. Department of Energy: Oak Ridge, TN, USA, 2017. [Google Scholar] [CrossRef] [Green Version]
  113. MPSC. MPSC Approves Part of DTE Electric Co.’s Renewable Energy Plan, Delays Decision on Future Wind Projects to Company IRP. 2019. Available online: https://www.michigan.gov/mpsc/0,9535,7-395-93307_93313_17280-502194--,00.html (accessed on 17 July 2020).
  114. Copena, D.; Simón, X. Wind farms and payments to landowners: Opportunities for rural development for the case of Galicia. Renew. Sustain. Energy Rev. 2018, 95, 38–47. [Google Scholar] [CrossRef]
  115. Saglie, I.-L.; Inderberg, T.H.J.; Rognstad, H. What shapes municipalities’ perceptions of fairness in windpower developments? Local Environ. 2020, 25, 147–161. [Google Scholar] [CrossRef] [Green Version]
  116. Macdonald, C.; Glass, J.; Creamer, E. What Is the Benefit of Community Benefits? Exploring Local Perceptions of the Provision of Community Benefits from a Commercial Wind Energy Project. Scott. Geogr. J. 2017, 133, 172–191. [Google Scholar] [CrossRef] [Green Version]
  117. Munday, M.; Bristow, G.; Cowell, R. Wind farms in rural areas: How far do community benefits from wind farms represent a local economic development opportunity? J. Rural Stud. 2011, 27, 1–12. [Google Scholar] [CrossRef]
  118. Michigan Government. MPSC Approves UPPCO Rate Increase; Most Residential Bills Will Drop. 2019. Available online: https://www.michigan.gov/lara/0,4601,7-154-11472-499306--,00.html (accessed on 27 August 2020).
  119. Hess, D.J. Coalitions, framing, and the politics of energy transitions: Local democracy and community choice in California. Energy Res. Soc. Sci. 2018, 50, 38–50. [Google Scholar] [CrossRef]
  120. Adesanya, A.A.; Schelly, C. Promoting Policies for Renewable Electrification. Afford. Clean Energy 2020, 1–10. [Google Scholar] [CrossRef]
  121. National Coference of State Legislatures. State Renewable Portfolio Standards and Goals; National Coference of State Legislatures: Denver, CO, USA, 2020; pp. 1–19. [Google Scholar]
  122. Jacobsen, G.D. An Examination of How Energy Efficiency Incentives Are Distributed Across Income Groups. Energy J. 2019, 40. [Google Scholar] [CrossRef]
  123. Zhao, T.; Bell, L.; Horner, M.W.; Sulik, J.; Zhang, J. Consumer responses towards home energy financial incentives: A survey-based study. Energy Policy 2012, 47, 291–297. [Google Scholar] [CrossRef]
  124. Datta, S.; Gulati, S. Utility rebates for ENERGY STAR appliances: Are they effective? J. Environ. Econ. Manag. 2014, 68, 480–506. [Google Scholar] [CrossRef] [Green Version]
  125. Overholm, H. Spreading the rooftop revolution: What policies enable solar-as-a-service? Energy Policy 2015, 84, 69–79. [Google Scholar] [CrossRef]
  126. Drury, E.; Miller, M.; Macal, C.M.; Graziano, D.J.; Heimiller, D.; Ozik, J.; Iv, T.D.P. The transformation of southern California’s residential photovoltaics market through third-party ownership. Energy Policy 2012, 42, 681–690. [Google Scholar] [CrossRef]
  127. SOM. EO 2019-14 UP Energy Task Force. 2019. Available online: https://content.govdelivery.com/attachments/MIEOG/2019/06/07/file_attachments/1226627/EO 2019-14 UP Energy Task Force.pdf (accessed on 7 July 2020).
  128. Michigan Government. EV Charger Funding Opportunities. Depatment Environ Gt Lakes, Energy. Available online: https://www.michigan.gov/climateandenergy/0,4580,7-364-85453_85455-487842--,00.html (accessed on 25 August 2020).
  129. Krishnan, R.; Haselhuhn, A.; Pearce, J.M. Technical Solar Photovoltaic Potential of Scaled Parking Lot Canopies: A Case Study of Walmart U.S.A. J. Innov. Sustain. RISUS 2017, 8, 104. [Google Scholar] [CrossRef] [Green Version]
  130. Seyfang, G.; Haxeltine, A. Growing Grassroots Innovations: Exploring the Role of Community-Based Initiatives in Governing Sustainable Energy Transitions. Environ. Plan. C Gov. Policy 2012, 30, 381–400. [Google Scholar] [CrossRef] [Green Version]
Figure 1. UPPCO’s electricity price by sector and the average U.S. price from 2005–2019. Sources: Author, based on MPSC data on comparison of average rates (in cents per kWh) for MPSC-regulated electric utilities in Michigan [9].
Electricity 03 00016 g001
Figure 2. A schematic of phases involved in systems design and 100% RE modeling.
Electricity 03 00016 g002
Figure 3. A system diagram for simulations with hydro represented as the grid.
Electricity 03 00016 g003
Figure 4. The three municipalities, (a) Negaunee, (b) L’Anse, (c) Anonymous, and their load profile with average monthly consumption.
Electricity 03 00016 g004aElectricity 03 00016 g004b
Figure 5. Average monthly air temperatures at each case study location.
Electricity 03 00016 g005
Figure 6. The monthly GHI (with 45° snow losses removed) at each simulated location.
Electricity 03 00016 g006
Figure 7. The average monthly wind speeds at each simulated location at 100 m above ground.
Electricity 03 00016 g007
Figure 8. The sensitivity results for Negaunee with 45° tilt angle, different discount rate, varying components costs, and varying average load with and without energy efficiency considerations.
Electricity 03 00016 g008
Figure 9. The sensitivity results for L’Anse with 45° tilt angle, different discount rate, varying components costs, and varying average load with and without energy efficiency considerations.
Electricity 03 00016 g009
Figure 10. The sensitivity results for Anonymous with 45° tilt angle, different discount rate, varying components costs, and varying average load with and without energy efficiency considerations. The yellow dot line indicates commercial rate.
Electricity 03 00016 g010
Table 1. Municipalities and energy load descriptions.
LatitudeLongitudePopulationAverage Load (MW)Peak Load (MW)
Negaunee46.4928 N87.6070 W45472.54 4.09
L’Anse46.7528 N88.4480 W18721.48 2.49
Anonymous municipality in WUP--10,0059.72 16.3
Table 2. The estimated seasonal and annual snow losses for each PV tilt angle in each case study community.
Solar PV Tilt Angle30°45°60°
L’AnseSeasonal21.0%11.7%5.1%
Annual10.0%5.6%2.4%
NegauneeSeasonal21.5%12.0%5.7%
Annual10.1%5.7%2.7%
AnonymousSeasonal22.1%11.6%5.9%
Annual10.6%5.6%2.8%
Table 3. Turnkey lithium-ion battery cost sensitivities (in $/kWh) [92].
EstimateHighMidLow
Capital359330297
Replacement291194112
Table 4. The proportions of hydropower capacity, supply, and cost for each location.
Peak Capacity (kW)Allocation (GWh/yr)Minimum RF
Negaunee14325.64675.6%
L’Anse5902.32582.1%
Anonymous315012.41785.4%
Table 5. A summary of sensitivity parameters.
ComponentsLowHighIncrementLifetime
PV + inverter capital cost ($/kWac)1200200020030
Wind turbine capital cost ($/kWac)900150010030
Load reduction via energy efficiency (%)1.7510n/a (assumed aggressive EE)-
PV tilt angle (degrees)306015-
Real discount rate (%)282-
Table 6. Optimum solutions for each battery cost in the economic base case.
L’Anse LowMidHigh
PV (MW)Wind (MW)Batt (MWh)PV (MW)Wind (MW)Batt (MWh)PV (MW)Wind (MW)Batt (MWh)
Capacity1.787028702.2869
LCOE ($/kWh)0.15820.18130.2049
Capital (M$)34.237.539.6
Excess (%)49.55050.5
Negaunee LowMidHigh
PV (MW)Wind (MW)Batt (MWh)PV (MW)Wind (MW)Batt (MWh)PV (MW)Wind (MW)Batt (MWh)
Capacity4.810945109361089
LCOE ($/kWh)0.13480.15160.1673
Capital (M$)50.253.456.3
Excess (%)38.538.940.4
Anonymous LowMidHigh
PV (MW)Wind (MW)Batt (MWh)PV (MW)Wind (MW)Batt (MWh)PV (MW)Wind (MW)Batt (MWh)
Capacity34.938528334451026.876439
LCOE ($/kWh)0.18790.20960.2195
Capital (M$)271287308
Excess (%)41.345.862.3
Table 7. LCOE, capacities, and excess generation for each community and PV tilt angle.
L’Anse 30° Tilt45° Tilt60° Tilt
PV (MW)Wind (MW)Batt (MWh)PV (MW)Wind (MW)Batt (MWh)PV (MW)Wind (MW)Batt (MWh)
Capacity0.861068.71.98870.101271.2
LCOE ($/kWh)0.1770.18130.1808
Capital (M$)37.737.539.7
Excess (%)56.55062
Negaunee 30° Tilt45° Tilt60° Tilt
PV (MW)Wind (MW)Batt (MWh)PV (MW)Wind (MW)Batt (MWh)PV (MW)Wind (MW)Batt (MWh)
Capacity3.3812108.55.951093.57.771079.3
LCOE ($/kWh)0.16490.15160.143
Capital (M$)58.153.452.5
Excess (%)43.538.941.9
Anonymous 30° Tilt45° Tilt60° Tilt
PV (MW)Wind (MW)Batt (MWh)PV (MW)Wind (MW)Batt (MWh)PV (MW)Wind (MW)Batt (MWh)
Capacity26.652539.43344510.443.832416.2
LCOE ($/kWh)0.21660.20960.1878
Capital (M$)296.1287.1259.3
Excess (%)48.845.839.4
Publisher’s Note: MDPI stays neutral with regard to jurisdictional claims in published maps and institutional affiliations.

