1. Introduction
Electric vehicles (EVs) are becoming popular due to their zero emissions by employing electrical energy storage systems (ESSs) for traction [
1]. The most-used ESSs are electric double-layer capacitors (EDLC) and lithium-ion batteries (LiBs) [
2]. EDLCs show longer lifetime and higher power ratios, while they suffer from low energy density [
3]. Although LiBs are exceptional solutions for high energy densities, low power density is their major drawback [
4]. In this respect, lithium-ion capacitors (LiCs) have emerged that are hybrid ESSs [
5]. The main benefits of LiCs are higher power compared to LiBs and higher energy compared to EDLCs, which make LiCs very reliable in high-power applications [
6]. Nevertheless, excessive heat generation in high-power applications can reduce their performance and lifetime [
7]. Thus, a robust cooling system should be designed to control the LiC’s temperature [
8].
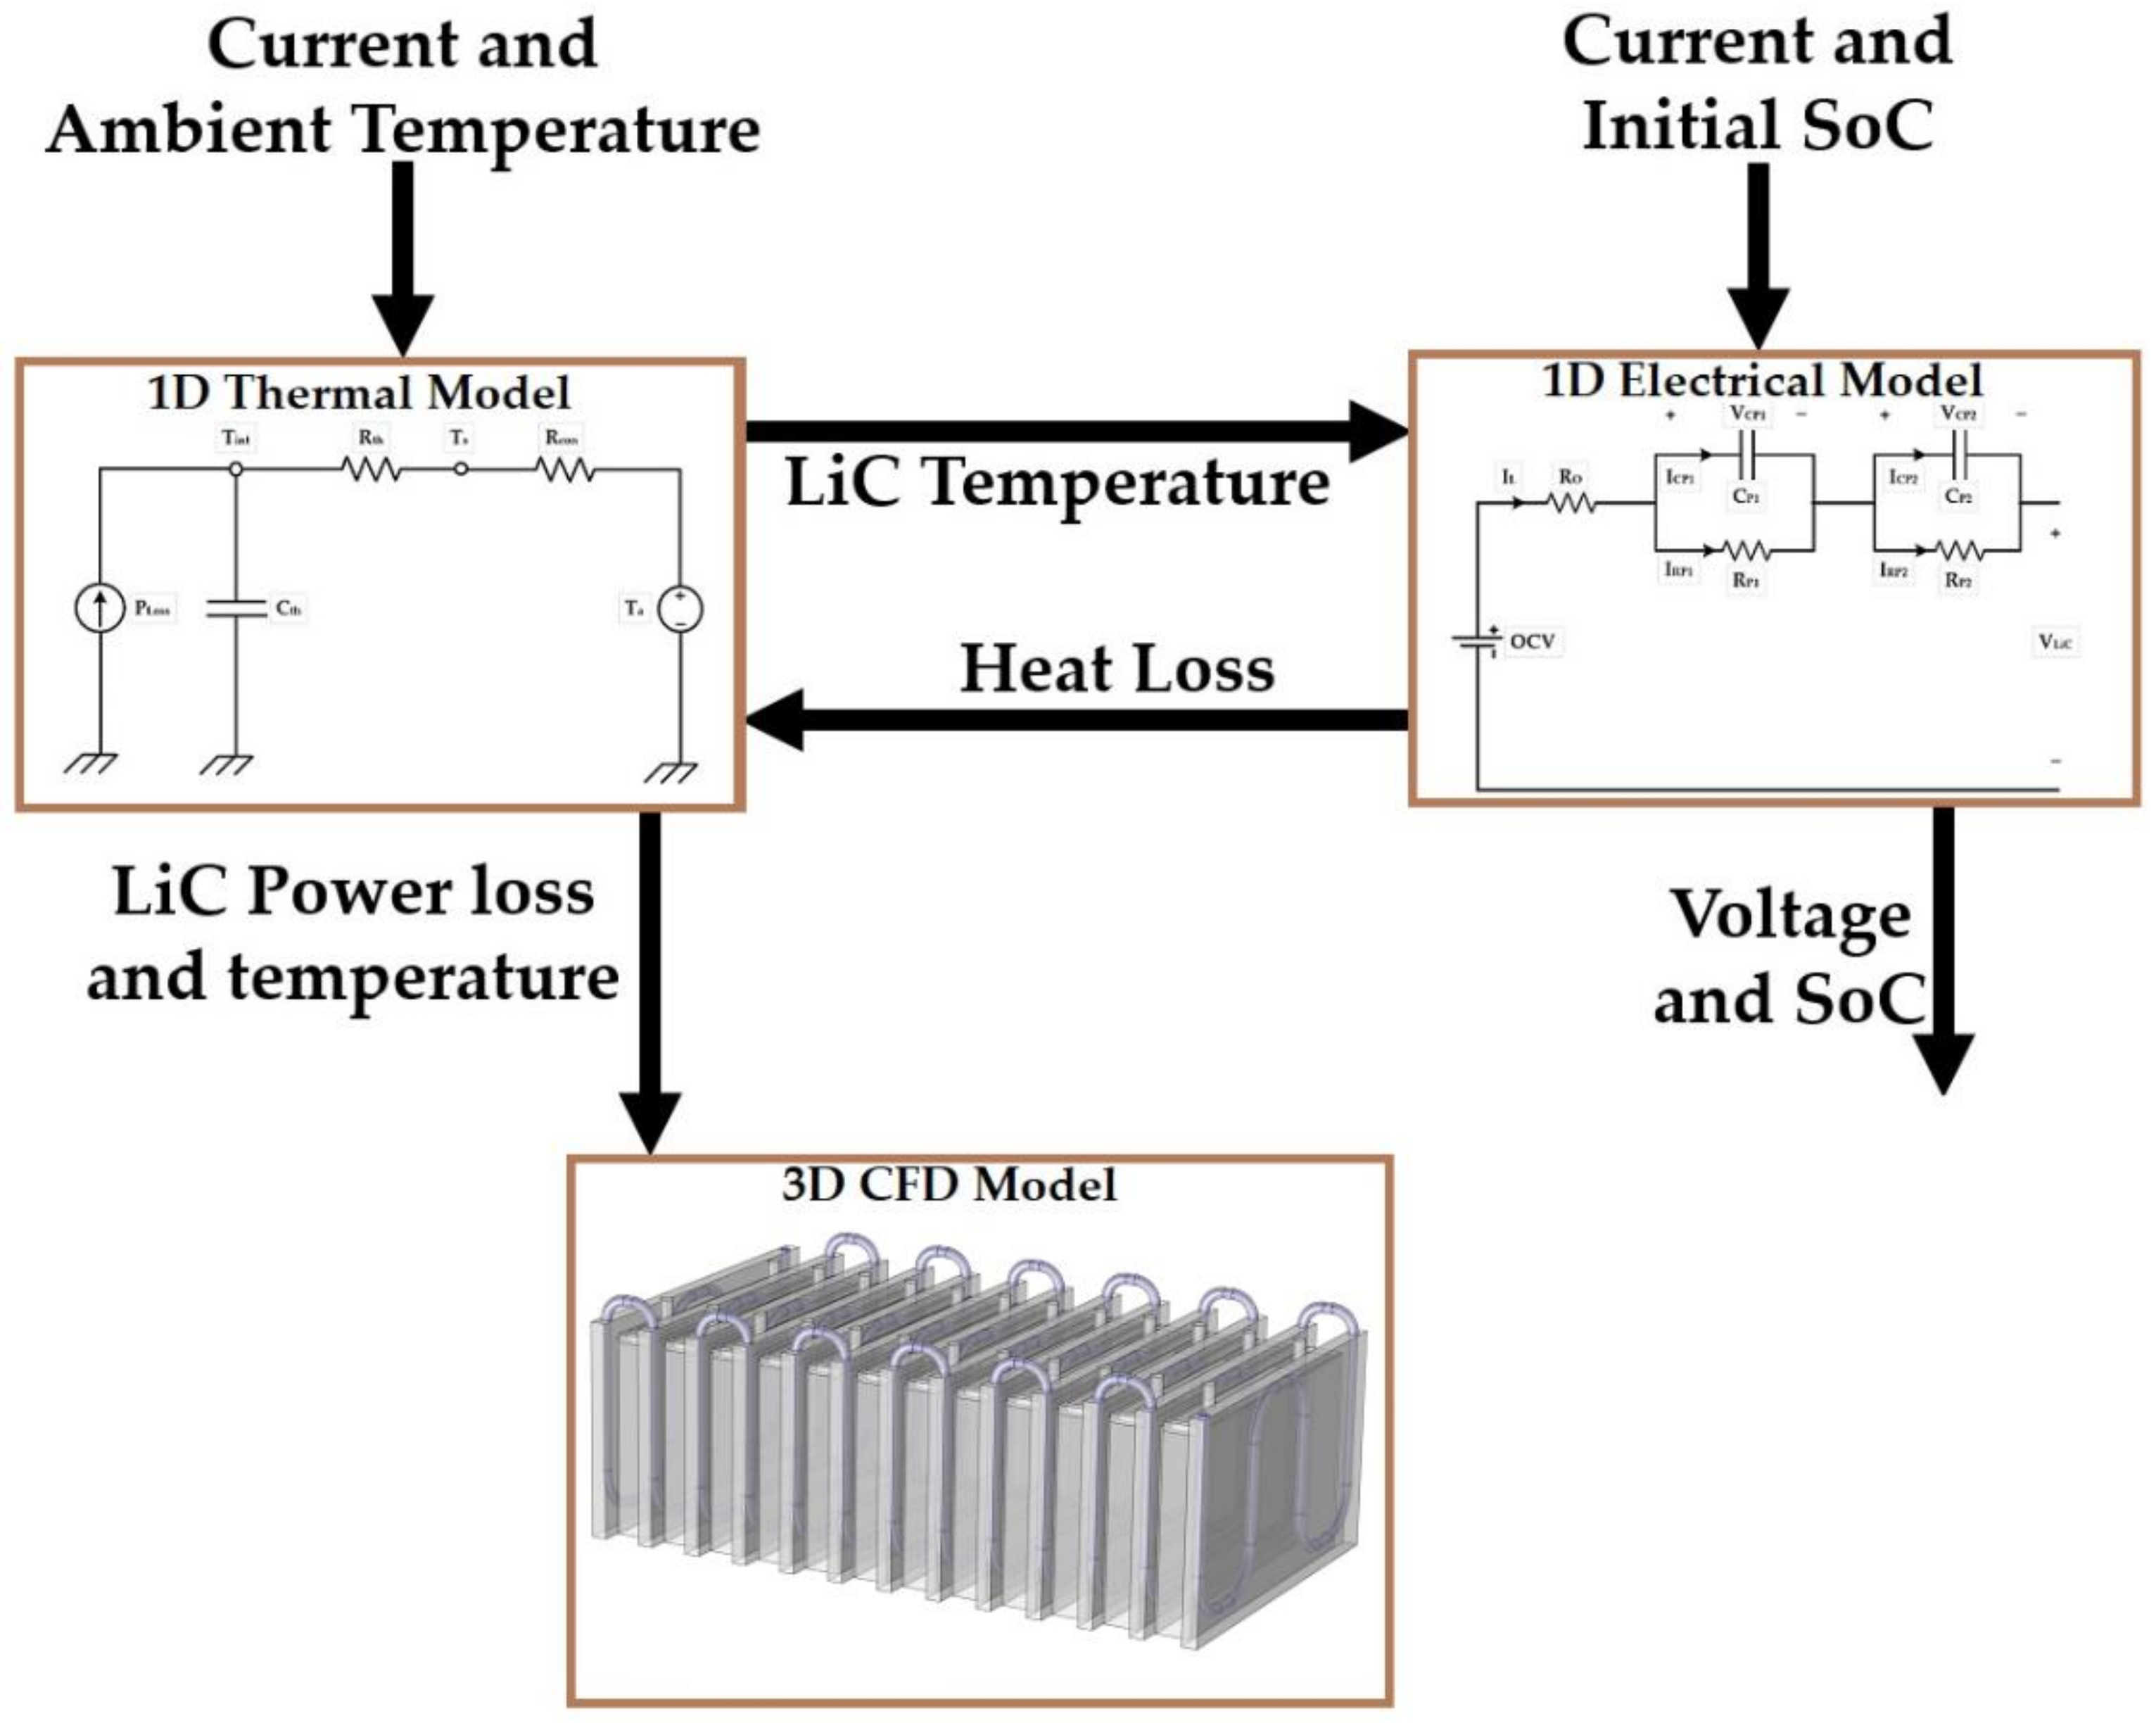
Before designing a thermal management system (TMS), the development of accurate electrical and thermal models is vital for further optimization of the developed system to guarantee the robustness of the proposed system [
9]. In this context, following the development of a 1D electro-thermal model, a 3D thermal model should be developed [
10]. A 3D thermal model is a computational fluid dynamics (CFD) model aiming for system optimization [
11]. A 1D electrical model is responsible for extracting the electrical parameters, such as internal resistance, capacitance, and open-circuit voltage (OCV) [
12], which will be used to extract the heat loss of the cell through the 1D thermal model [
13]. The 3D thermal model will then employ the extracted power loss to predict the LiC’s thermal behavior [
14]. The 1D model in this work was developed in the MATLAB/SIMULINK
® environment, and the 3D model was built in the COMSOL Multiphysics
® software package.
Generally, active and passive cooling systems are the main methods to control the ESSs [
15,
16]. Passive systems include heat sinks [
17], heat pipes [
18], and phase change materials (PCM) [
19]. Heat sinks are metal plates to enhance the heat flow away from a heat source [
20]. Heat pipes are highly thermally conductive substances that remove the generated heat from heat sources; they have some drawbacks, such as complex design [
21], low performance in high-power applications [
22], and gravity dependency [
23]. PCMs are materials that absorb and reject heat generation (thermal energy) when they are melted and frozen [
24]. During the thermal cycling process, PCMs change their phase from solid to liquid. The major problem of PCMs is their very low thermal conductivity, which limits their applications [
25]. Therefore, other highly conductive materials, such as heat pipes [
26], graphite [
27], nanomaterials [
28], nanofluids [
29], copper foams [
30], or aluminum foams [
31], should be added to PCMs to cope with this drawback.
On the other hand, active cooling systems comprise air and liquid cooling methods [
32,
33]. Air-cooled TMSs are reasonable solutions at low ambient temperatures when the inlet and outlet positions are well-structured and the inlet flow velocity is set accordingly [
34]. The heat transfer rate of liquid-cooled TMSs is higher than air, making them a perfect candidate in high-power applications. Karimi et al. [
34] developed an air cooling system for a LiC 2300 F cell and decreased the maximum temperature of the cell by 14%. Akbarzadeh et al. [
35] compared an air cooling system with a liquid cooling system for a module of LiB, in which they proved that the temperature uniformity of the liquid-cooled system was better than that of the air cooling system. Gungor et al. [
36] proposed a liquid cooling design for EVs. They proved that a canopy-to-canopy architecture has high thermal performance to maintain the battery cell in the desired range. Tang et al. [
37] designed and optimized a lightweight cooling system for four prismatic batteries. Their proposed design had 1.88% and 2.36% weight ratios. Tang et al. [
38] designed an automatic calibrated model for TMS based on the SVR model with RBF kernel. Cao et al. [
39] upgraded a liquid cooling TMS using composite PCMs. They showed that the battery’s maximum temperature and temperature uniformity were below 46 °C and 4 °C, respectively. Rui et al. [
40] established a 3D thermal runaway propagation (TRP) model with liquid-cooled structures and showed that the criticality boundary could guide the safety design aspects for the TMS.
To the best of the authors’ knowledge, no work in the literature has proposed a liquid-cooled system for a module of 12 LiC cells cycled under a 150 A harsh current rate. This paper continues the work published in [
41], in which two cold plates cooled a LiC cell. Moreover, in this article, a detailed 1D/3D electro-thermal model is developed at module level employing MATLAB/SIMULINK
® coupled to the COMSOL Multiphysics
® software package, used to optimize the proposed cooling system. The design optimization parameters are the effect of the inlet coolant flow rate, inlet coolant temperature, inlet and outlet positions, and the number of arcs. Finally, a conclusion is made at the end of this work that combines all the optimized design parameters to yield the most optimized liquid-cooled TMS (LCTMS) regarding the proposed cooling system’s architecture and geometry.
3. Experimental Test Bench
The facilities used in the experimental investigation are a module of 12 LiC cells, 13 cold plates, a battery management system (BMS), a data logger, eight k-type thermocouples, a radiator, a pump, a power supply, a battery tester, and a computer.
3.1. Battery Management System (BMS)
The most vital element of the module used to monitor and control the voltage of all the cells, balance the state of charge (SoC), and monitor the temperature of each cell is the battery management system (BMS). The BMS is necessary to protect the cells against over-charging/discharging, and they are connected in series. The importance of the BMS lies in overcoming the voltage and SoC imbalance among the cells. In this work, a passive BMS is used to balance the LiC cells with low costs. The main functions of the utilized BMS are:
Parameter measurement (voltage, current, resistance, and temperature);
Safety and protection against over-charging/discharging, over-temperature, current limit;
Communication through CAN-bus or RS-485 port.
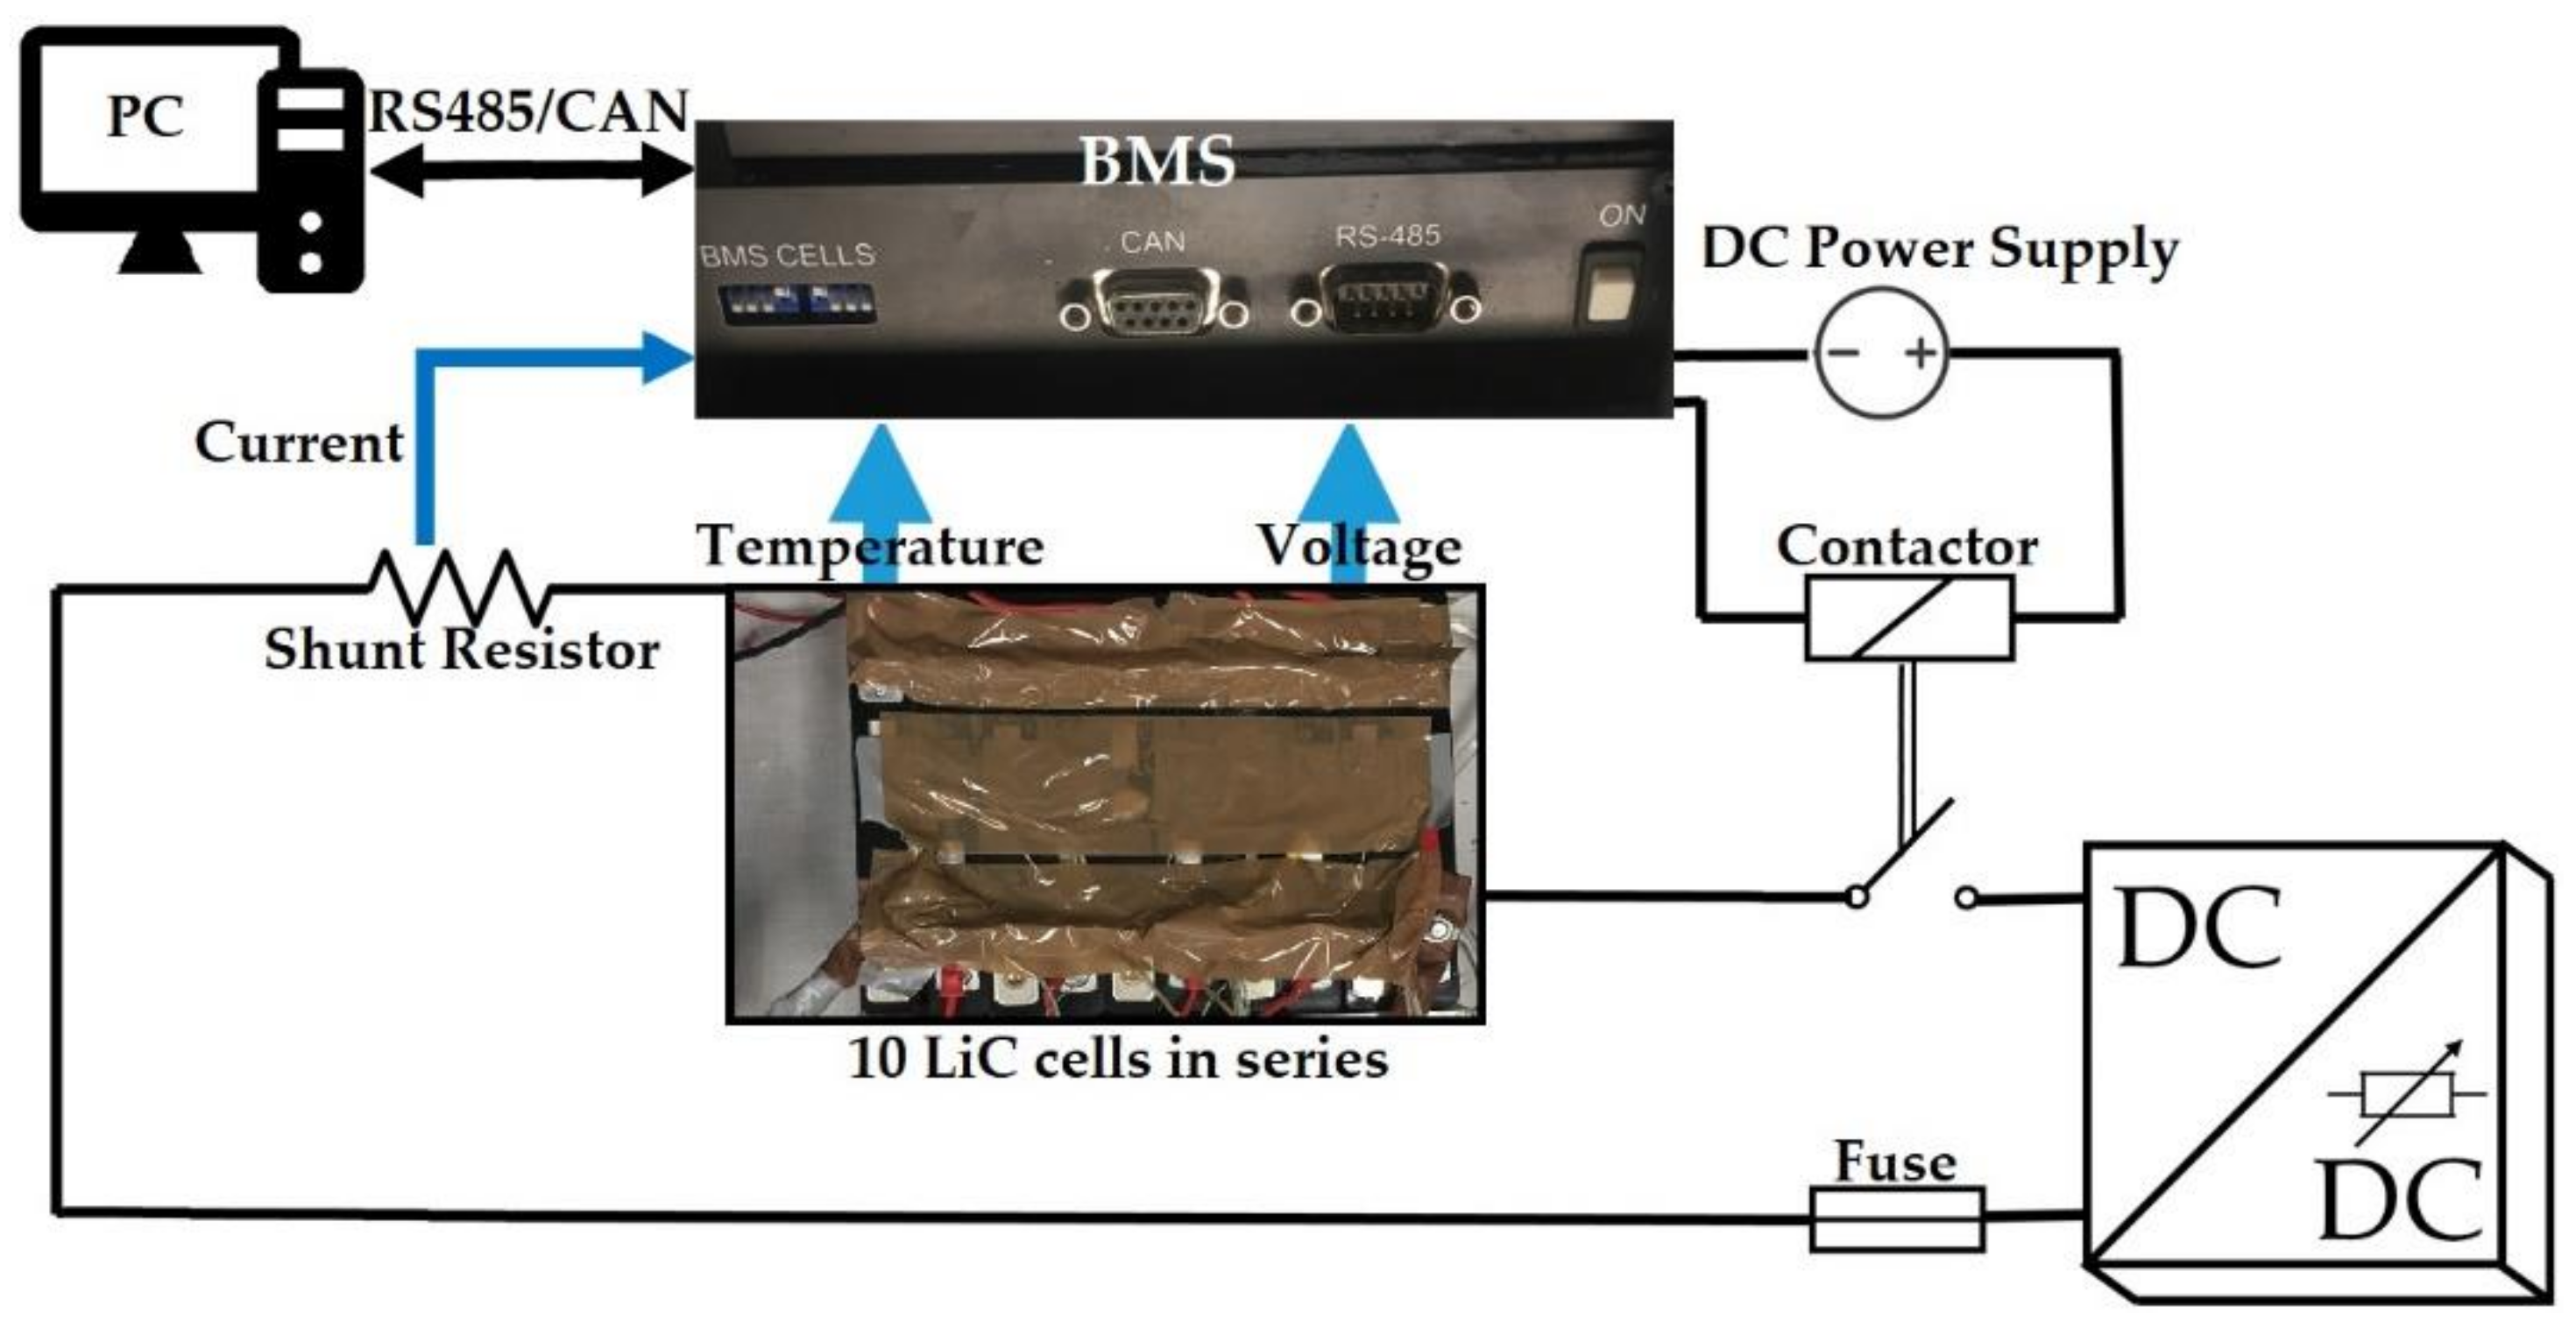
In this work, the BMS is used to equalize the LiC voltages by using 10 ohmic resistors called the switched shunt resistor.
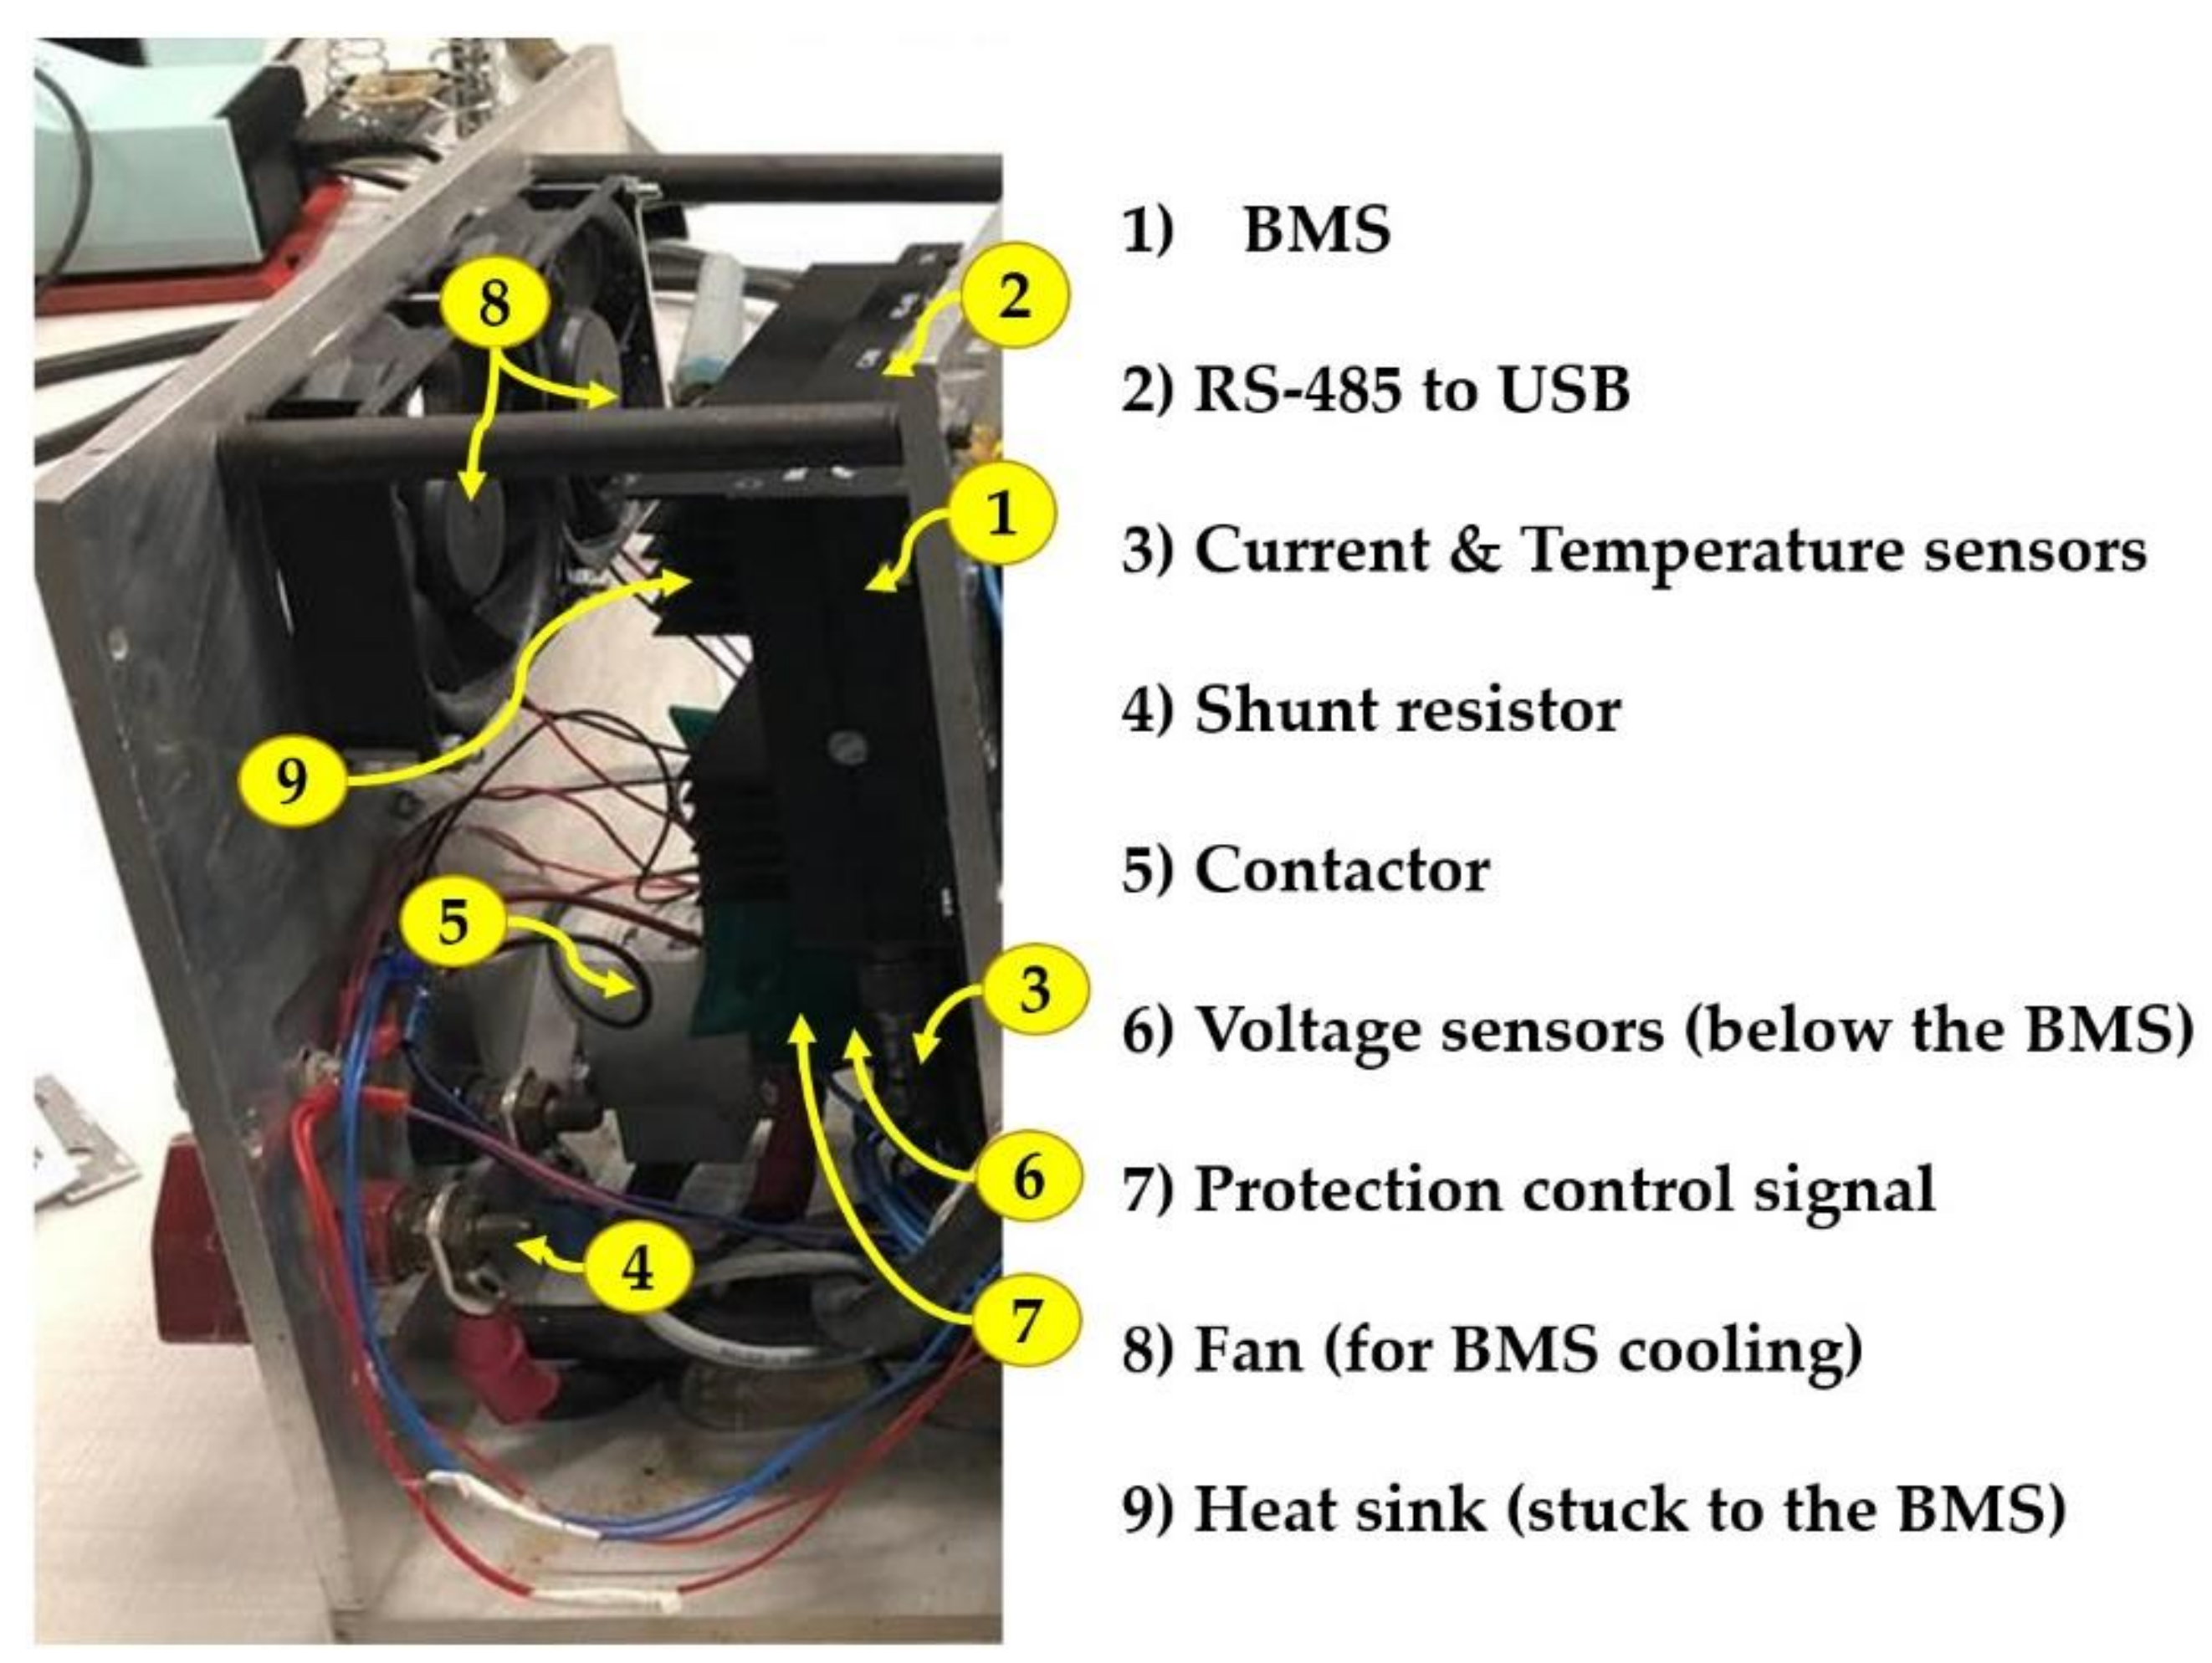
Figure 4 exhibits the block diagram of the experimental test bench for the LiC module while employing a BMS for balancing the cells and protecting the module. This can be done by monitoring the module’s temperature, voltage, and current at each time step. The current of the module is measured by a low-side precision shunt ohmic resistor with 0.25% accuracy. Additionally, the voltage drop of the module is measured by the shunt ohmic resistor thanks to its four-wire Kelvin connection. The BMS is connected to the shunt ohmic resistor via a short shielded cable. The ADC (analog to digital converter) with high accuracy filters out the noise or the current spikes. The temperature profile of the module is monitored by the K-type thermocouples and a data logger. Two small fans and a heat sink are added to protect the BMS from over-heating. The prototype of the used BMS and the wiring/connections is depicted in
Figure 5.
3.2. Test Bench Setup
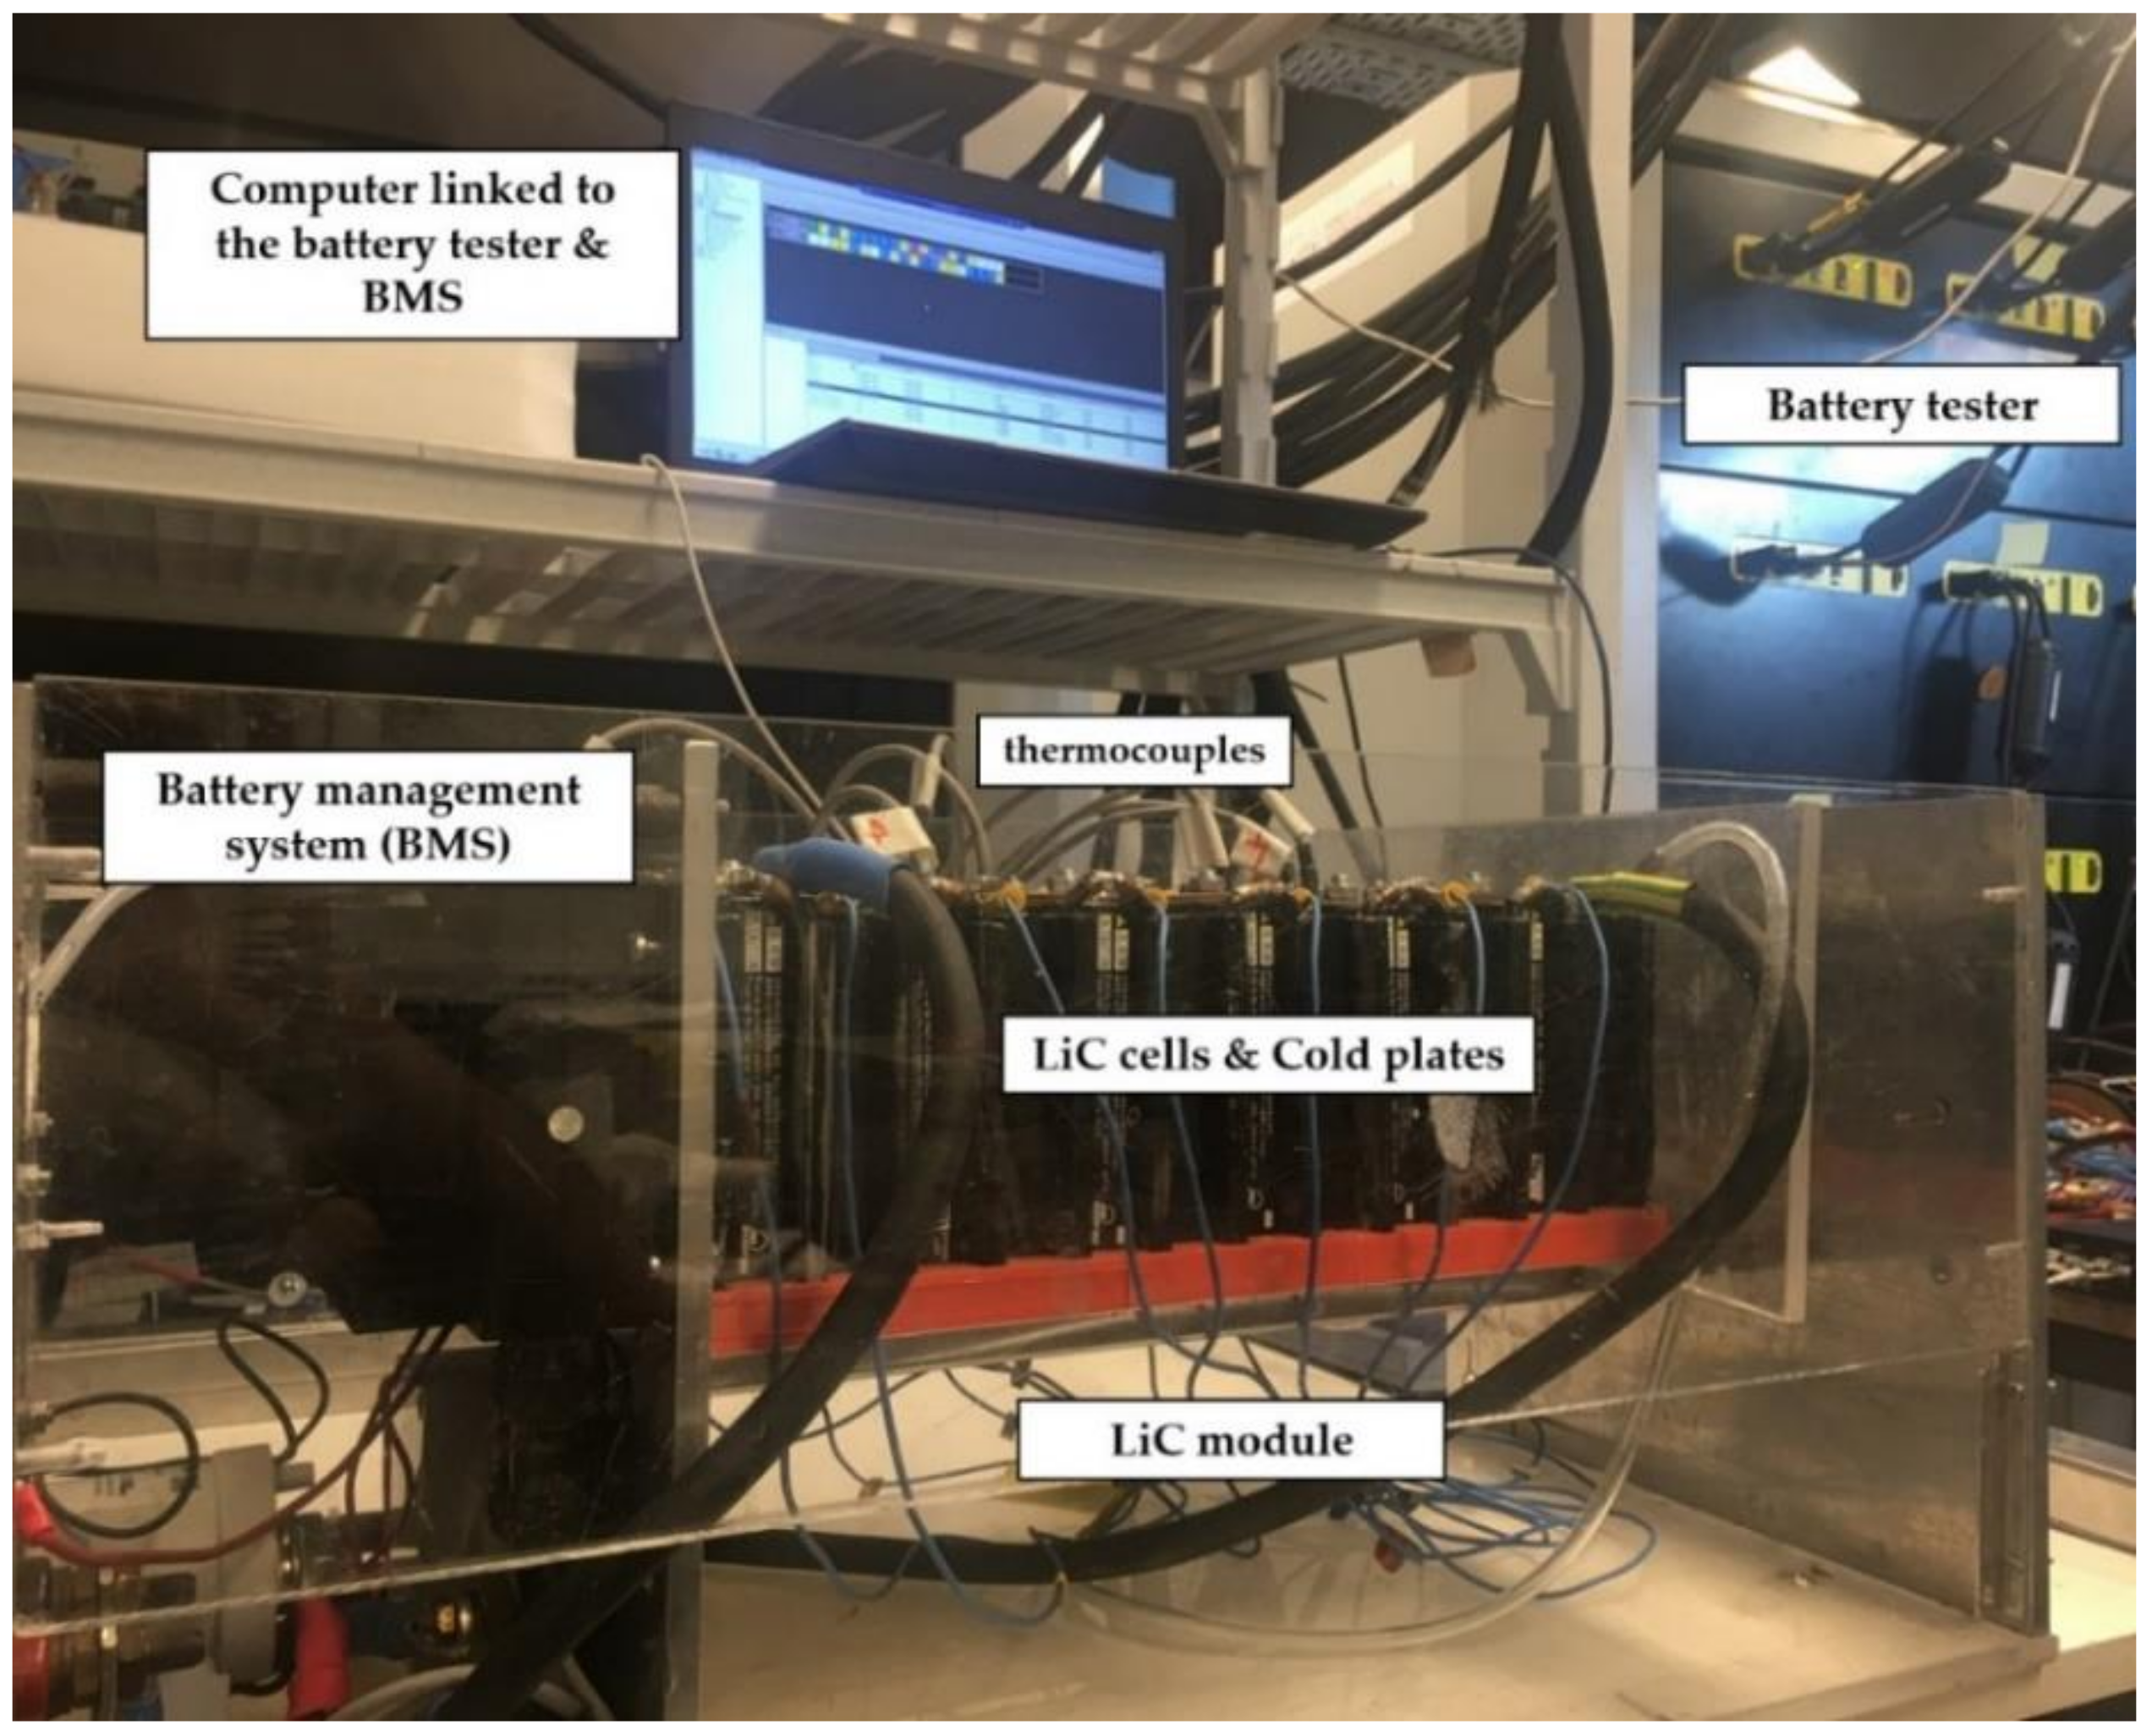
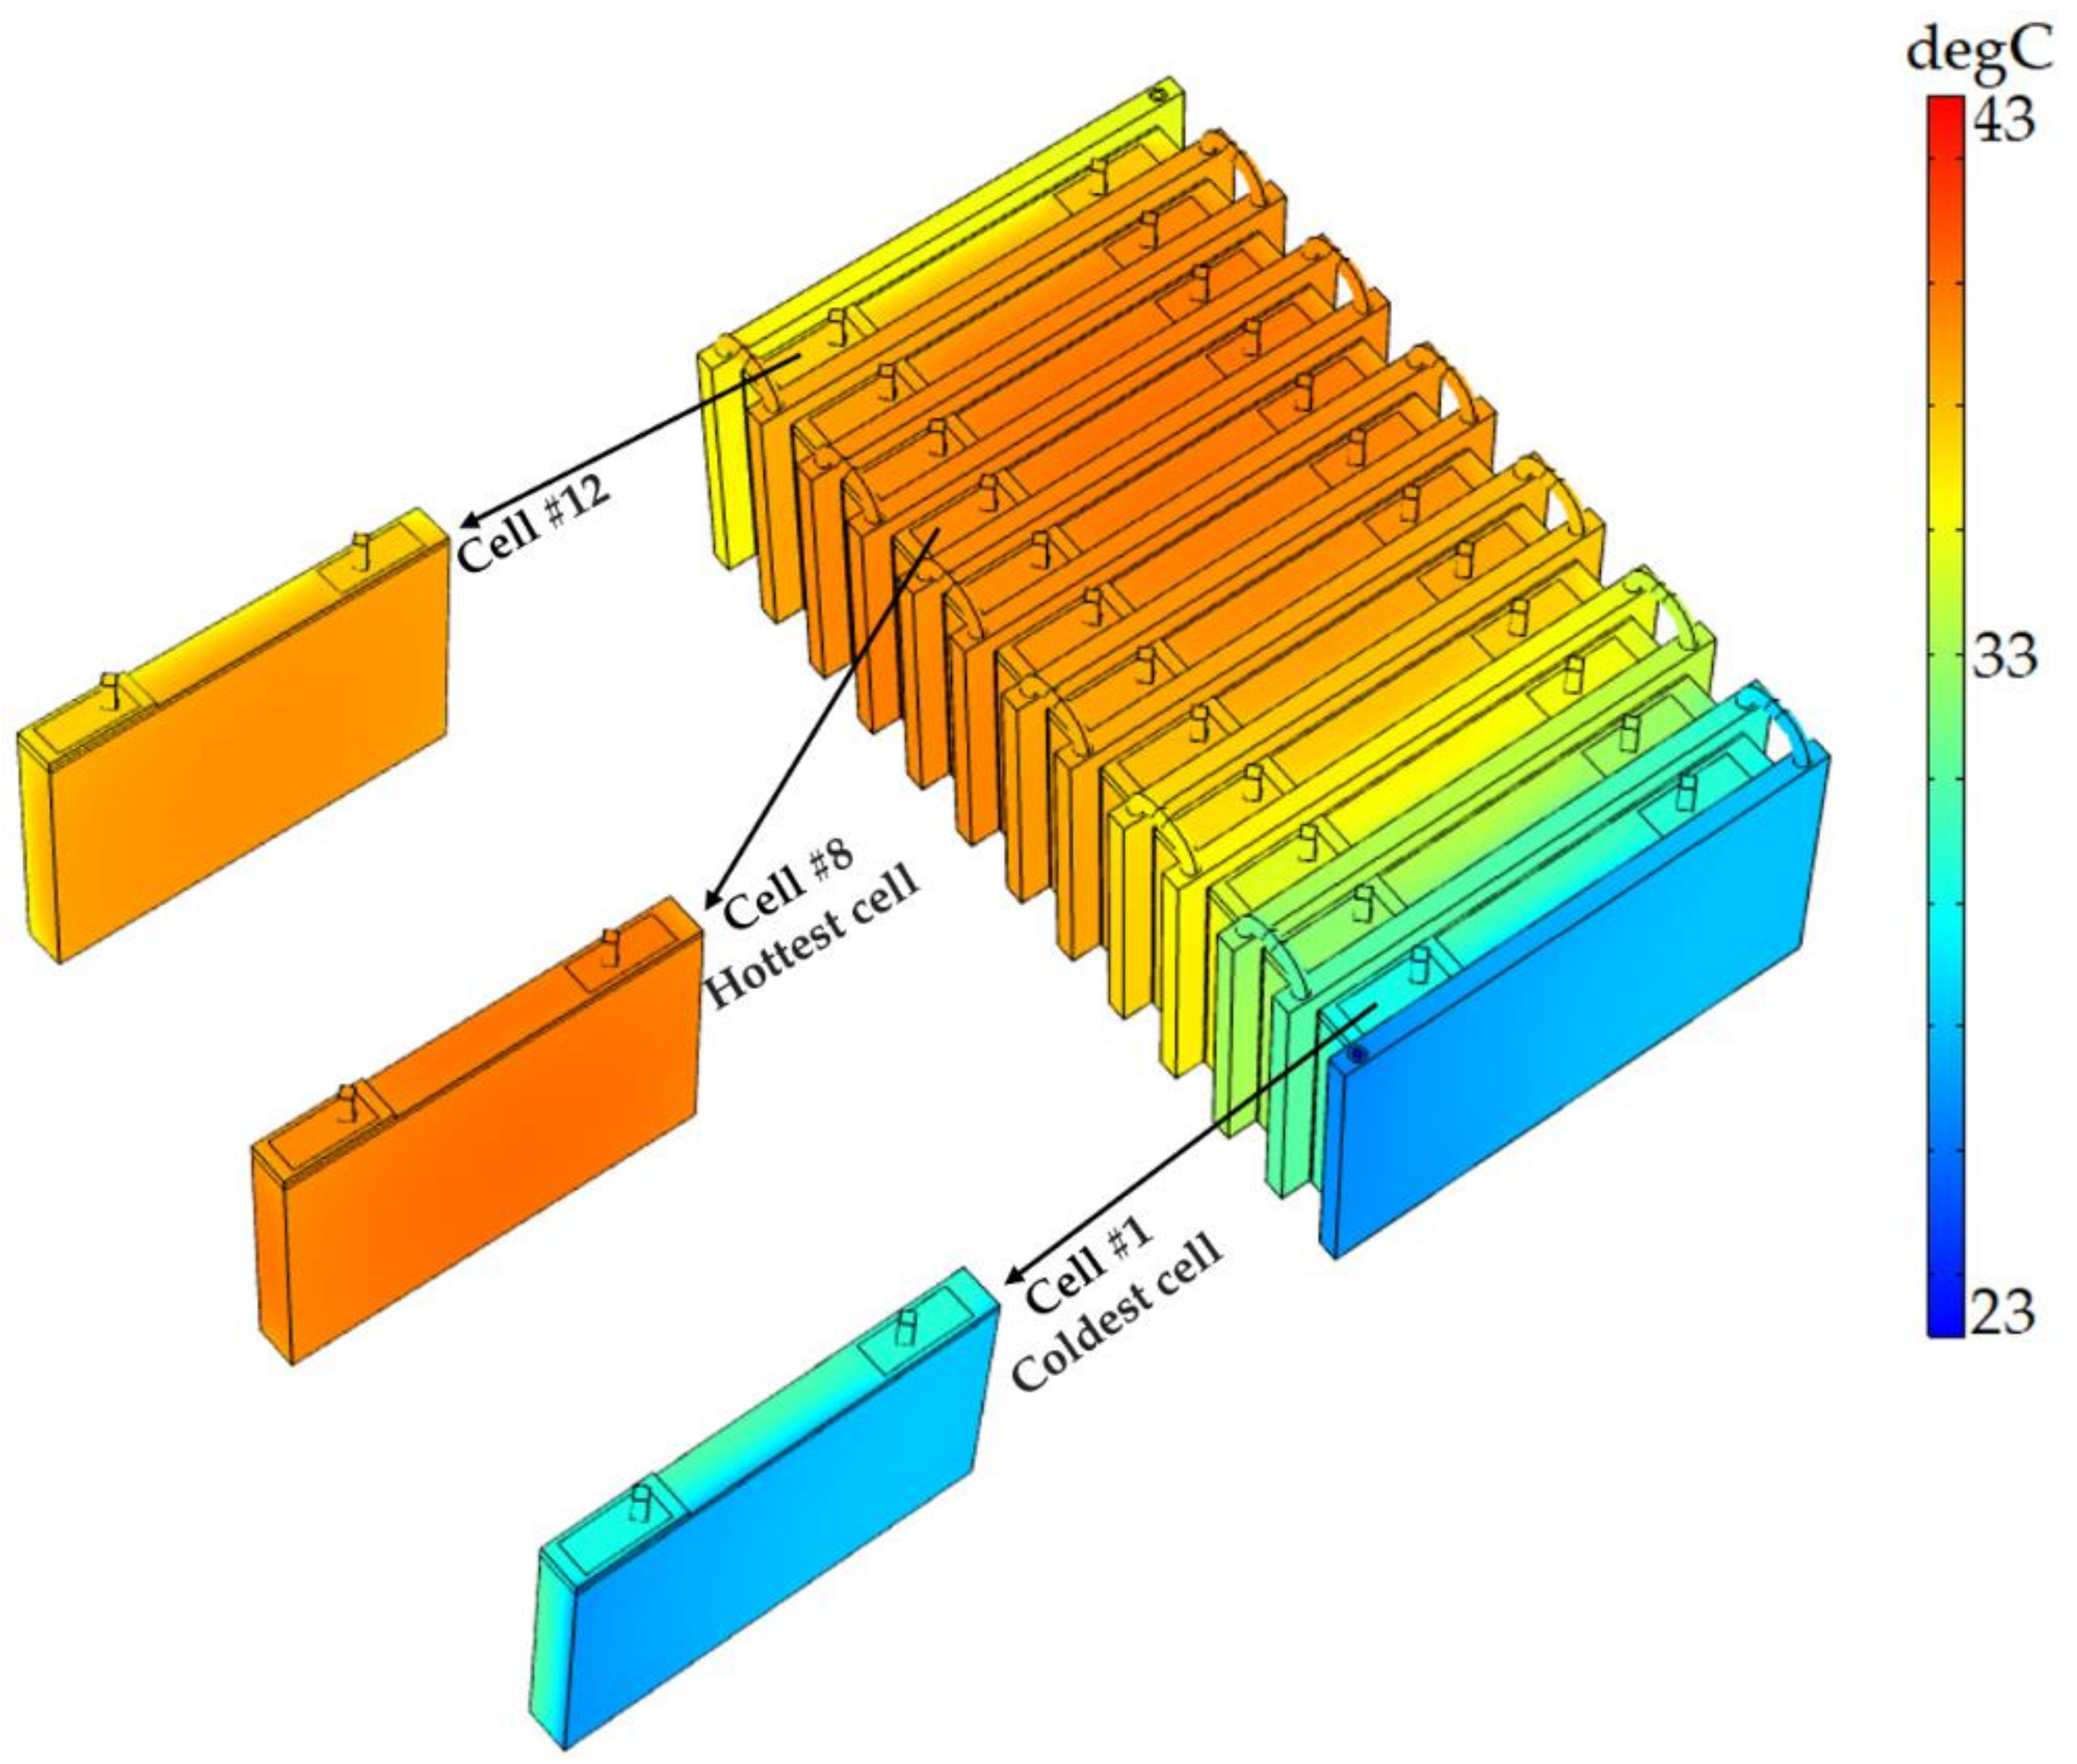
A forced LCTMS is used for cooling purposes in this work to cool down the temperature rise of the LiC 2300 F module in harsh operating conditions. The module is composed of 12 prismatic LiC cells connected in series. The LCTMS is composed of 13 cold plates, meaning that every two cold plates are attached to the left and right sides of the larger surface of the LiC cell. In the main case study, the inlet flow rate is set at 100 mL/min with an initial temperature of 23 °C. The pump is responsible for drawing the coolant from the tank storage to the cold plates. The coolant flow path is from the first cold plate to the last cold plate. Therefore, it is expected that the first cells experience a lower temperature, while the middle cells to the last should be hotter. The last cell (cell #12) is expected to be colder than the adjacent cells due to the heat flux, since one side of this cell is exposed to the ambient temperature.
Figure 6 demonstrates the facilities used in this work.
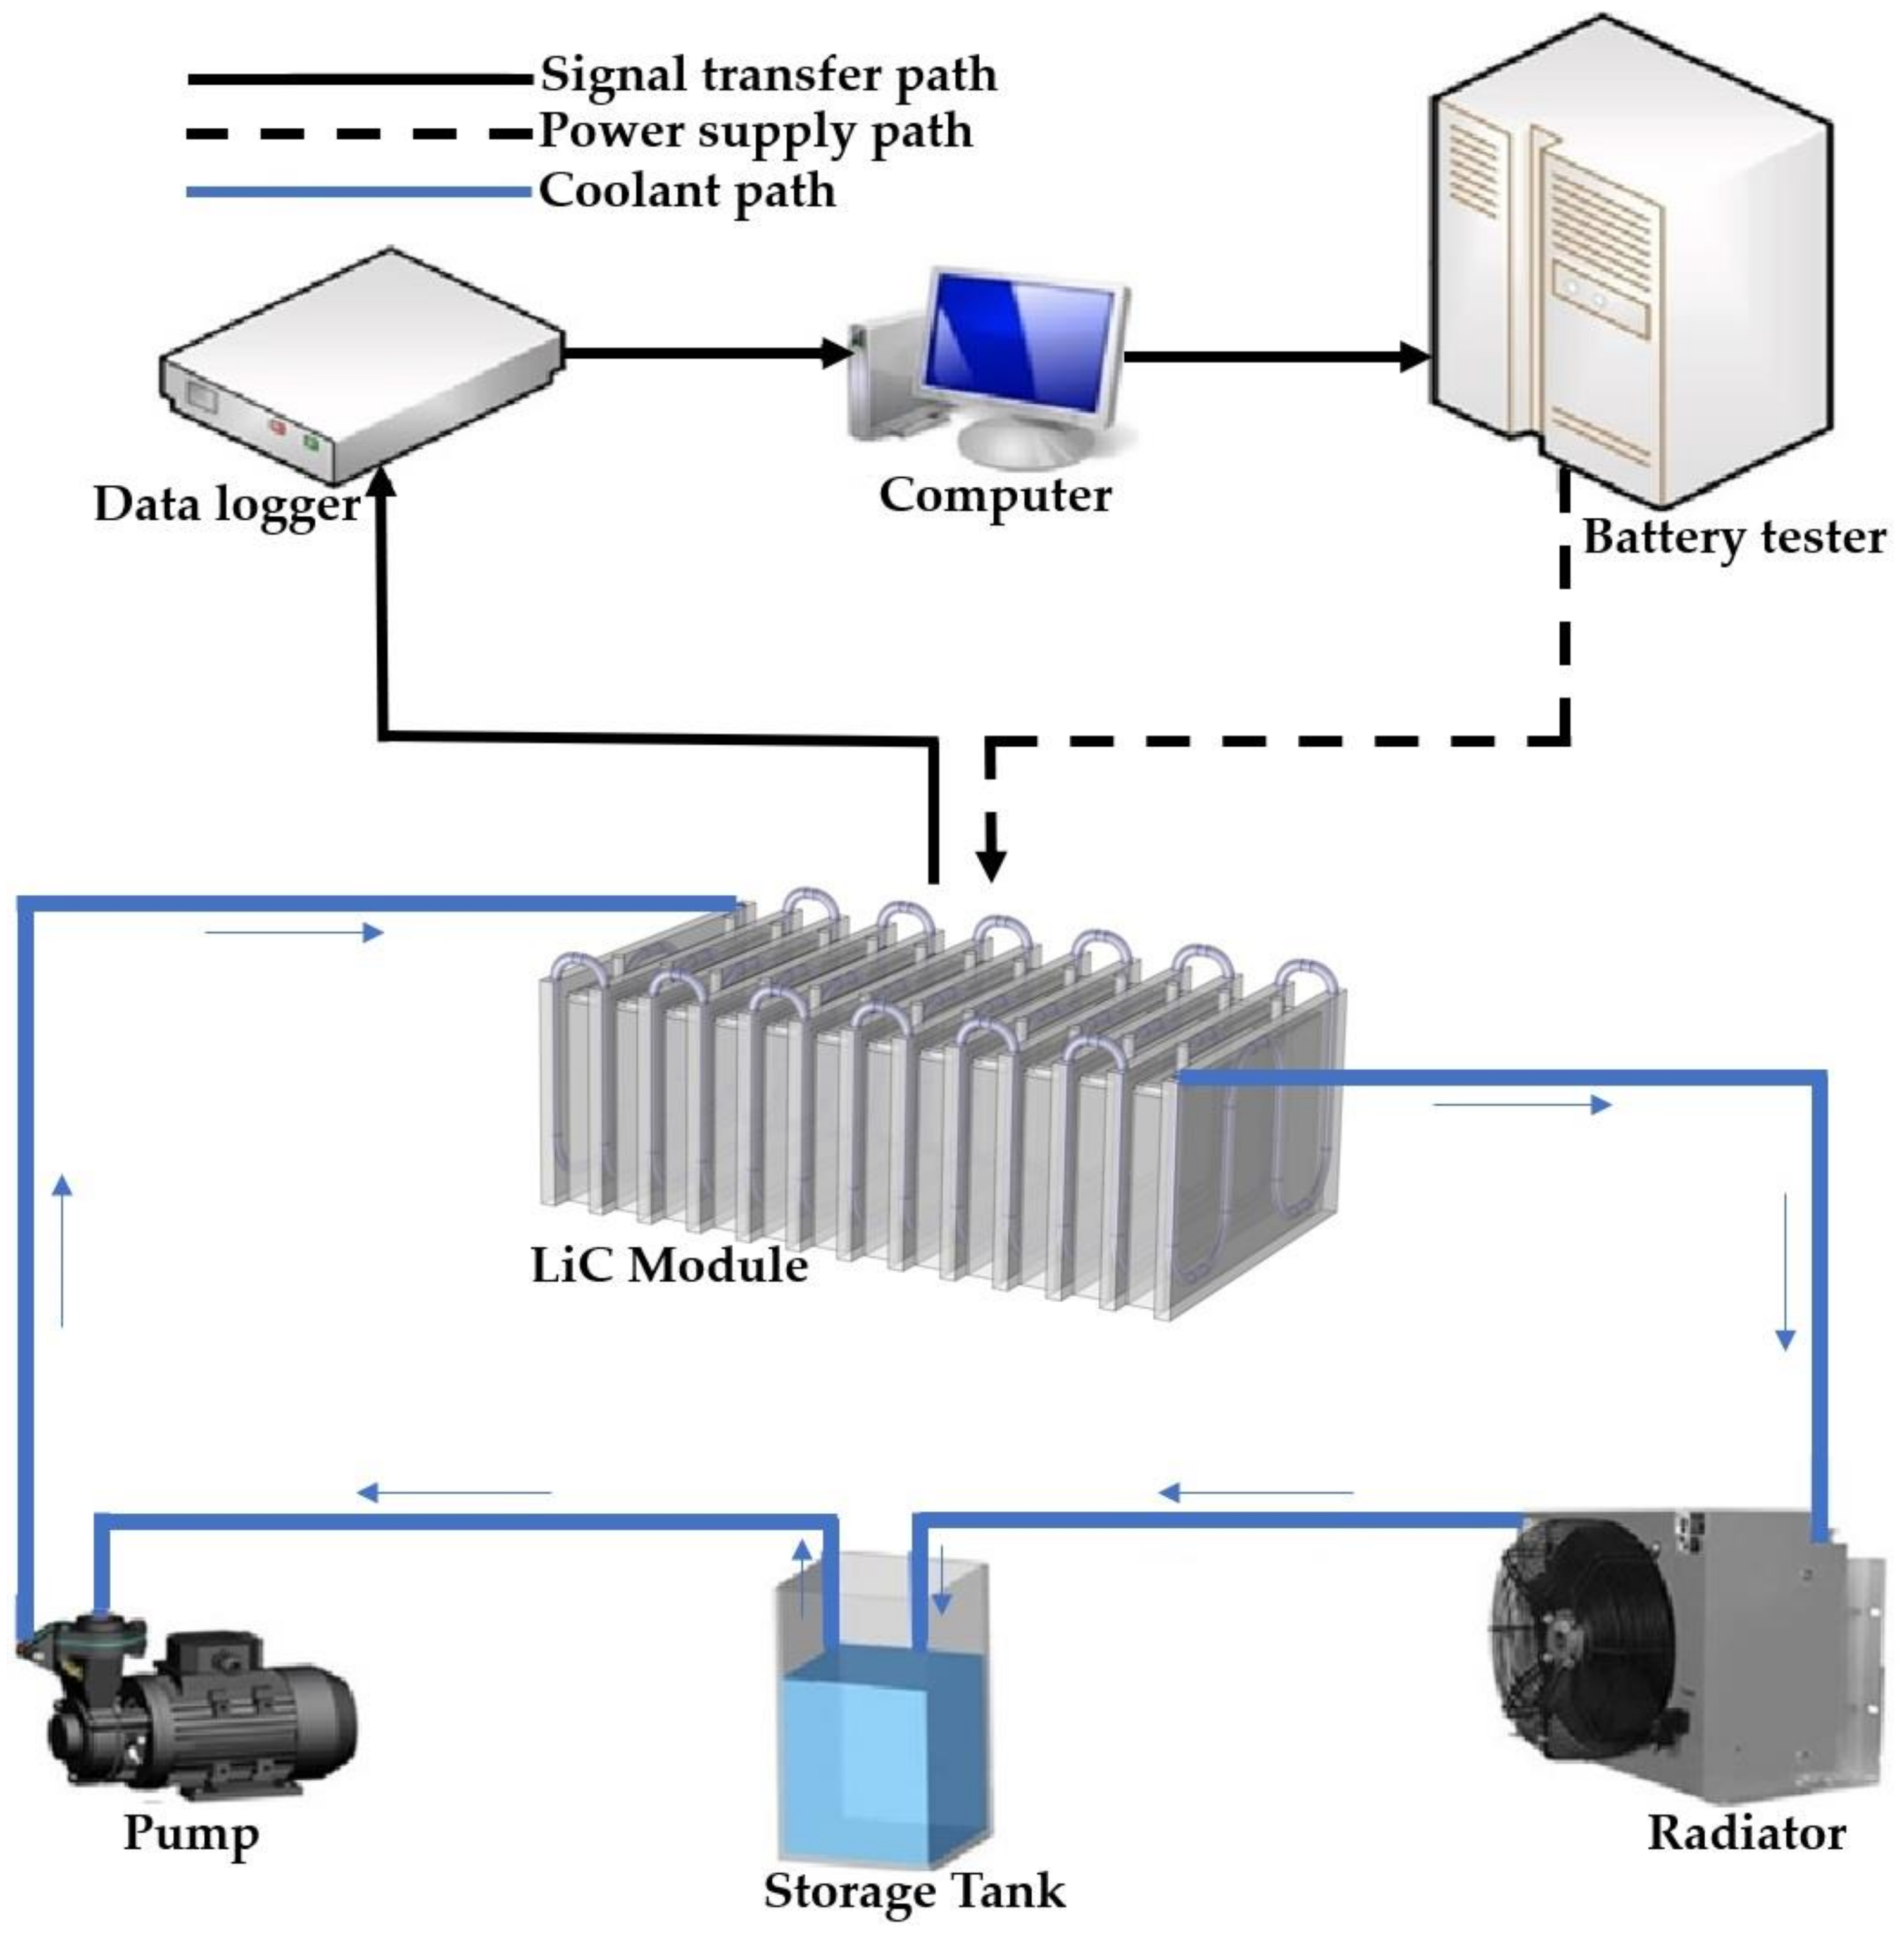
As is depicted in
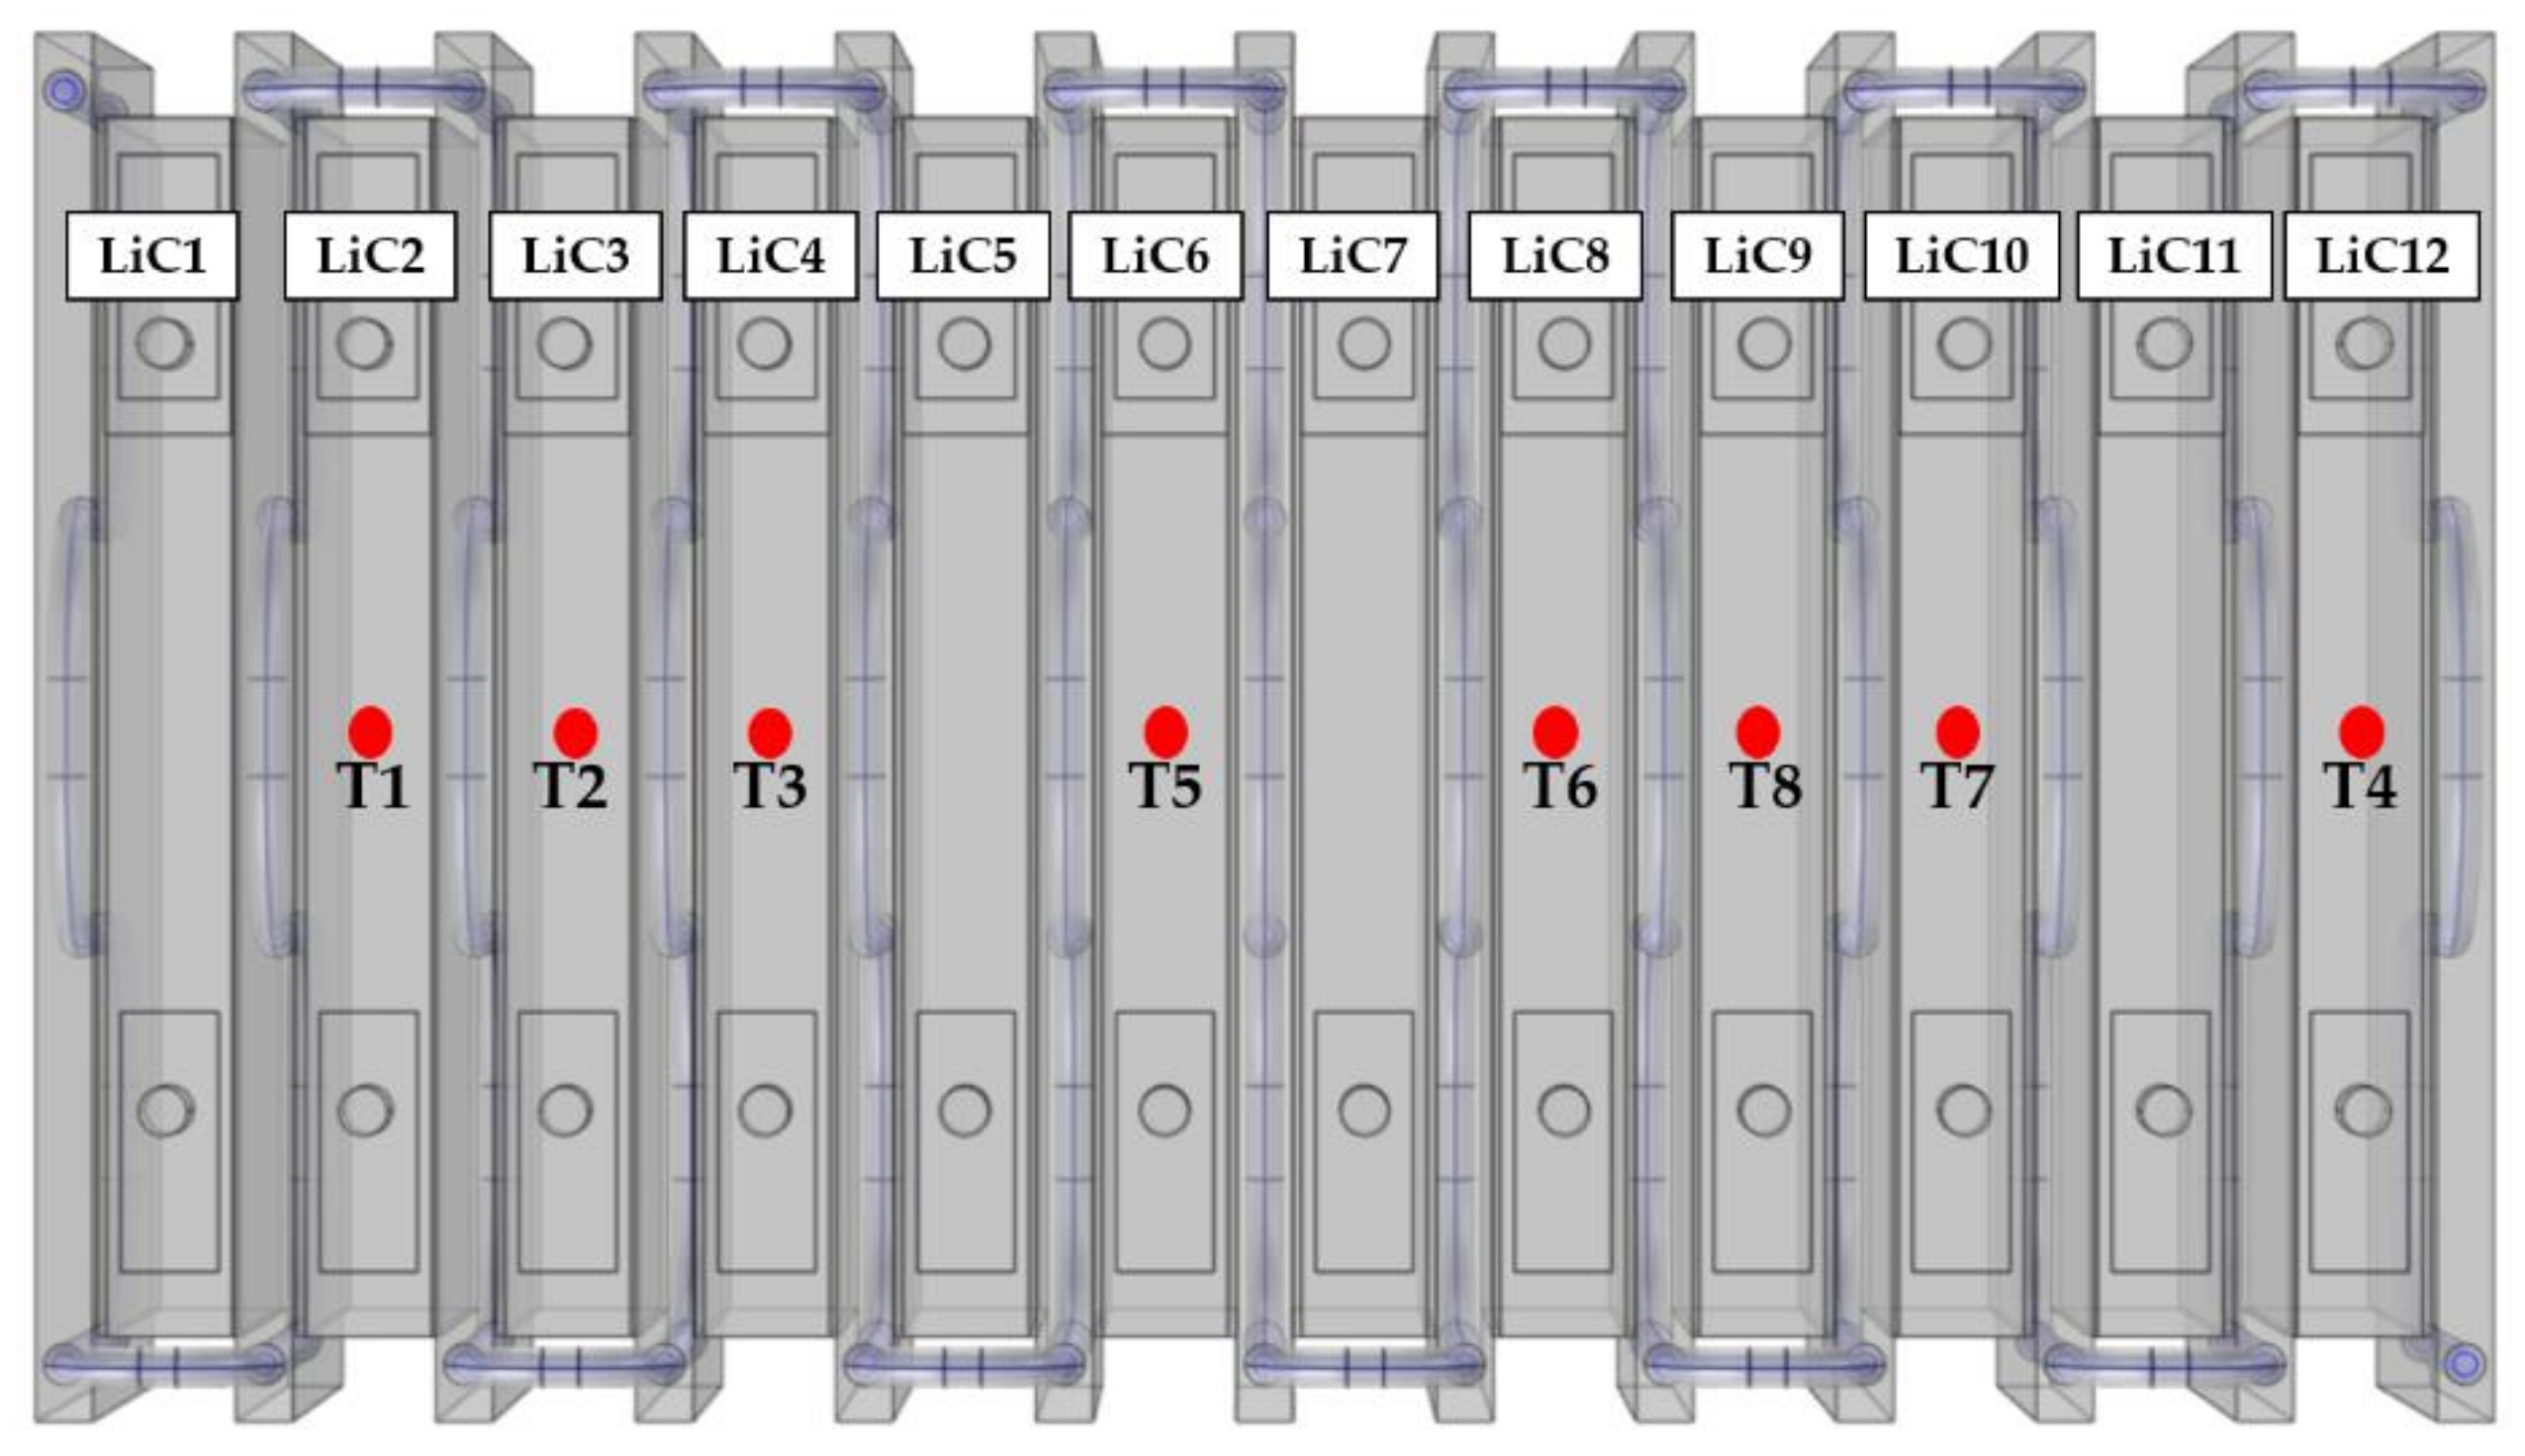
Figure 7, the computer is connected to the BMS through a CAN-bus or RS-485 port. On the other side, the computer is connected to the data logger to monitor the module’s temperature evolution during the experiments. The battery tester is responsible for applying the current and voltage to the module for cycling the cells. Two fans and a heat sink are embedded in the BMS part to cool it down in order to avoid failure of the BMS. The radiator cools down the coolant coming from the outlet of the cold plates. The coolant outlet temperature is directly proportional to the heat generation rate, but the inlet temperature of the coolant is almost 23 °C, thanks to the highly efficient radiator. The pump flows the coolant from the storage tank to the inlet of the LCTMS. In addition, 8 K-type thermocouples monitor the temperature at each time step, for which, in this work, the time step of the data logger and thermocouples is set to 1 s. This means that the thermocouples and the data logger save the temperature data every 1 s. The position of the thermocouples is shown in
Figure 8. Based on the temperature of the cells, from colder to hotter cells, the number of the thermocouples was set to be more apparent from colder to hotter points in the graphical temperature evolution curves. The expected results would be colder temperatures for the T1 to T4 thermocouples and hotter temperatures for the T5 to T8 thermocouples. The experimental results are explained in the next section.
3.3. Experimental Results
The experimental results have two parts: electrical results and thermal results. The electrical part explains the results of the extracted parameters for the electrical model.
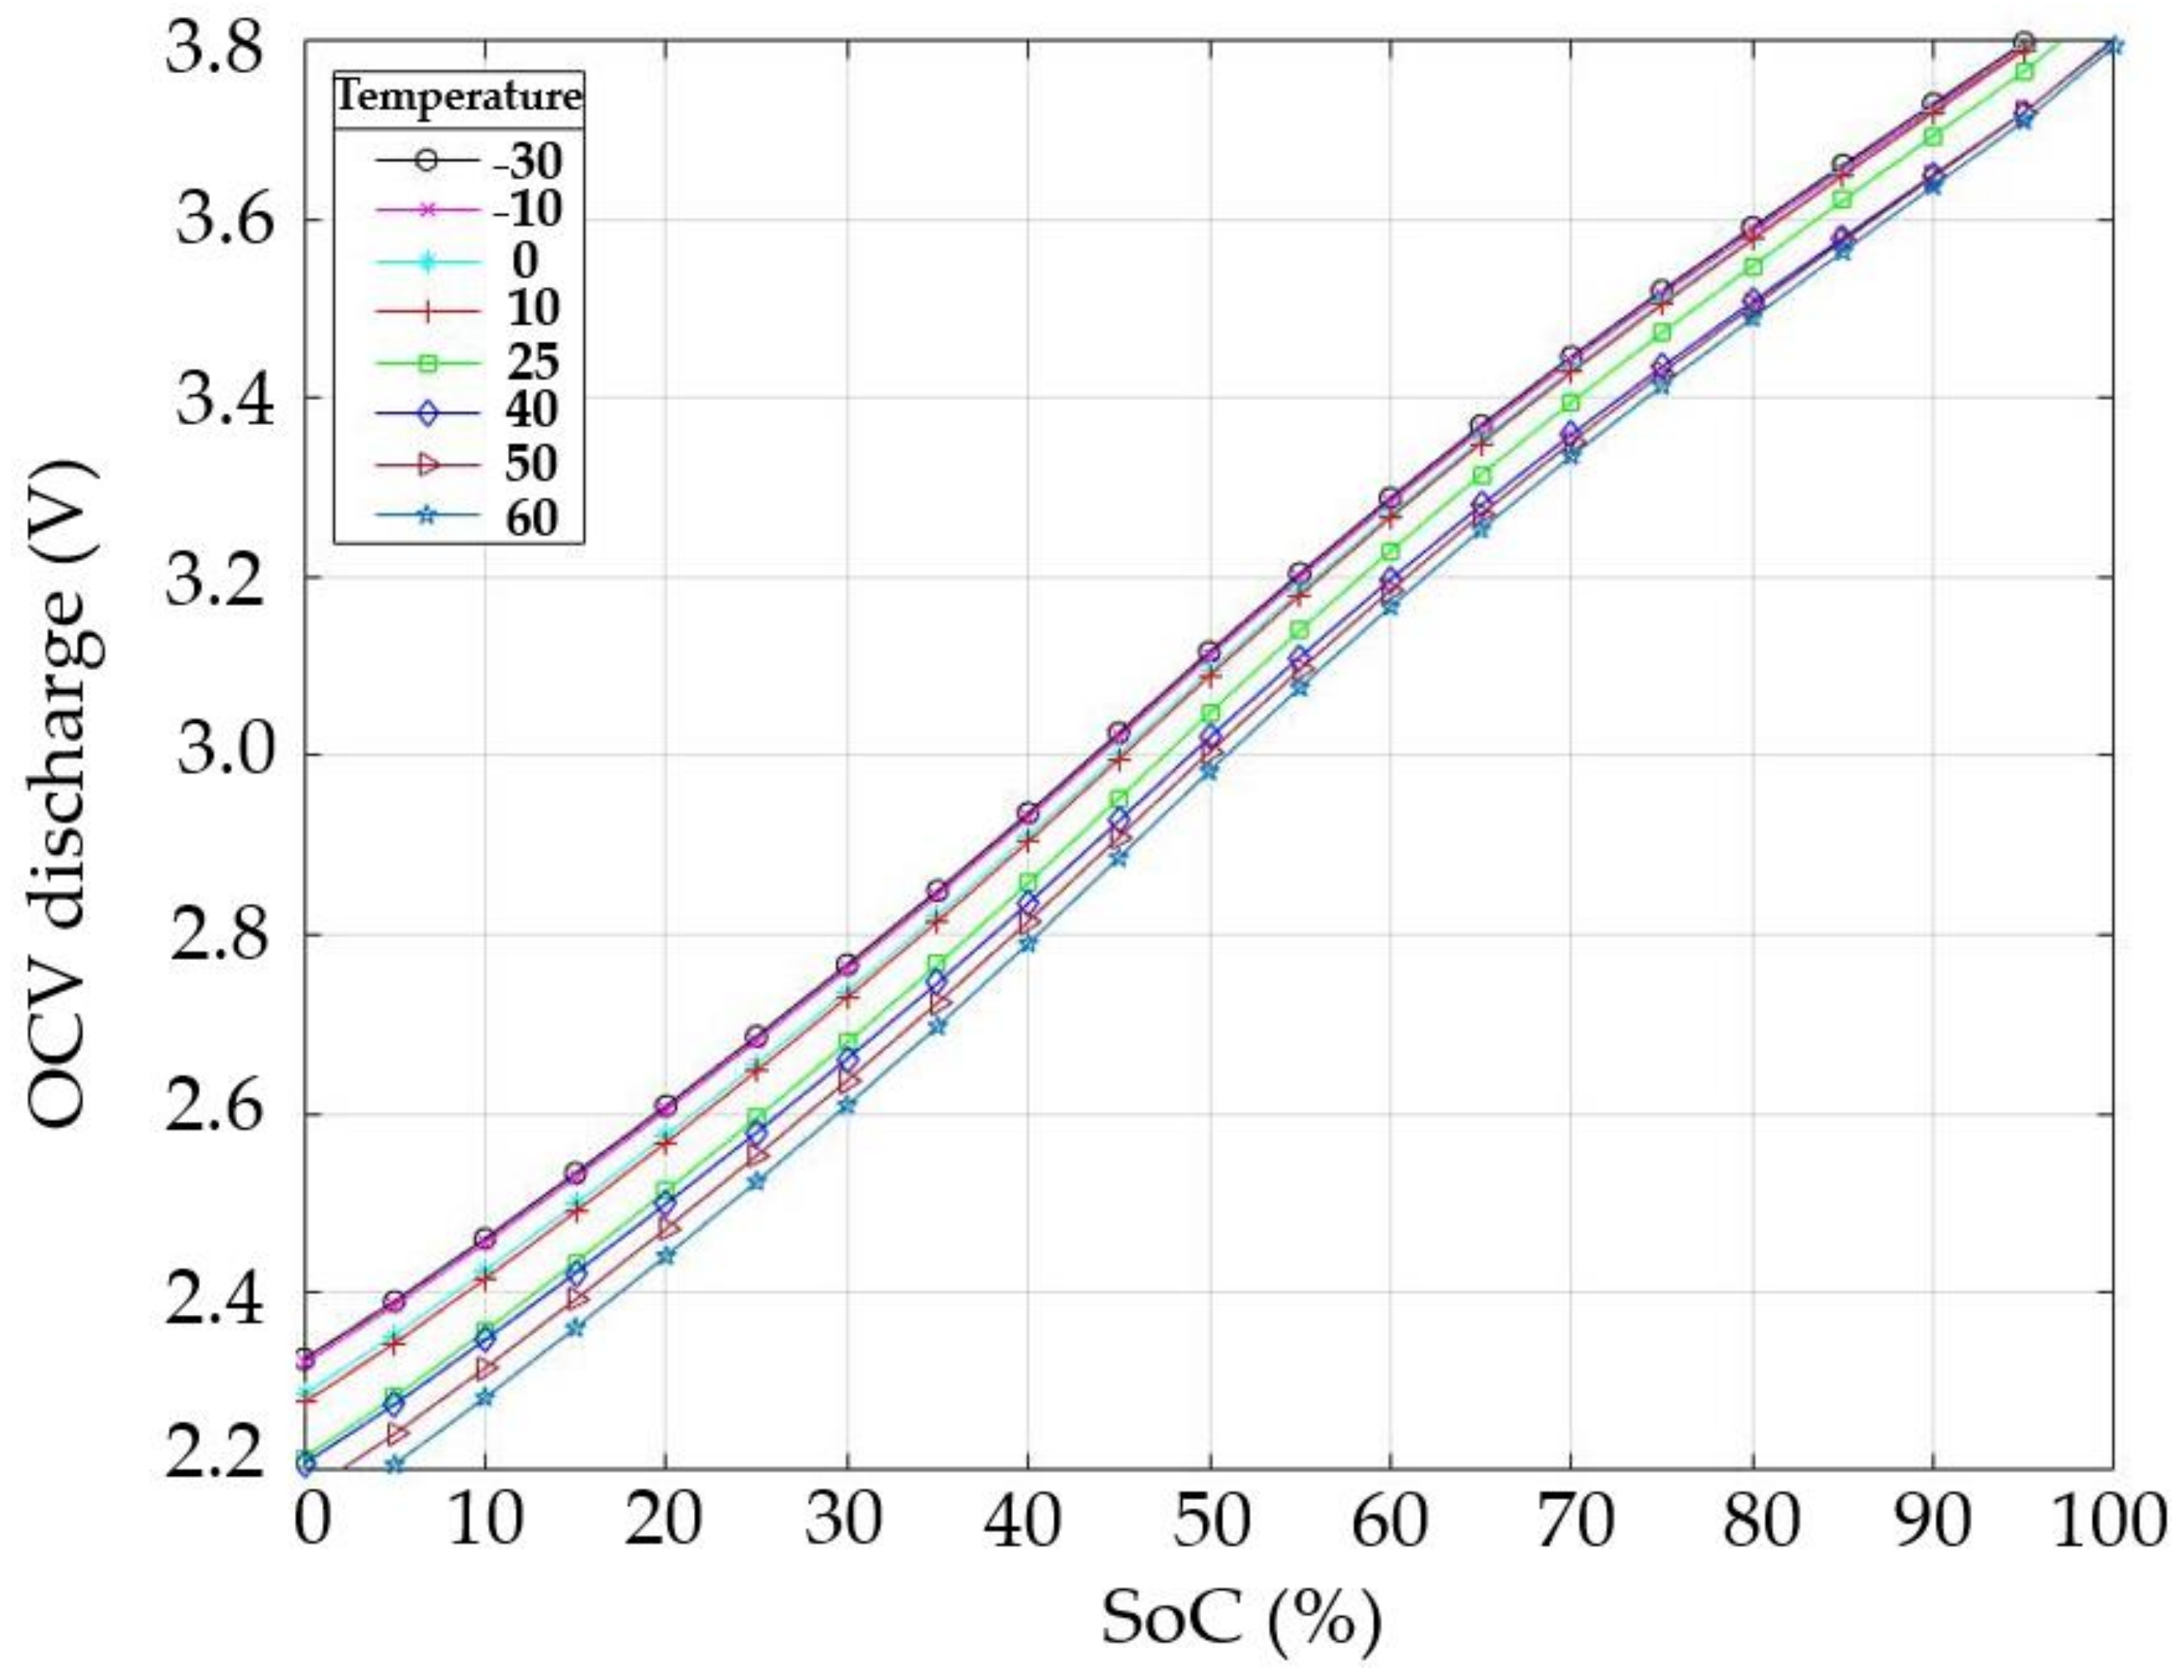
Figure 9 shows the open circuit voltage of the LiC versus SoC for the discharging of the cell at a 10 A current rate.
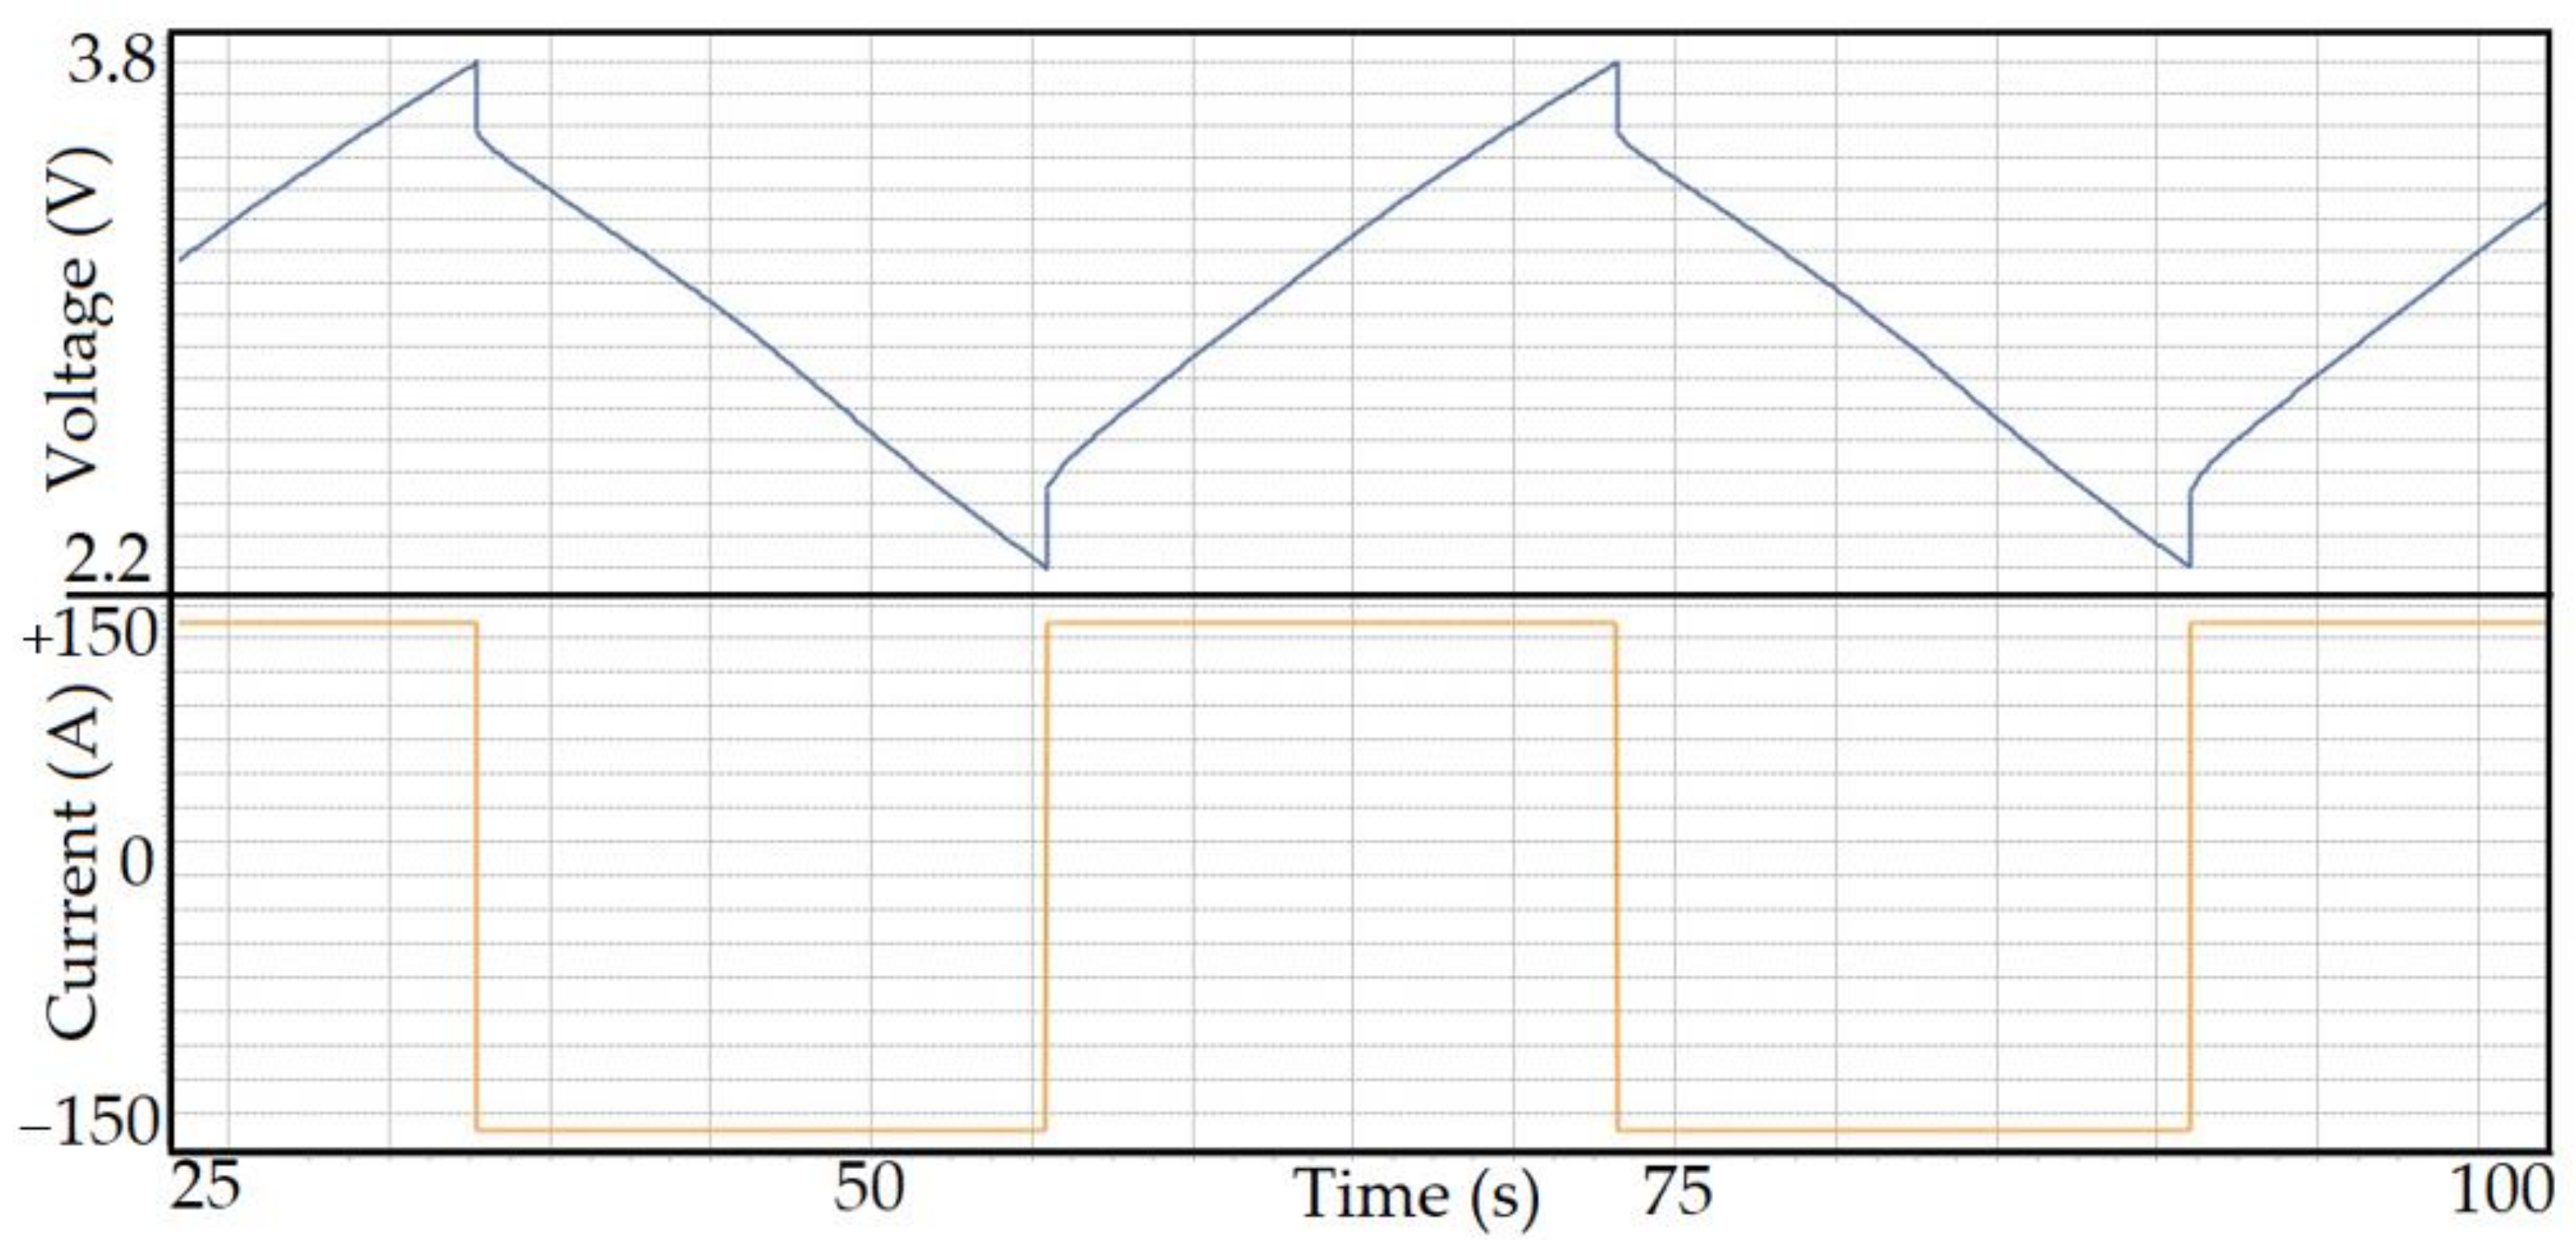
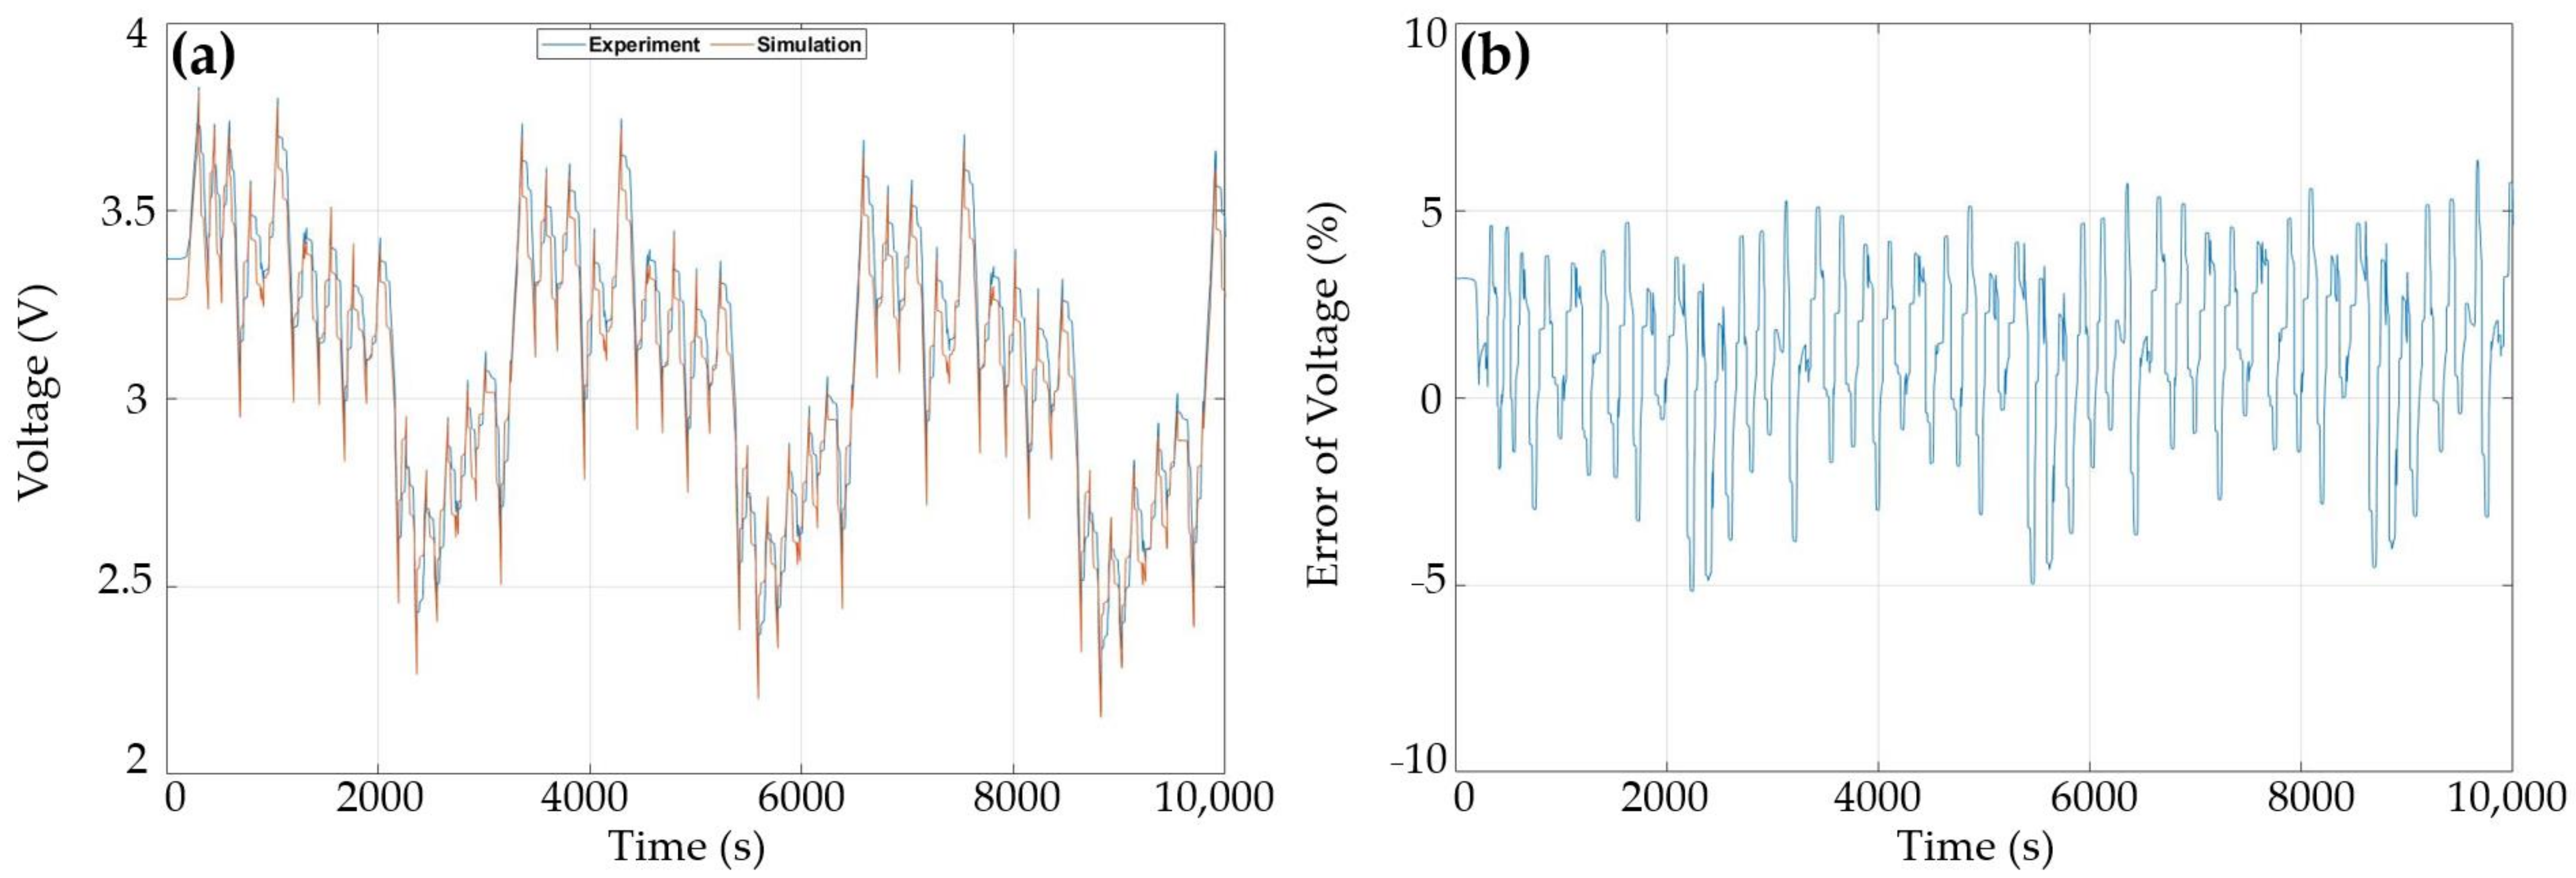
Figure 10 demonstrates the validation of the electrical model regarding the extracted parameters within a heavy-duty driving profile with high current rates. The voltage simulation results are compared with the experiments in
Figure 10a, which shows ±5% and ±3% for current rates higher than 100 A and lower than 100 A, respectively, as is seen in
Figure 10b.
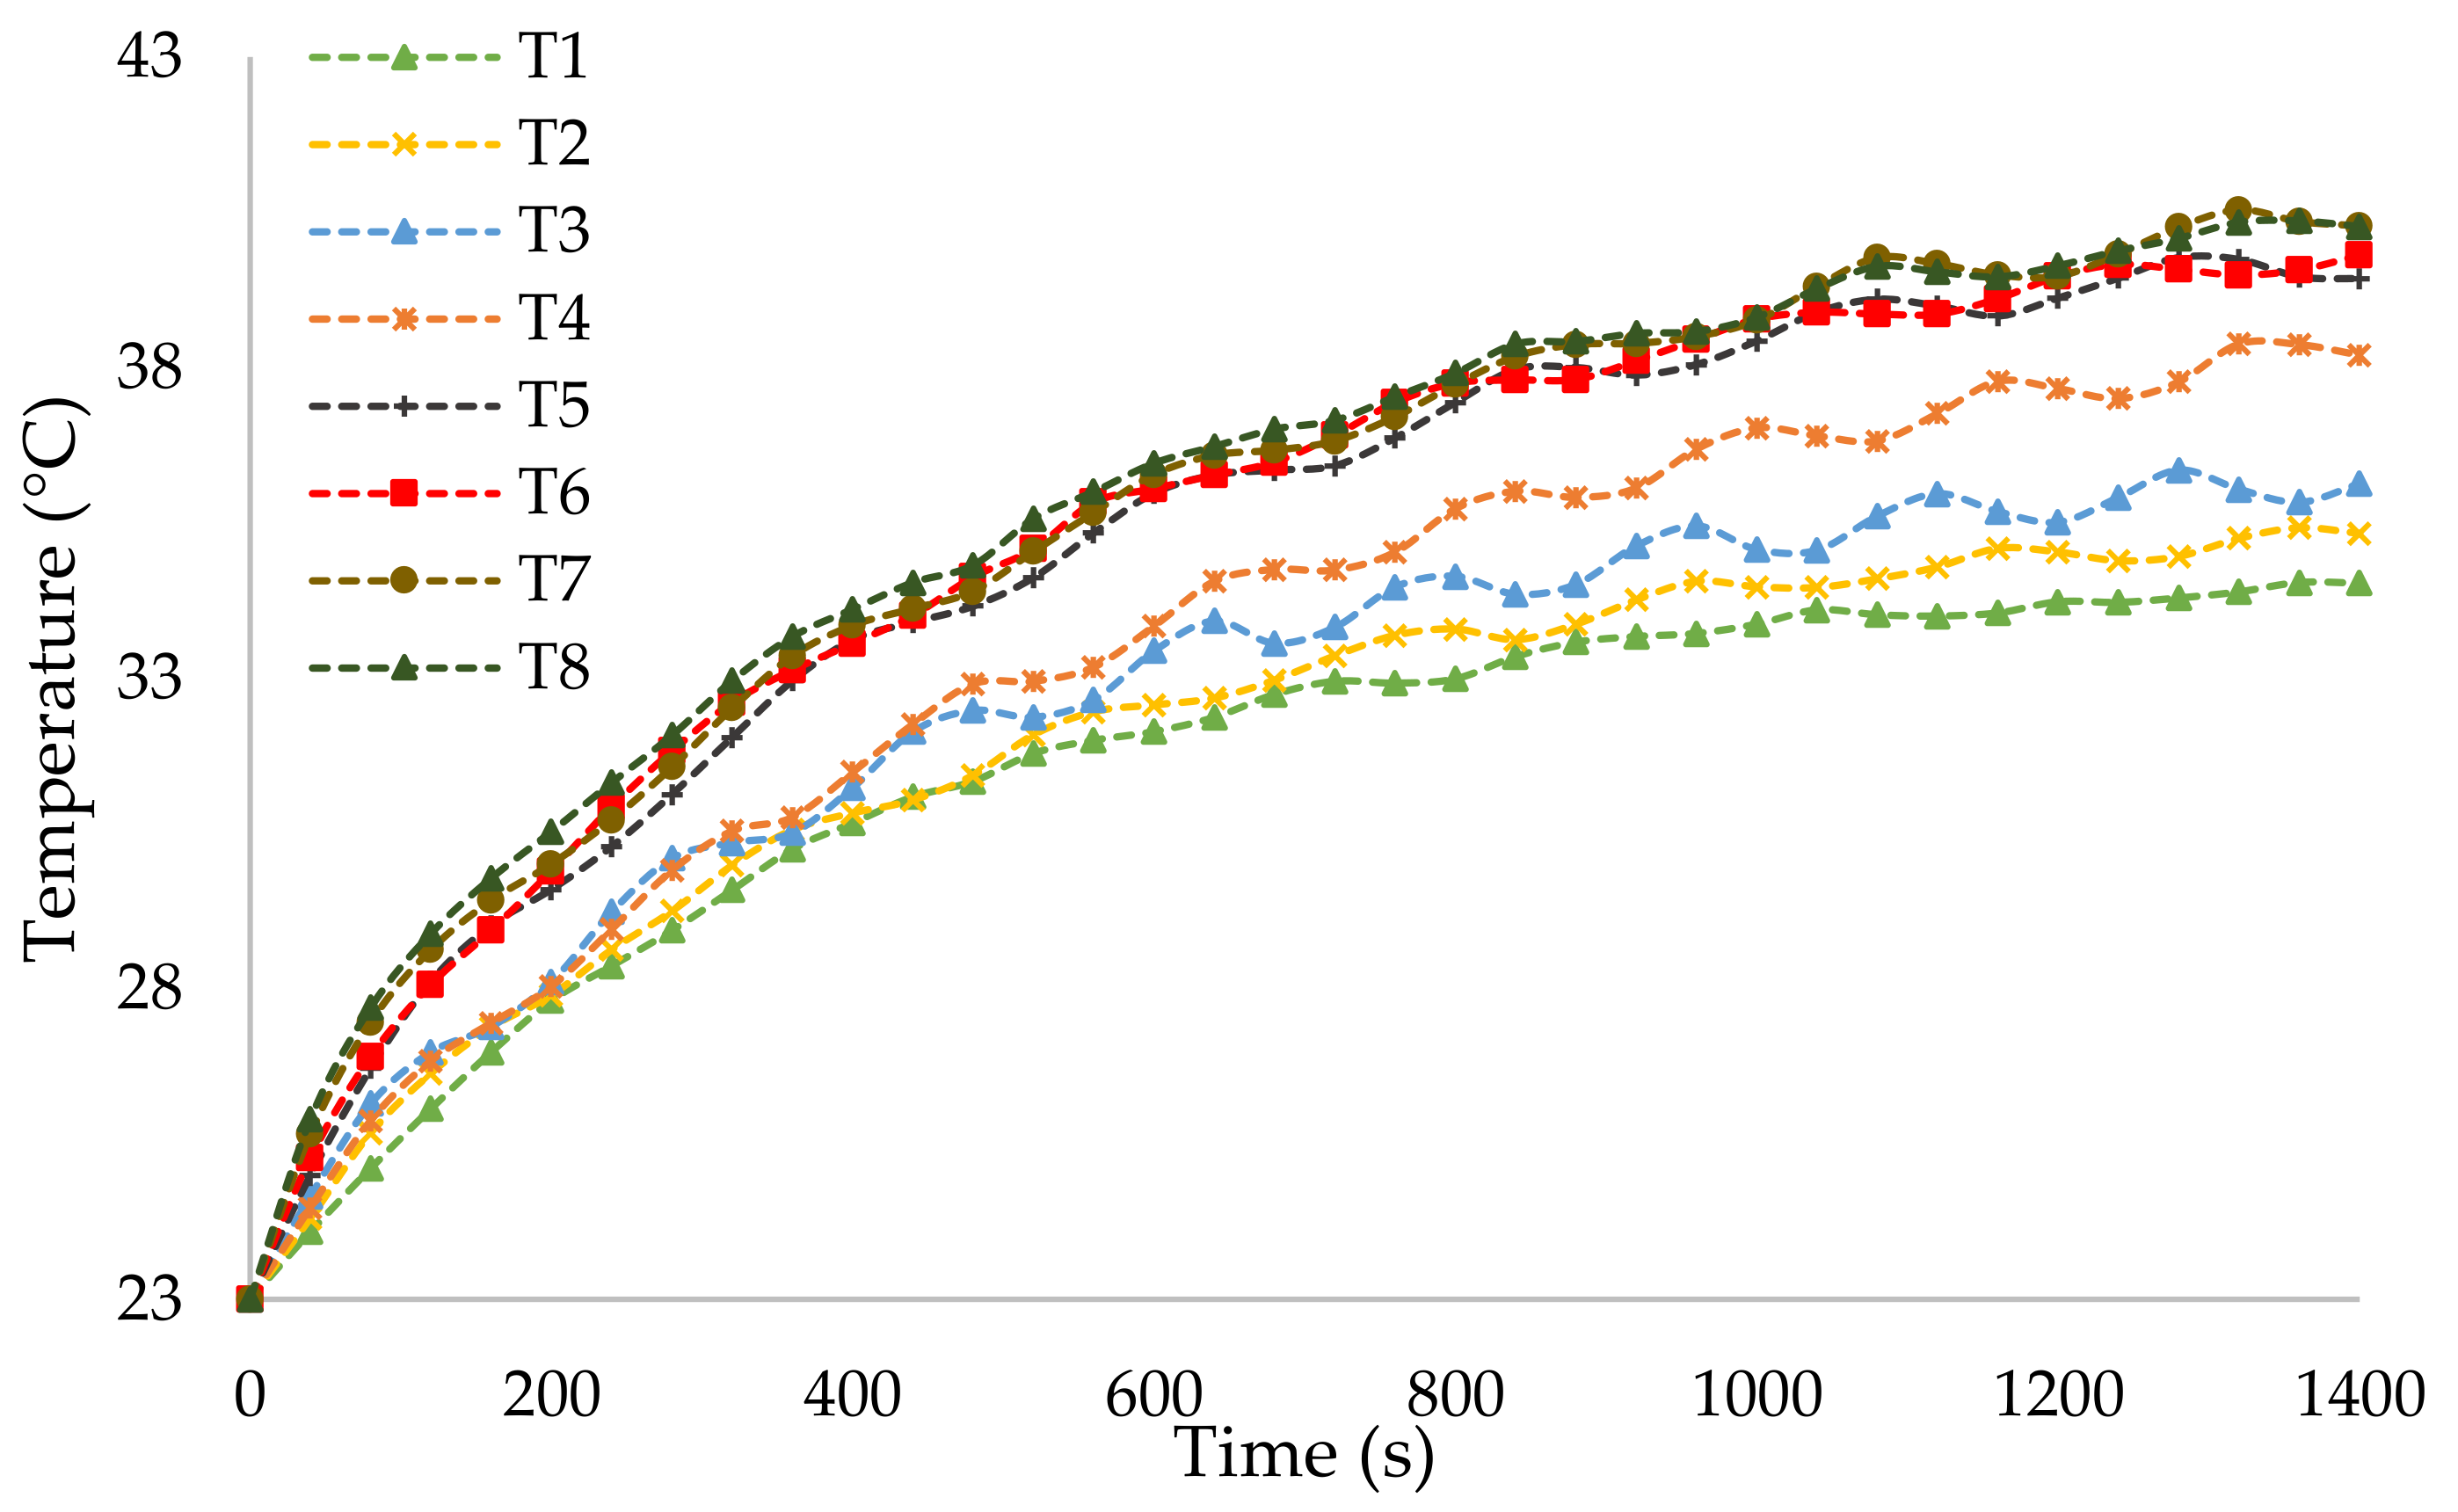
The experiments for thermal studies were conducted under the 150 A current profile for the LiC module when using LCTMS as the proposed cooling system. Before using the LCTMS, the thermal performance of the module without any cooling system under natural convection (NC) was evaluated. In this case, the maximum temperature of the module under NC is around 70 °C, which is much higher than the safe operating temperature of 40 °C announced by the manufacturer (JSR company). Therefore, an adequate cooling regime should be applied to the system to control its temperature. The temperature evolution of the module for all the thermocouples is depicted in
Figure 11, in which the expected explained temperature rise for the cells within the module is proven. As is observed, the T1, T2, and T3 thermocouples are mounted on the top surface of the cell at the beginning of the module, where the coolant air is still cold. Therefore, their temperature rise is lower than that of the other cells. The T4 thermocouple relates to cell number 12, which is the last cell, and there are no cells after this cell. Therefore, T4 is exposed to the environment from one side, causing this cell to be colder than the other cells in the middle of the module. The T5, T6, T7, and T8 thermocouples relate to the cells in the middle, so from one side, their heat sources are generating heat, and from another side, the conduction effect is the dominant phenomenon between two adjacent cells. Thus, the middle cells to the last cell are much higher than the rest of the module (the first five cells).
5. Conclusions
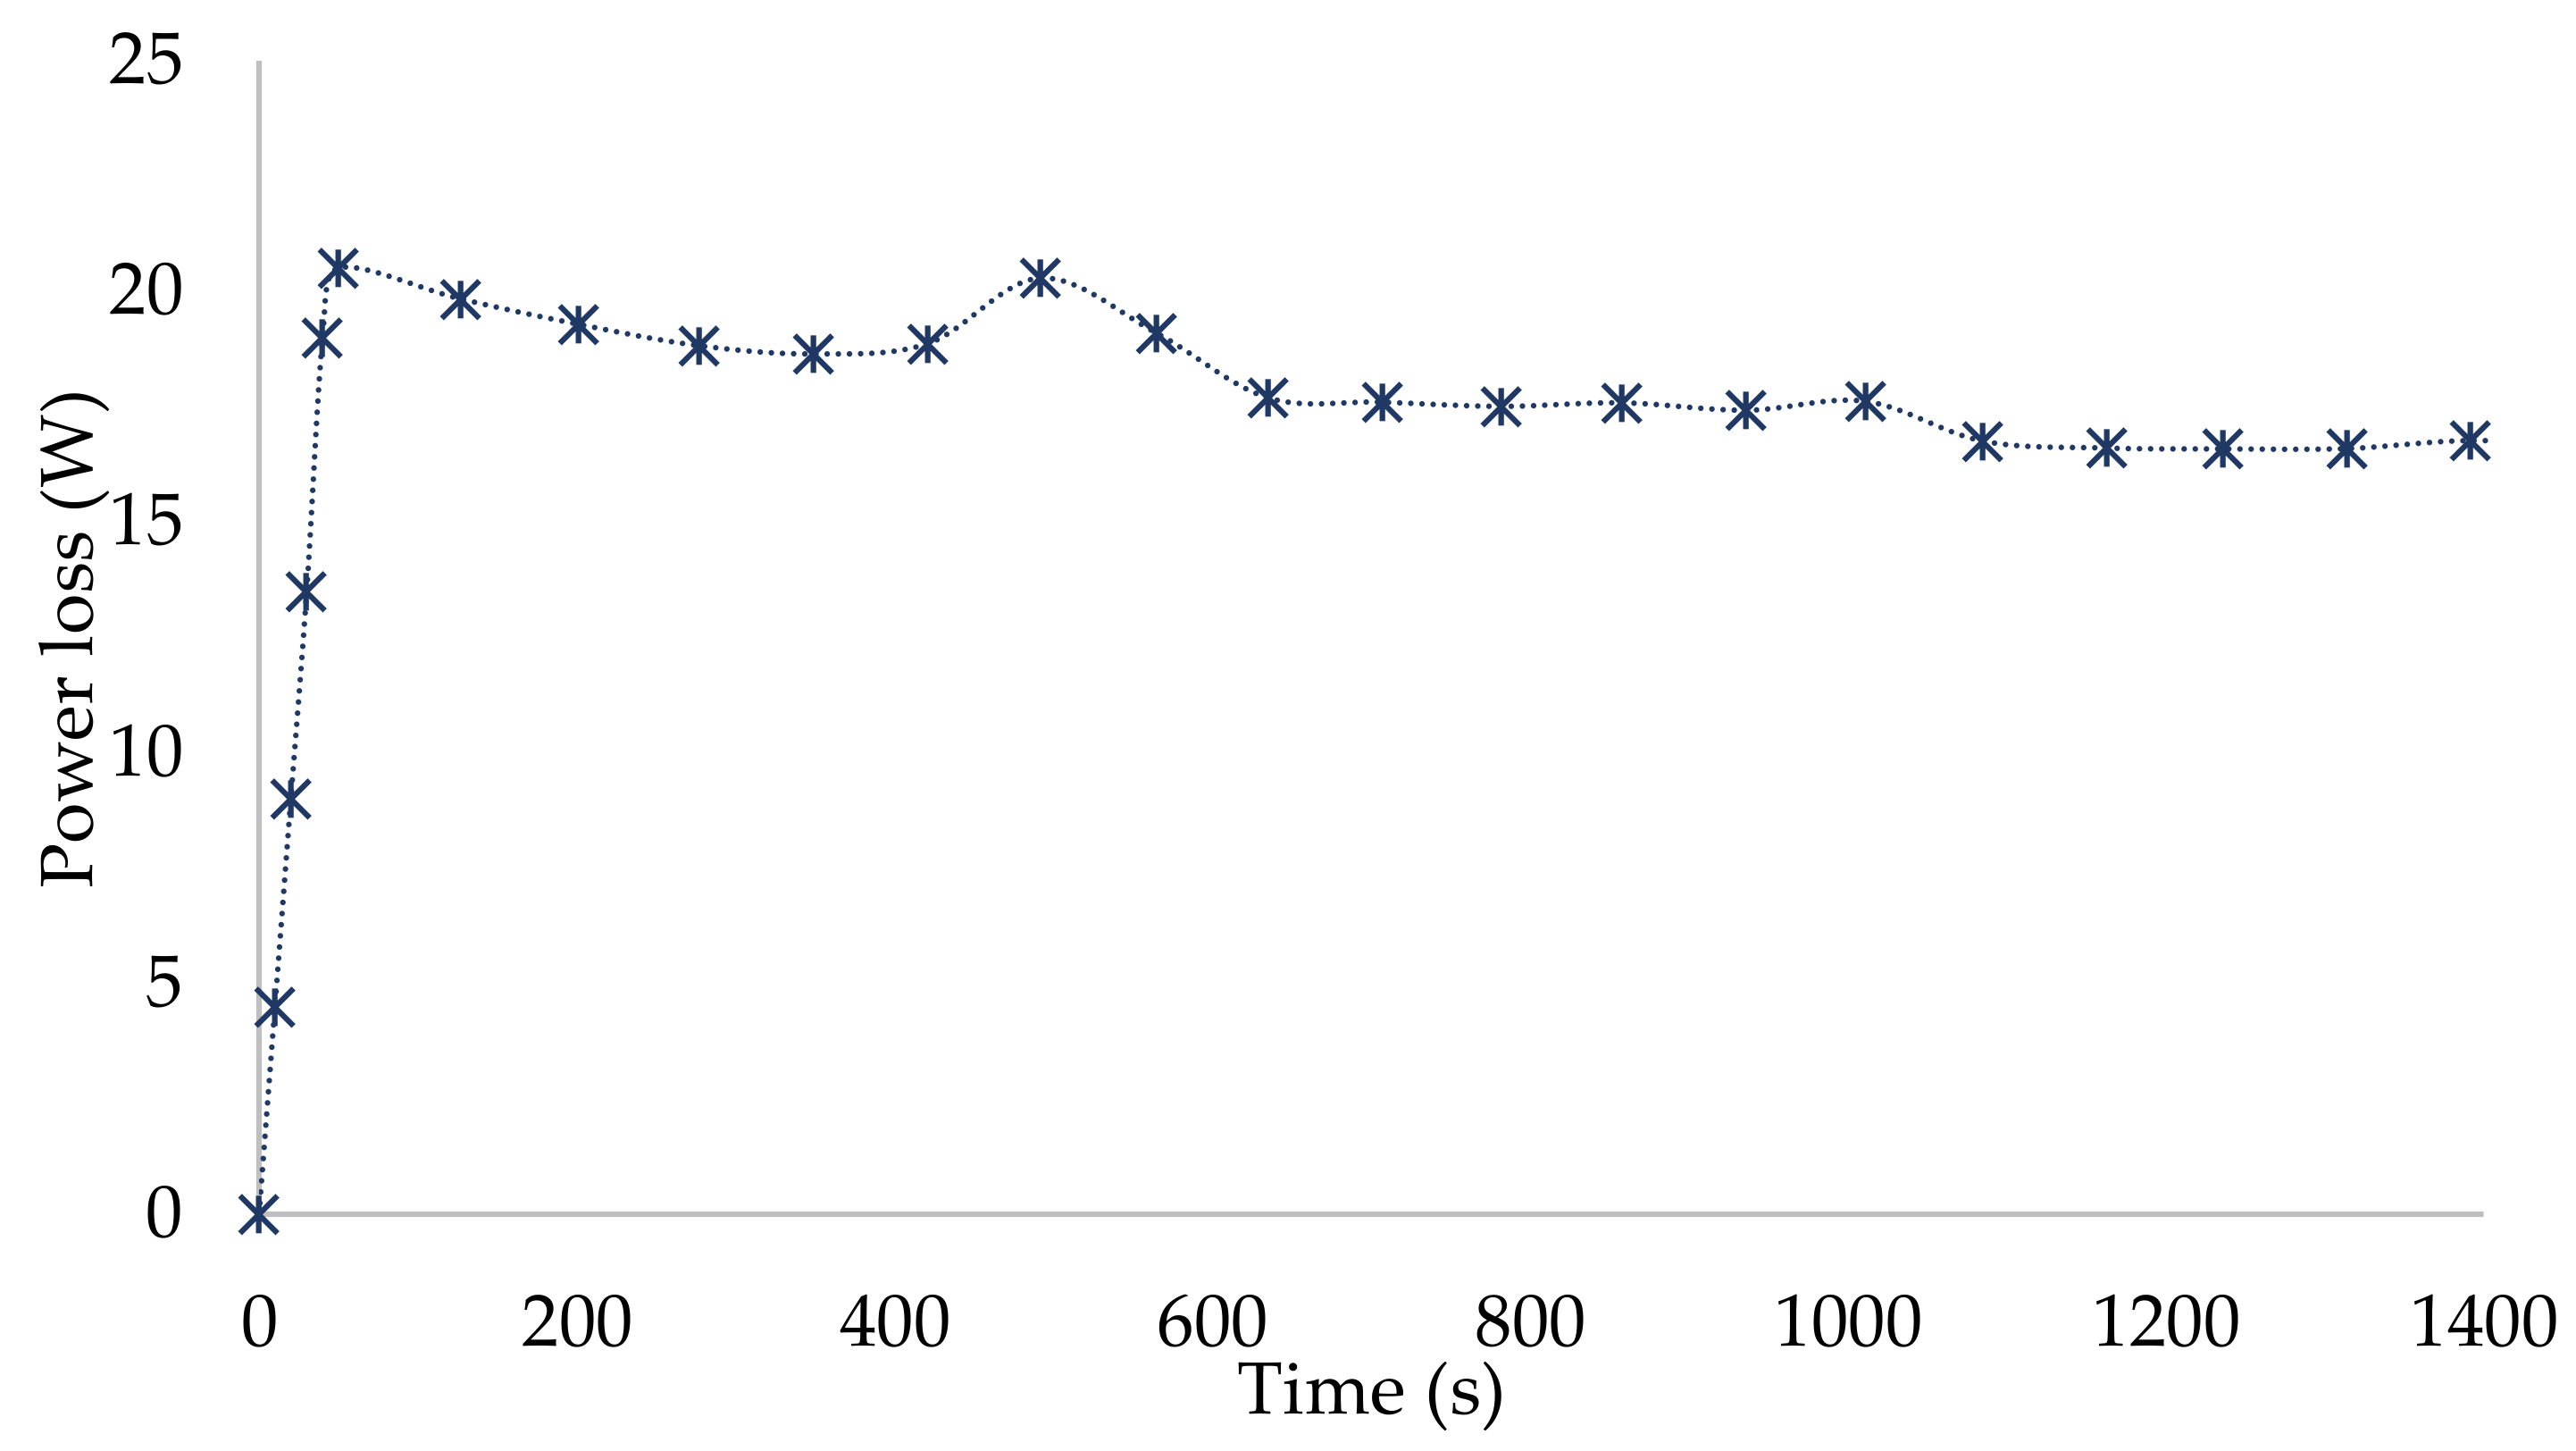
In the present article, a module of 12 LiCs was used to evaluate a liquid-cooled thermal management system (LCTMS). Prior to testing the module, predicting the electrical parameters is of high importance since the extracted electrical and thermal parameters can lead to predicting the heat loss with high precision. Therefore, a 1D electro-thermal model was developed from −30 °C to +60 °C. Moreover, high current rates were applied, including 0.1 A to 500 A as a loading profile. The open-circuit voltage, the resistances and capacitance of the cell, and thermal parameters were extracted in this regard. The voltage error was ±5% and ±3% for current rates higher than 100 A and lower than 100 A, respectively. Then, the 3D thermal model evaluation was performed experimentally and optimized numerically, thanks to the extracted parameters from the electro-thermal model. The effects of the inlet coolant flow rate, inlet coolant temperature, inlet and outlet positions, and the number of arcs were examined. The cycling profile consisted of a 1400 s continuous 150 A current rate without a rest period. The conclusions can be drawn as follows:
In the case of cycling the module under the 150 A current profile, the maximum temperature (Tmax) of the module exceeds 70 °C, which may lead to thermal runaway.
The LCTMS with a 100 mL/min inlet flow rate, 23 °C inlet temperature, and two arcs in the coolant channel (main case study) can control Tmax at 40.3 °C, which shows 42.4% improvement compared to the natural convection. ΔTmax was 9.1 °C, which can be improved.
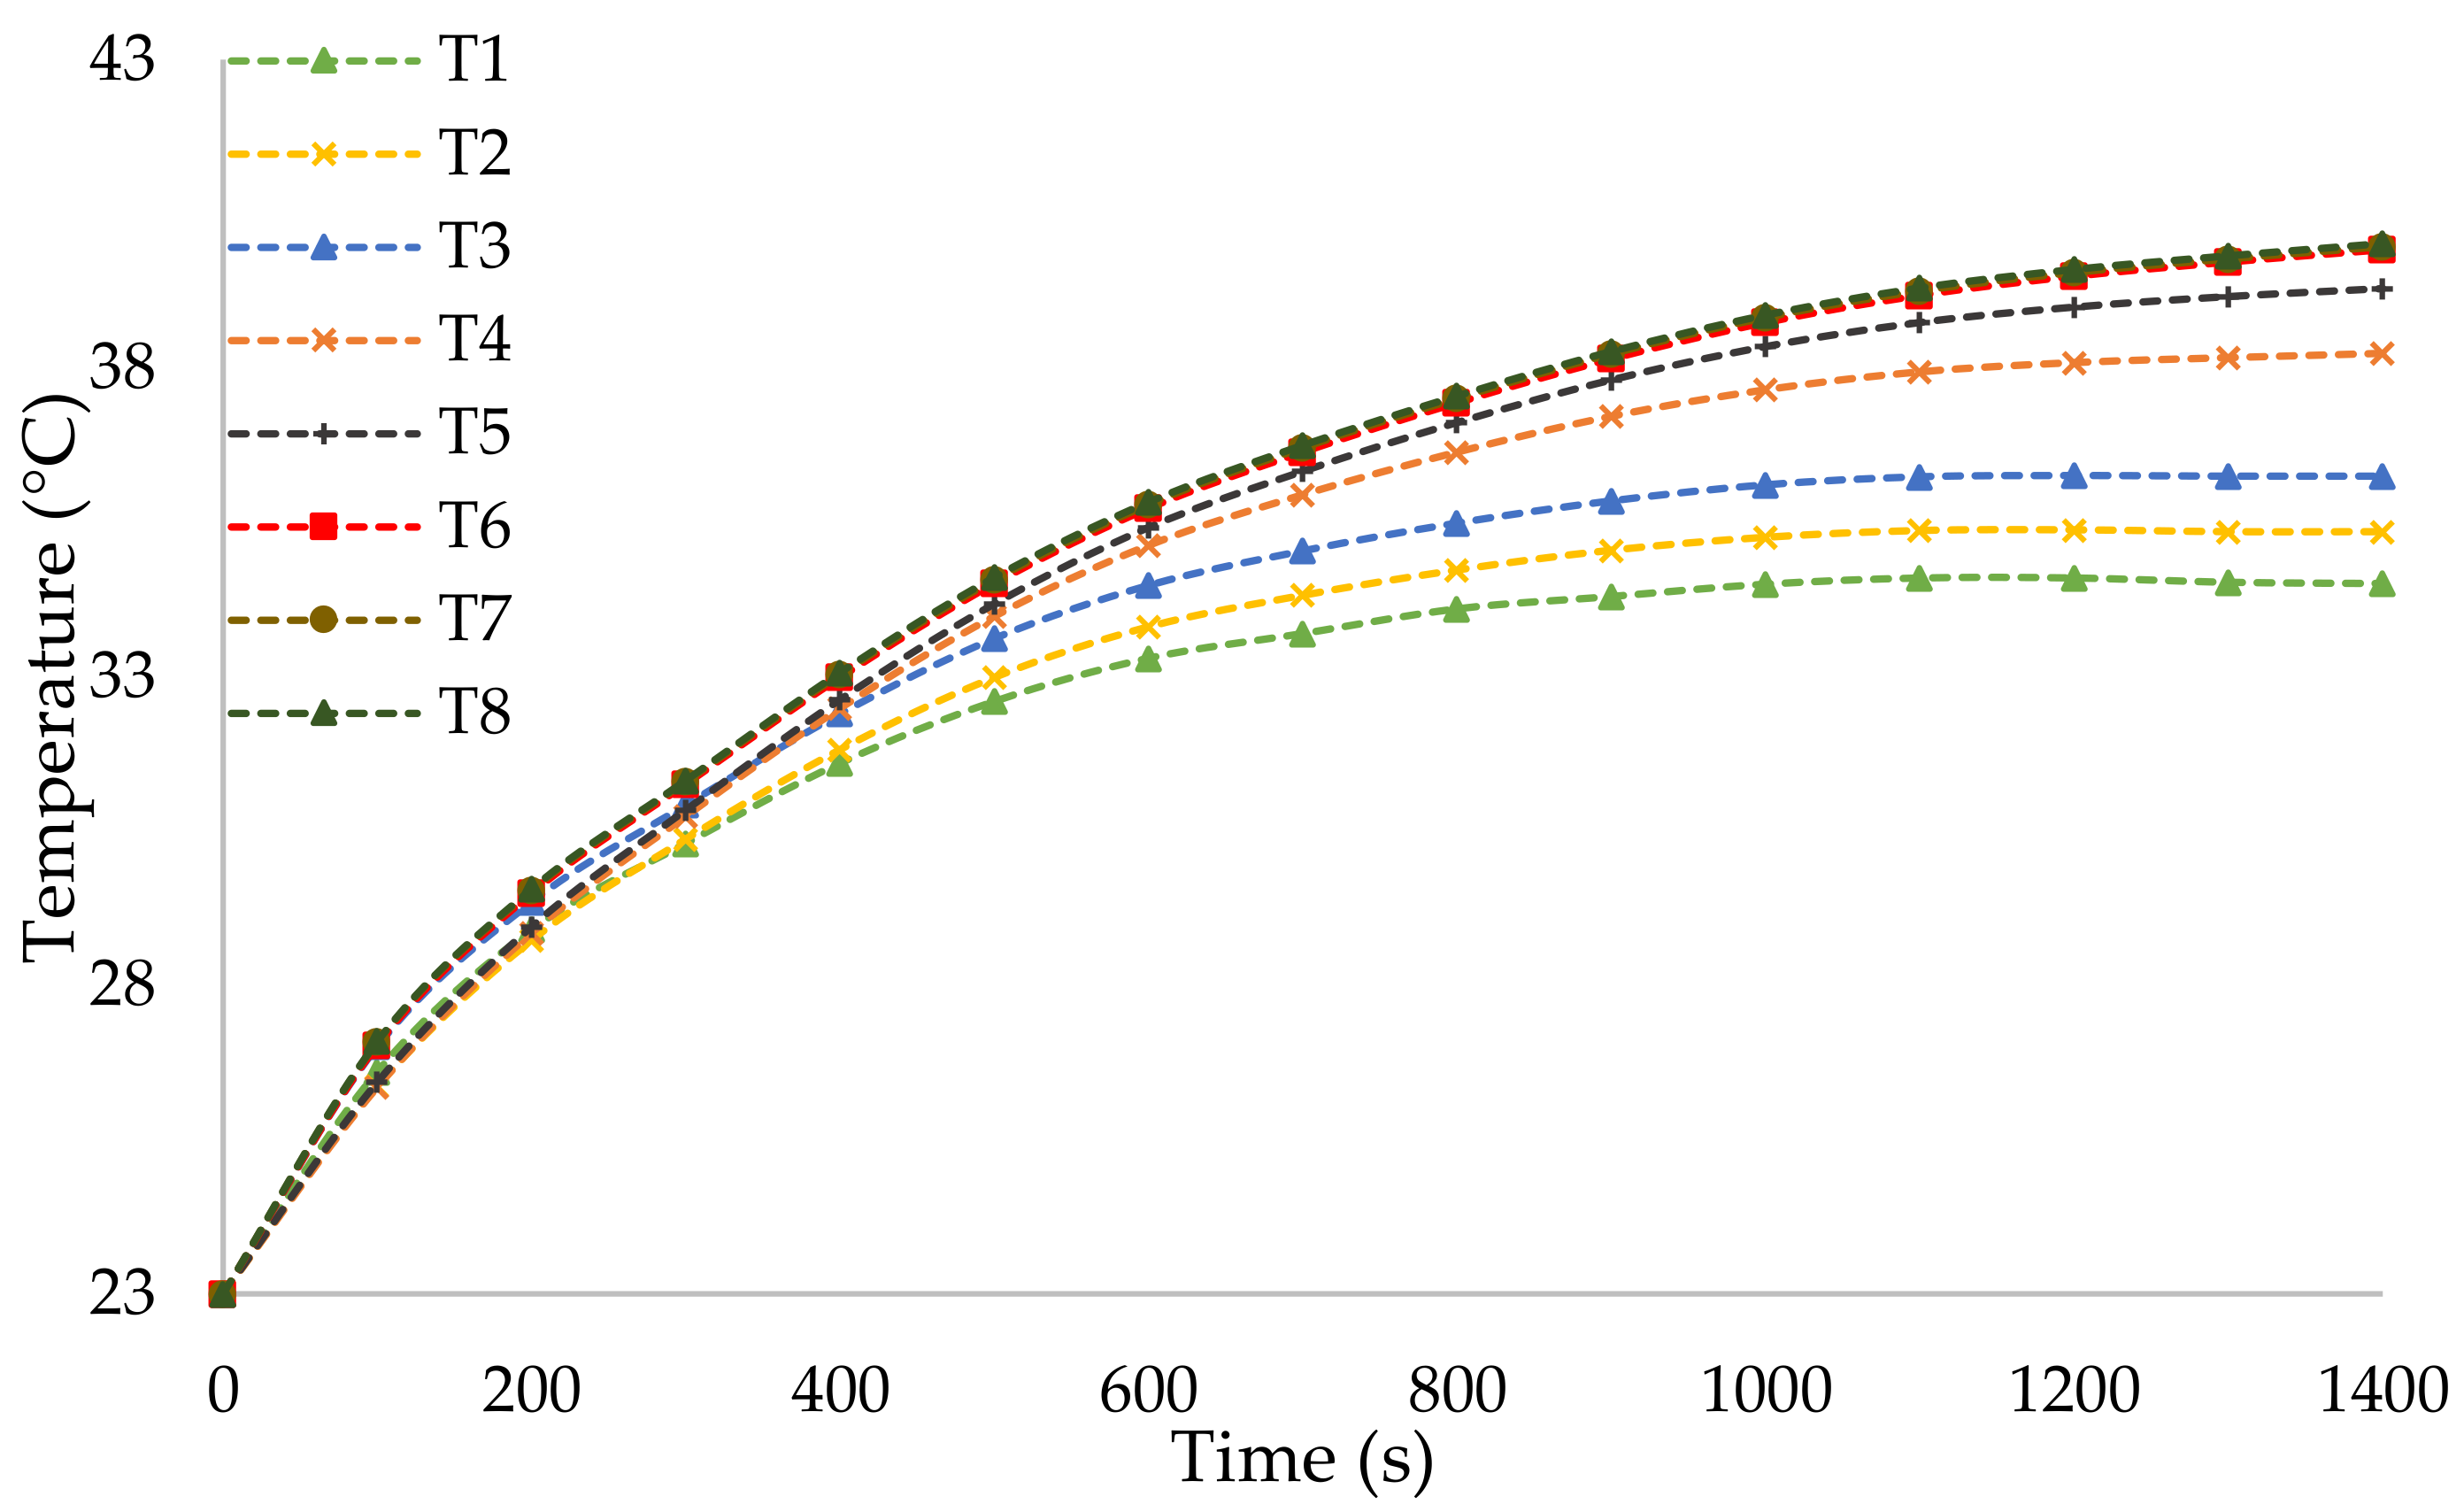
The 1D electro-thermal model extracted the electrical and thermal parameters with high precision, used in the 3D thermal model. The 3D thermal model was validated against the experiments with an error lower than 2%, employed for optimization purposes. The optimization parameters were the inlet coolant flow rate, inlet coolant temperature, inlet and outlet positions, and the number of arcs per coolant channel.
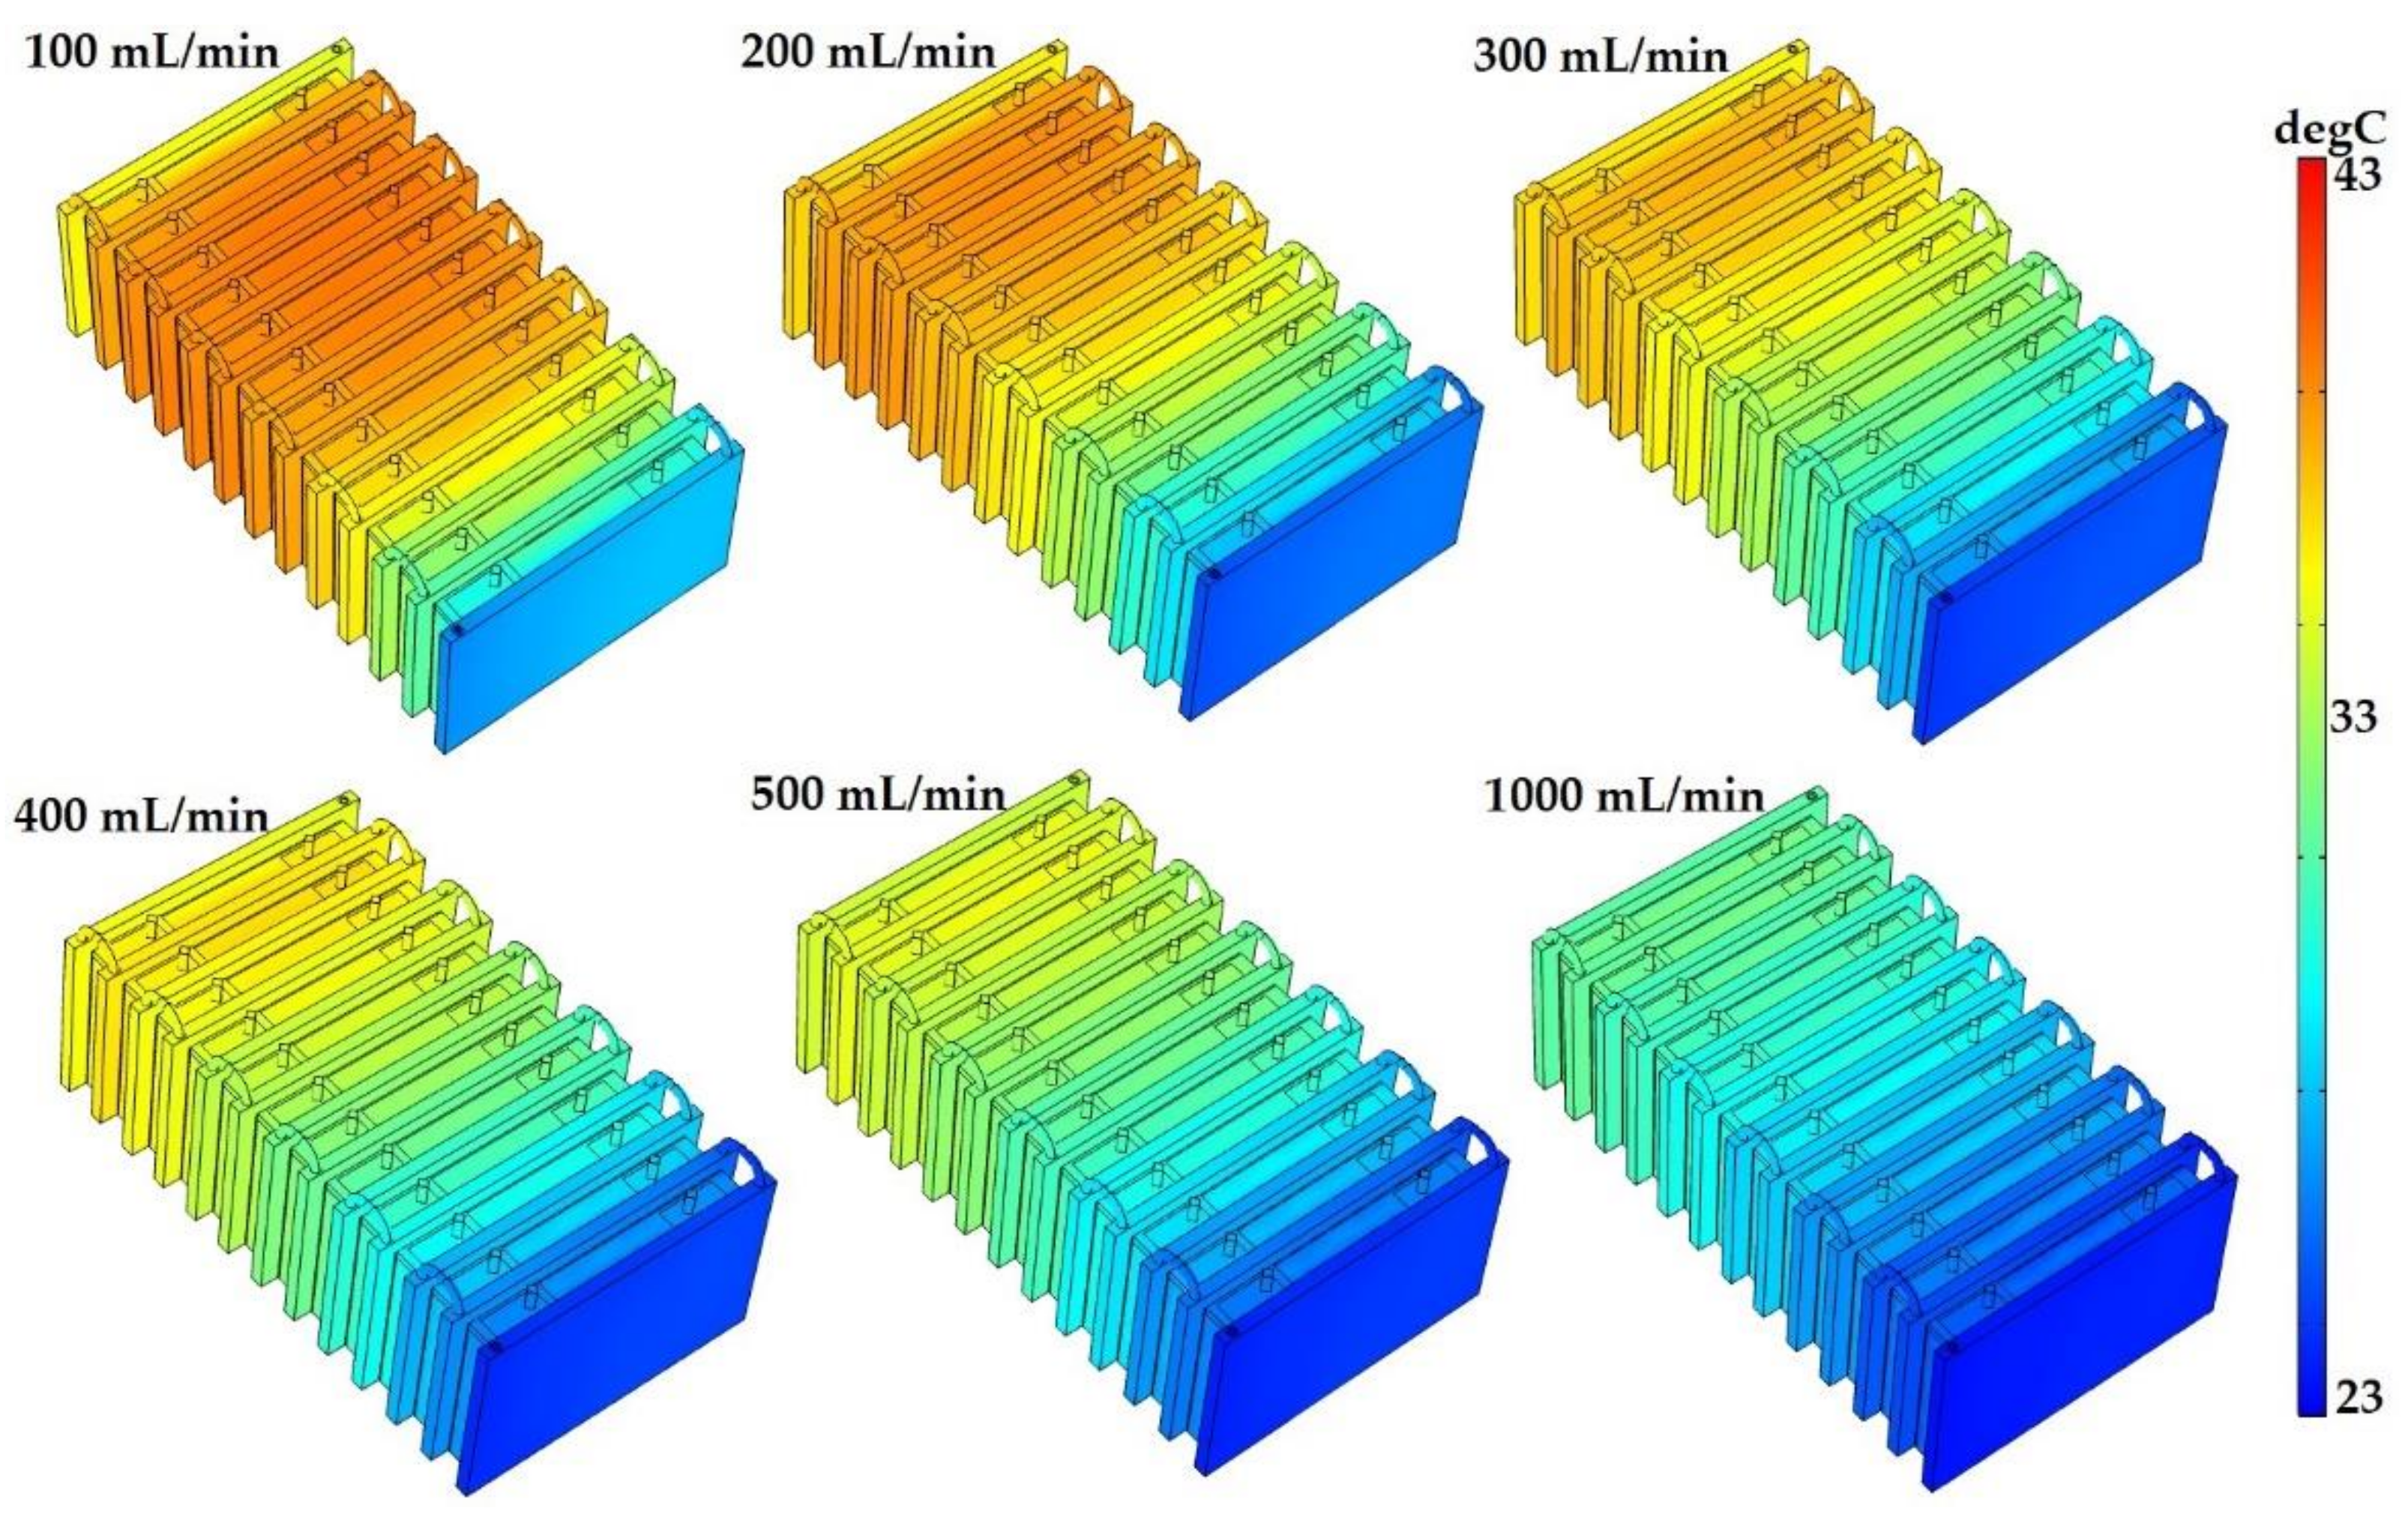
Increasing the inlet flow rate of the coolant from 100 mL/min to 500 mL/min decreased Tmax and ΔTmax by 9.7% and 25.2%, respectively. By increasing the inlet flow rate to 1000 mL/min, these values were 17.6% and 43.9%, showing the importance of the inlet flow rate to minimize Tmax and ΔTmax.
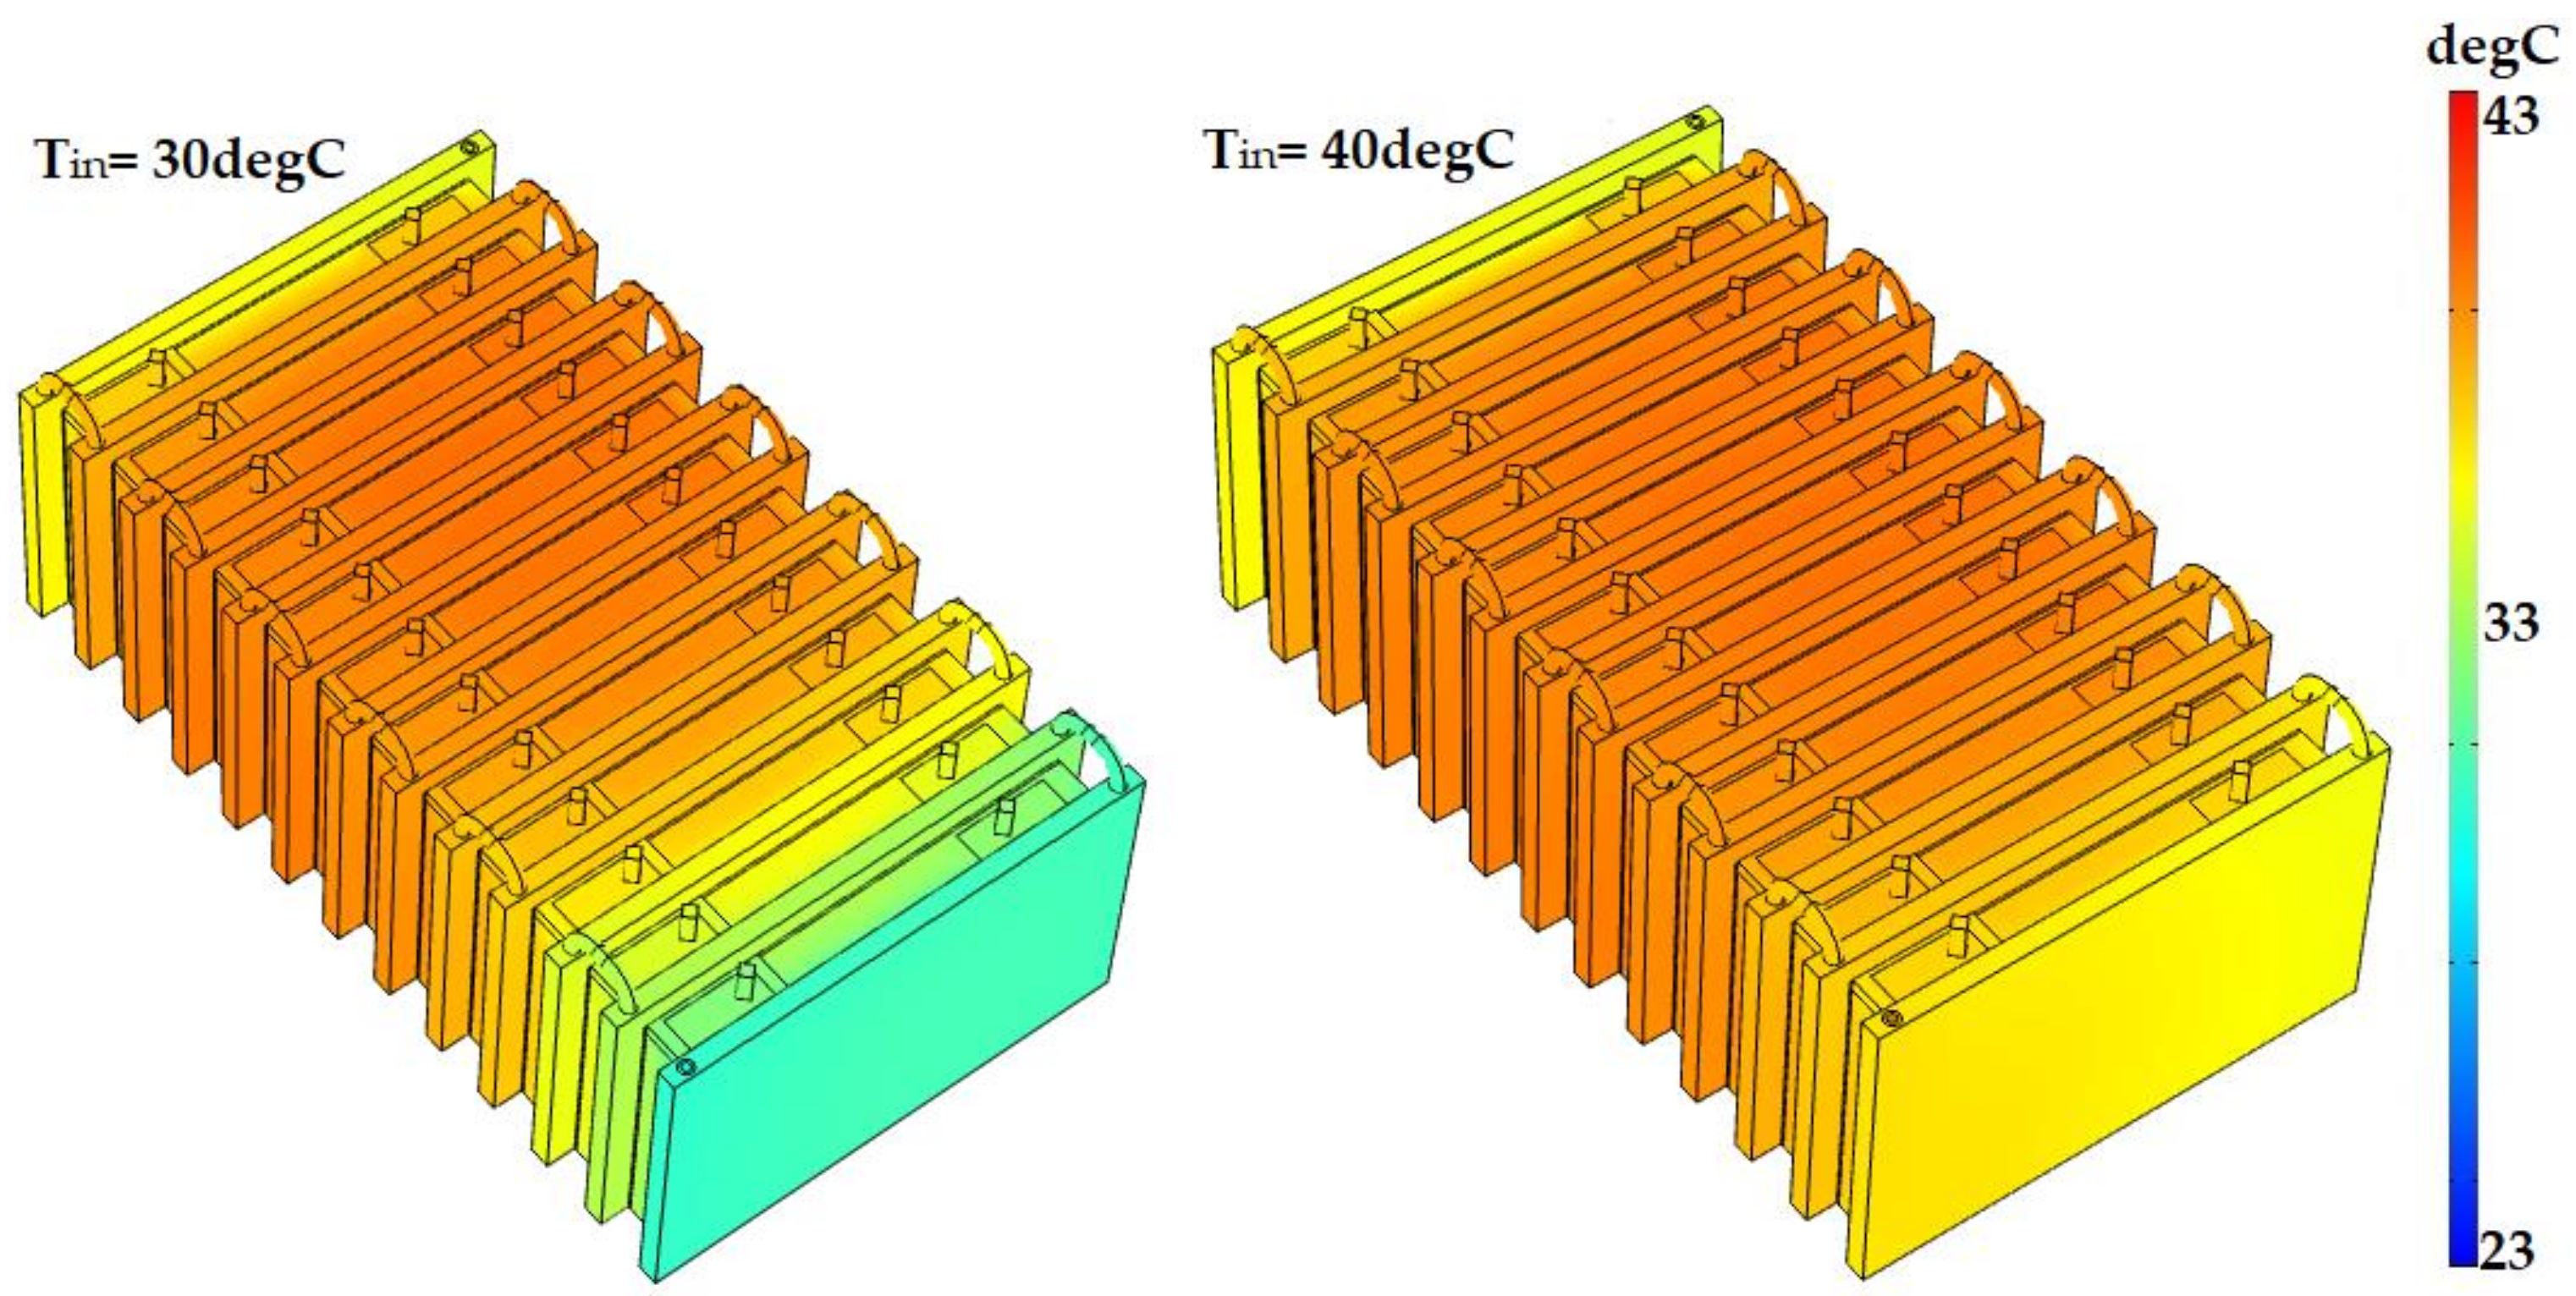
Increasing the inlet temperature did not significantly impact Tmax but was enhanced ΔTmax. By increasing the inlet temperature from 23 °C to 30 °C and 40 °C, ΔTmax was reduced by 57% and 84%, respectively.
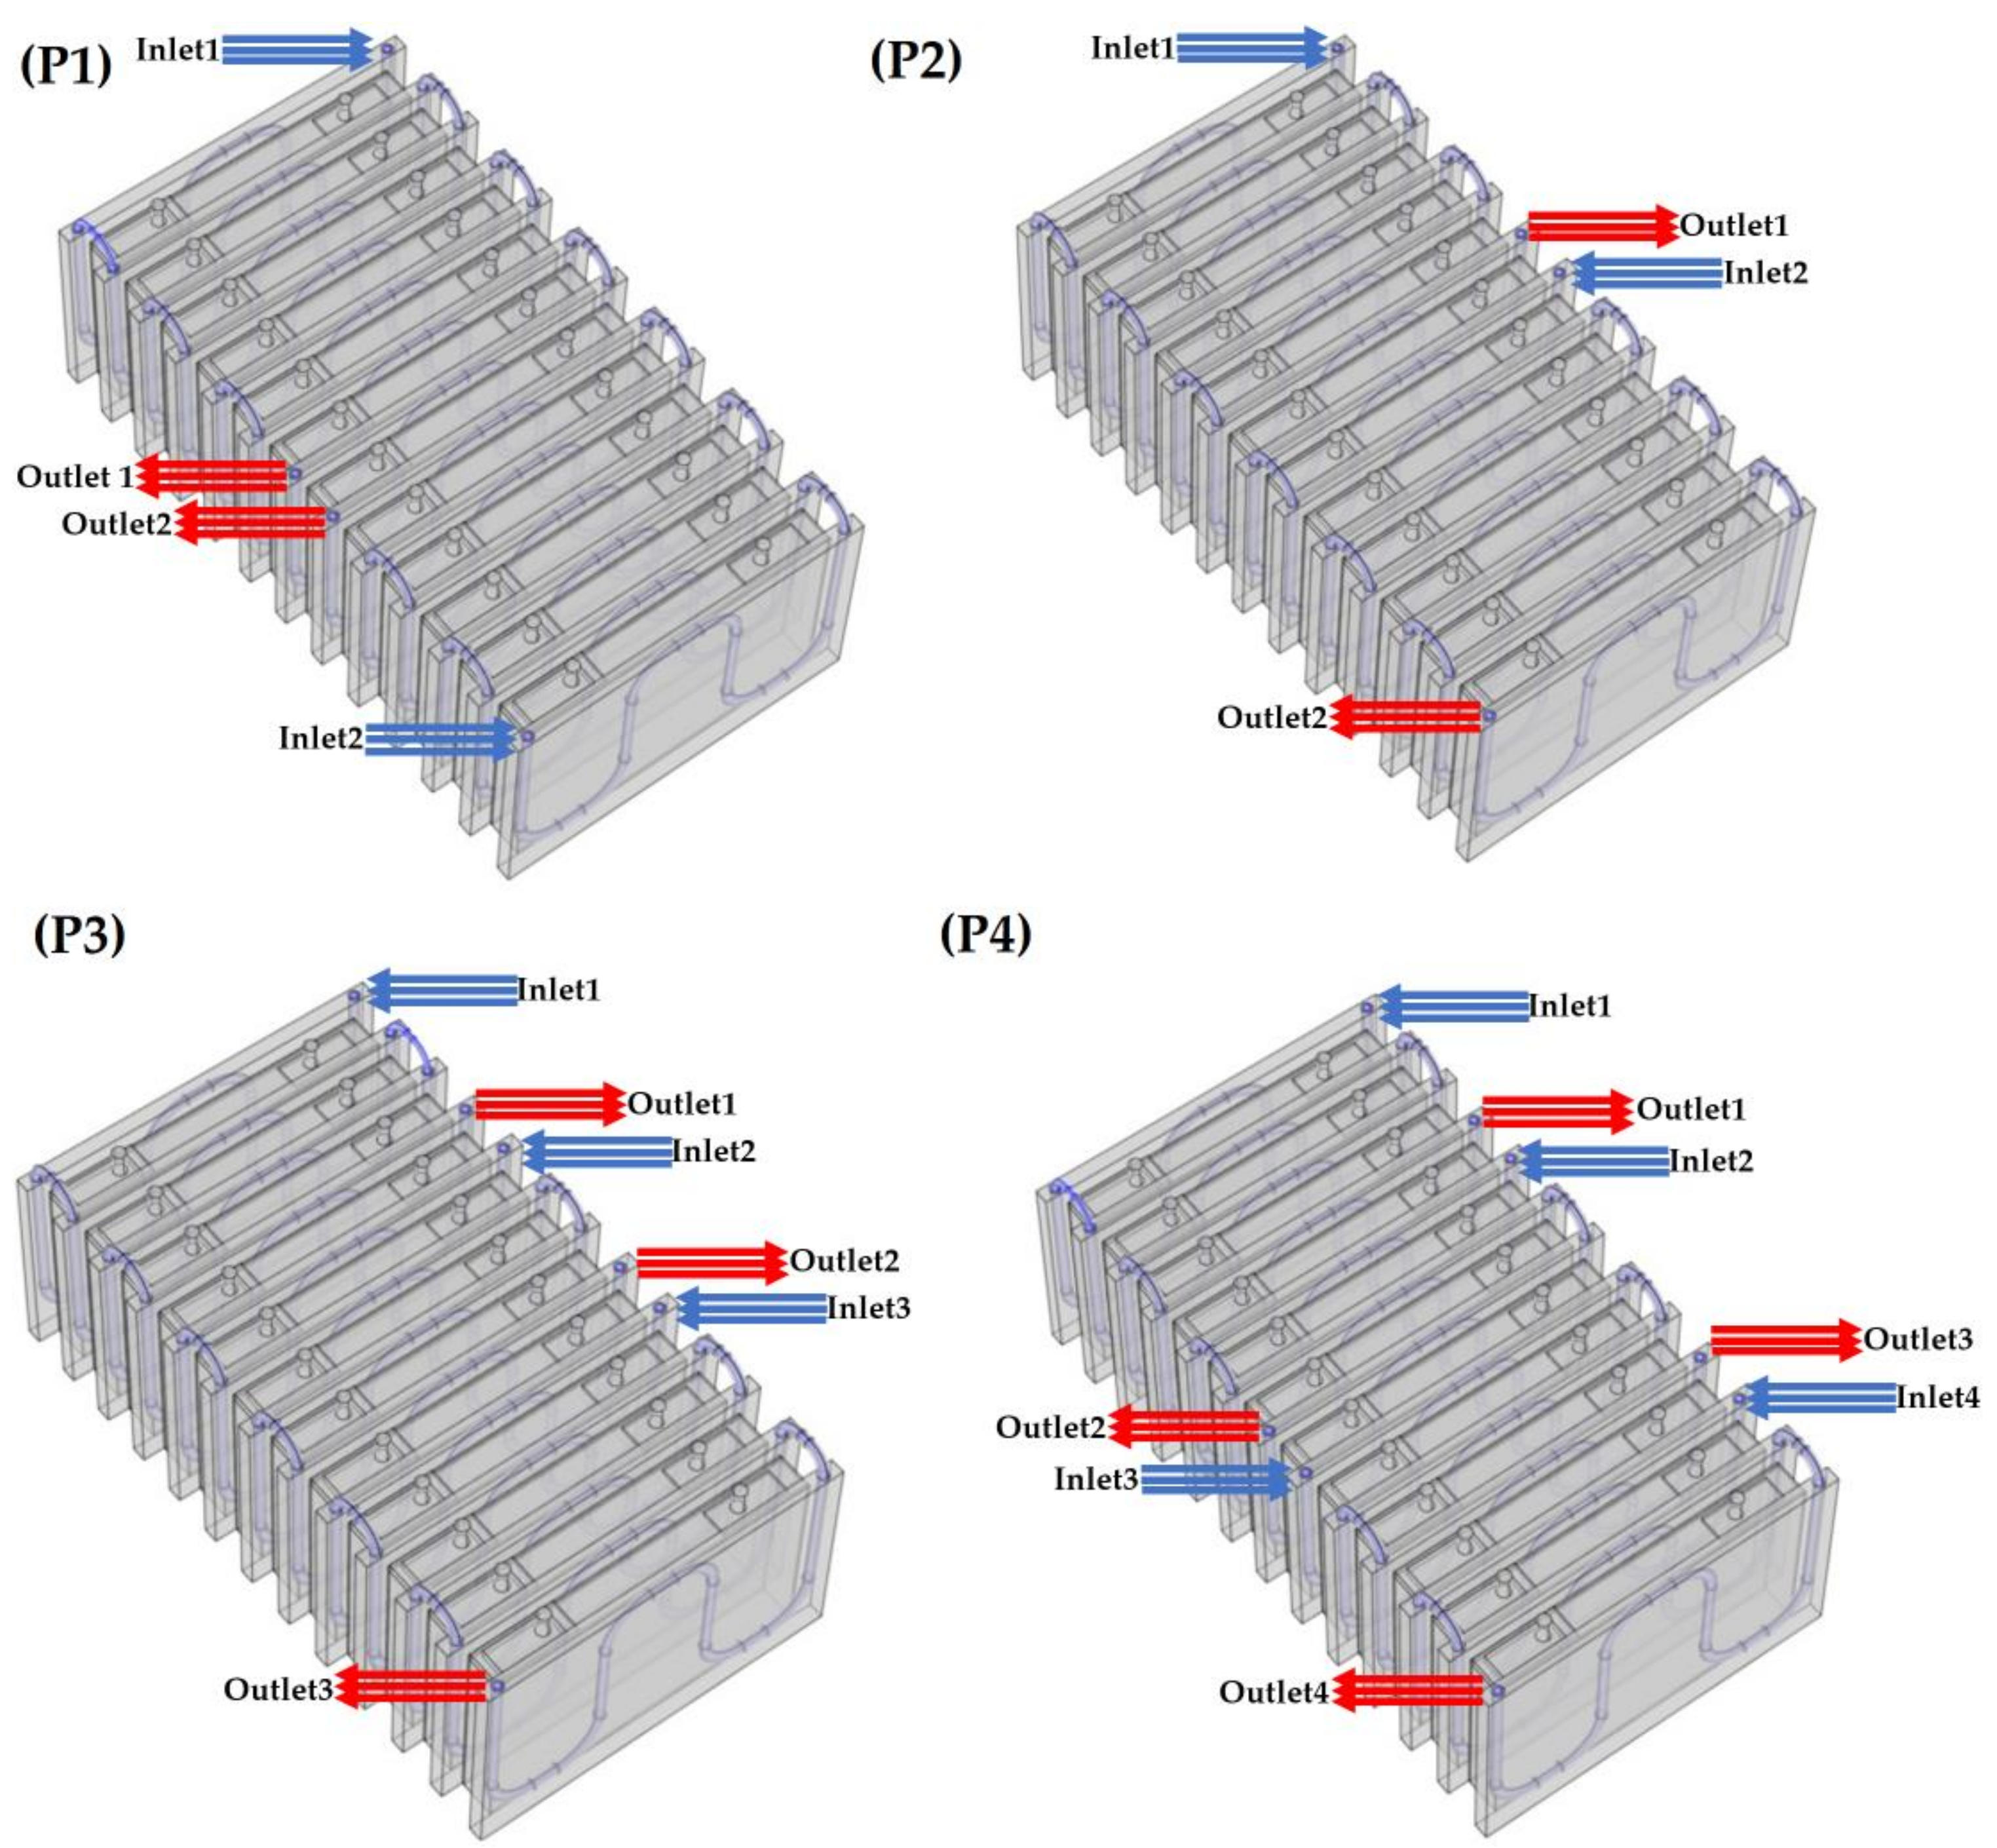
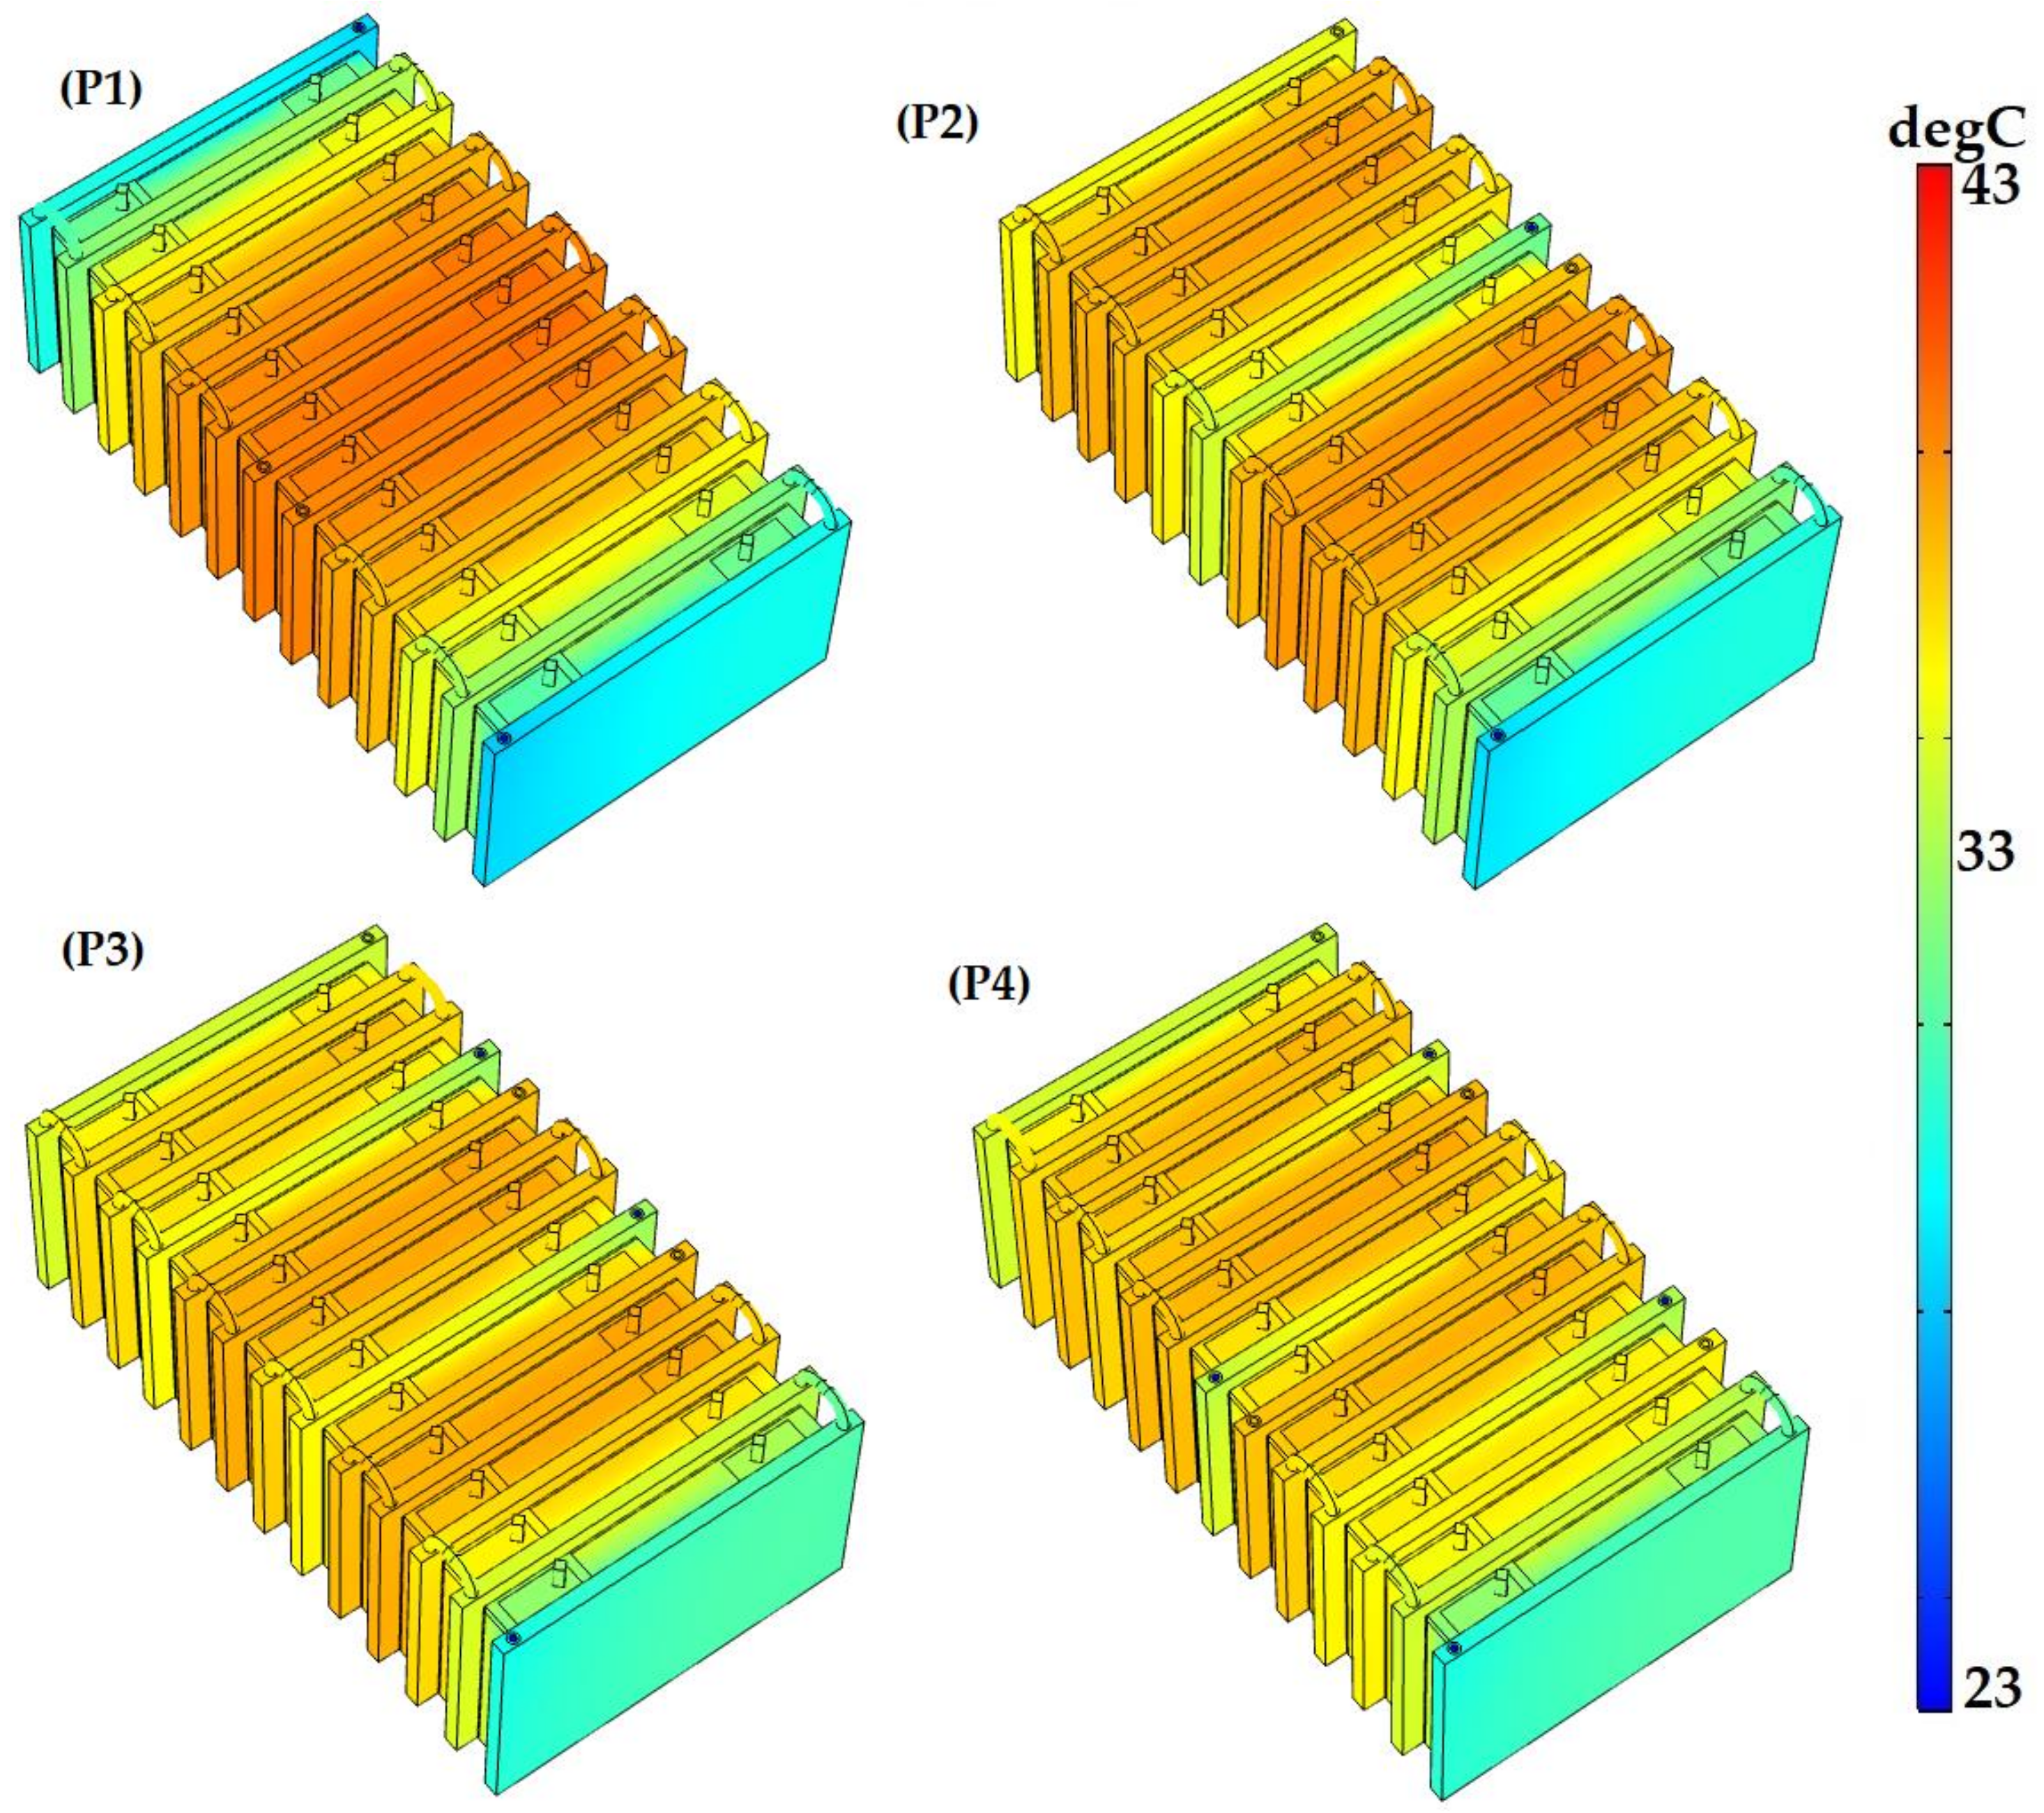
Inlet and outlet configuration had a significant effect on Tmax and ΔTmax. The best scenario for the LCTMS would be three inlets and three outlets, where Tmax and ΔTmax were decreased by 3.5% and 63.7%, respectively.
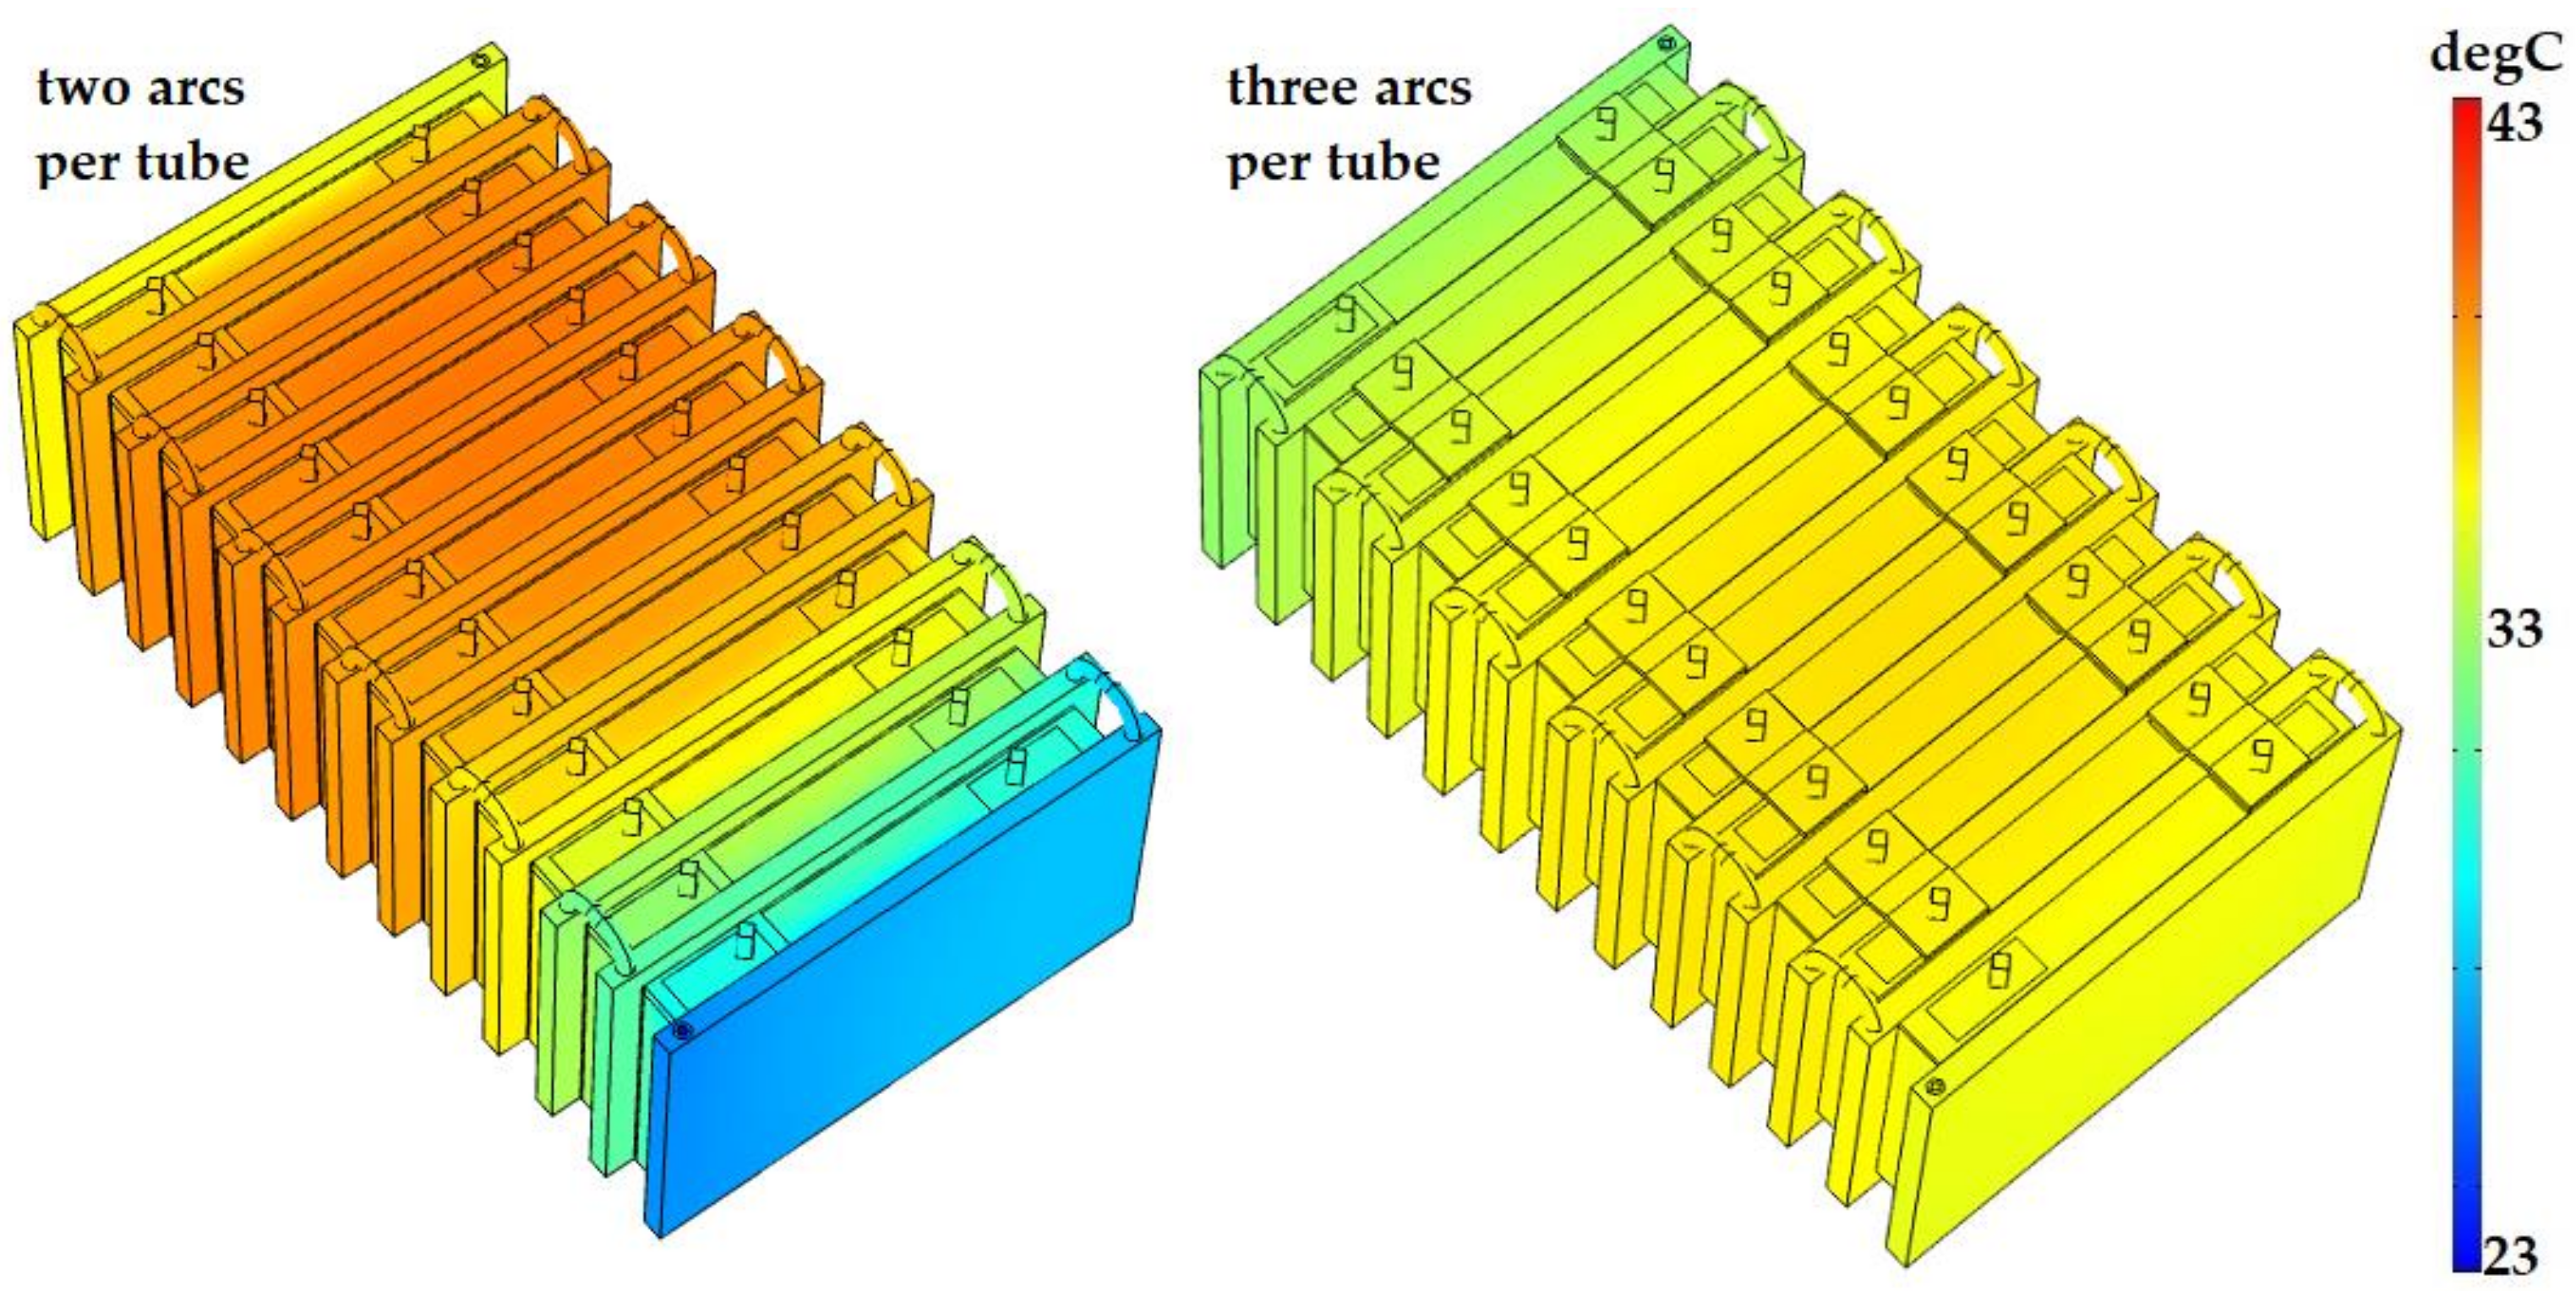
Compared to the main case study, increasing the number of arcs in the coolant path design reduced Tmax by 7.5% and ΔTmax by 63.7%.
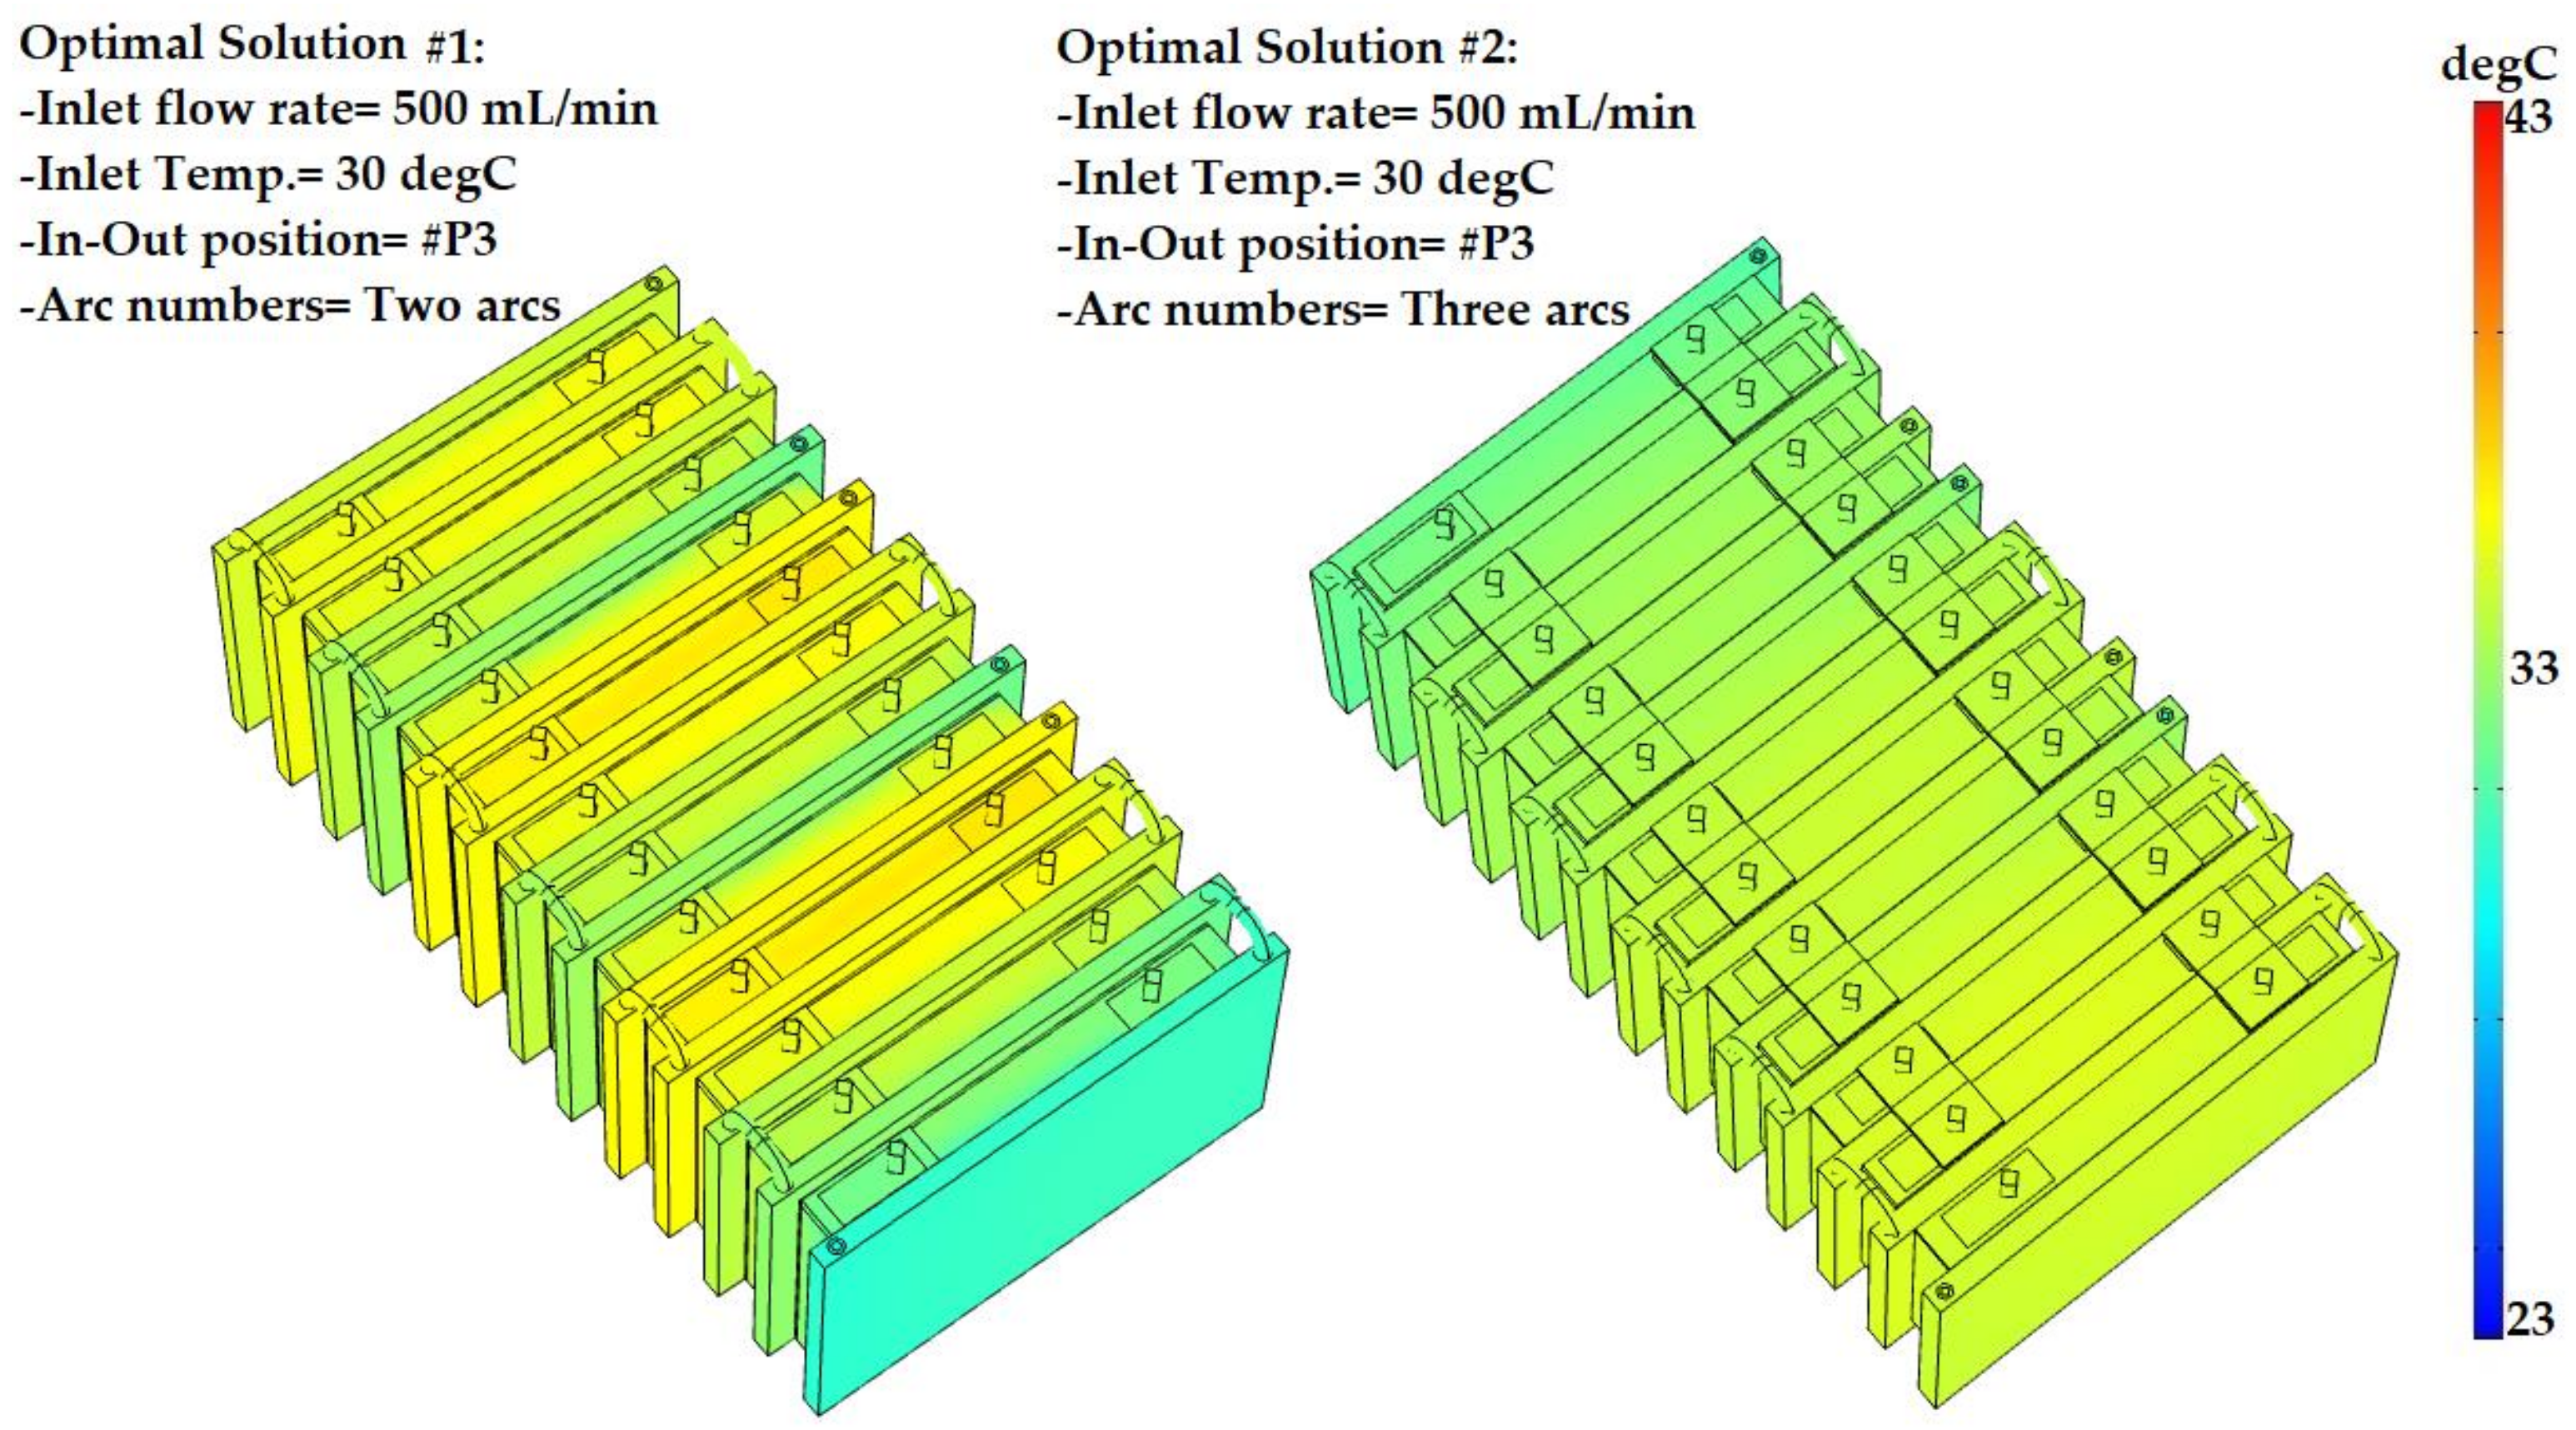
The most optimal scenario for the LCTMS would be the inlet coolant flow rate of 500 mL/min, the inlet temperature of 30 °C, three inlets and three outlets, and three arcs in the coolant path. This scenario decreased Tmax and ΔTmax by 11.5% and 79.1%, respectively.
