1. Introduction
Considering the Paris agreement, the European Union (EU) set ambitious targets to the majority penetration of renewable energy sources (RES) in all areas of activity, which has led to power systems with growing levels of variable RES (VRES) all over the EU. VRES as wind and solar photovoltaics (PV) are currently the second and sixth technologies with more installed capacity over Europe, and until 2030 it is expected that they will be the two technologies with more installed capacity [
1,
2]. VRES increase the uncertainty of the net load, also known as the residual load, i.e., load minus VRES [
3]. VRES are also characterized by their near-zero marginal costs of production, reducing market prices. Externalities such as incentives to new VRES power plants originate some issues, in particular, the extra cost compared with dispatchable technologies [
4,
5,
6]. The standard life-cycle cost metric used to compare the different generation technologies is the levelized cost of energy (LCOE). LCOE can be used to compare VRES technologies with dispatchable technologies such as coal, natural gas and fuel-oil power plants because it considers differences in the production profiles of variable and dispatchable technologies and the associated large variation in the market value of the electricity they supply [
6,
7,
8,
9]. LCOE comparisons also consider the geographical and the production-profile differences among VRES technologies. Normally, between the tropics PV has higher capacity factors, while outside the tropics and at higher altitudes wind farms have higher capacity factors. Furthermore, on average, wind power has a higher production during the night, while PV produces in more valuable hours, when demand and prices are higher [
6,
7,
8,
9]. It is necessary to establish sustainable comparisons between the different generation technologies. These comparisons must take into account differences in the production profiles of variable and dispatchable technologies, the associated large variation in the market value of the electricity they supply, the expected life-cycle of each technology and the different costs associated with them. Considering the uncertainty associated with VRES, it is important to design a power system that guarantees the security of supply and the flexibility to support VRES [
10,
11,
12,
13,
14]. The use of the least-cost system theory may minimize the power system costs while satisfying the net load. Least-cost systems are dual-objective systems. They aim at minimizing the long-run costs of the power system by minimizing the investment costs with power plants, but also their short-run costs by selecting the power plants with the lowest operation costs, reducing wholesale market prices. From this dual-objective formulation results a system that should optimize both the long-run power system design, by selecting specific power plants, and their short-run operation [
6].
Several authors have been optimizing the least-cost power system of diverse countries considering the best mix of technologies and the flexibility obtained from sector coupling towards the global ambition of carbon-neutral power systems approaching 2050 (see [
15] for a complete review). Ellinston, MacGill and Diesendorf studied the least-cost power system considering diverse scenarios with 100% RES penetration on the Australian national market by 2030 [
16]. They concluded that the least-cost scenario resulted in majority penetrations of wind farms and small penetrations of PV, concentrated solar panels, hydro and gas turbines, this scenario being so much cheaper in relation to the 2010 mix considering how much higher carbon prices will be by 2030. In a further study, these authors also studied the competition among three scenarios considering different fossil fuel technologies with the 100% RES scenario [
17]. Using a sensitivity analysis to 2030 carbon, gas, CO
2 transportation and storage prices, they concluded that economically these scenarios do not compete with the 100% RES scenario. Considering that the wind and solar LCOEs have been decreasing for more competitive values when comparing with dispatchable power plants, global 100% RES studies indicate these as the predominant technologies in the least-cost mix of diverse countries [
18,
19,
20]. Considering the uncertainty of VRES, power systems need flexibility, with hydrogen (H
2) energy storage being one of the main proposals of several authors to least-cost power systems [
21,
22]. Brouwer et al. performed a study for the West European power system considering scenarios of 40%, 60% and 80% RES by 2050 [
23]. In this study the least-cost flexibility options to support these scenarios were obtained by considering an increase in demand response, electricity storage, interconnection capacity and curtailments, but they also considered that gas-fired power plants with carbon capture and storage should replace some of the future RES capacity. This last solution may reduce the system costs by 12%, while electricity storage may slightly increase the system costs by 1%, and all other solutions only slightly reduce the system costs to 3%.
Against this background, considering the RES and demand scenarios defined by Portugal and Spain by 2030, the goal of this article is threefold:
Presents a least-cost optimization model with the goal of adapting the required thermal capacity to the RES penetration targets;
Obtains the Iberian least-cost thermal mix by 2030 considering a reliable cooperation between Portugal and Spain, and compares it with the programmed scenario. This is a theoretical study that does not take into account each country policy in relation to the installed capacity of each thermal power plant;
Obtains the Iberian least-cost thermal mix by 2018 considering the 2030 cooperative scenario to perform a smooth and least-cost transaction until 2030, and compares it with the real scenario.
A previous work presented the least-cost system model based on a linear programming model used to analyse the influence of the investment in variable renewable sources in the power system [
6]. It verified how a power system composed of a majority of thermal power plants has to be adapted in order to reduce its total costs and maintain its security of supply. The government, a software agent, incentivized the investment in new renewable sources by offering a feed-in tariff (FiT) of 80 Euros/MWh. In a context where the power system has been adapted over time to the introduction of renewable power plants, the thermal capacity was reduced around 11%. The installation of the renewable power plants corresponded to 30% of the system total capacity and can feed around 15% of the total demand of the system. In this context, the over-cost was 10% (73% from the tariff deficit and 27% for capacity reserve). For the case where any thermal power plant was dismantled, the total over-cost was 17.5%.
The remainder of the paper is structured as follows.
Section 2 presents the key theories of power systems to perform the study.
Section 3 addresses the key characteristics of the Iberian power systems.
Section 4 presents the optimal Iberian power systems using the least-cost system model.
Section 5 presents a discussion of several options to guarantee the sustainability of the Iberian power systems. Finally,
Section 6 states the final remarks and summarizes avenues for future work.
2. Power Systems Theory
In this section are presented the four main methodologies behind the considered optimization of the power system: (i) the least-cost system, where the best mix of power plants to supply the demand at least-cost is obtained, (ii) power-plant bids are based on marginal costs, increasing the general welfare of the market participants, (iii) the LCOE of each technology, as a measure to compare the cost of each technology, and (iv) the levelized cash flow (LCF), used to compute the economic results of each technology.
2.1. Least-Cost System
To minimize the cost of operating an electric power system, the variable cost of production, i.e., the marginal cost of power plants, should be considered.
The lowest operating costs referred to in the previous paragraph can match the lowest total system cost, i.e., the sum of variable costs and fixed charges. Indeed, with an operating set of dispatchable technologies
, where each technology
, usually characterized by variable costs
and annualized fixed costs
, the most efficient situation is achieved if the technology
is only present during
hours:
This means that technology
should be present during the whole year, while technology
must operate a maximum annual number of hours equal to
. The linear programming model used to solve the least-cost system was presented in [
6]. This model was adapted to this study considering that all required demand is supplied, i.e., there is no price paid for demand curtailments. Considering the level of demand is
, the monotonous curve has a set of time slots
, where each time slot
, and that each technology
has an installed power
, producing
at time period
, the minimization of the operational short-run costs,
, is given by:
The restriction given by Equation (3) indicates that the production,
, of each technology
in the maximum is equal to its installed capacity,
, at each period
. The second restriction imposes lower,
, and upper,
bounds to the installed capacity of each technology. The third restriction indicates that the sum of the production of each technology has to be equal to the demand,
, of that time period. This model does not consider the power-system losses. The fourth and fifth restrictions indicate that the production and the installed capacity of each technology have to be positive. The dual variables
,
and
are auxiliary to the optimization, being presented on the right-hand of their respective restriction. They can receive the values 1 or −1 in case of a less than or greater than or equal to inequality, respectively. Considering the annual investment in each technology, the least-cost system has the dual objective of minimizing both the investment and the operational costs since its long-run formulation equals to:
Subject to the restrictions given by Equations (3)–(6).
2.2. Market with Prices Equal to the Marginal Cost of Energy
Spot markets are the main wholesale markets of electrical energy, and their algorithms are based on the theory of the partial equilibrium where for a given time interval, different supply-side players offer amounts of energy associated with the respective price, while demand-side players bid amounts of energy associated with their prices [
24]. It is considered the case where producers offer their amount of energy by their variable cost, i.e., the marginal cost. When offering the marginal cost, peak technologies could have difficulties in recovering their fixed annual costs, while the other technologies can recover their costs when peak or other technologies with higher variable costs are marginal [
6].
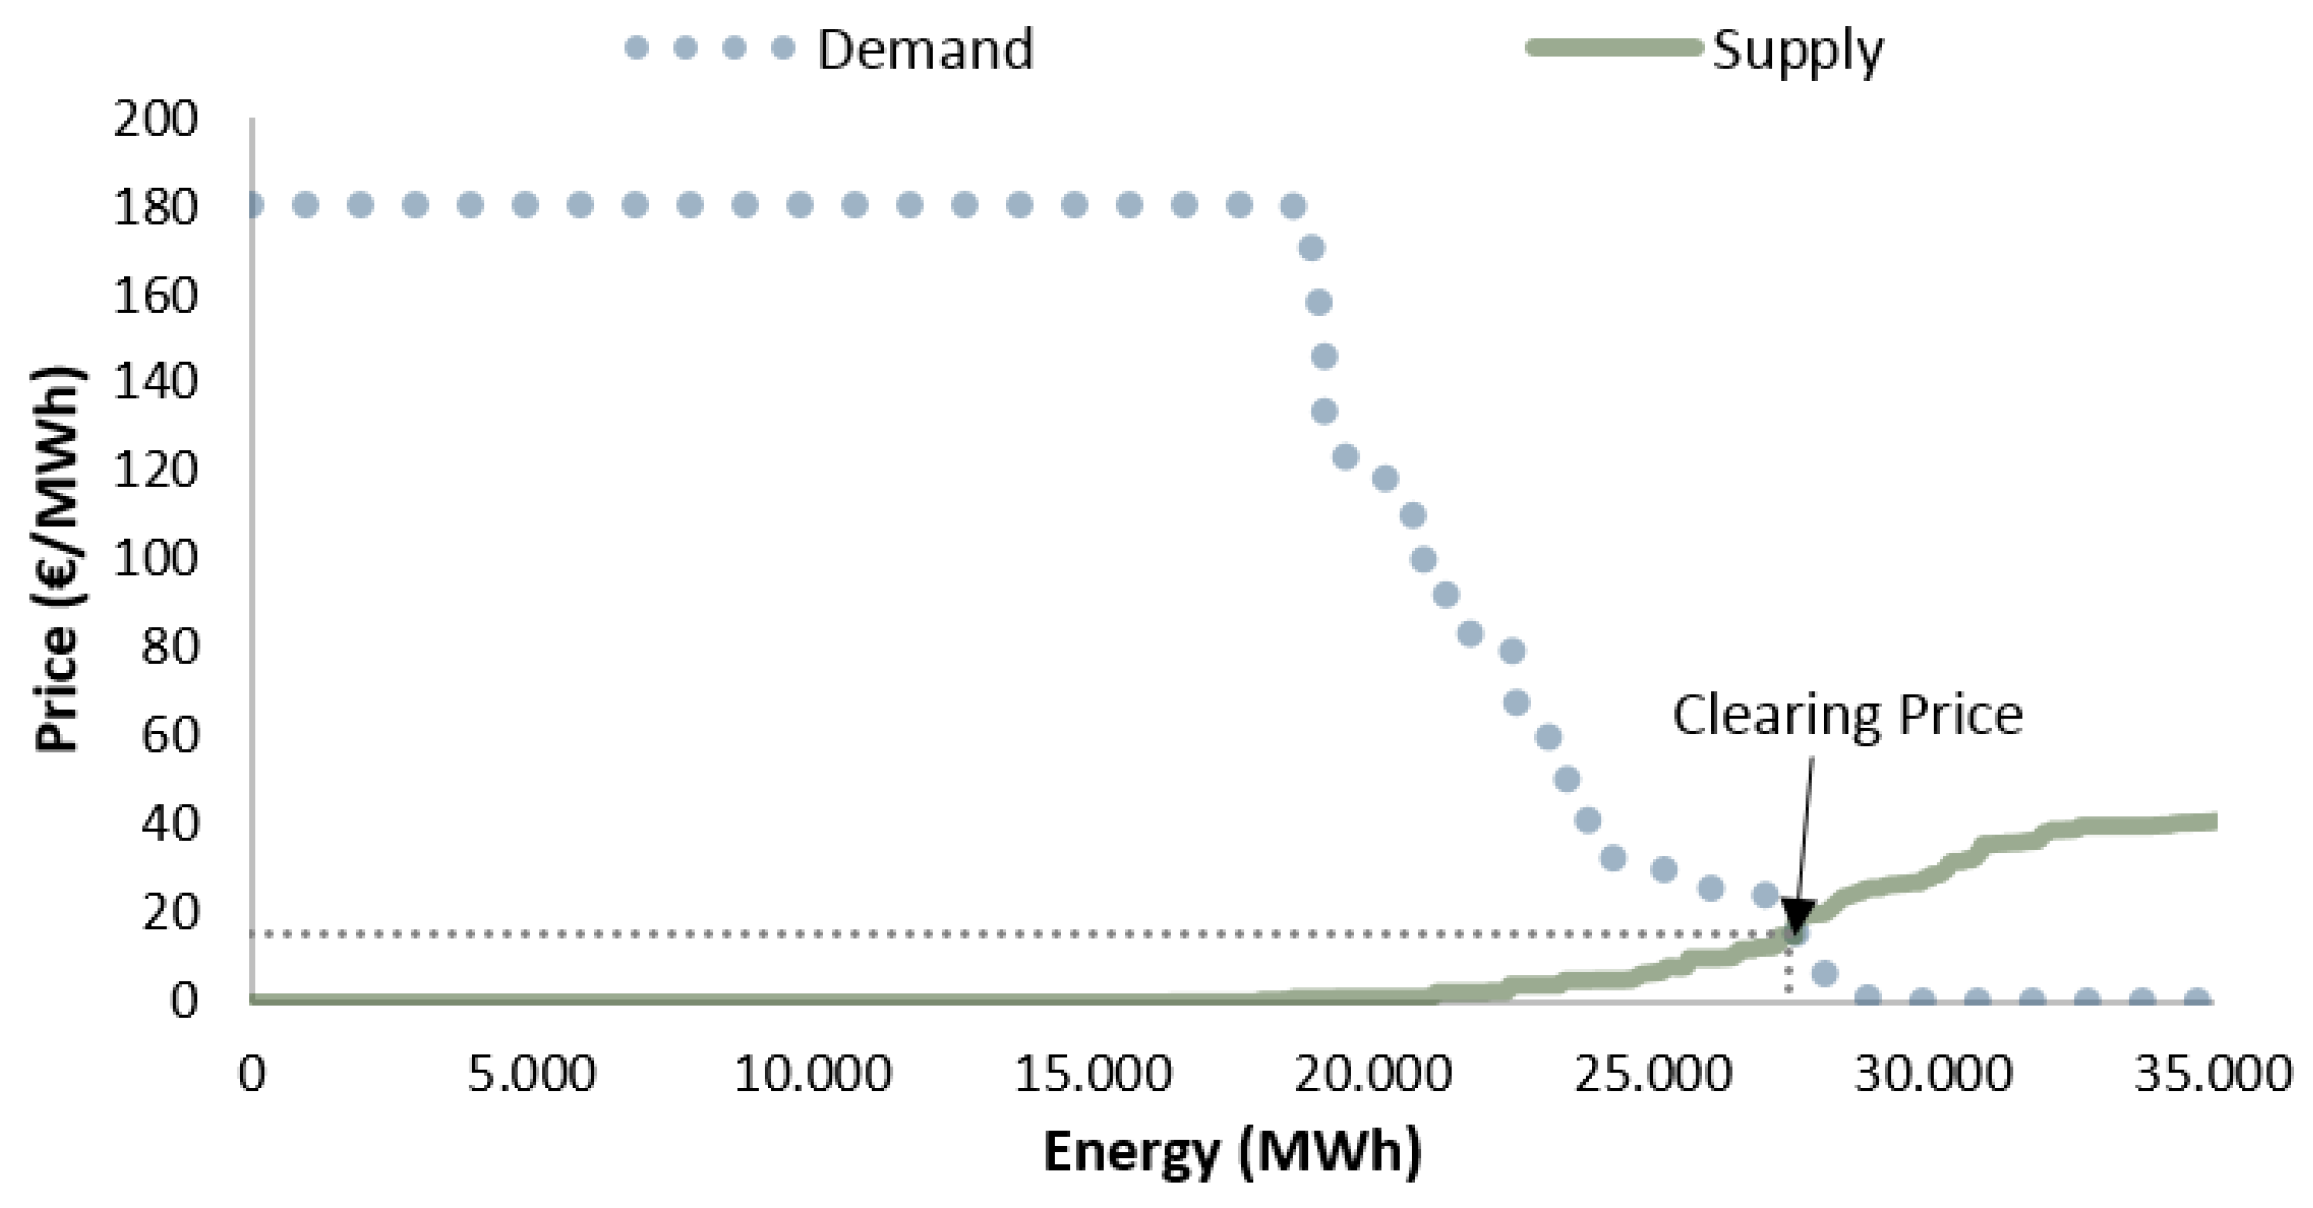
The market operator performs the aggregation of the supply-side bids and the aggregation of the demand-side offers by establishing the supply and demand curves, respectively. The resulting balance of equality between the supply and demand curves determines the price of energy during the period in question, the clearing price, illustrated in
Figure 1.
2.3. Levelized Cost and Cash Flow of Energy
The LCOE is the value per unit of produced energy that allows the investor to recover all the investment in new power plants [
7,
8]. However, the energy economics indicate that bidding this value at spot markets will decrease the social welfare of the participants, since producers could lose the opportunity to sell their energy by its cost of production, the marginal cost, and consumers will pay higher amounts for lower quantities of energy. This issue can be justified by the VRES strategies, that of having zero or near-zero marginal costs, and if they offer higher prices at spot markets they can be surpassed in the merit order effect (see
Figure 1), losing the opportunity of selling free-of-cost energy. The LCOE of each technology is computed using the following formulation:
is the life cycle of technology
, and
its generation at time slot
, being
the discount rate. The levelized cash flow (LCF) of each technology allows for computing the economic results of each technology
, at time slot
, per unit of produced energy:
is the levelized market price of each technology generation
, at time slot
. Market prices,
, are computed for each hour
, as illustrated in
Figure 1.
is the number of hours of the year (8760 h in a non-leap year; otherwise it is 8784 h). Accordingly, the levelized market price of each time slot is computed as follows:
The LCF of each technology allows for computing its economic viability based on its market-based remuneration. In case of a negative LCF, governments should compensate each technology’s lack of remuneration through capacity mechanisms or other incentives.
3. Iberian Power Systems
This chapter presents an analysis of the problem in question, using real data for the levelized costs of each technology in Portugal and Spain, such as to the monotone demand curve and to the real generation in 2018 [
25,
26]. In this year, the wind index was 1 and the hydrology index was 1.05, meaning that this year is a typical year for wind-power production and a year slightly above the average for hydro-power production. However, global warming is changing climate behaviour, which means that by 2030 this typical year could be outdated, but studying climate change is out of the scope of this work. The Iberian Peninsula power systems’ capacity in 2030 was obtained considering the National Energy and Climate Plans (NECP) [
27,
28]. Their expected demand and generation was computed considering an upscale of the 2018 real demand and generation. Therefore, it is assumed that in 2030 the meteorological conditions will be the same as in 2018 and the current RES will have their capacity upgraded with the same efficiency.
3.1. Power Systems Data in the Iberian Peninsula
Table 1 presents the Iberian countries’ real installed capacity in 2018 and their programmed capacity by 2030. The non-RES load (nRESL) is the residual load that has to be satisfied by non-RES technologies. In 2018, the nRESL was 186 TWh, around 59% of the total demand, while by 2030 it is expected to decrease to 117 TWh, around 35% of the total demand [
27,
28]. Analysing
Table 1, it is possible to verify that in 2018 Portugal was dependent on the interconnection with Spain, since its thermal capacity was not enough to surpass its peak nRESL and it had a negative nRESL, when it can export to Spain or have to curtail VRES. That dependency is expected to increase in 2030 when the Portuguese thermal capacity will decrease and its peak and minimum nRESL will increase. In 2030, the minimum nRESL of the Portuguese power system will be lower than the interconnection capacity with Spain. This excess of energy could force some RES curtailments to guarantee the security of the power system.
However, taking into consideration an increase in the pumping capacity of the hydroelectric power plants (HPPs), the possible use of demand response and also the use of such excess to produce hydrogen or power dessalination plants, this excess is already expected to be covered by 2030. Currently, Spain has an excess of thermal power plants, since natural gas and nuclear power plants are more than enough to surpass the Spanish peak nRESL and export to Portugal. In 2030, Spain could have problems allocating their excess of energy without curtailments. However, besides the increase in the pumping capacity and in the interconnection capacity with Portugal, Spain is also expecting to increase the interconnection capacity with France and Morocco to 8000 MW and 1600 MW, respectively.
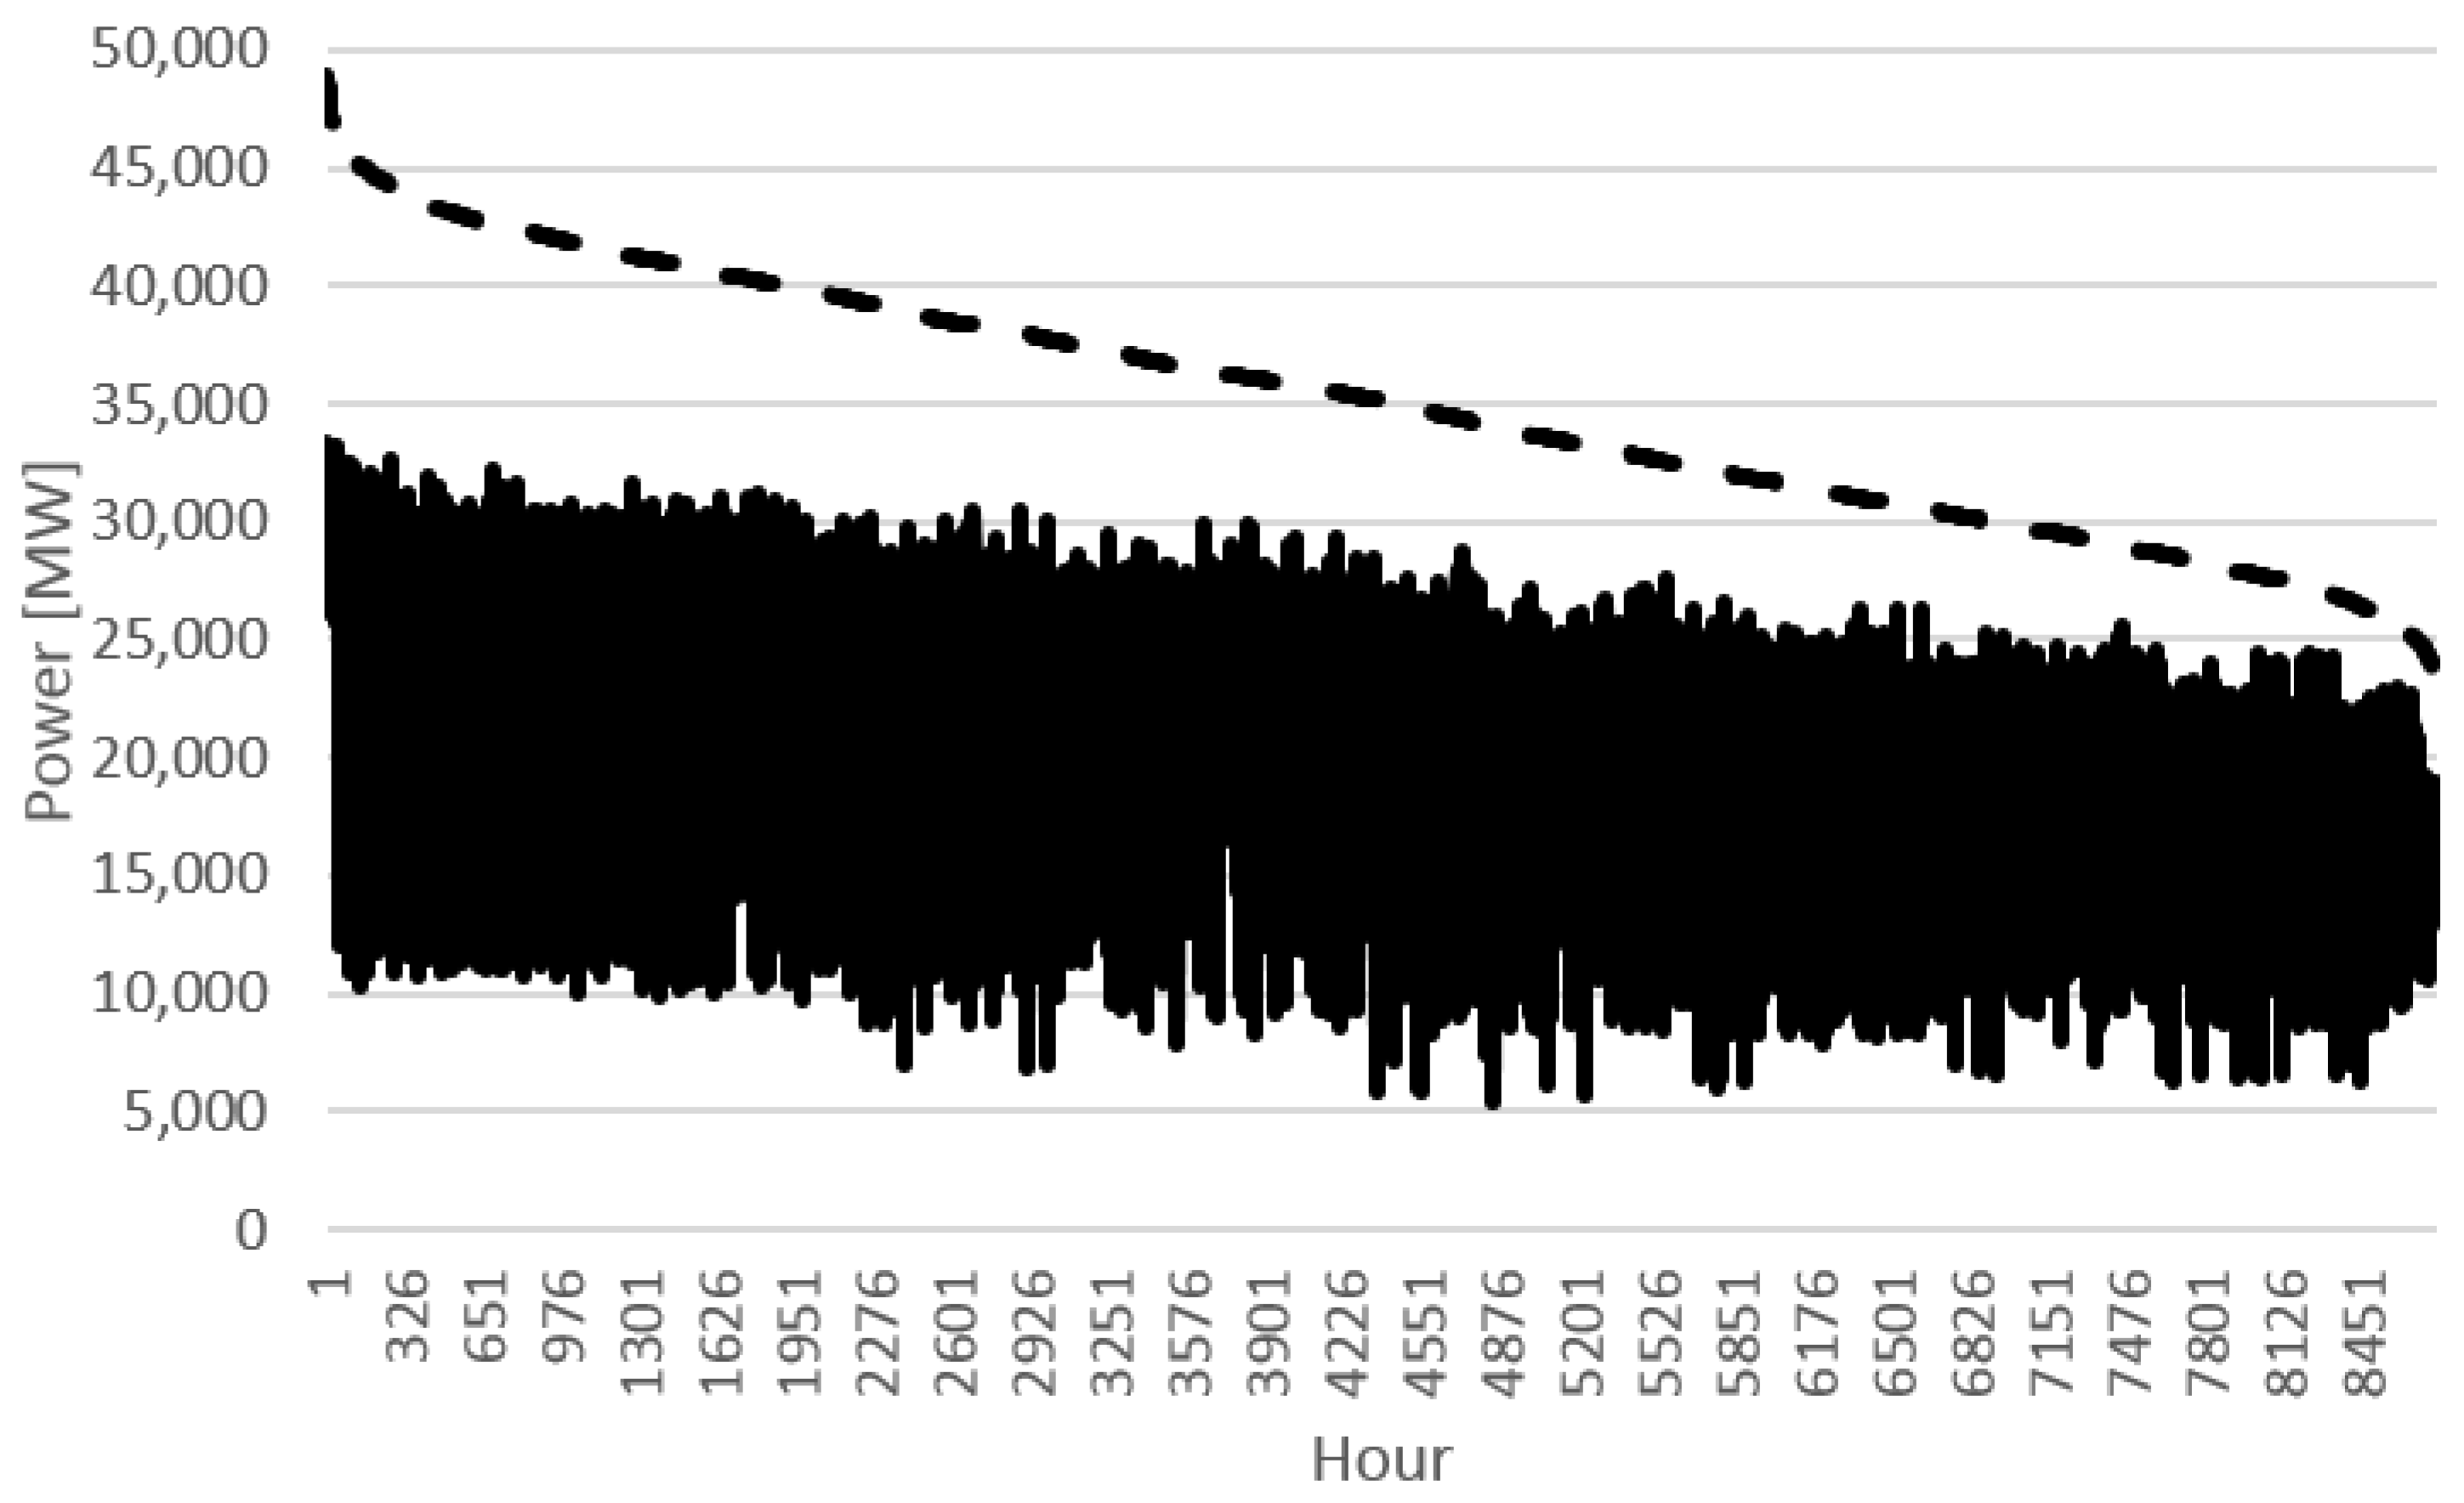
Figure 2 presents the real Iberian demand and nRESL monotone curves of 2018.
From this figure, it is possible to conclude that annually the production of renewable energy is barely uniform, since the difference between the demand and the nRESL monotone curves is practically constant. However, the stochastic nature of VRES make them highly unpredictable, with substantial hourly variations. Therefore, when comparing each hour of the Iberian demand monotone curve with its respective hourly net load, it is possible to verify a high variability with a decreasing tendency because of the strategic operation of hydroelectric power plants (see
Figure 3).
Naturally, power systems should be designed to supply the demand, so when designing the supply system, the complementarity between the RES and the demand should be considered while investing in new RES power plants. The costs and availability of RES technologies are the main issue. While dispatchable RES as geothermal or biomass have geographical limitations and substantial fixed costs when compared to VRES, HPPs with pumped hydro storage (PHS) are the most competitive power plants with storage capacity [
29]. The use of VRES with battery-energy storage systems (BESS) can more than double the VRES fixed costs, and concentrated solar panels are even more expensive. However, HPPs also have geographical and resource limitations, with yearly variations in their production based on the hydrological index, i.e., the natural inflow cycle of water [
29]. Thus, without relevant penetrations of HPPs, investments in more diverse storage portfolios or demand response, it will be hard to design sustainable supply systems with near 100% RES.
Since the goal of this study is to optimize the Iberian thermal capacity, the typical costs of such technologies in 2018 and the expected costs by 2030 are presented [
30,
31].
3.2. Power System Costs
The CO
2 price is starting to have a relevant weight in the variable costs of the highest polluter technologies. While in the past, coal technologies were part of the base technologies of the majority of the power systems without nuclear power plants, now they compete with natural-gas technologies, being retired due to their lack of flexibility and high CO
2 emissions when compared to natural-gas technologies [
6]. By 2018, the CO
2 price was around 19.7 Euros/tCO
2, while in 2030 it is expected to rise to values higher than 35 Euros/tCO
2 (the value considered in this study) [
30,
31]. An increase in the CO
2 price could be very important to increase wholesale market prices to values that incentivize the investment in new flexibility options, assuring a secure transition to power systems with near 100% RES.
Table 2 presents the typical costs of the thermal technologies. Analysing
Table 2, it can be concluded that the fuel-oil technology is not competitive at an economic level since the combined cycle gas turbine (CCGT) is cheaper at all levels. CCGT is also more efficient and flexible. Considering the 2018 real-world costs identified in
Table 2, the total costs of the Iberian supplies system in 2018 are presented in
Table 3.
Analysing
Table 3, it is possible to conclude that with all the European decarbonisation measures that increase the CO
2 price and tax the polluter players, currently coal power plants are not competitive, having higher costs than CCGT for a bit more than half the generation. Comparing the 2018 LCOE of the technologies, it can be concluded that nuclear and natural gas are the more competitive technologies, but CCGT has the advantage of being more flexible. The average LCOE of the non-RES thermal power plants is 44.84 Euros/MWh.
Furthermore, in 2018 the renewable penetration was 41% and the non-RES thermal generation contributed to the emission of around 37 million tons of CO
2. Assuming that all producers offer their energy by their marginal cost,
Table 4 presents the remuneration of these players.
By offering their marginal cost, any of these technologies can recover their total costs from market remuneration. Naturally, these technologies are essential to guarantee the security of supply in the Iberian power systems, so in order to guarantee that these players are economically viable, governments have bilateral contracts with them (capacity mechanisms), compensating their annual costs that are not covered by market remuneration. Then, these costs are passed to consumers’ tariffs. In conclusion, while market algorithms try to maximize all players’ general welfare, all negative externalities such as taxes, levies and feed-in tariffs affect the final retail prices of electricity.
3.3. Iberian Use of Each Thermal Technology in 2018
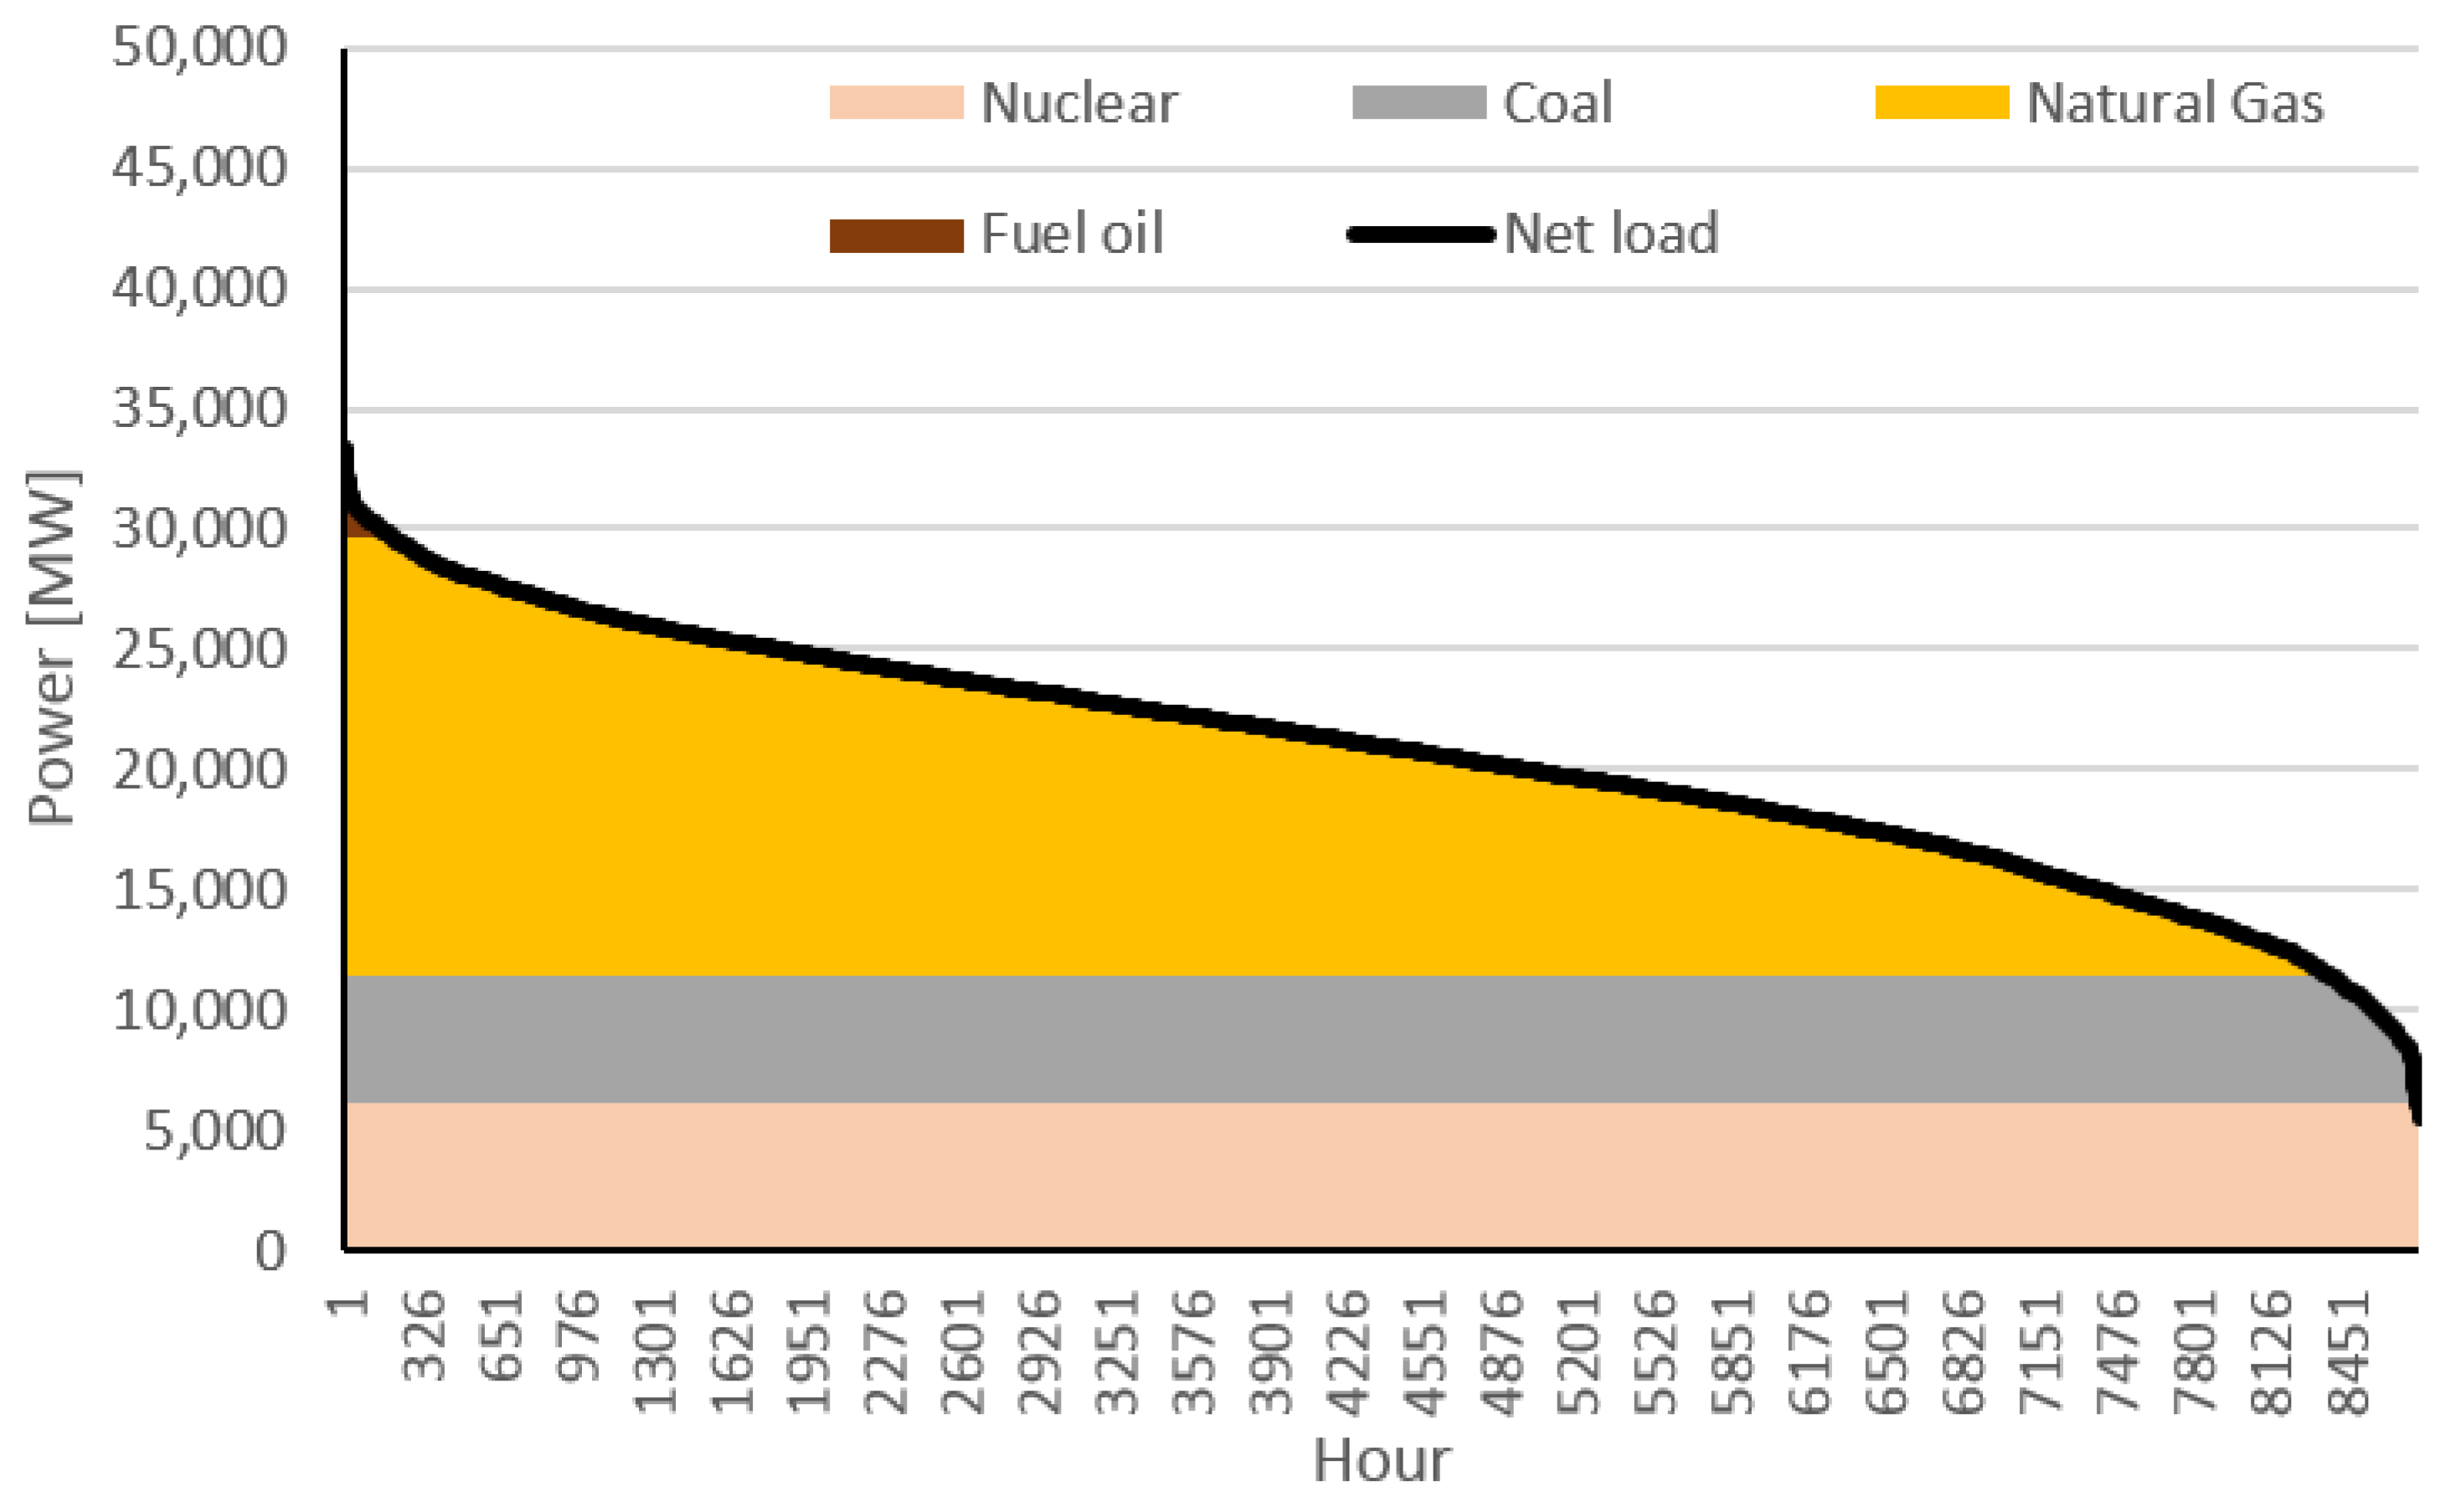
Figure 4 presents the division of the 2018 net-load curve by technology.
Figure 4 shows that fuel-oil technology is barely used and the majority of the nRESL is supported by CCGT power plants. Under these conditions, 10 h of market splitting was detected because the market algorithm identified an optimal exchange from Portugal to Spain higher than the interconnection capacity. These cases occurred when the minimum nRESL of Portugal was lower than the capacity to exchange energy with Spain (see
Table 1).
On the other hand, the Spanish dispatchable power plants are more competitive, but the requested interconnection exchange from Spain to Portugal is higher than its capacity, resulting in more than 3 h of market splitting. Market splitting reduces the general welfare of the participants, since it means that in the coupled region cheaper power plants exist that are unable to exchange their energy because of limited interconnection capacity. The exporter country will lose the opportunity of selling larger quantities of energy for higher prices, reducing the remuneration from their power plants, while the importer country will pay more for the same quantity of energy. These cases were detected considering that the efficiency in the use of the interconnection exchange is 100% because local congestions can affect this efficiency.
3.4. Iberian Expected Use of Each Thermal Technology in 2030
Until 2030, the RES penetration in the Iberian power system is expected to increase to more than 65% [
27,
28]. Furthermore, the cost of each ton of CO
2 emissions is expected to significantly increase as commodities prices increase the production cost of the higher polluter technologies.
Table 5 presents the expected costs of thermal technologies by 2030 considering the NECPs of each country and the assumptions presented before. The generation was optimized, considering the variable cost of all technologies.
Analysing
Table 5, it seems that by 2030 nuclear is the cheapest technology, while natural-gas technology increases its capacity but reduces its generation, highly increasing its LCOE. The nuclear technology maintains its fixed and variable costs but increases its generation, decreasing its LCOE. Considering the expected variable costs and demand by 2030, fuel-oil technologies are not expected to produce any energy. Therefore, it is not possible to compute the LCOE of fuel-oil technologies.
Table 6 presents the total costs, the market remuneration and the levelized cash flow (LCF) of thermal capacity in 2030. Under the assumed conditions, it is possible to verify that nuclear power plants can almost recover all their investments from the market (their LCF is close to zero), while the other technologies will have considerable losses, which may be paid by consumers. One of the problems of this thermal capacity is the number of market-splitting hours because of a limited interconnection capacity, which will increase from 13 h in 2018 to 215 h in 2030, 180 h of which is because of excess production of RES in Portugal, considering its demand and export capacity.
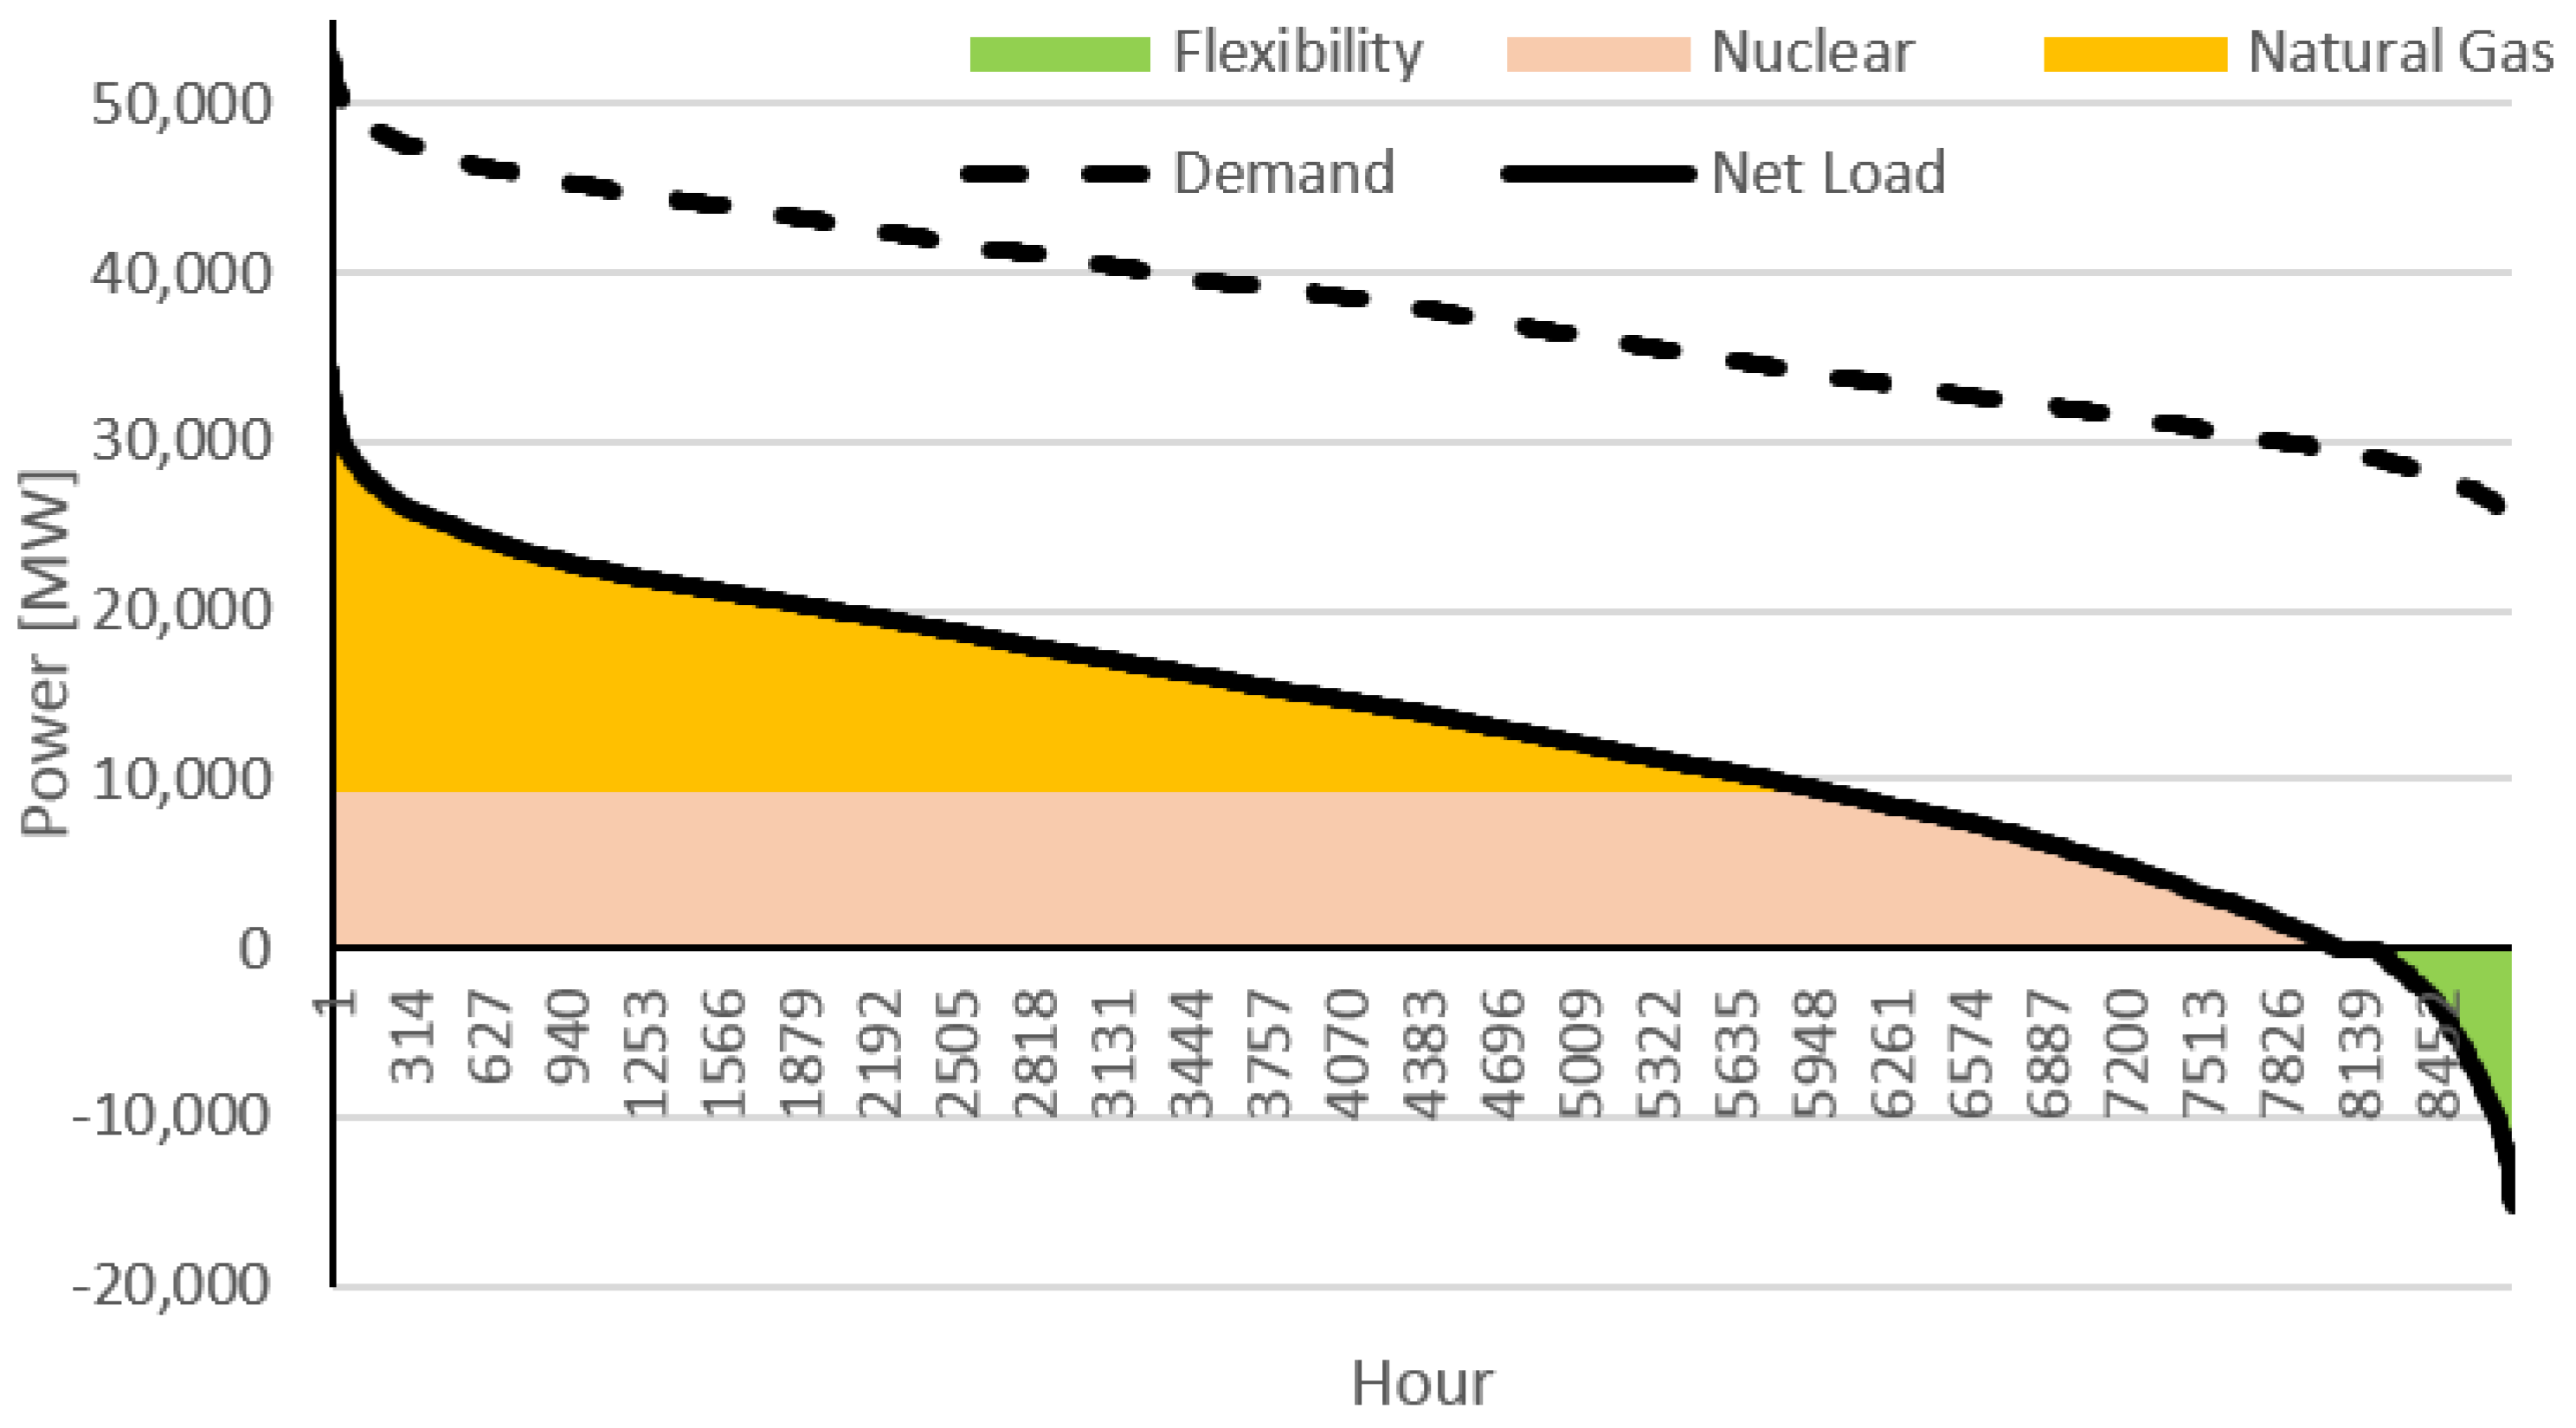
Figure 5 presents the optimal Iberian non-RES thermal division by technology considering the programmed scenario.
Analysing
Figure 5, it can be concluded that by 2030 the number of occurrences of a negative net-load is substantial (704). Furthermore, the economically “optimal” number of 704 shut-down and start-up occurrences of nuclear power plants is also not suited to their technical capability, which can conduct to curtailments of VRES by 3.5 TWh, around 1% of the total demand. Even so, the optimal number of hours that require the flexibility of nuclear power plants can ascend to 2161, which requires a maximum power flexibility of 7.4 GW and energy flexibility of 4.8 TWh, around 1.5% of the total demand. The pumping capacity of the Iberian power system and the interconnection capacity with its neighbours is expected to ascend to 8.49 GW and 9.60 GW by 2030, respectively. However, while HPPs are dependent on their reservoir capacity to use pumping, the need to export energy to neighbouring countries is dependent on market results. If the market prices on neighbouring markets are higher than on the Iberian market of electricity (MIBEL), the Iberian countries will export; otherwise, they will import, which increases their need for power flexibility. To completely avoid VRES curtailments and assure a secure operation of nuclear power plants, there is a need for 23.83 GW of flexible power and 13.5 TWh of flexible energy. Even considering the optimal scenario in which the Iberian power system has all pumping mechanisms operating at full capacity and exports energy, considering the total interconnection capacity there will be a need for an extra 5.74 GW of power flexibility to completely avoid curtailments. In conclusion, by 2030, there will exist a strong need for new sources of energy flexibility that can be provided from storage, demand response and sector coupling. Energy flexibility can enable a secure operation of nuclear power plants and a reduced number of VRES curtailments.
Against this background, the next section presents the optimal Iberian least-cost systems, taking into consideration that the Portuguese and Spanish power systems cooperate with each other but are independent.
4. The Optimal Iberian Power Systems
This chapter presents an optimization of the Iberian power system and of each internal power system, considering the best capacity allocation to each thermal technology considering three scenarios: (i) independent, i.e., each country has enough capacity to surpass all demand, (ii) cooperative, where both countries consider the interconnection capacity when designing their thermal capacity and (iii) reliable, the best solution considering the actual and programmed capacity. The reliable solution makes use of the inequality (4) to impose a maximum installed capacity in 2018 that does not surpass the optimal installed capacity by 2030, avoiding investing in new technologies to then dismantle them. The main limitations of this study are that in relation to 2018, it considers the same: (i) meteorological conditions, (ii) market mechanisms, (iii) VRES efficiency, (iv) storage portfolio based on PHS and (v) cooperation with other sectors (power to X). An increased cooperation with other sectors and storage capacity, such as the active participation of demand, could change the behaviour of the market participants by 2030, but that is out of the scope of this work. Furthermore, one of the main limitations of the least-cost system is that the optimal solution does not consider the current installed capacities of each technology; it optimizes the system from scratch. However, it is possible to impose constraints to these capacities, as in the reliable solution. Therefore, the least-cost system should be used with common sense and making a good judgement of the pros and cons of each solution.
4.1. Optimal Iberian Power Systems in 2030
Considering the data of the previous section, this section starts by computing the independent and cooperative optimal solutions in 2030 in order to investigate the best power system transition from 2018 to 2030, as presented in
Table 7.
In the independent solution, each country optimizes its own power system while in the cooperative solution the optimization is made to the Iberian power system. Naturally, the independent solution considers more installed capacity. Analysing
Table 1 and
Table 7 can be verified that in the cooperative scenario, Portugal increases its thermal capacity by 1514 MW in relation to the programmed thermal capacity, decreasing the Portuguese dependency from Spain that now in the worst hour is 819 MW.
On the other side, the thermal capacity of Spain decreases in relation to the programmed one, being now dependent from its neighbours in a maximum of 1002 MW. As Portugal only has interconnections with Spain, it is important to reduce its dependency on Spanish electricity to avoid future security problems. On the other hand, now Spain is dependent from its neighbours, but the interconnection capacity with each of the three neighbours is more than enough to surpass its needs, guaranteeing the security of supply. Furthermore, in the independent and cooperative solutions, the number of market-splitting hours decreases to 185 and 180, respectively, mainly because of the low interconnection capacity from Portugal to Spain, and Portugal cannot export its extra VRES production when the nRESL is lower than −3500 MWh.
Table 8 presents the expected annual fixed and variable costs in the optimal scenario and compares it with the programmed scenario. Analysing
Table 8, it can be concluded that a cooperative optimization of the power system can reduce the system costs around 17.4%, with a substantial decrease in the fixed and variable costs, reducing the LCOE of the system. The LCOE of the thermal technologies increases in 2030 because for a slightly higher capacity they reduce their generation almost 40%, and the commodities and CO
2 prices are higher. Economically, the best solution, considering the characteristics of the Iberian power systems, should consider only natural gas and nuclear technologies.
Technically, CCGT (natural gas) is also the best option since it has high ramp rates, being capable of fast responses to VRES sudden rises or falls. However, in a system with only nuclear, CCGT, PHS and thermal RES as the only dispatchable technologies, these technologies may start bidding their LCOE instead of their marginal cost, avoiding the need for capacity mechanisms, FiTs and other incentives that affect competition and the free fluctuation of the market prices, reducing the general welfare of the participants [
10]. Market prices around 49.77 Euros/MWh are more than enough to guarantee the economic sustainability of mature VRES, as onshore wind and PV. The sustainability of the power systems without externalities will be studied in the next section. However, the market prices on these scenarios stand below 40.49 Euros/MWh, which is not enough to guarantee the economic sustainability of all technologies except PV.
4.2. Optimal Iberian Power Systems in 2018
Using the data of the previous section, the optimal power system in 2018 was computed, i.e., the optimal installed capacity of each group of technologies. This section presents three different case studies: (A) the optimal independent solution and the (B) cooperative and (C) reliable solutions considering the 2030 optimal solution.
Table 9 presents the optimal thermal capacity of the Iberian power systems in 2018, considering real demand and RES production. In the independent solution, the least-cost system is obtained for each country independently without considering the interconnection capacity. This solution optimizes the capacity of each country assuming their electrical energy independency, increasing such capacity. It indicates that Portugal should increase the capacity of natural-gas technology and retire all the other non-RES thermal technologies, and Spain should reduce the capacity of its natural-gas technology and increase its nuclear capacity. It is not a good option to increase the capacity of the CCGT technology in Portugal and reduce it in Spain.
The cooperative solution results from the optimization of the coupled power systems considering the interconnection exchange. This solution guarantees the supply of the demand in each country but not their independence. It indicates that Spain should reduce the capacity of its natural-gas technology and both should increase their nuclear capacity. This solution is not reliable because of the expected optimal solution in 2030. In 2030, the optimal solution indicates more CCGT, so it would not be a good option for Spain to retire some CCGT by 2018 and then invest in more until 2030. Furthermore, it would not be a good option for both countries to invest in new nuclear capacity in 2018 and then retire some nuclear capacity in 2030. The reliable solution is a sub-optimal solution to 2018 that considers the real installed capacity in 2018 and the optimal expected capacity by 2030. This solution considers the retirement of all fuel oil and coal power plants with a small increase of the nuclear capacity. It also considers that Portugal should invest in 1008 MW of nuclear power plants. Considering this reliable solution, with the RES investments until 2030, Spain will not have to make any change in its non-RES thermal capacity until 2030, while Portugal will have to invest in increasing the capacity of its nuclear technology by 806 MW.
Table 10 presents the costs of the Iberian non-RES thermal power plants in the aforementioned scenarios. Analysing
Table 10, it is possible to conclude that all solutions gave similar total costs and LCOEs, but significant reductions (20%) on these costs when comparing with the real results presented in
Table 3. The reliable scenario is the scenario that considers fewer changes to the current power systems with a cost only slightly higher (0.12%) when comparing it with the best scenario. The next section evaluates the sustainability of these solutions considering an environmental, economic and technical point of view.
5. Sustainability of the Iberian Power Systems
The previous section indicated the best economical solution to allocate the required thermal technologies from 2018 to 2030 in power systems towards 100% RES. From the previous section it was possible to conclude that the programmed scenario in 2030 will conduct to: (i) an excessive non-RES thermal capacity, (ii) an increase in the LCOEs of the thermal capacity, (iii) insufficient interconnection capacity between Portugal and Spain, (iv) an increase in the number of market-splitting hours, (v) weak complementarity between demand and VRES, (vi) an excessive VRES production and (vii) VRES curtailments.
Against this background, with the majority of the VRES production during off-peak periods it is important to investigate if these technologies will be economically sustainable by 2030 without FiTs and other incentives, receiving their remuneration from energy-only markets (EOMs).
5.1. Programmed Scenario
Considering the programmed scenario, the wind-power remuneration from the market will be on average 31.85 Euros/MWh, and wind power producers may have to curtail around 8% of their production. Considering that wind-power plants may have to be responsible for their deviations, this value could not be enough to guarantee a return to investors. Solar PV will receive from markets 36.17 Euros/MWh, on average, curtailing around 4% of their production. This remuneration is more than enough for PV investors to obtain a significant return. As indicated in the previous section, if the Iberian countries invest in more flexible solutions until 2030, these remunerations may increase and the curtailments may decrease. In addition, increasing the complementarity between VRES and demand will also benefit the system. Considering the investment costs, the production behaviour and the net load outputs, governments seem to estimate an excessive investment in wind power in relation to the PV investment that is cheaper and has a higher market value, i.e., produce during the day when the demand is higher while wind farms have the majority of their production during the night when the demand is lower. The number of hours with curtailments can ascend to 704.
Optimally, in 2018 nuclear power plants should have had a gap of only 6 h without being on full operation, the same hours when coal power plants were not working plus 376 h without being on full operation (see
Figure 4). Thus, coal power plants had time to schedule maintenance and to coordinate themselves efficiently, while the maintenance of nuclear power plants affected market prices. The number of non-operating hours of these power plants is expected to substantially increase in 2030, as can be seen in
Figure 1. The problem is on the expected number of up and down power ramps by 2030 that these power plants cannot cover due to their lack of flexibility, i.e., slow ramping rates and high start-up and shut-down costs. Against this background, there is an expected investment in more 2375 MW of pumping capacity, which can only guarantee a stable operation of nuclear power plants at full capacity. Therefore, more storage and flexibility solutions are foreseen (see
Table 1). This scenario allows reducing the emissions of CO
2 to around 18 million tons by 2030, a reduction of almost 52% in relation to 2018, even considering the increase in the demand.
5.2. Cooperative Scenario
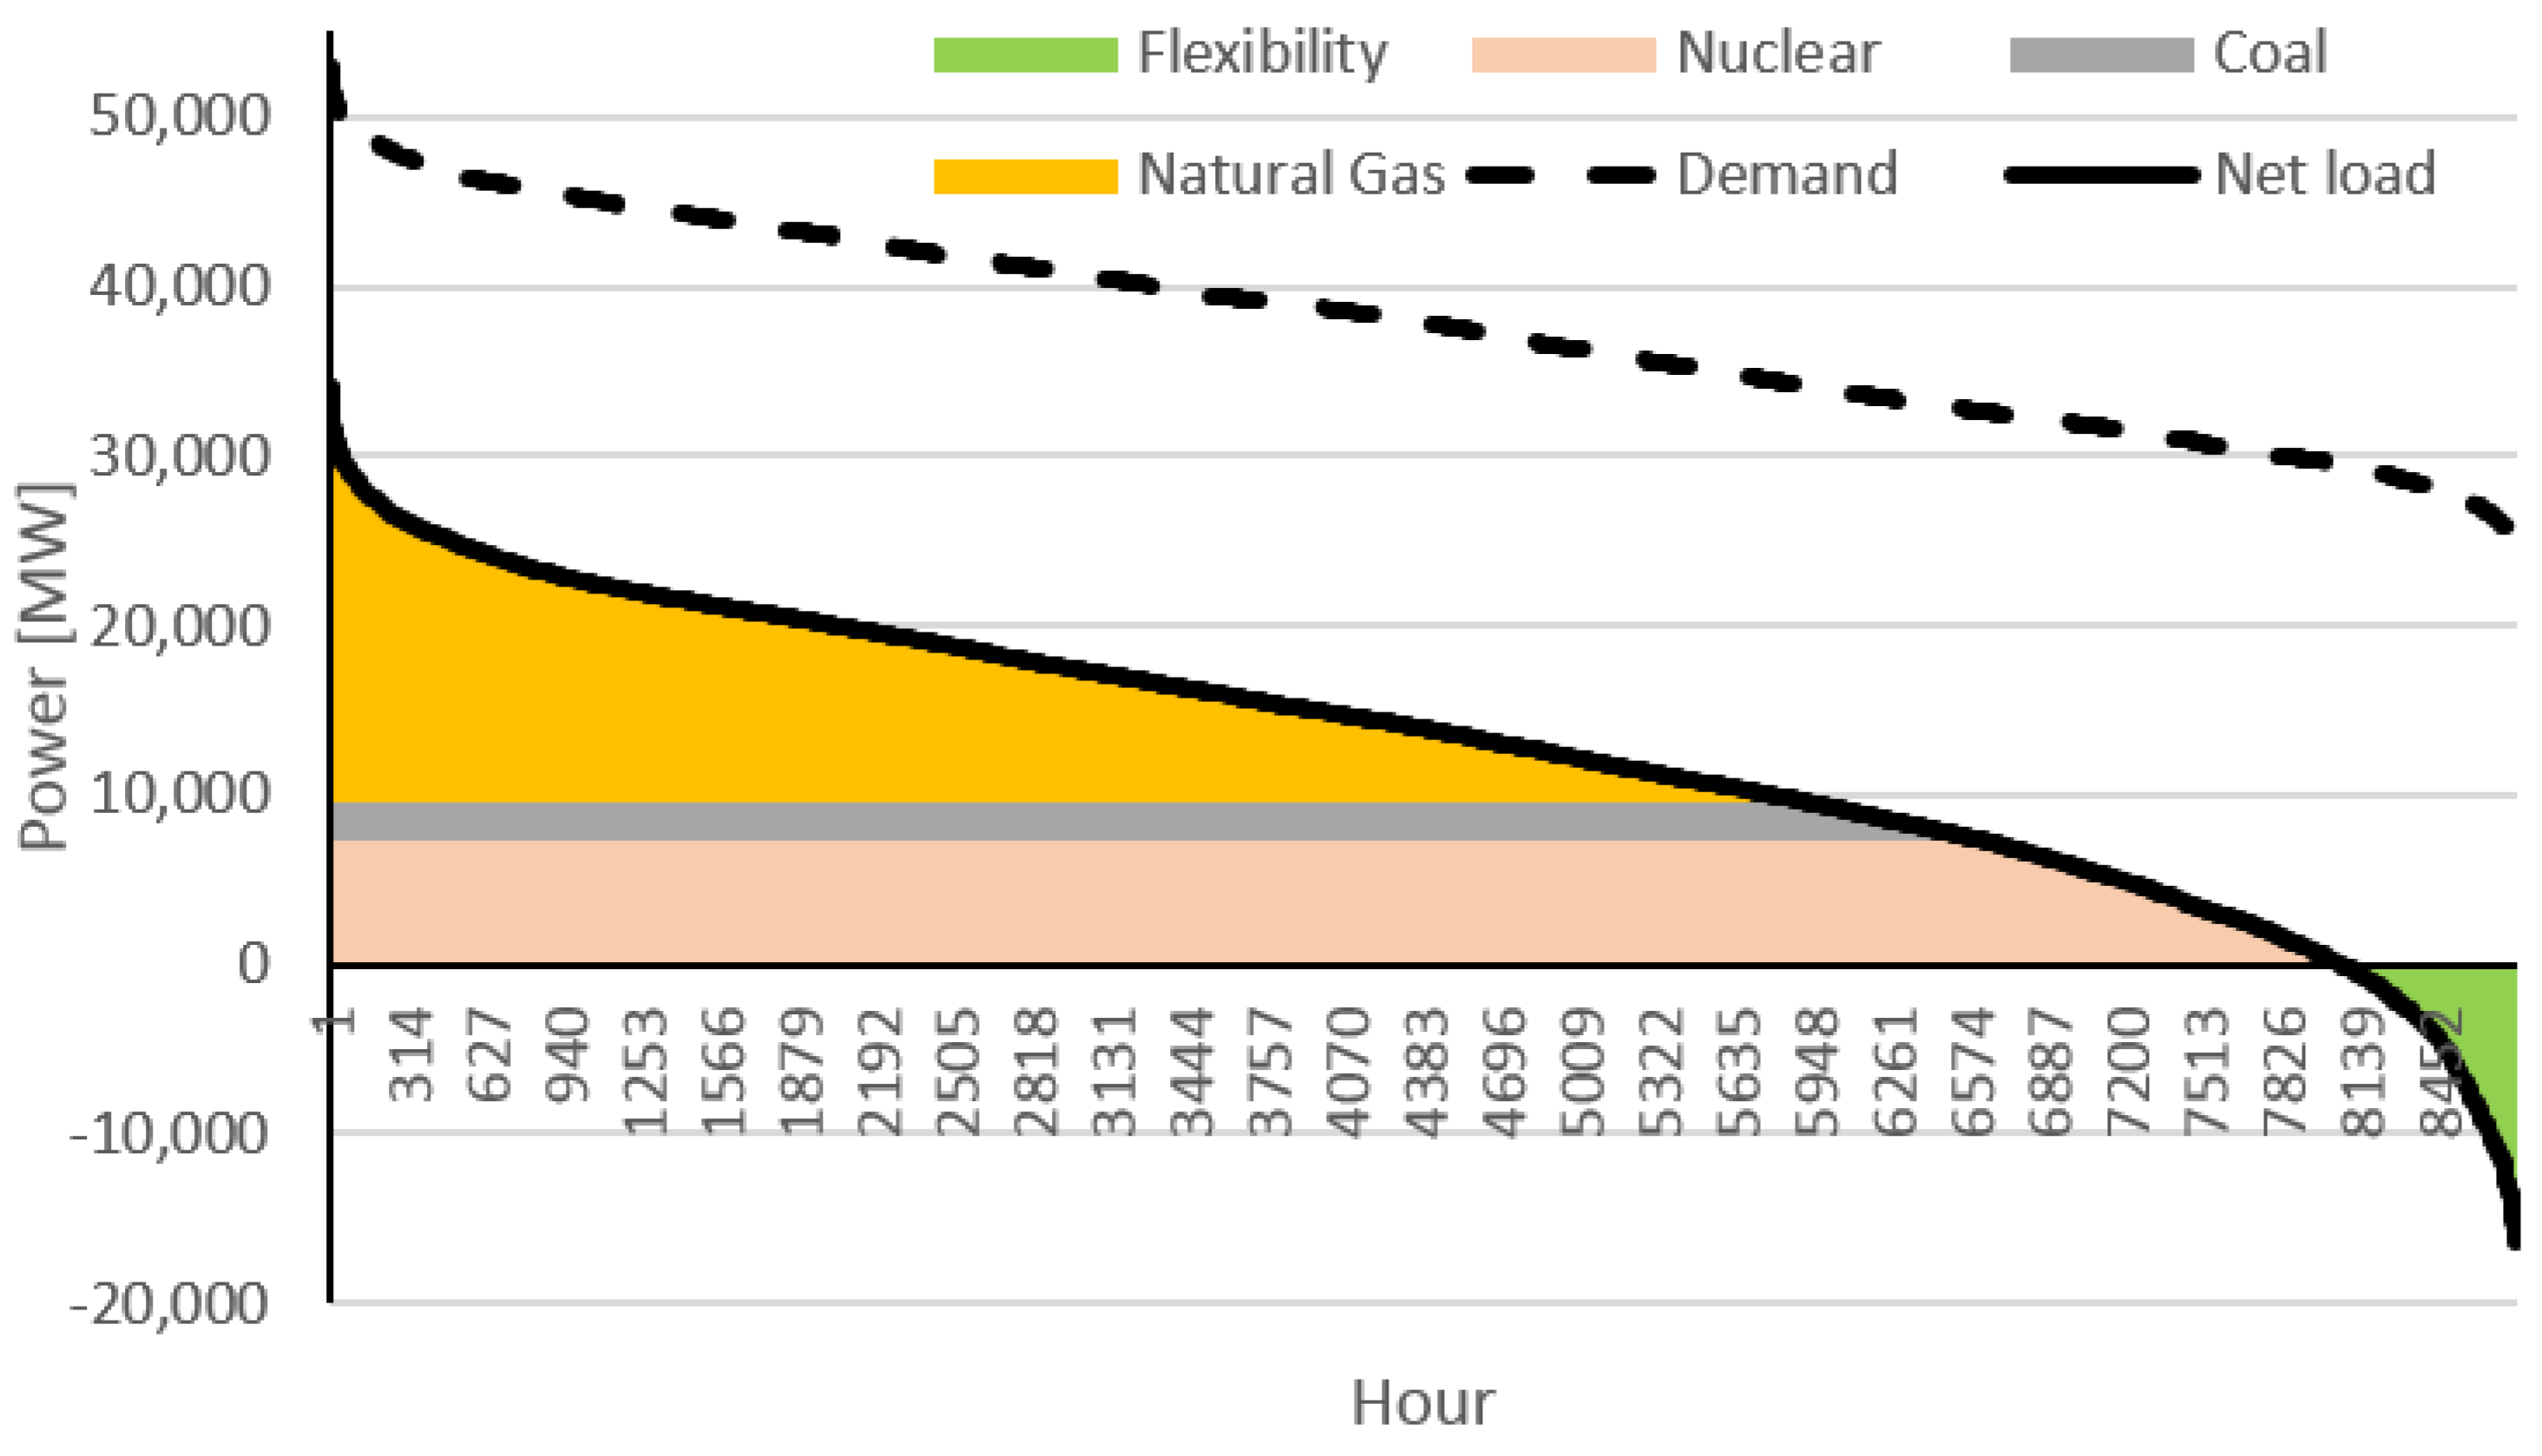
This scenario can reduce the system costs around 17.4% by 2030, so economically it is more sustainable than the scenario programmed by the local governments. In this scenario Portugal slightly increases its thermal capacity in relation to the programmed scenario, decreasing its dependency on Spain, which is important considering that it is only dependent on the interconnections with Spain. Spain significantly reduces its capacity in relation to the programmed scenario, increasing its dependency on its neighbours, which it is not so critical as that in Portugal because it also has interconnections with France and Morocco. Technically, this scenario does not bring any advantage in relation to the programmed scenario since coal power plants are replaced by nuclear power plants that are less flexible, especially when in comparison with retrofitted coal power plants. Therefore, the problem in relation to the complementarity and schedule of nuclear power plants to comply with the expected up-and-down net-load ramps should have to be compensated by hydro, CCGT, storage and demand response as the main sources of flexibility (see
Figure 6).
In systems with majority and increasing levels of VRES, flexibility is the key, and therefore it should be well-remunerated. Dispatchable and flexible power plants are critical, and they should start bidding their LCOE instead of their marginal cost to recover their investment costs without externalities, supporting the free fluctuation of prices based on market mechanisms as suggested by the International Energy Agency [
10]. Therefore, CCGT power plants should bid their LCOE and nuclear power plants should bid their marginal cost. VRES should continue bidding their near-zero variable cost, as an opportunity to sell “free-of-cost” energy. In relation to the previous scenarios, it is also considered that when the expected net load is negative, all dispatchable power plants with the exception of nuclear power plants should be idle, avoiding VRES curtailments and extra costs with the balancing and flexible mechanisms. Thus, under these assumptions it is possible to verify if an EOM is enough to guarantee the economic sustainability of the power-system participants without externalities. The levelized market prices are 65.72 Euros/MWh. CCGT power plants have an average remuneration of 71.89 Euros/MWh, with a positive levelized cash flow of 9.00 Euros/MWh. Nuclear power plants have an average remuneration of 61.01 Euros/MWh, obtaining a positive levelized cash flow of 21.25 Euros/MWh. Wind farms and PV obtained a remuneration of 50.82 Euros/MWh and 56.35 Euros/MWh considering their optimal production with curtailments and a remuneration of 55.38 Euros/MWh and 58.81 Euros/MWh only considering their injected energy, respectively. If all dispatchable RES are not producing where excess of VRES exists, it is possible to reduce curtailments in almost 22% to 2.7 TWh, around 0.8% of the total demand, and the number of hours with curtailments to 555 (see
Figure 6). Consequently, the minimum net-load increases and the number of hours where the Portuguese net load is lower than −3500 MWh reduces to 122 h, reducing the total number of market-splitting hours. Naturally, if flexible solutions were considered, the need for curtailments could be substantially reduced. The market remuneration of PV is more than enough to guarantee a return to investors without incentives. In relation to wind farms, their expected remuneration can cover almost all the investments until 2018, and considering an expected decrease in the LCOE of this technology until 2030, their investors can expect a small return from their investments without incentives.
By replacing coal power plants with nuclear power plants, it is also possible to reduce CO
2 emissions to 17 million tons, a slight reduction in relation to the programmed scenario. However, the increase in the installed capacity of nuclear power plants increases the need for energy flexibility. The optimal number of hours needed to compensate for the lack of flexibility of nuclear power plants ascends to 2730, more 26% than in the programmed scenario. To compensate for the lack of flexibility of nuclear technologies, there is a need for 9214 MW of power flexibility and 8 TWh of energy flexibility, around 25% and 63% more than in the programmed scenario, respectively. The pumping capacity of 8490 MW is not enough to satisfy this need. Therefore, an investment in more power flexibility around 724 MW could avoid higher quantities of VRES curtailments or be dependent of exporting to neighbouring markets to avoid such curtailments. This investment can be done through more pumping capacity, new storage options, demand response or sector coupling. To completely avoid curtailments, there is a need for 25.7 GW of flexible power and 18 TWh of flexible energy, around 8% and 33% more than in the programmed scenario, respectively. In conclusion, when comparing with the programmed scenario by the local governments of the Iberian Peninsula, this cooperative scenario could give better results, as summarized in
Table 11.
The key indicator of this study is the increase in market prices from 40.49 Euros/MWh to 65.72 Euros/MWh just by considering that natural-gas technologies (CCGT) bid their expected LCOE instead of their marginal cost. This consideration can allow the economic sustainability of all market participants without capacity mechanisms, incentives and other externalities. This assumption is also reasonable because of the need to adequately remunerate flexibility and it incentivizes the investment in other sources of flexibility such as hydrogen, BESS and demand response. Naturally, considering these flexibility sources in the model could compensate the lack of flexibility of nuclear power plants such as the need to curtail VRES, but it is out of the scope of this work. The power systems of the Iberian Peninsula are also very dependent on the natural gas technology that with the increasing tendency in the prices of the natural gas and CO2 emissions will tend to be very expensive. Governments should consider replacing these power plants with Hydrogen-fired power plants, reducing costs and CO2 emissions.
5.3. The Most Reliable Transition from 2018 to 2030
The optimal solution of 2018 has a yearly cost of 7710 MEuros with the nRESL. This solution suggests the investment in 3460 MW of the nuclear technology and the retirement of 2499 MW of the natural-gas technology in relation to the real installed capacity in 2018. However, the optimal solution of 2030 only suggests the investment in 1814 MW of the nuclear technology and the retirement of only 47 MW of the natural-gas technology. Against this background, the unnecessary investment in 1646 MW of the nuclear technology by 2018 will result in a loss of 8878 MEuros. Furthermore, the inefficient retirement of 2452 MW of the natural-gas technology by 2018 will result in a loss of 2097 MEuros, which results in the unnecessary investment in the new capacity of this technology by 2030.
By imposing restrictions to the model, considering that in 2018 the installed capacity of each technology cannot surpass the 2030 optimal solution, it is possible to reduce the losses around 10,966 MEuros, considering that the most reliable solution in 2018 only increases the yearly system costs around 9 MEuros (0.12%) in relation to the optimal solution. The use of capacity constraints in the model may not provide the optimal solution for a given time horizon but allows for minimizing the long-run costs of the power system by avoiding inefficient investments and retirements of capacity that can give substantial economic losses.
6. Final Remarks and Future Work
Considering the Paris Agreement, the European Union set ambitious targets to use renewable energy in all sectors of activity. Against this background, all EU countries established their National Energy and Climate Plans (NECP), considering renewable penetrations higher than 60% in the power sector and expecting reductions in CO2 emissions higher than 50% until 2030. The NECPs of Portugal and Spain indicated the expected installed capacity of these countries by 2030. In the specific case of the Iberian Peninsula, the RES penetration in the power system should be higher than 65% and the reduction in the CO2 emissions should be 51% in relation to 2018.
Considering the Iberian Peninsula expected RES capacity by 2030, this study obtains the non-RES thermal optimal least-cost system of this peninsula considering the cooperation between Portugal and Spain. This study does not make changes to the expected RES installed capacity by 2030, assuming the governments studies/decisions presented in their NECPs. This is a theoretical study that does not take into account each country policy in relation to the installed capacity of each thermal power plant. Against this background, considering 2018 as reference, the main findings of this study in relation to the 2030 programmed capacity are:
The Iberian cooperative least-cost system optimization contributed to an improvement in the programmed scenario in relation to the following points:
Obtain the Iberian least-cost thermal mix by 2030 considering a reliable cooperation between Portugal and Spain, and compare it with the programmed scenario (see
Table 1 and
Table 7);
Complete retirement of the coal and fuel-oil power plants, reducing system costs by 17.40% (see
Table 5 and
Table 8);
A better design of the thermal capacity contributing to a reduction in CO2 emissions by 4.76%;
Strategic idling of all dispatchable power plants when the net load is negative, contributing to a reduction of 21.93% in the VRES curtailments;
The previous two points contributed to a reduction of 43.26% in the number of market-splitting hours;
Strategic bidding of CCGT considering their expected LCOE, increasing market prices by 62.29% and thus contributing to the economic sustainability of all technologies without capacity mechanisms and other externalities such as VRES incentives;
By considering a more reliable transition from 2018 to 2030, limiting each technology’s maximum capacity in 2018 by the 2030 optimal capacity, it is possible to avoid inefficient investments and retirements of capacity, reducing economic losses by 10,966 MEuros.
However, because of the increase in the installed capacity of nuclear power plants, this optimization also contributes to an increase in the need for flexible power and energy around 8% and 33%, respectively.
Unfortunately, this study cannot cover all open issues, but the literature already has proposed solutions to the following concerns:
The complementarity between the VRES and load can be achieved by strategic decisions in relation to the VRES installed capacity and their geographical locations, considering historical and future resources’ availability;
The problem with the increasing variable cost of CCGT can be avoided by a continuous replacement of these power plants by hydrogen-fired power plants, or other technically equivalent dispatchable power plants, when they start to be economically favourable;
To avoid curtailments and market splitting, the interconnection capacity and the flexibility portfolios should increase. Furthermore, system operators should consider the use of dynamic line rating (DLR) and optimal power flow (OPF) methodologies when planning dispatch and detecting congestions;
An increase in the flexibility portfolios could also compensate the lack of flexibility of nuclear power plants that should be gradually replaced by more flexible power plants.
Future work is intended to avoid market splitting and curtailments by considering the strategic use of DLR, OPF and flexibility options by TSOs.


