Abstract
To achieve the decarbonization objectives described in the Paris Agreement, thermal appliances’ electrification is considered an essential factor. Unfortunately, the substitution of thermal appliances with electric alternatives will inevitably increase the load on the national electric system; thus, it is crucial to perform analyses to assess these policies’ impact. This paper, using as a reference the electrification pathways studied by Besagni et al. employing the MOIRAE (bottom-up MOdel to compute the energy consumption of the Italian REsidential sector) model, calculates the energy and power increase in the residential sector in 2030 due to the substitution of different thermal appliances and discusses potential policies to take into account the effect of their implementation on the Italian electric system. Even if the current generation capacity can sustain the electrification process without problems, investments will be needed to limit the possibility of congestions on transmission lines connecting the country’s northern and southern parts.
1. Introduction
In the last few years, global warming has become one of the most critical issues in public opinion, as emissions of carbon dioxide and other greenhouse gases have already caused an increment in the global average temperature of 0.9 °C in 2019 concerning the 1901–2000 average [1]. In 2015, different nations around the world had signed the Paris Agreement [2], intending to limit the global temperature increase well below 2.0 °C utilizing technological development, international cooperation and decarbonization; the agreement is also aimed at strengthening the ability of vulnerable countries to deal with the harmful effects of global warming. The deliverables of the Paris Agreement have been the basis for the European Green Deal [3], issued by the European Union to define the main objectives regarding the efficient use of resources and pollution reduction, which can be summarised as follows:
- investing in environmentally-friendly technologies;
- supporting industry to innovate;
- rolling out cleaner, cheaper and healthier forms of private and public transport;
- decarbonizing the energy sector;
- ensuring buildings are more energy efficient;
- working with international partners to improve global environmental standards.
These objectives are implemented in the single countries of the Union employing national plans, like the Italian “Integrated National Energy and Climate Plan” (“Piano Nazionale Integrato per l’Energia ed il Clima”, PNIEC) [4], describing the main goals to be reached by 2030 regarding energetic and climate policies. In particular, it is expected to reduce greenhouse gas emissions of 33% for 2005 and a reduction in primary energy consumption of 43% to the PRIMES results (Price-Induced Market Equilibrium System) 2007 scenario.
The Italian residential sector accounted for 26.9% (31,956 ktoe) of the total final energy consumption in the country in 2018; this consumption is supplied mainly by the use of natural gas (16,500 ktoe, equal to 51.6% of total consumption) and wood (6410 ktoe, equivalent to 20.1% of total consumption), while electricity is just the third most used energy vector in households, with consumption of 5600 ktoe (equal to 17.52% of total consumption) [5]. To reduce the greenhouse emissions of this sector fossil fuels should be gradually phased out in favour of other alternatives; for instance, electricity-powered heat pumps can replace gas-powered heating systems, and induction cookers can be installed in place of traditional stoves, etc. Unfortunately, the electrification of the residential sector per se is not sufficient to solve the problem of domestic carbon emissions; indeed, the environmental impact of electric consumption is heavily reliant on the generation mix in the country. In particular, in Italy, only 39.8% of energy supply was provided by low carbon sources in 2018, while 45% of generation was still produced using natural gas [6]. Additionally, the shift of residential consumption from fossil fuels to electricity will cause a substantial increase in electric energy demand, which has to be matched by an increase in total generation and large investments in grid infrastructure.
Different studies have tried to analyze the impact of electrification on electric networks: Veldman et al. [7] estimated the load profile of micro-CHP (Combined Heat and Power) and heat pumps intending to apply them to residential load profiles to determine their impact on distribution and transmission grids. Blonsky et al. [8] reviewed the expected evolution of certain electric technologies, like electric vehicles and electric space heating, to determine the increase in electric energy demand; in their opinion, network investments will be needed soon to assess the impact of electric consumption growth. Dyke et al. [9], after establishing the load characteristics of electric vehicles, analyzed their energy usage and storage, to then apply their findings to the European residential context, to evaluate the network effects of increasing electric energy consumption; as battery-powered electric vehicles can be used for residential load smoothing, it is possible to achieve a symbiotic relationship between electric transport and electrical systems, improving network operation.
This paper aims to discuss the impact of electrification pathways for the Italian residential sector by providing estimates regarding the increase in electric energy consumption in the country and formulating a hypothesis about the interventions needed on the electric system to sustain these policies. The main focus is put in the 2020–2030 period and the scenarios studied by Besagni et al. [10] are used as a reference for the electrification pathways discussed. Section 2 briefly describes how the model used for the computation of the electrification scenarios works, Section 3 shows the model’s results, while Section 4 is dedicated to discussing the impact of the pathways application on the electric system. Finally, Section 5 summarizes the main results of the study.
2. Methods
To estimate the amount of the new electric energy that will be consumed following the electrification process, the MOIRAE (bottom-up MOdel to compute the energy consumption of the Italian REsidential sector) model developed by Besagni et al. [10,11] is exploited. The model is built to take as input data released by the Italian Institute of Statistics (ISTAT) and uses them to estimate the residential energy consumption for each primary energy carrier in the whole country in the 2002–2040 period. In particular, the model is able, by setting some hypothesis, to study the implementation of decarbonization scenarios, where home appliances that work using thermal energy sources are replaced with alternatives that utilize electricity. Thus, it is possible to obtain information on the changes in residential energy consumption during the years due to the implementation of electrification policies.
The primary input of the model is a dataset, released by ISTAT, named “Indagine sui consumi energetici delle famiglie” (“household’s energy consumptions survey”) [12], that contains detailed information regarding both the socio-demographic characteristics and the energy consumption data of 20,000 Italian households in 2013; from this data, MOIRAE can compute an estimate of the Italian residential energy consumption for that year. Calculations for different years are calculated utilizing a sub-model, that uses population forecasts from ISTAT to adjust the single households’ socio-demographic characteristics of the original dataset, modelling population changes during the years. It is thus possible to obtain an estimate of residential energy consumption from 2002 to 2040. Another sub-model is dedicated to computing Italian families’ economic possibilities by using market surveys and price databases, providing an estimate for the household budget for energy efficiency investments.
MOIRAE has been used to study some electrification pathways for the residential sector by replacing thermal appliances inside households with electrical alternatives. The period considered for electrification goes from 2021 to 2040, and four main scenarios have been analyzed. They have been identified by dividing the main thermal appliances used in households depending on their field of use (cooking, space heating, water heating); this way it is possible to analyze the impact of the electrification process due to each component of the residential energy consumption, to better identify where substitution leads to improvements in energy consumption and household expenses.
- Scenario 1: Traditional ovens and stoves are replaced with electric ovens and induction stoves, respectively.
- Scenario 2: Autonomous thermal heating appliances are replaced with heat pumps
- Scenario 3: Autonomous thermal domestic hot water heating (DHW) appliances are replaced with heat pumps.
- Scenario 4: Criteria applied in previous scenarios are used jointly.
In particular, in Scenario 4, it is possible to exploit single heat pumps to satisfy the need for heating and DHW, thus further reducing energy consumption. The procedure used to define the criteria for heat pumps selection are kept unchanged from former analyses performed by Besagni et al. [10,11], where the type of heat pump installed depends on the former kind of heating/DHW system present in the household. Assumptions regarding household members’ habits regarding appliances usage are kept constant, to isolate the effect of energy vector changes. Additionally, no self-consumption scheme is considered in each scenario, and electric energy is assumed to be provided exclusively by the national grid.
The electrification process is assumed to be linear: after computing the difference in electric energy consumption in 2040 between the base case (no substitution) and the chosen scenario, annual electrification equal to 5% of the new electrical energy installed is imposed. Additionally, the order by which thermal appliances are replaced depends both on the amount of thermal energy consumed by households and on the economic possibilities of families; the whole dataset can thus be divided into clusters based on these variables, where wealthier families with a high thermal consumption have a higher priority on appliances’ substitution. Figure 1 describes more in detail the process of division in clusters. Each family’s household budget is determined by considering three variables (Table 1), computed by using the economic sub-model previously described.
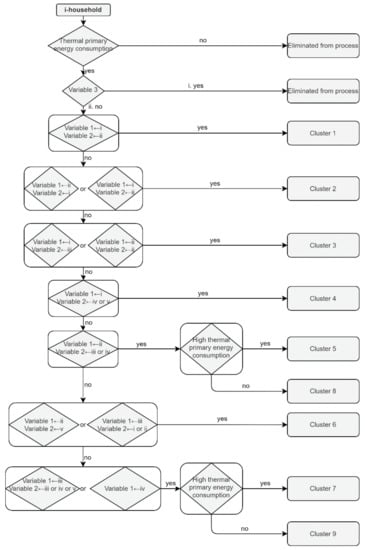
Figure 1.
Process for subdivision in a cluster depending on household budget constraints. Re-printed with permission from ref. [10]. Copyright © 2021 Elsevier B.V., License Number: 4964651134268.

Table 1.
Description of the variables used for the clustering process.
After eliminating from the process households with no thermal consumption or in conditions of absolute poverty (defined by Variable 3), families with high economic resources (Variable 1 considered “Excellent”) and high economic resources improvement (Variable 2 considered “Greatly improved”) are selected to define Cluster 1. From there, higher values for Variables 1 and 2 are used to determine the subsequent clusters. In some cases, the level of thermal energy consumption in the household is also used as a variable to select the cluster of destination; higher consumptions will lead to being directed to a higher ranking cluster.
The annual electric energy consumption obtained in the base case and all the different scenarios can be converted into daily power profiles, to study the impact that electrification pathways have on the national grid. The average daily profiles for electric consumption must be defined for all the appliances involved in the electrification to perform this process. Figure 2 provides the profiles used as a reference in this paper:
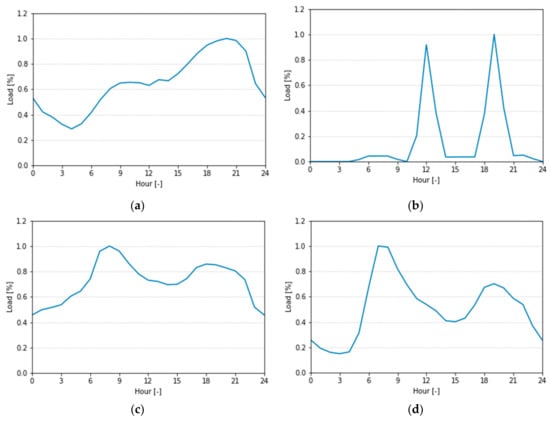
Figure 2.
Daily load profiles for electric consumption. (a) Residential daily load curve; (b) Cooking appliances daily load curve; (c) Heating appliances daily load curve; (d) Water heating appliances daily load curve.
- The residential average daily load profile has been taken from Lazzeroni et al. [13];
- The daily load curve for cooking appliances has been taken from Lombardi et al. [14];
- The daily load curve for heating has been taken from Love et al. [15], considering a winter day with 0 °C external temperature as a reference;
- The daily load curve for DHW has been taken from Kondoh et al. [16].
As the usage of heating appliances varies enormously during the year, the annual heating duration curve, where the 8760 h in a year are sorted in descending order based on their total heating power load, has been taken into consideration (Figure 3), using as a reference the one provided by Calise et al. [17].
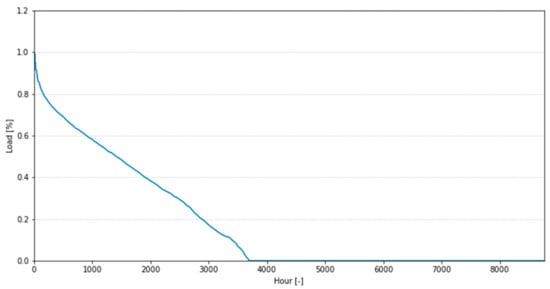
Figure 3.
Annual heating duration curve.
The following procedure has been applied to convert the yearly electric energy consumptions of the four scenarios into daily load profiles. First, the total residential electricity consumption in 2030 for the base case () is used to compute the maximum residential power () by using the following equation:
The maximum power is then multiplied by the residential load profile’s per-unit hourly powers () to obtain the total residential daily load in the base case. For Scenario 1 and Scenario 3, the following equations are applied to the difference between the annual electric consumption in the scenario and the electric consumption in the base case ( for Scenario 1, for Scenario 3), to compute the maximum additional power due to the electrification process ( for Scenario 1, for Scenario 3).
The maximum powers obtained are then multiplied by the per-unit hourly powers of the load profile of the substituted appliances (cooking for Scenario 1 (), DHW for Scenario 3 (). The resulting curve is combined with the base case’s load profile, thus resulting in the total residential daily load in the scenario. For Scenario 2 the procedure is slightly different: in this case, the maximum power () is computed from the additional electric consumption () by considering the following equation, where the per-unit powers of the annual heating duration curve () are taken into account:
The resulting maximum power is then applied to the heating daily load curve, to obtain the total electric load due to heating in the worst possible condition (i.e., coldest day of the year). This profile is then combined with the Base Case load profile to produce the total residential daily load profile for Scenario 2. As Scenario 4 is obtained from the electrification of all the sectors studied in the other three scenarios, the different contributions are disaggregated and modelled to receive the daily curves for cooking, heating and DHW using their relative procedure, combining them in the end to get the total residential daily load curve for Scenario 4.
3. Results
The original paper from Besagni et al. [10] already studied the effects of electrification in the four scenarios, both from an energetic and an economic point of view; the study’s main findings can be summarised in Figure 4. The results are shown in terms of total costs and primary energy consumptions, calculated considering electricity provided by the national grid, in the actual Italian energy mix production.
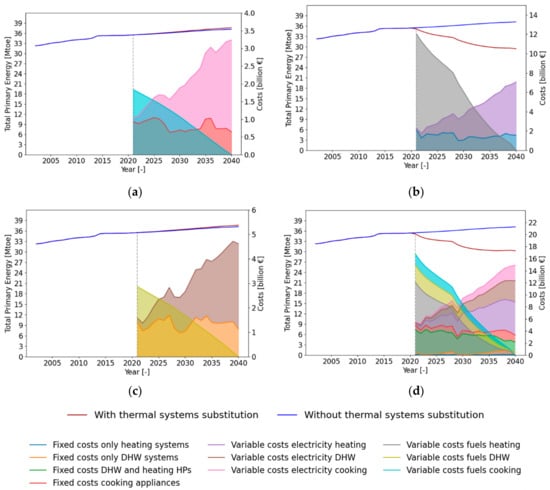
Figure 4.
Electrification pathways under households’ budget constraints in the four scenarios. Reprinted with permis-sion from ref. [10]. Copyright © 2021 Elsevier B.V., License Number: 4964651134268. (a) Scenario 1; (b) Scenario 2; (c) Scenario 3; (d) Scenario 4.
It has been observed that in Scenario 1 and Scenario 3, where thermal cooking and DHW appliances are replaced with electric alternatives, there is no improvement in terms of primary energy consumption reduction, whereas costs sustained by households increase heavily; this means that the electrification of these sectors on their own is not convenient and should be discarded. On the other hand, Scenario 2 and 4, related to the electrification of heating and the whole household thermal appliances, lead to a remarkable reduction in energy consumption and a decrease in total costs sustained by households; these scenarios are thus more convenient to implement.
These results are in contrast with the work of Eguiarte et al. [18], where heating decarbonization by use of heat pumps is considered to be an inefficient solution, both economically and environmentally, concerning the implementation of other non-electric heating systems, like district heating and oil boilers. On the other hand, Sheikh et al. [19] consider electrification the most effective way to tackle carbon reduction, as it allows to achieve complete decarbonization with costs that are 25–90% lower concerning other options. Additionally, Steinberg et al. [20] regard electrification as an effective way of reducing greenhouse emissions, pointing out the necessity to combine it with additional strategies to achieve complete decarbonization.
Starting from this point, it is possible to study the distribution of the electric energy increase in different areas of the country in the 2020–2030 period, in all the other cases. Figure 5 shows the increase in residential electric energy usage in the base case, where no substitution has been performed, while Figure 6 shows the effects of the electrification in the different electrification pathways considered.
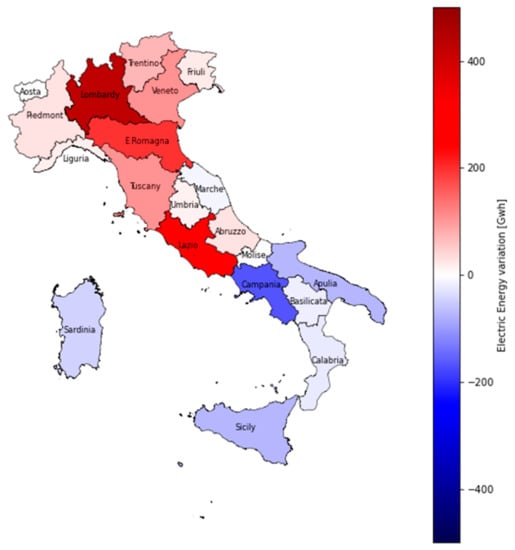
Figure 5.
Residential electric energy increase (2020–2030 period, Base Case).
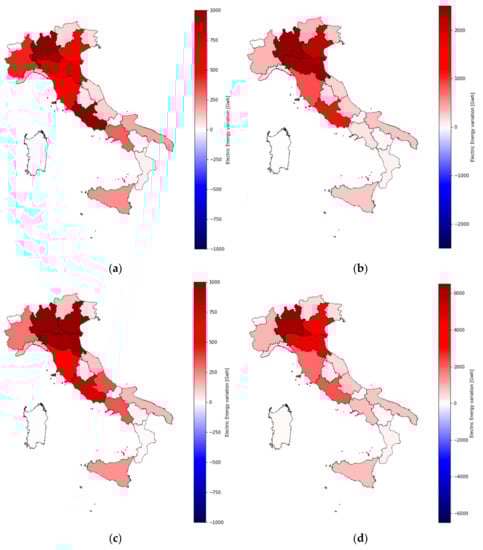
Figure 6.
Distribution of the electric energy consumption increase in the 2020–2030 period. (a) Scenario 1; (b) Scenario 2; (c) Scenario 3; (d) Scenario 4.
If no electrification pathway is carried out (Figure 5), the variation in residential electric energy consumption is influenced just by population changes over the years; in particular, as in the next few years, migrations from rural to urban areas and from South to North are expected, causing an increase in electric energy consumption in regions such as Lombardy, Emilia-Romagna and Lazio, while other areas such as Campania, Apulia and Sicily are expected to shrink their consumption. Nonetheless, variations in electric energy consumption are relatively small, in the order of a few hundreds of GWhs.
In the electrification pathways, the substitution of thermal appliances with electrical alternatives during the years causes a considerable increment in electric energy consumption; it can be seen that, in every scenario, the increase is concentrated mostly in the Northern part of the country, probably due to a higher population density, as supported by the fact that in regions such as Aosta Valley and Trentino-South Tyrol this increment is mainly contained. The increase in electric energy consumption also largely varies between scenarios: excluding Scenario 4 (which is obtained by the combination of the other ones), Scenario 2 shows an increase in consumption much larger than the one observed in Scenario 1 and Scenario 3.
Table 2 summarizes the variations in electric energy consumption in the three cases for all Italian regions, also highlighting the relative increase concerning 2020. It is possible to see how, in the base case, the increases in electric energy consumption are meagre if compared to the values observed in 2020, with the highest growth being inferior to 5% of the 2020 value. However, in Scenario 2 and Scenario 4, the consumption increases are much larger, especially in the latter case, where for some regions (Veneto, Emilia-Romagna) the electric energy consumption is almost doubled concerning 2020.
Table 2.
Electric energy consumption increase in the 2020–2030 period.
The daily load profiles for all the electrification scenarios are shown in Figure 7. It can be seen that the load increase with respects to 2020 in the base case is negligible, and the two curves are almost overlapped; also, the load increase in Scenario 3 is minimal despite a rise of 13.6% in annual energy consumption, due to the uniform distribution of the load during the day. On the other hand, for Scenario 1, two spikes are visible in the early afternoon and evening; that is because, despite the small increase in total energy consumption, usage of cooking appliances is concentrated in the hours where most of the people have lunch or dinner. The increase in electric load in Scenario 2 is more severe, with an increment of several GWs of load throughout the day. As heating appliances’ usage is higher in the morning hours, there is also a noticeable distortion of the residential load profile between 6 a.m. and 10 a.m. Finally, Scenario 4 combines all the other pathways’ effects, severely altering the residential load profile and massively increasing the amount of power needed to feed all the loads.
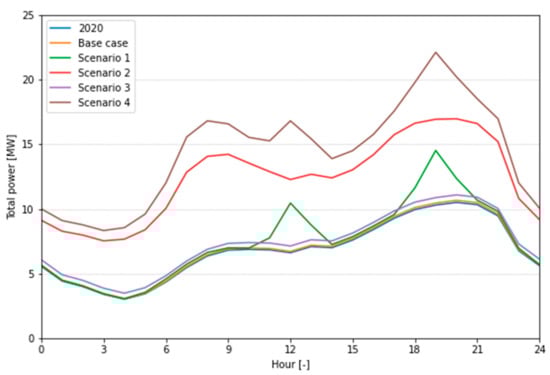
Figure 7.
Total residential daily consumption for the electrification pathways.
Table 3 shows the peak load increase in each scenario, summarizing the impact of the national grid’s electrification pathways. It can be seen that the increment in peak power is very low for the base case and Scenario 3, becoming more significant for Scenario 1 and Scenario 2; in Scenario 4 the increment is enormous, more than doubling the peak power demand.
Table 3.
The peak power increase in the electrification pathways.
4. Discussion
It has been found that the electrification pathways for the residential sector cause an increment in the national electric load in the order of several GW; it is thus essential to discuss the effect of these increases on the Italian national electric system. Terna, the Italian TSO, provides information and statistics regarding the national electric grid [21]: the total installed generation capacity in the country in 2020 is equal to 115.90 GW; nonetheless, just a fraction of this power is used to satisfy the electric energy demand, as the highest power recorded by Terna in the last six years was equal to 60.24 GW, with 10.5 and 8.4% of power covered by foreign exchange and self-consumption, respectively. This means that, even with Scenario 4, there is still enough spare capacity that can be used to sustain the peak power increase. Nonetheless, the generation mix used to sustain the additional load should be discussed: if the Italian electric generation in 2019 is considered, 57.33% of total energy is produced utilizing thermal power plants; if the additional electric energy consumption in 2030 for Scenario 4 is considered with the same energetic mix, and if the primary energy conversion factors defined by “Decreto interministerial 26 giugno 2015” [22], the additional primary energy consumption due to non-renewable energy will be equal to 4.34 Mtoe. As the thermal energy consumption avoided due to substitution in Scenario 4 in 2030 is equal to 9.34 Mtoe, the net reduction in primary energy consumption due to fossil fuel will be around 5 Mtoe.
The previous results are valid if no changes to the generation mix are performed, and if no improvements on energy efficiency are achieved, that is, in the worst-case scenario. However, in the last few years, the amount of renewable energy sources installed in Italy has hugely increased, going from 16% in 2007 to 33.9% in 2018 [23], mainly due to economic incentives [24] and reduction in the cost of photovoltaic systems [25]. Furthermore, to comply with the objectives of the European Green Deal [3], the Italian government, in the “Integrated National Energy and Climate Plan” [4], recently set a target of 30% of gross final energy consumption supplied by RES, even though some studies forecast that this objective will not be reached due to a diminishing rate in renewable energy increase [26]. Additionally, in the same document, a 43% reduction in primary energy consumption with respect to the PRIMES 2007 scenario due to efficiency improvements is set as an objective.
The Italian transmission network operation is characterized by an internal power flow moving from southern to northern regions, due to the high generation capacity installed in the South market zone and the enormous energy consumption of the northern part of the country [27]. The electrification scenarios studied highlight an increase in residential energy consumption, especially in regions such as Lombardy and Emilia-Romagna; thus, the current power flow internal exchanges will most probably maintain the same structure an increment in the power transferred from South to North. To tackle this situation, investments on the transmission infrastructure will be needed to limit congestions on high-voltage lines in the country’s central part. Additionally, the effects on distribution networks in residential areas should be considered; as pointed out by Calderón [28], the increase in electricity consumption due to electrification will cause additional stress on secondary substations during peak hours ranging from 59 to 95%, making investments in distribution networks necessary in the most critical areas. Investments in new generation plants, especially in the North, could determine the increase in the internal power flux; from this point of view, Northern Italy is currently characterized by a renewable supply composed mainly by hydroelectric plants [29], due to the massive presence of waterways along the Alps. Unfortunately, as most of the available sites for hydroelectric production have already been exploited [30], attention should be directed toward alternative sources, such as, for instance, photovoltaic generation, as prices for this technology are getting progressively cheaper even without incentives [31] and rooftop installation would allow limiting the amount of land needed for plant construction. Balezentis et al. [32] also found, utilizing a questionnaire survey, a high willingness to pay for renewable energy implementation, primarily due to growing environmental concerns. Regarding this type of solution, Bellocchi et al. [33] point out the negative effects of heating electrification on renewable penetration, due to the mismatch in demand and generation peak hours, even though the usage of thermal storage devices could limit this issue, as shown by Gaur et al. [34] It is also possible to exploit the opportunities provided by the establishment of energy communities [35], where self-produced energy is exchanged between a certain number of users without passing from the national grid, thus relieving the stress on the energy system.
5. Conclusions
This work analyzed the results of the Italian residential sector’s electrification pathways applying the MOIRAE model and extending the discussion carried out by Besagni et al. [10] from the infrastructure point of view. In particular, the electric energy and power increases, due to the substitution of the most common thermal appliances, have been used to estimate the national electric system’s impact with a 2030 perspective. Depending on the scenario considered, the effects on electricity consumption vary from almost negligible to massive, especially when electrification of one or more technologies is applied. The increase in power peaks, even in the least favourable conditions, can be supplied without problems by the current generation capacity installed in the country and, even without changes in the energetic mix, a sharp reduction in fossil fuels usage has been achieved, that can be further enhanced by implementing policies focused on renewable energy implementation and efficiency improvements. The most critical factor regarding the implementation of the pathways regards the transmission grid’s impact; as substitution is performed mainly in Northern Italy, the power flux from South to North is going to rise, increasing the frequency of congestions between market zones. To limit this problem, investments are needed both to increase the capacity of transmission lines in the central part of the country and to build new generation plants in northern regions; this second objective can be achieved with the extensive adoption of rooftop photovoltaic as a source of energy for the residential sector, also by establishing local energy communities to better exploit renewable production without jeopardizing network stability.
Author Contributions
Conceptualization, M.B. and G.B.; methodology, A.T., L.P.V., M.B. and G.B.; software, A.T. and L.P.V.; formal analysis, A.T.; investigation, A.T. and L.P.V.; data curation, A.T. and L.P.V.; writing—original draft preparation, A.T.; writing—review and editing, A.T., L.P.V. and G.B.; visualization, A.T.; supervision, M.B. and G.B.; project administration, M.B. All authors have read and agreed to the published version of the manuscript.
Funding
This research received no external funding.
Institutional Review Board Statement
Not applicable.
Informed Consent Statement
Not applicable.
Data Availability Statement
The data presented in this study are openly available in Table 3 and Figures 8–15 at https://doi.org/10.1016/j.energy.2020.119438, reference number Energy 2020, 217, 119438.
Acknowledgments
This work has been financed by the Research Fund for the Italian Electrical System in compliance with the Decree of Minister of Economic Development 16 April 2018.
Conflicts of Interest
The authors declare no conflict of interest. The funders had no role in the design of the study; in the collection, analyses, or interpretation of data; in the writing of the manuscript, or in the decision to publish the results.
References
- Lindsey, R.; Dahlman, L. Climate Change: Global Temperature. 2020. Available online: https://www.climate.gov/news-features/understanding-climate/climate-change-global-temperature#:~:text=According%20to%20the%20NOAA%202019,more%20than%20twice%20as%20great (accessed on 30 November 2020).
- United Nations. Paris Agreement; United Nations: New York, NY, USA, 2015. [Google Scholar]
- European Commission. The European Green Deal. In Communication from the Commission; To the European Parliament, the European Council, the Council, the European Economic and Social Committee and the Committee of the Regions; European Commission: Brussels, Belgium, 2019. [Google Scholar]
- Ministero dello Sviluppo Economico. Piano Nazionale Integrato per l’Energia ed il Clima; Ministero dello Sviluppo Economico: Rome, Italy, 2020. [Google Scholar]
- Odyssee-MURE. Odyssee Database. 2020. Available online: https://www.indicators.odyssee-mure.eu/energy-efficiency-database.html (accessed on 1 December 2020).
- Statista. Energy Mix in Italy in 2018. 2020. Available online: https://www.statista.com/statistics/873552/energy-mix-in-italy (accessed on 30 November 2020).
- Veldman, E.; Gibescu, M.; Slootweg, H.; Kling, W.L. Impact of electrification of residential heating on loading of distribution networks. In Proceedings of the 2011 IEEE Trondheim PowerTech, Trondheim, Norway, 19–23 June 2011; IEEE: New York, NY, USA, 2011. [Google Scholar]
- Blonsky, M.; Nagarajan, A.; Ghosh, S.; McKenna, K.; Veda, S.; Kroposki, B. Potential impacts of transportation and building electrification on the grid: A review of electrification projections and their effects on grid infrastructure, operation, and planning. Curr. Sustain. Renew. Energy Rep. 2019, 6, 169–176. [Google Scholar] [CrossRef]
- Dyke, K.J.; Schofield, N.; Barnes, M. The impact of transport electrification on electrical networks. IEEE Trans. Ind. Electron. 2010, 57, 3917–3926. [Google Scholar] [CrossRef]
- Besagni, G.; Vilà, L.P.; Borgarello, M.; Trabucchi, A.; Merco, M.; Rodeschini, J.; Finazzi, F. Electrification pathways of the Italian residential sector under socio-demographic constrains: Looking towards 2040. Energy 2020, 217, 119438. [Google Scholar] [CrossRef]
- Besagni, G.; Borgarello, M.; Vilà, L.P.; Najafi, B.; Rinaldi, F. MOIRAE–bottom-up MOdel to compute the energy consumption of the Italian REsidential sector: Model design, validation and evaluation of electrification pathways. Energy 2020, 211, 118674. [Google Scholar] [CrossRef]
- ISTAT. Indagine sui Consumi Energetici delle Famiglie; ISTAT: Rome, Italy, 2013. [Google Scholar]
- Lazzeroni, P.; Moretti, F.; Stirano, F. Economic potential of PV for Italian residential end-users. Energy 2020, 200, 117508. [Google Scholar] [CrossRef]
- Lombardi, F.; Rocco, M.V.; Colombo, E. A multi-layer energy modelling methodology to assess the impact of heat-electricity integration strategies: The case of the residential cooking sector in Italy. Energy 2019, 170, 1249–1260. [Google Scholar] [CrossRef]
- Love, J.; Smith, A.Z.P.; Watson, S.; Oikonomou, E.; Summerfield, A.; Gleeson, C.; Biddulph, P.; Chiu, L.F.; Wingfield, J.; Martin, C.; et al. The addition of heat pump electricity load profiles to GB electricity demand: Evidence from a heat pump field trial. Appl. Energy 2017, 204, 332–342. [Google Scholar] [CrossRef]
- Kondoh, J.; Lu, N.; Hammerstrom, D.J. An evaluation of the water heater load potential for providing regulation service. In Proceedings of the 2011 IEEE Power and Energy Society General Meeting, Detroit, MI, USA, 24–28 July 2011; IEEE: New York, NY, USA, 2011. [Google Scholar]
- Calise, F.; D’Accadia, M.D.; Barletta, C.; Battaglia, V.; Pfeifer, A.; Duic, N. Detailed modelling of the deep decarbonization scenarios with demand response technologies in the heating and cooling sector: A case study for Italy. Energies 2017, 10, 1535. [Google Scholar] [CrossRef]
- Eguiarte, O.; Garrido-Marijuán, A.; de Agustín-Camacho, P.; del Portillo, L.; Romero-Amorrortu, A. Energy, environmental and economic analysis of air-to-air heat pumps as an alternative to heating electrification in Europe. Energies 2020, 13, 3939. [Google Scholar] [CrossRef]
- Sheikh, I.; Callaway, D. Decarbonizing space and water heating in temperate climates: The case for electrification. Atmosphere 2019, 10, 435. [Google Scholar] [CrossRef]
- Daniel, S.; Dave, B.; Josh, E.; Kelly, E.; Jeff, L.; Trieu, M.; Colin, M.; Andrew, P.; Laura, V.; Eric, W. Electrification and Decarbonization: Exploring US Energy Use and Greenhouse Gas Emissions in Scenarios with Widespread Electrification and Power Sector Decarbonization; United States Department of Energy: Washington, DC, USA, 2017. [Google Scholar]
- Terna. Transparecy Report. 2020. Available online: https://www.terna.it/en/electric-system/transparency-report (accessed on 6 December 2020).
- Ministero dello Sviluppo Economico. Decreto Interministeriale 26 Giugno 2015; Ministero dello Sviluppo Economico: Rome, Italy, 2015. [Google Scholar]
- Statista. Share of Energy from Renewable Sources in Electricity Generation in Italy from 2007 to 2018. 2020. Available online: https://www.statista.com/statistics/419443/italy-share-of-electricity-from-renewable-sources (accessed on 6 December 2020).
- Di Dio, V.; Favuzza, S.; La Cascia, D.; Massaro, F.; Zizzo, G. Critical assessment of support for the evolution of photovoltaics and feed-in tariff (s) in Italy. Sustain. Energy Technol. Assess. 2015, 9, 95–104. [Google Scholar] [CrossRef]
- Kavlak, G.; McNerney, J.; Trancik, J.E. Evaluating the causes of cost reduction in photovoltaic modules. Energy Policy 2018, 123, 700–710. [Google Scholar] [CrossRef]
- Şahin, U. Future of renewable energy consumption in France, Germany, Italy, Spain, Turkey and UK by 2030 using optimized fractional nonlinear grey Bernoulli model. Sustain. Prod. Consum. 2020, 25, 1–14. [Google Scholar] [PubMed]
- Lightbox. Electricity: The Italian Region’s Identikit. 2020. Available online: https://lightbox.terna.it/en/energy-regional-consumption-2018 (accessed on 6 December 2020).
- Calderón, C.; Underwood, C.; Yi, J.; Mcloughlin, A.; Williams, B. An area-based modelling approach for planning heating electrification. Energy Policy 2019, 131, 262–280. [Google Scholar] [CrossRef]
- Statista. Number of Hydroelectric Power Plants in Italy 2020, by Region. 2020. Available online: https://www.statista.com/statistics/888390/number-of-hydroelectric-power-plants-by-region-in-italy (accessed on 6 December 2020).
- Italian Physical Society. Energy in Italy: Problems and Perspectives (1990–2020); Italian Physical Society: Bologna, Italy, 2008. [Google Scholar]
- Joint Research Centre. PV Status Report; Joint Research Centre: Brussels, Belgium, 2019. [Google Scholar]
- Balezentis, T.; Streimikiene, D.; Mikalauskas, I.; Shen, Z. Towards carbon free economy and electricity: The puzzle of energy costs, sustainability and security based on willingness to pay. Energy 2020, 214, 119081. [Google Scholar] [CrossRef]
- Bellocchi, S.; Manno, M.; Noussan, M.; Prina, M.G.; Vellini, M. Electrification of transport and residential heating sectors in support of renewable penetration: Scenarios for the Italian energy system. Energy 2020, 196, 117062. [Google Scholar] [CrossRef]
- Gaur, A.; Fitiwi, D.; Curtis, J. Deep electrification of residential heating and possible implications: An Irish perspective. In Proceedings of the E3S Web of Conferences, Barcelona, Spain, 23–26April 2020; EDP Sciences: Paris, France, 2020. [Google Scholar]
- Radl, J.; Fleischhacker, A.; Revheim, F.H.; Lettner, G.; Auer, H. Comparison of profitability of PV electricity sharing in renewable energy communities in selected European Countries. Energies 2020, 13, 5007. [Google Scholar] [CrossRef]
Publisher’s Note: MDPI stays neutral with regard to jurisdictional claims in published maps and institutional affiliations. |
© 2021 by the authors. Licensee MDPI, Basel, Switzerland. This article is an open access article distributed under the terms and conditions of the Creative Commons Attribution (CC BY) license (http://creativecommons.org/licenses/by/4.0/).