Article

Effects of Different Ventilation Strategies on In-Cabin Air Quality During High-Speed Driving

Department of Mechanical and Energy Engineering, National Chiayi University, Chiayi 600355, Taiwan
*
Author to whom correspondence should be addressed.
Pollutants 2025, 5(4), 36; https://doi.org/10.3390/pollutants5040036
Submission received: 31 July 2025 / Revised: 23 August 2025 / Accepted: 10 October 2025 / Published: 14 October 2025

Abstract

When driving at highway speeds, the airtightness and ventilation mode of the cabin can significantly affect the in-cabin air quality. Accordingly, this study conducted on-road driving experiments along four highways in Tainan City, Taiwan, to examine the effects of different ventilation strategies and driving speeds on the concentrations of three pollutants (carbon dioxide (CO2), PM2.5, and PM10) in the cabin of a mid-size sedan. During the test, the vehicle will travel at a constant speed of 60, 70, 80, 90, 100, 110 and 120 km/h depending on the traffic conditions. When driving on the system interchanges, the vehicle speed was maintained at 40 and 50 km/h. Ventilation strategies are divided into fresh air mode and recirculation air mode. The results revealed that leakage ventilation at high speeds allowed more outdoor air to infiltrate the cabin. This reduced the CO2 concentration but slightly increased the particulate matter (PM) when the ventilation system was operated in the recirculation mode. The continuous use of the recirculation air mode for extended periods resulted in a potentially hazardous increase in the CO2 concentration. Thus, periodic switching to the fresh air mode is recommended to ensure that the in-cabin CO2 concentration remains below the ASHRAE threshold of 1000 ppm. In the fresh air mode, the PM2.5 and PM10 concentrations decreased as the vehicle speed increased. In the recirculation mode, the cabin filters maintained lower in-cabin PM levels than in the fresh-air mode. The experimental data were fitted using a curve-fitting technique to quantify the relationships between the vehicle speed and the in-cabin CO2, PM2.5, and PM10 concentrations under the two ventilation strategies. The findings of this study provide useful practical guidelines for optimizing the vehicle ventilation strategy to improve the in-cabin air quality and enhance occupant health and safety during highway driving.

Graphical Abstract

1. Introduction

This study aims to investigate the effects of different ventilation strategies on in-cabin air quality during high-speed driving. When a vehicle is in motion, harmful substances in the atmospheric environment, such as particulate matter (PM), can infiltrate the cabin through body gaps and the air conditioning system under the effect of pressure differentials between the interior and exterior of the cabin. These pollutants pose health risks to the driver and passengers. Therefore, it is usual to operate the vehicle with the windows closed and the air conditioning system set to the recirculation mode. However, prolonged lack of ventilation can increase the carbon dioxide (CO2) concentration within the cabin, potentially causing driver drowsiness and impairing driving safety. Consequently, understanding the air exchange processes within the vehicle cabin and the mechanisms by which pollutants enter and leave the cabin has become a key concern for automotive engineers.
The International Agency for Research on Cancer (IARC) has identified outdoor air pollution as a major contributing factor to cancer mortality [1]. Moreover, medical studies have shown that exposure to PM2.5 can alter vascular reactivity, increase the incidence of cardiovascular diseases, exacerbate atherosclerosis, and raise the risks of lung cancer and ischemic heart disease (Gu et al. [2], Lee et al. [3], Raaschou-Nielsen et al. [4], Cakmak et al. [5]). McGuinn et al. [6] reported that each annual increase of 1 μg/m3 in the PM concentration increases the risk of myocardial infarction by 14.2%. Lanzinger et al. [7] showed that the levels of trace metals and carcinogenic polycyclic aromatic hydrocarbons in PM2.5 are around twice as high as those in PM10, making PM2.5 more hazardous to human health due to its smaller size and deeper penetration. Hassanvand et al. [8] found a positive correlation between long-term exposure to ultrafine particles and mortality rates. Additionally, Barnett-Itzhaki and Leviv [9] noted that PM is not only dangerous in its own right but may also carry viruses and bacteria, further increasing its harmful effects on human health. Gall et al. [10] observed that low air exchange rates during activities such as singing or exercising can lead to the accumulation of suspended droplets and particles in the air, potentially causing large-scale infections. Choi et al. [11] emphasized the heightened vulnerability of virus-infected individuals, especially infants and the elderly, during periods of high PM levels.
Individuals typically spend 80–90% of their time indoors [12]. However, outdoor pollutants readily infiltrate indoor spaces, and thus understanding indoor air quality is an essential aspect of assessing personal exposure to pollutants and the associated health risks. Chen et al. [13] found that the PM2.5 mass and composition levels in indoor environments in Hong Kong were higher than those in other developed countries and exhibited notable seasonal variations. Kendrick et al. [14] observed significant positive correlations between the NO and NO2 concentrations and the traffic volume along urban streets during morning hours (5–10 AM) but a weaker correlation in the evening. The authors also noted that the PM2.5 concentration showed seasonal variations and was strongly associated with regional pollution sources. Prakash et al. [15] measured the PM1.0, PM2.5, and PM10 concentrations before and during the COVID-19 pandemic. Their results revealed a 2–5% decrease in the PM2.5 concentration and a 4–13% drop in the particle number concentration (PNC) during the pandemic.
Although the indoor air quality (IAQ) accounts for much of daily exposure, the time spent commuting also contributes significantly to an individual’s overall exposure to air pollutants. When using public transportation, individuals are exposed to varying PM concentrations owing to changing traffic conditions, such as rush hour congestion, fluctuating speeds, and varying vehicle types. Chuang et al. [16] investigated the personal exposure of office workers to air pollution under different commuting modes (MRT, bus, car, motorcycle, walking, and walking with personal protective equipment) during peak traffic hours. Data were collected on the systolic and diastolic blood pressure, heart rate, and urinary 8-OHdG content. The results showed that motorcycle users experienced the highest exposure levels, followed by pedestrians.
Grange et al. [17] noted that PM originates not only from exhaust emissions but also from unregulated non-exhaust sources, such as brakes, tires, and road wear. Sampling in five Swiss cities showed that city traffic increased the PM10 and PM2.5 concentrations by 2.4 and 2.0 μg/m3, respectively, with road traffic contributing 49% and 62% of the PM2.5 and PM10 mass, respectively, at traffic stations. Beji et al. [18] highlighted the increasing significance of non-exhaust emissions in light of stricter regulations on vehicle exhaust emissions. They analyzed the particle size, shape, and chemical composition of the pollutants along French highways. Under stop-and-go highway conditions, the average concentrations of PM1, PM2.5, and PM10 were 22.5, 26.7, and 30 µg/m3, respectively. In addition, the vehicle speed was directly related to the pollutant level, with a speed of 70 km/h under smooth traffic conditions required to reduce pollution. Jeong et al. [19] examined air pollutants in downtown Toronto and on nearby highways. The results revealed that the PM2.5 trace element concentration in the urban environment was more than twice as high as that on the highways. Moreover, 15–28% of the total PM was traffic related.
Liu et al. [20] suggested that the exposure of people to pollutants can be effectively reduced by using vehicles with air conditioning systems that filter harmful substances from the air. Krall et al. [21] studied drivers commuting by car and found that the PM2.5 level was higher when the car was in motion than when it was stationary. Thus, although the PM2.5 level was correlated with the peak traffic hours, the vehicle speed and traffic density were also important factors. Branco et al. [22] examined the effects of environmental pollutants on the in-cabin air quality of vehicles, taking into account factors such as vehicle-specific features (e.g., emissions), traffic intensity, ventilation type, and enclosed environments like parking garages. The results showed that the in-cabin CO, NO2, SO2, and PM levels were directly related to the surrounding environment and the air exchange rate between the inside and outside of the vehicle.
As the automotive industry shifts toward electric vehicles (EVs), understanding their role in producing non-exhaust emissions has become increasingly important. Although EVs do not produce exhaust emissions from internal combustion engines, they still contribute to pollutant generation. Beddows and Harrison [23] reported that due to the heavier weight of EVs, non-exhaust particulate emissions may actually be higher for EVs than for conventional fuel-powered vehicles. In addition to the vehicle weight, operational and environmental conditions also influence the level of non-exhaust emissions. Chae et al. [24] showed that, for all vehicles, tire-road friction can be a major source of tire wear particles, with PM concentrations notably higher in tunnels and at bus stops than in other locations. The authors further demonstrated that PM2.5 levels increased with the vehicle speed and tire slip angle. Furthermore, the PM10 emission rates were approximately six and eleven times higher than those of PM2.5 under test track and urban road conditions, respectively. Kim et al. [25] found that vehicle-generated pollutant concentrations near highways were strongly influenced by the wind intensity, with downwind areas exhibiting consistently higher levels than upwind areas. Matthaios et al. [26] assessed the in-vehicle NO2 and PM2.5 levels and developed stepwise general additive mixed models (sGAMM) to investigate the combined and individual influences of factors that influence the in-vehicle exposures. The results show that the mean in-vehicle levels were 19 ± 18 and 6.4 ± 2.7 μg/m3 for NO2 and PM2.5, respectively. The results also suggest that vehicle occupants can significantly reduce their in-vehicle exposure by moderating vehicle ventilation settings and by choosing an appropriate cabin air filter. Lim et al. [27] collected personal black carbon (BC) exposures for 141 drivers across seven sectors in London. They found that driving with closed windows significantly reduced exposure and is a simple behaviour change drivers could implement. Hasan et al. [28] investigated the variation in driving style and emissions based on traffic conditions, route features and route familiarity using 30 drivers. They found that a linear relationship between cumulative NOx emissions and cumulative CO2 emissions at the individual driver level.
The pressure differential between the inside and outside of a moving vehicle gives rise to a phenomenon known as leakage ventilation [29]. For a vehicle in motion, the front section of the cabin facing the oncoming airflow becomes a high-pressure zone, while the rear section, located in the wake region, becomes a low-pressure zone. At high speeds, external air infiltrates the cabin from the front owing to this pressure difference and exits from the rear, resulting in reduced in-cabin CO2 levels. However, this phenomenon also allows the ingress of outdoor particulate pollutants into the cabin, potentially harming the health of the driver and passengers.
Modern vehicles are equipped with ventilation systems designed to provide fresh air and maintain an acceptable air quality inside the cabin. Different ventilation strategies significantly influence the in-cabin air quality. For instance, the recirculation mode tends to reduce the infiltration of outdoor PM but causes CO2 to accumulate, whereas the fresh-air mode admits more outdoor air and pollutants but maintains a lower CO2 level [30]. Moreover, Chang et al. [31] proposed an air-conditioning ventilation strategy for maintaining the CO2 concentration within the cabin in the range of 1000 ppm to 2000 ppm by switching between the recirculation mode and the fresh air mode of the vehicle air conditioner system as required. Chang et al. [32] showed that to keep the CO2 concentration within a vehicle cabin at a level of less than 1000 ppm, the cabin had to be supplied with fresh air at a rate of 9.2 L/s for each occupant. However, most prior studies investigating the effects of the ventilation mode on the in-cabin air quality have been conducted in static environments or controlled experimental settings, which may not fully capture the dynamic conditions experienced during actual high-speed driving.
To address this gap, the present study conducted on-road experiments using a standard passenger vehicle on a system of highways and expressways in southern Taiwan. The concentrations of harmful substances inside and outside the cabin were measured to assess the relationship between the vehicle speed, in-cabin pollutant levels, and ventilation mode during continuous high-speed driving. Based on the experimental measurements, correlation equations were derived to predict the levels of the considered pollutants (CO2, PM2.5, and PM10) as a function of the vehicle speed under two ventilation modes: recirculation air mode and fresh air mode.

2. Experimental Methods

To investigate the effects of different ventilation strategies and vehicle speeds on the in-cabin air quality during high-speed driving, a circular experimental route was designed consisting of four highways near Tainan City in southern Taiwan.

2.1. Experimental Route

To enable the test vehicle to maintain consistent high-speed driving, the test route was planned as a continuous loop of four highway segments: National Highway No. 1, National Highway No. 8, National Highway No. 3, and Expressway No. 86. As shown in Figure 1 [33], National Highway No. 1 formed the western section of the loop, National Highway No. 8 formed the northern section, National Highway No. 3 formed the eastern section, and Expressway No. 86 formed the southern section. The lengths of each segment are illustrated in Figure 2. The total driving distance for each loop was 43.3 km, and the time required to complete the loop varied from approximately 30 to 45 min, depending on the driving speed.
The route was traversed in both directions (clockwise and counterclockwise), with the Yongkang Interchange serving as the beginning and end of the loop in each case. The dual-direction approach was adopted to account for any directional biases, such as varying traffic conditions, wind patterns, or road characteristics that might differ between directions.
The vehicle used in the on-road tests was a Mitsubishi Galant sedan equipped with an air-conditioning system with two operating modes: recirculating air and fresh air. Since the study involved driving on public roads, the driving protocol was designed to comply with all relevant traffic regulations. During the test, the vehicle will travel at a constant speed of 60, 70, 80, 90, 100, 110 and 120 km/h depending on the traffic conditions. When driving on the system interchanges (i.e., switching between experimental roads), the vehicle speed was maintained at 40 and 50 km/h. A safe distance was maintained between the test vehicle and the vehicle in front at all times to avoid sudden speed changes that could compromise driving safety. Additionally, care was taken to avoid following large vehicles too closely to minimize the effects of their airflow and exhaust emissions on the collected data.
The experiments were conducted in clear, calm weather. The temperature in the test area was approximately 30–35 °C, and the relative humidity was approximately 75–80%. Wind speed was not measured because the vehicle speed during the experiment was much higher than the wind speed, so the ambient wind speed was not taken into account. The traffic conditions were not peak to avoid obstructing other road users. The test vehicles drove in the middle and outer lanes and maintained a certain distance from the vehicle in front to avoid affecting the data. The speed plan and dwell times per segment are listed in Table 1.
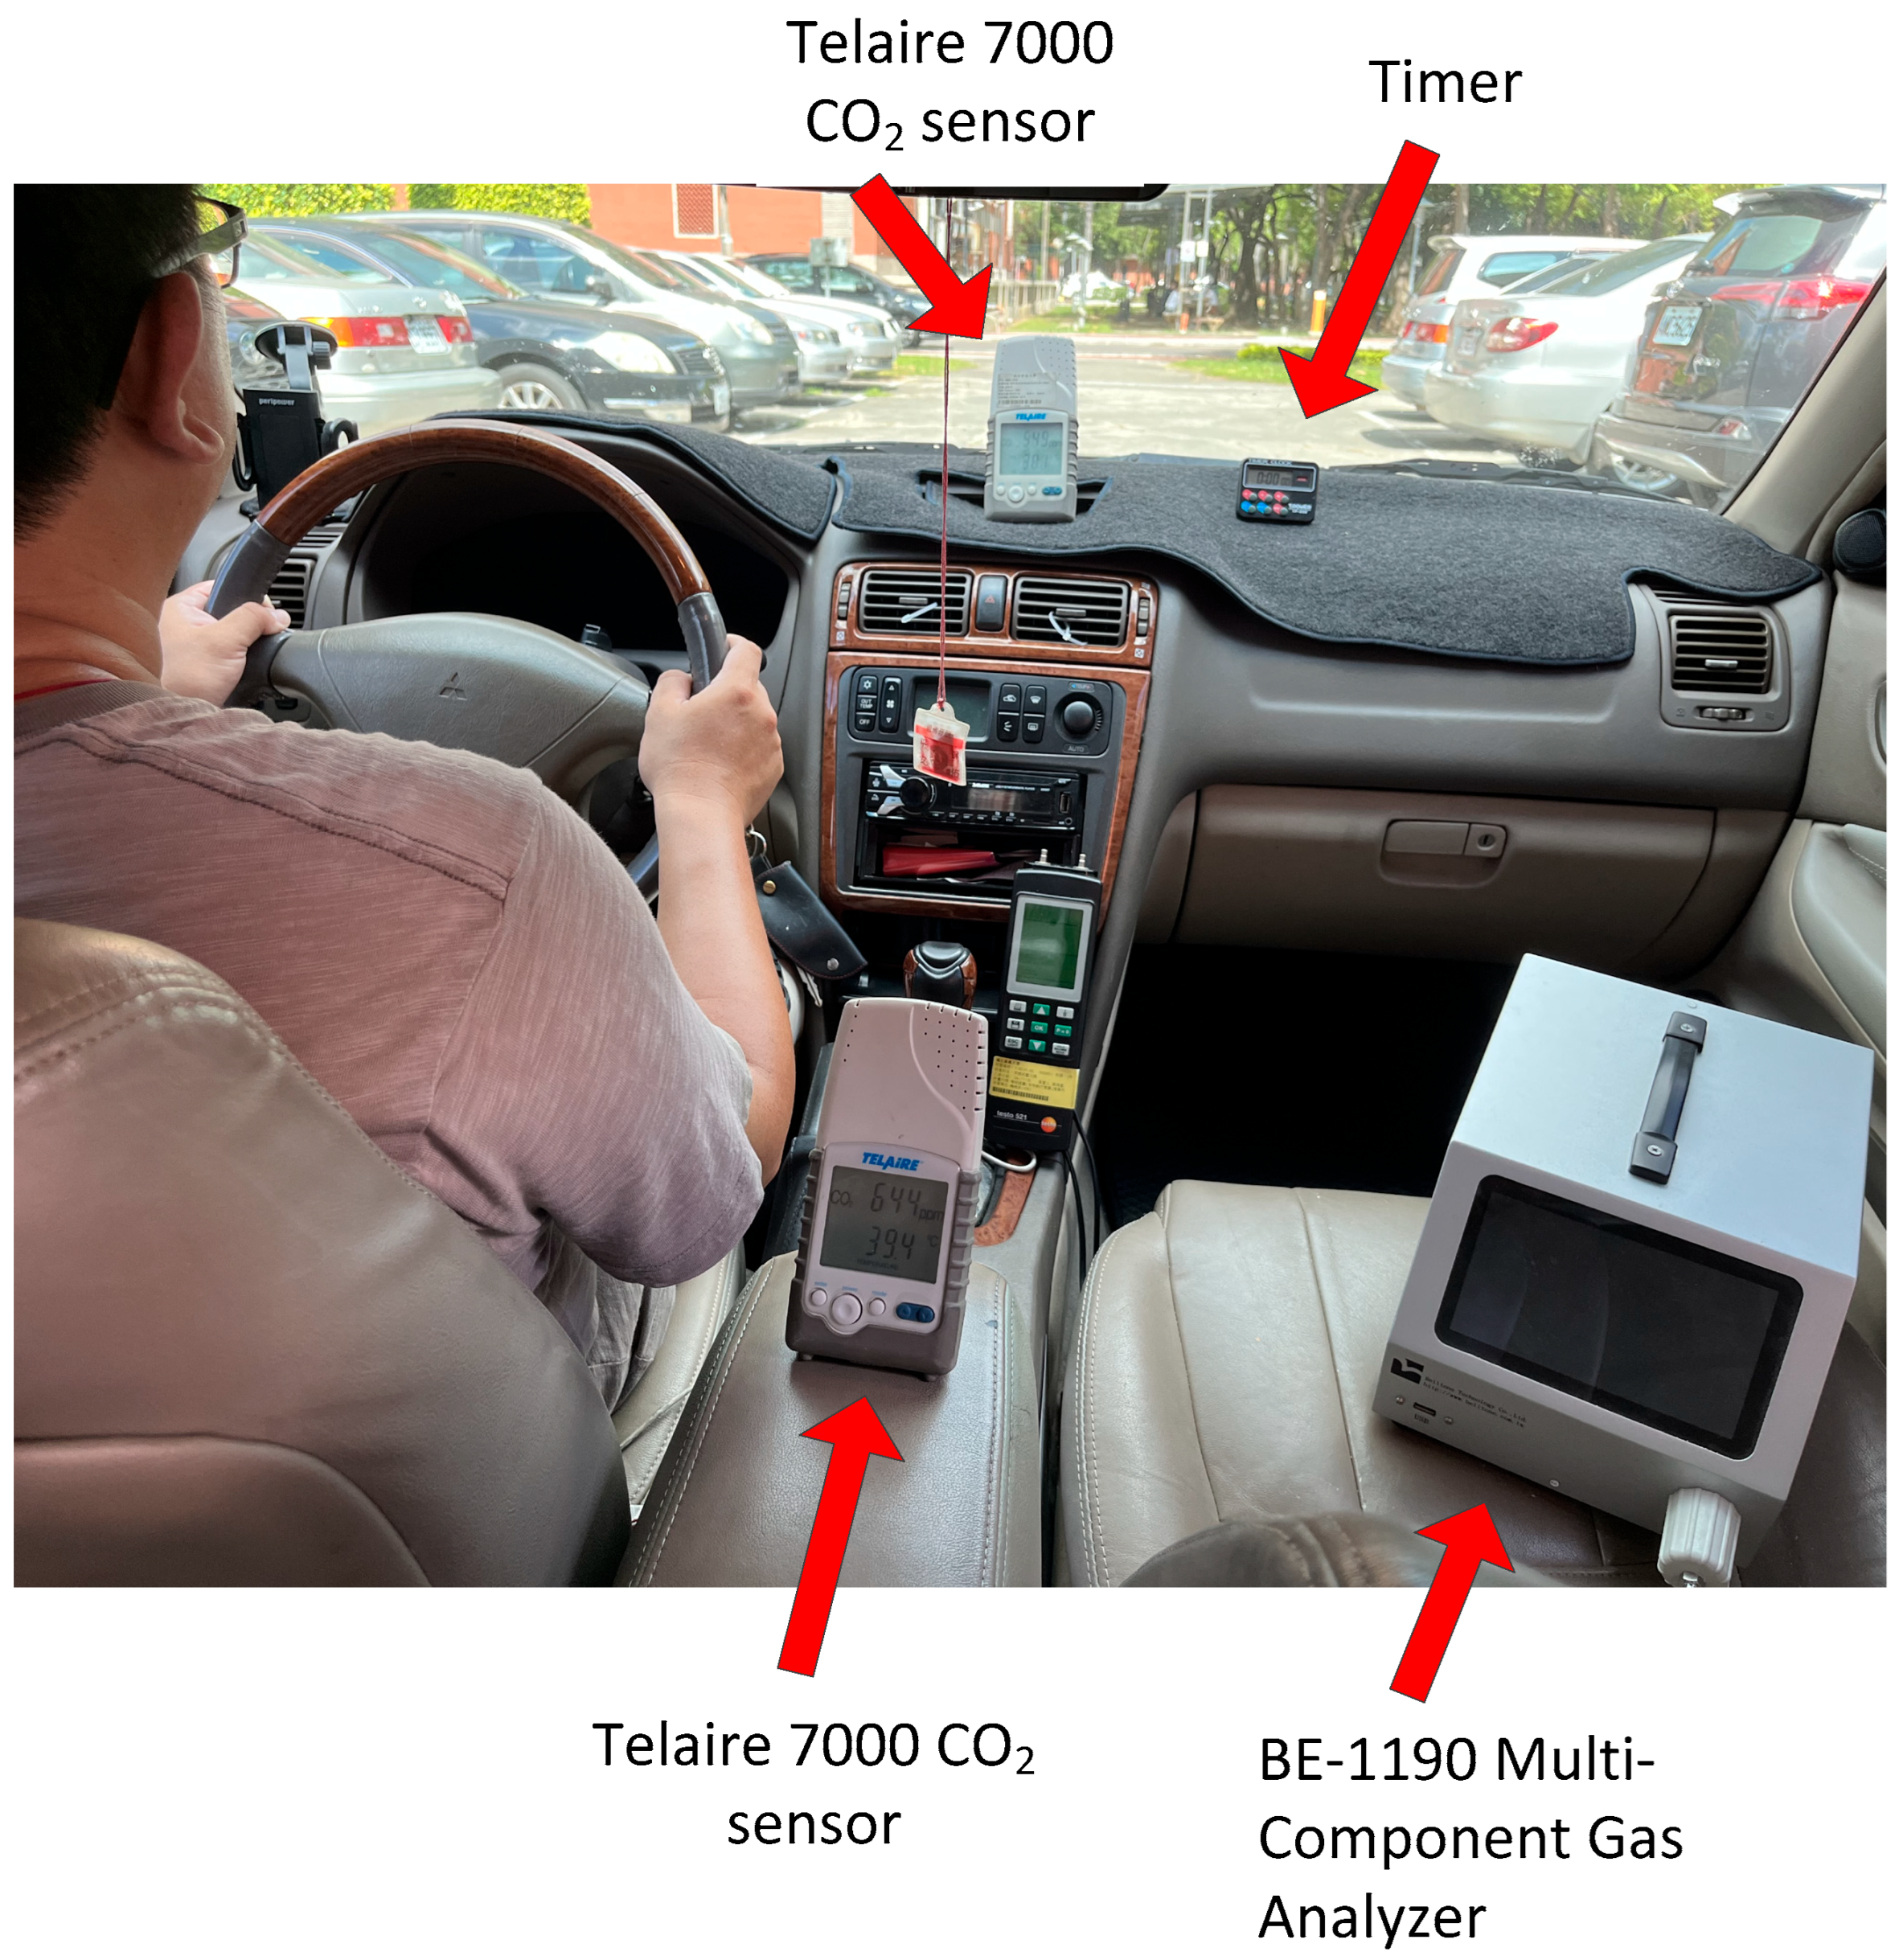
The experiments were conducted with only the driver present in the vehicle. The air conditioning fan speed was preset to level 2, and the air vent angles of the vehicle ventilation system were adjusted and fixed in place. To record and capture the dynamic conditions during the test, a camera was installed in the cabin vehicle to continuously record the entire experiment. A BE-1190 multi-component gas analyzer (Belltone Ltd., Hsinchu, Taiwan) was used to measure the PM2.5, PM10, and CO2 concentrations both inside and outside the experimental cabin. In addition, two Telaire 7000 CO2 sensors (Amphenol Advanced Sensors, Inc., St. Marys, PA, USA) were installed inside the cabin for more accurate measurement of CO2 concentration in the cabin. The accuracy specifications of the measurement instruments are listed in Table 2.
The data acquisition system comprised a personal computer and a video recorder. The recorder was used to continuously record the display values of all the measurement devices throughout the experiment, with the footage saved to the computer for subsequent analysis. Measurements were taken and recorded once every ten seconds, and all readings were averaged to ensure the accuracy of the data.

2.2. Experimental Sampling Points

The Telaire 7000 CO2 sensors were placed on the dashboard and the center armrest. The gas analyzer and data recorder were positioned on the front passenger seat. The detailed arrangement of the experimental equipment is shown in Figure 3.
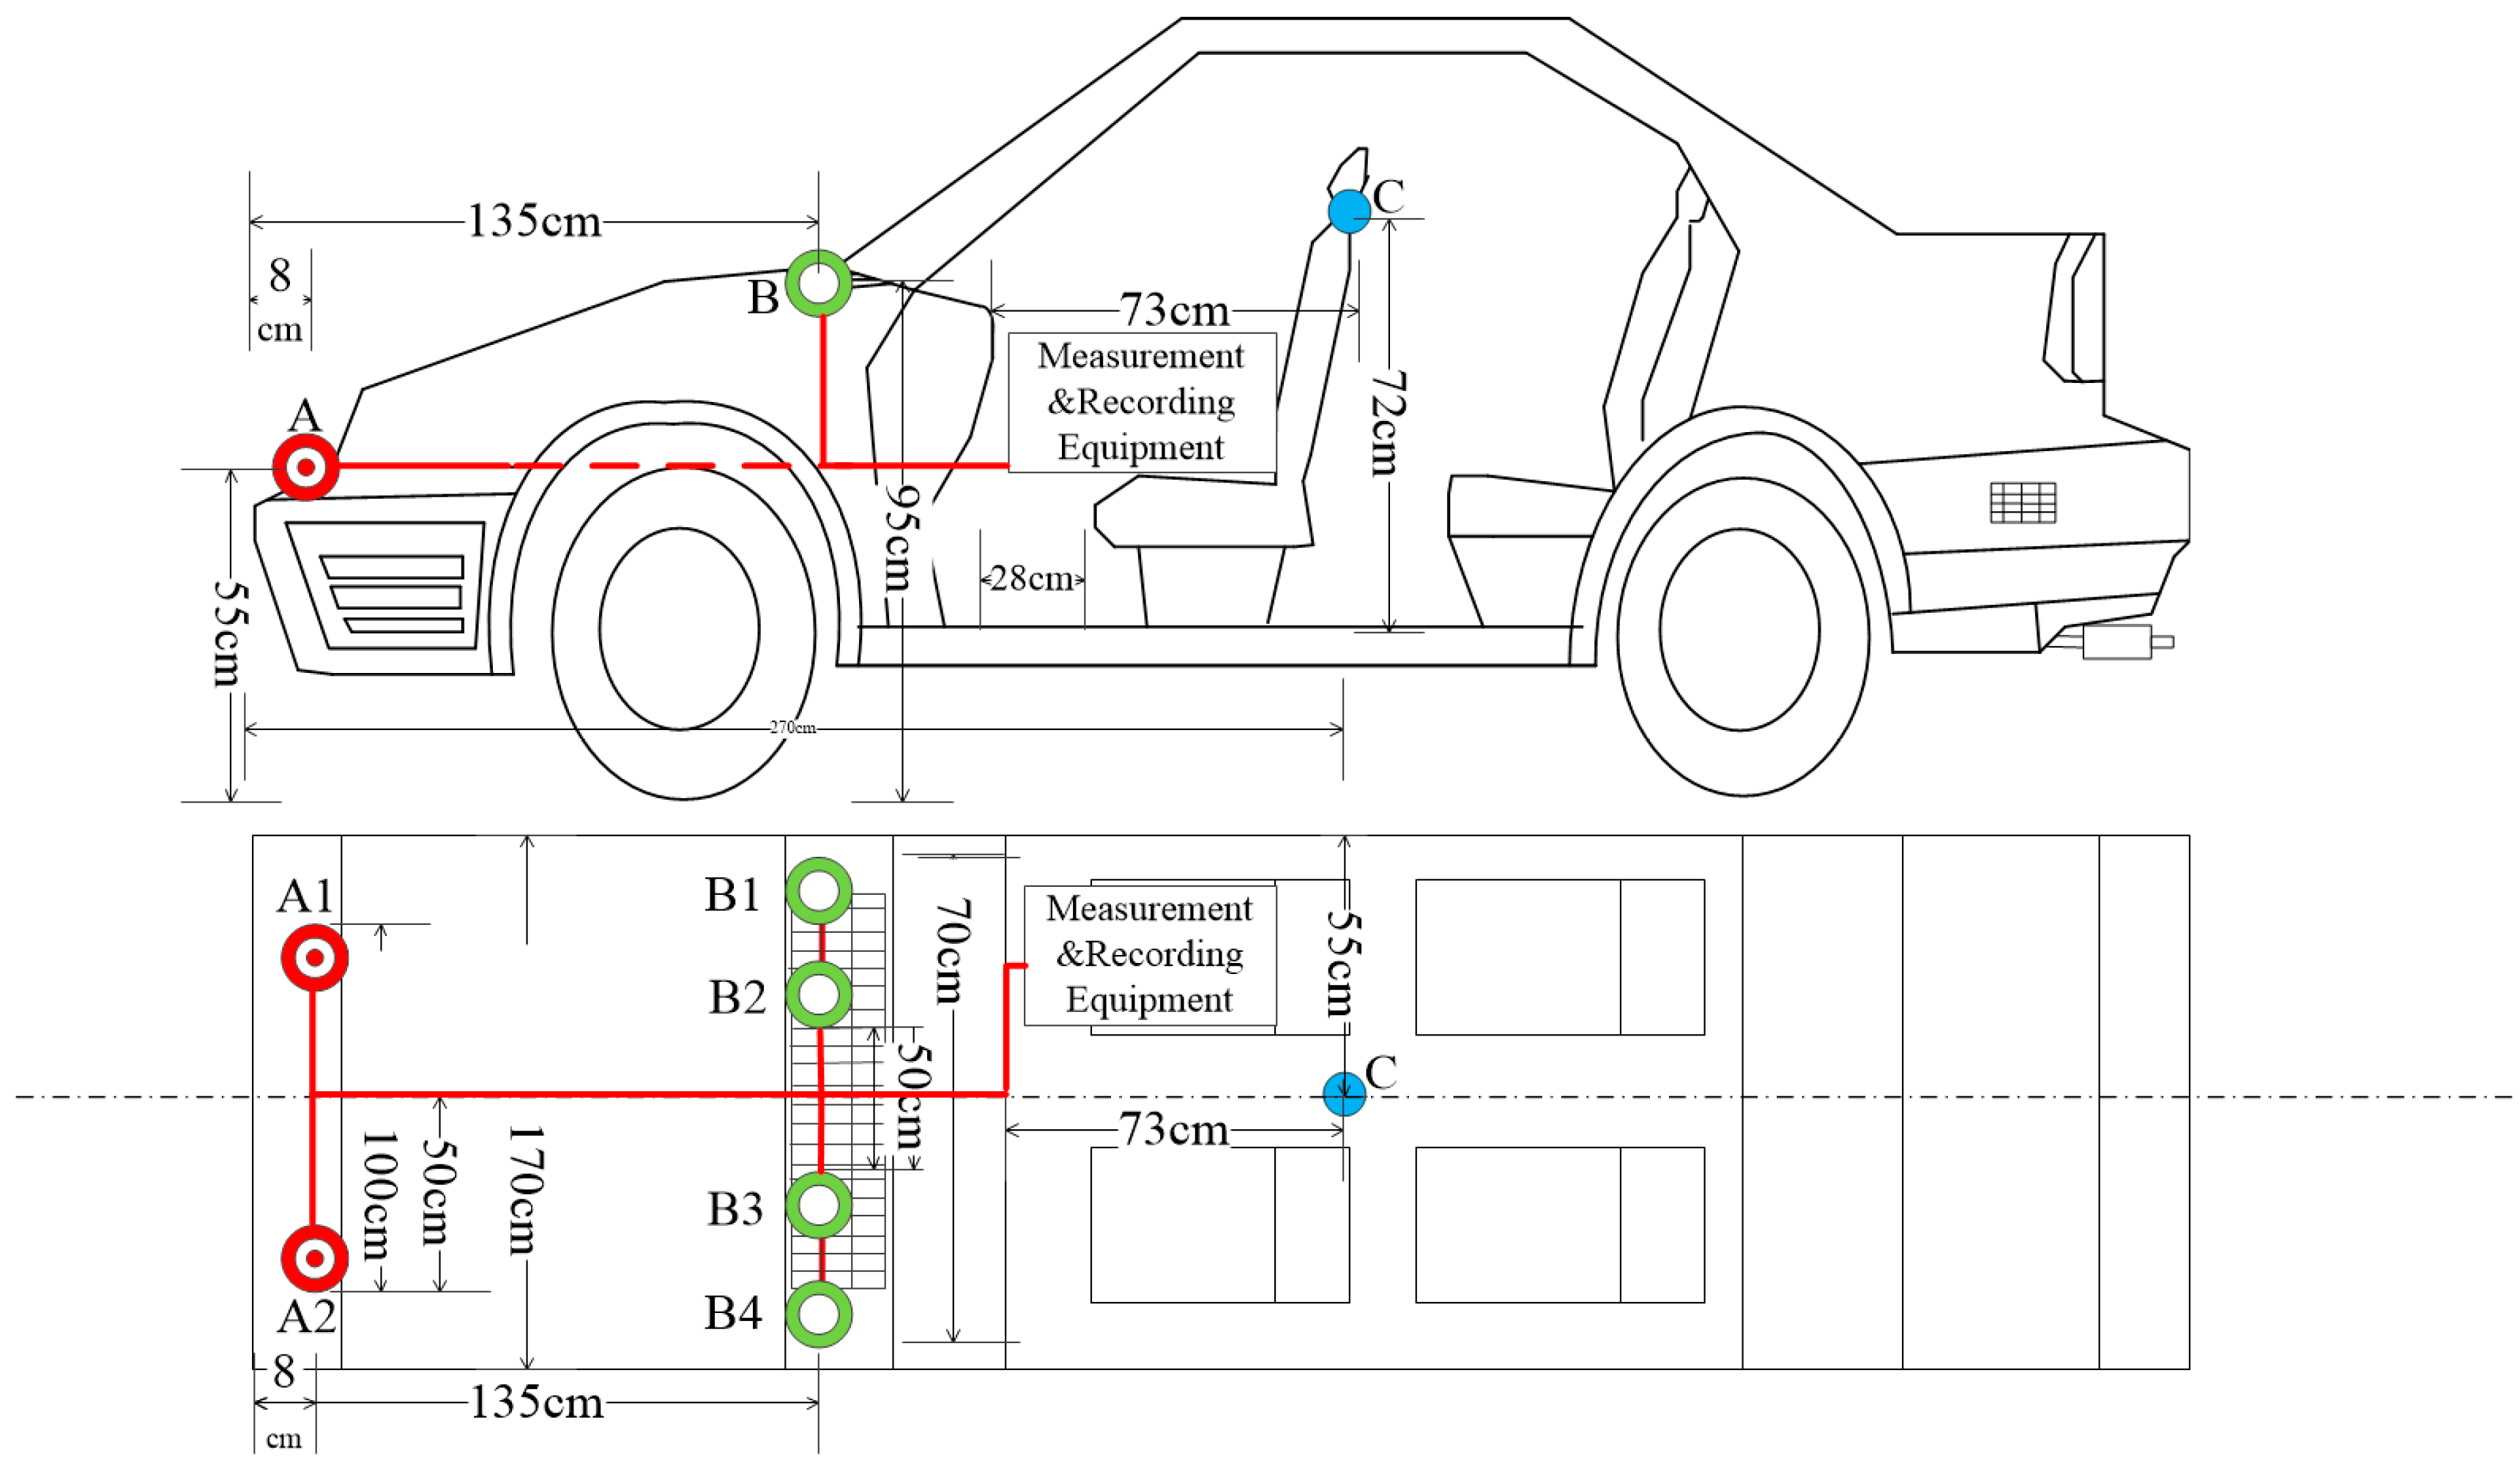
As shown in Figure 4, sampling was conducted at seven locations inside and outside of the cabin. The outside sampling points were distributed around the front of the vehicle and the windshield. The sampling points at the front of the vehicle were located adjacent to the car headlights (A1 and A2 in Figure 5), while the sampling points near the windshield were located adjacent to the cabin ventilation inlets (B1 through B4 in Figure 6). During the experiments, the sampling lines for all six points were connected in parallel, and the air from these points was drawn directly into the BE-1190 multi-component gas analyzer on the front passenger seat. Since cars create turbulence and eddies when traveling at high speeds, the air has been mixed due to the strong turbulence effect before being sampled, so there is not much difference between different sampling points. The internal sampling point, labeled as C in Figure 4, was positioned at head height midway between the driver and passenger seats, and was also connected to the BE-1190 by a sampling line.

3. Results and Discussion

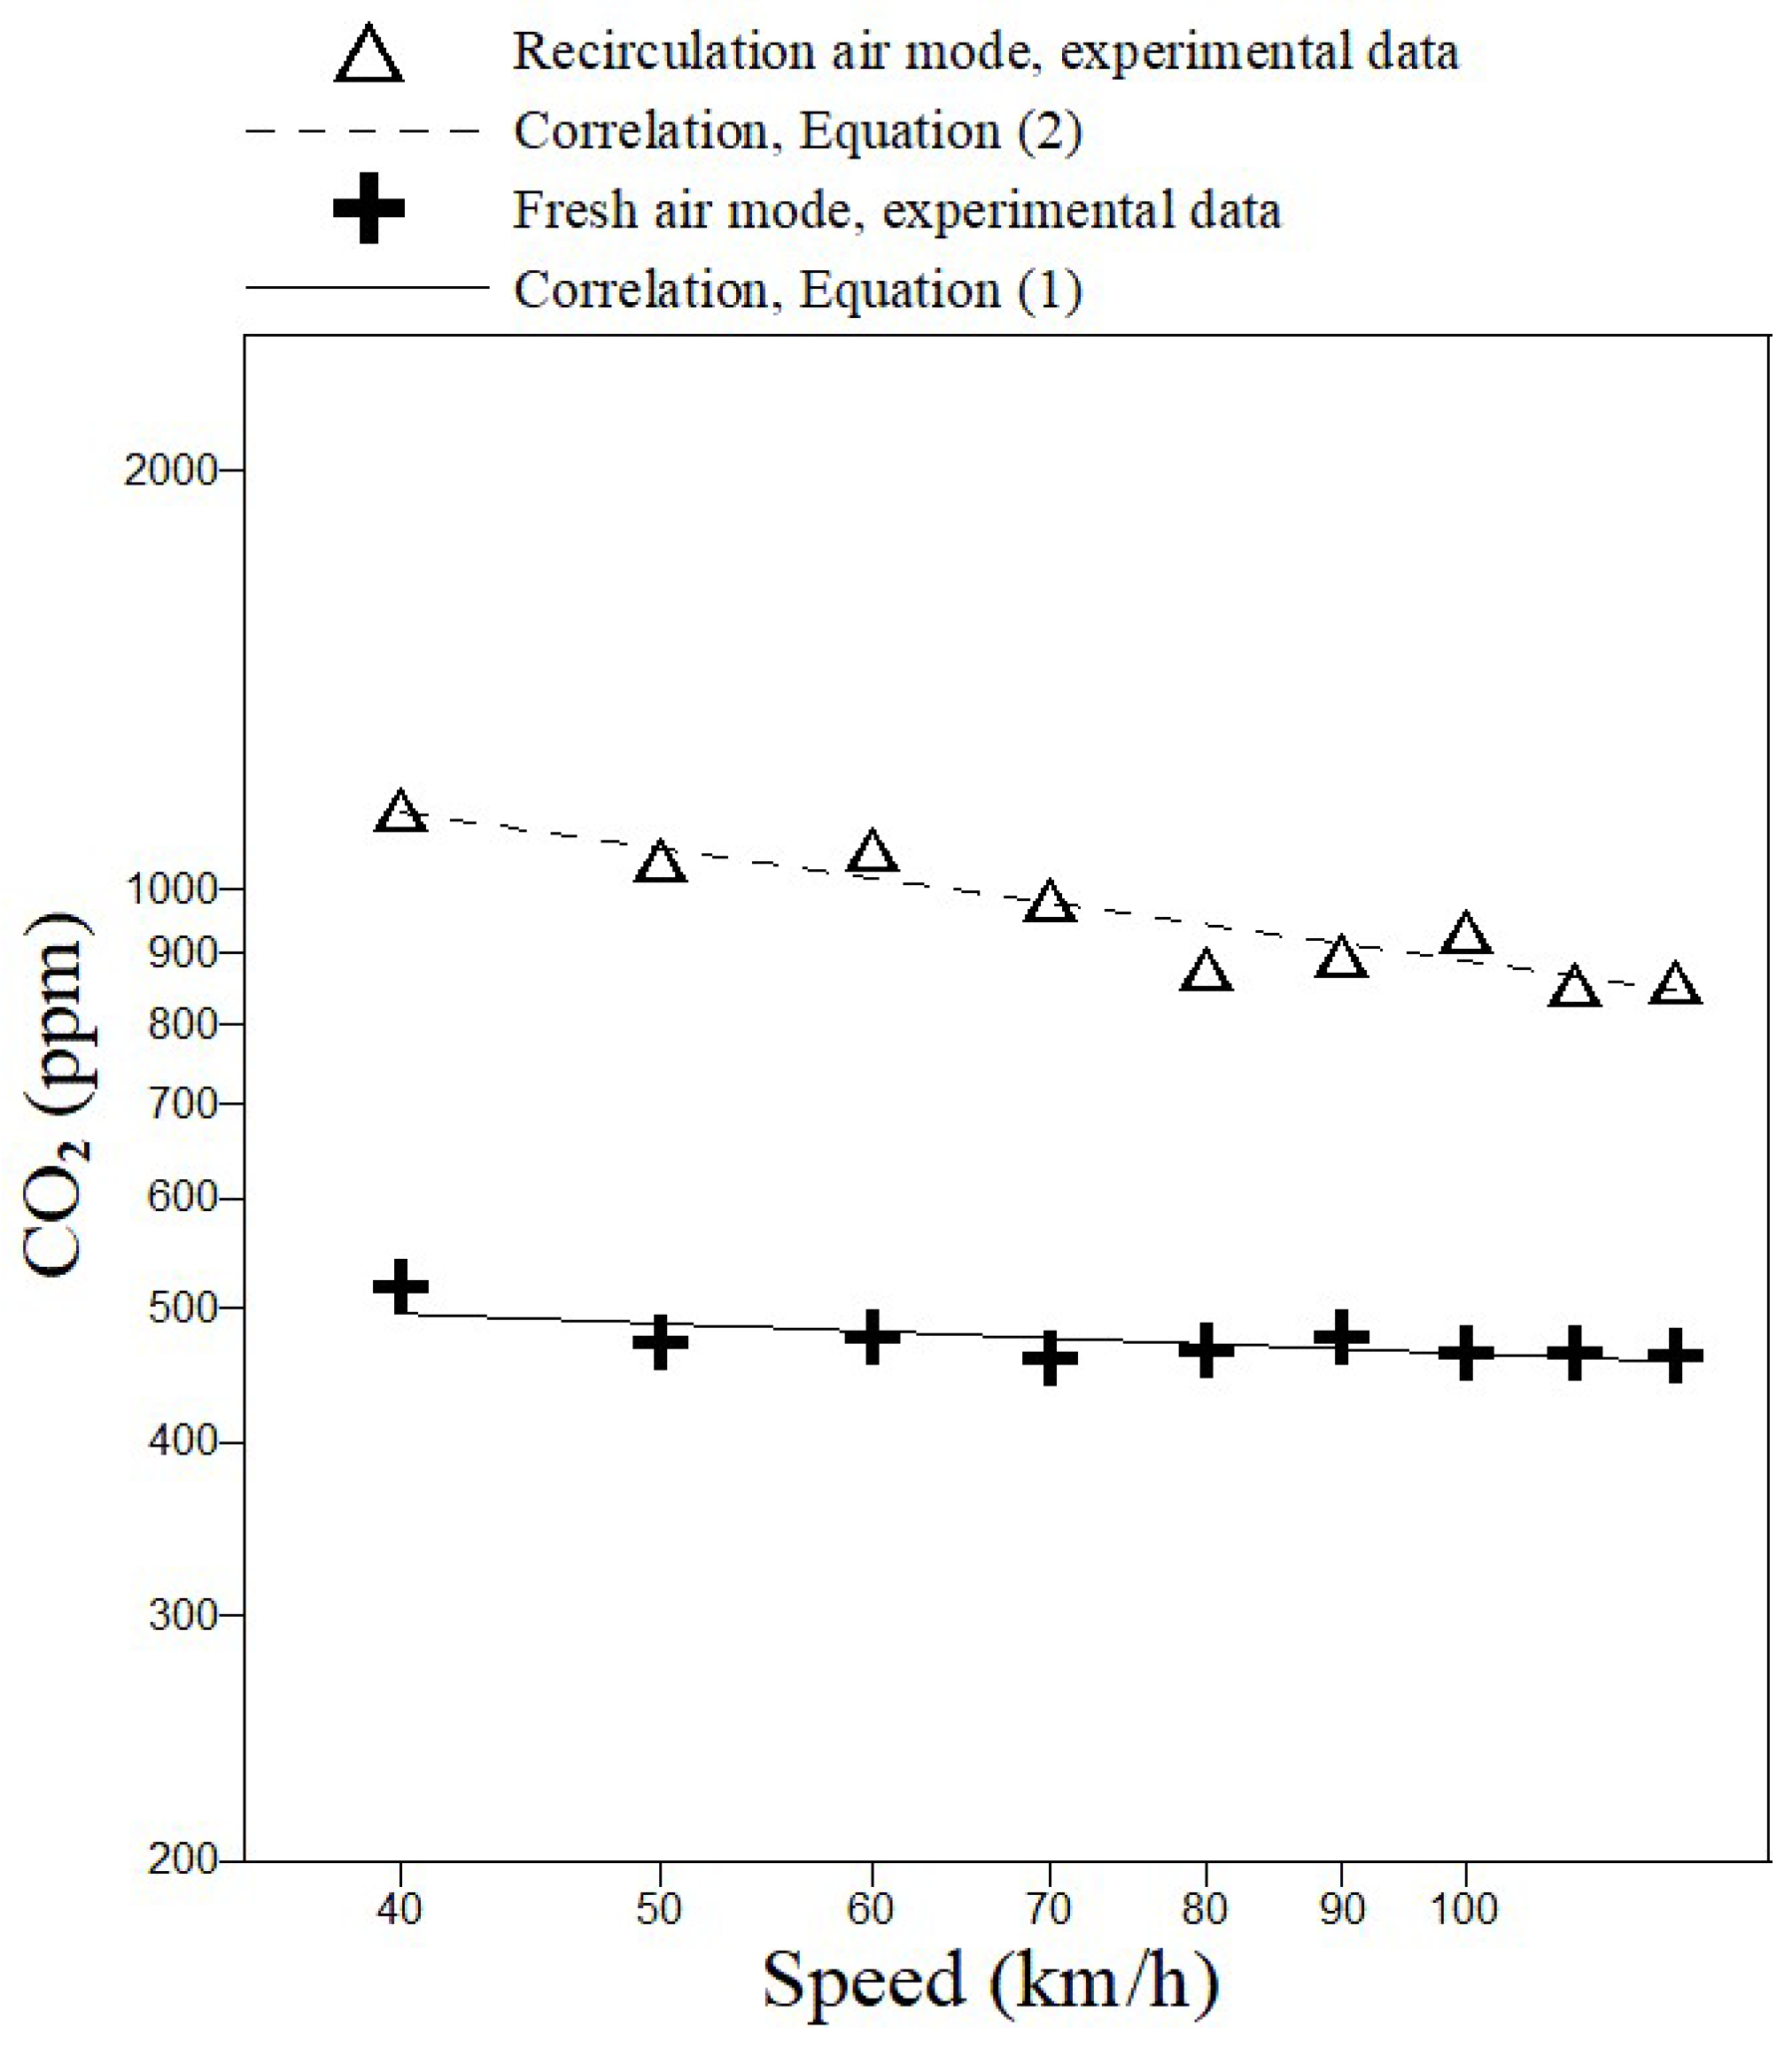
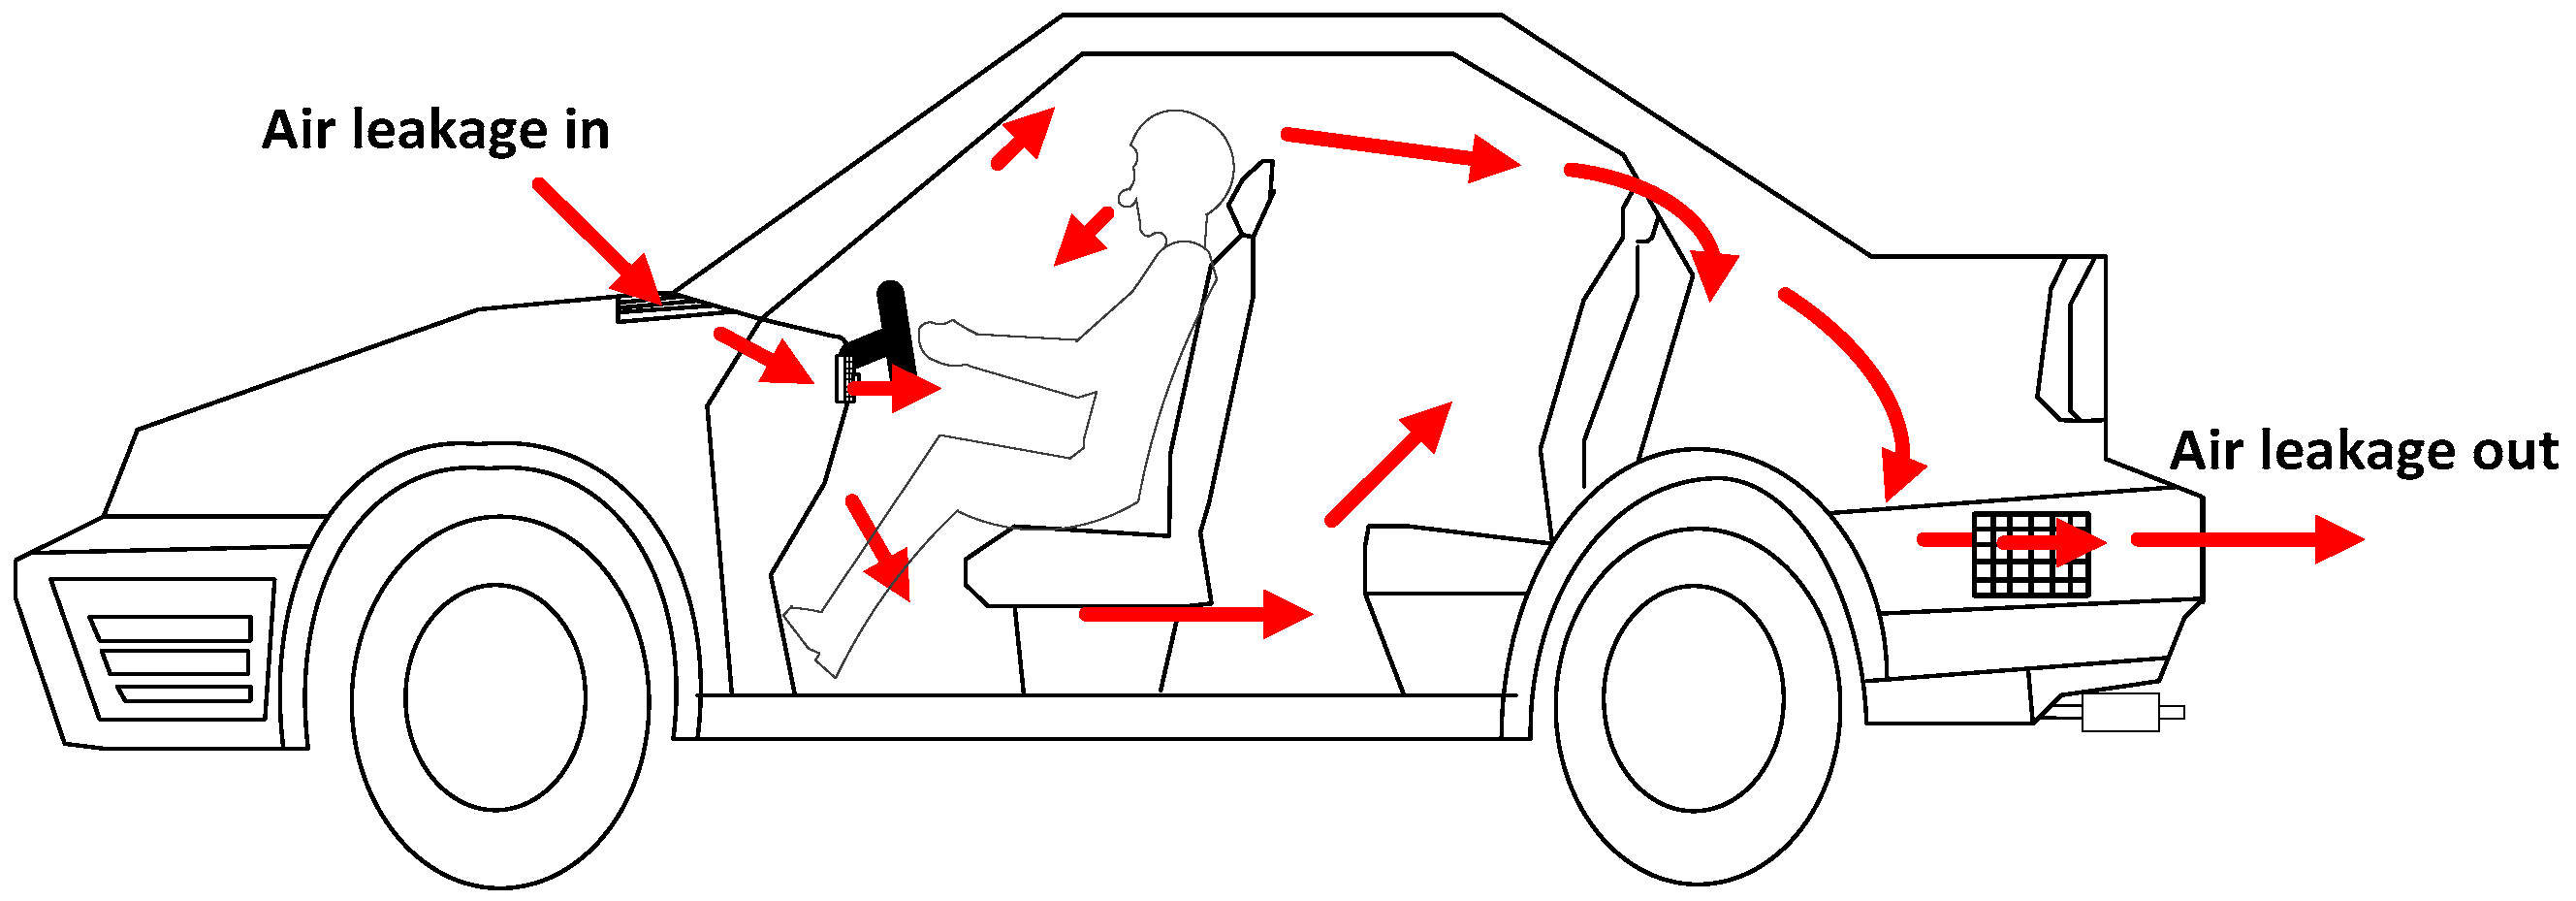
Figure 7 shows the experimental results for the log-log variation in the in-cabin CO2 concentration with the vehicle speed, given the two settings of the in-cabin ventilation system: the recirculation air mode and the fresh air mode. For both sets of experiments, the average ambient CO2 concentration, denoted as Co, was approximately 420 ppm. When the air conditioning system operated in the recirculation mode, the in-cabin CO2 concentration reduced from 1150 to 850 ppm as the vehicle speed increased from 40 to 120 km/h. This reduction in the CO2 concentration is consistent with the expected airflow dynamics. In particular, as the vehicle speed increases, the air pressure at the front of the vehicle (windward side) rises, causing more outdoor air to infiltrate the cabin through gaps in the front bodywork. Simultaneously, the lower pressure at the rear of the vehicle (leeward side) facilitates the outflow of more cabin air through gaps at the back (Figure 8).
Chang et al. [29] proposed that for a vehicle in motion, the front section of the cabin facing the oncoming airflow becomes a high-pressure zone, while the rear section, located in the wake region, becomes a low-pressure zone. At high speeds, external air infiltrates the cabin from the front owing to this pressure difference and exits from the rear, resulting in reduced in-cabin CO2 levels. Based on the mass balance of CO2, the authors proposed the following calculation formula based on the leakage air volume: Q A L = n × 4.583 C c a r C o , where Q A L is the air leakage ventilation rate, n is the number of passengers in the vehicle, 4.583 is the normal exhalation rate of 4.583 × 10 6   m 3 / s , Ccar is the cabin CO2 concentration, and Co is the ambient air CO2 concentration. According to the calculation formula of Chang et al. [29], the air leakage rate of the test vehicle ranges from 0.01025 m3/s (at 60 km/h) to 0.0141 m3/s (at 120 km/h). This confirms that the faster the vehicle speed, the greater the air leakage rate.
Figure 7 shows that the fresh air mode significantly reduces the CO2 concentration inside the cabin, maintaining a value of less than 520 ppm at driving speeds greater than 40 km/h. When using the recirculation air mode, the CO2 concentration inside the cabin exceeds the ASHRAE recommended limit of 1000 ppm [36] at speeds less than 70 km/h. Thus, prolonged use of the recirculation mode during highway driving at lower speeds can result in elevated CO2 levels, and thus periodic switching to the fresh air mode is required to maintain the CO2 concentration within the recommended limit.
The results shown in Figure 7 indicate that the CO2 concentration and vehicle speed exhibit a linear relationship on a log-log scale. By applying a curve-fitting method to the experimental data, the correlation equations between the in-cabin CO2 concentration and the vehicle speed in the two ventilation modes are obtained as
C c a b i n = 645.9 × v 0.072     fresh   air   mode
C c a b i n = 3059.3 × v 0.2684     recirculation   mode
where C c a b i n is the CO2 concentration inside the vehicle cabin (ppm), and v is the vehicle speed ( 40 v 120   k m / h ) .
As shown in Figure 7, the power-law correlations are in good agreement with the experimental data trends under both ventilation modes. On close inspection, the maximum deviation for both correlations is less than 5%. The R2 for the fresh air mode and recirculated air mode were 0.56 and 0.88, respectively. The 95% confidence intervals were 463–483 ppm and 888–1038 ppm, respectively. The RMSEs were 11.14 and 33.75, respectively. In other words, the accuracy of the two correlations is confirmed.
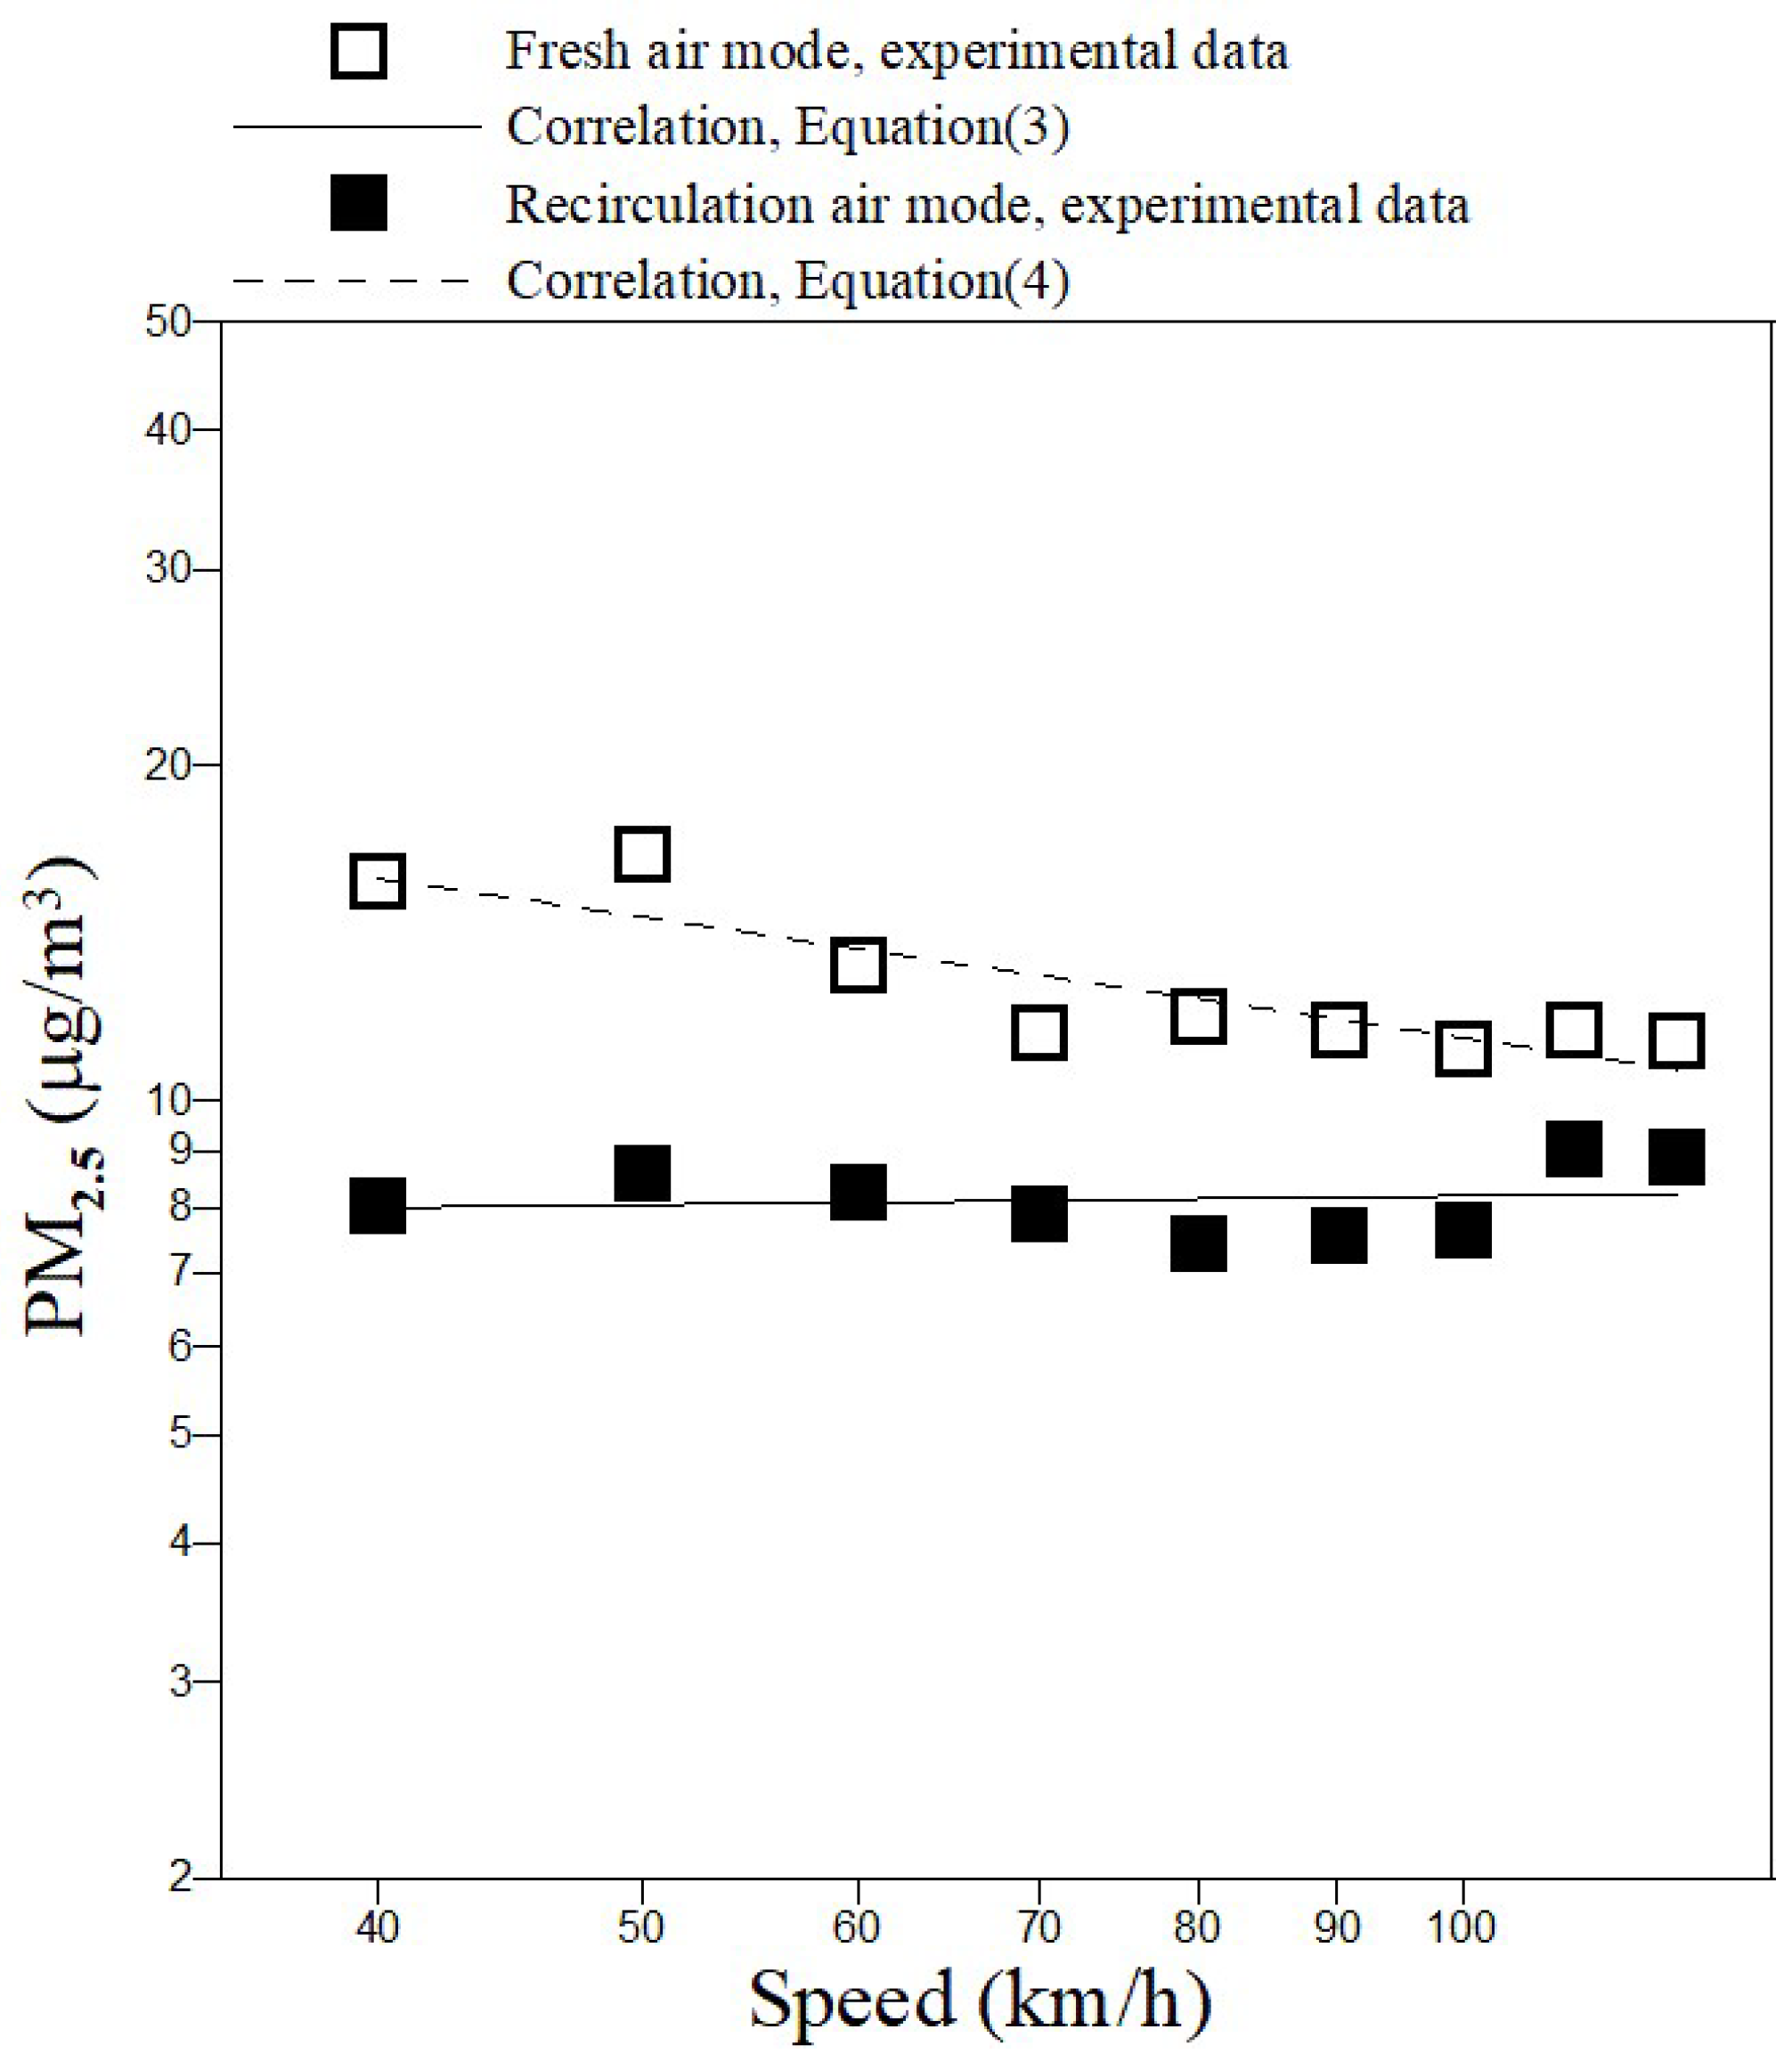
Figure 9 shows the experimental results for the PM2.5 concentration inside the vehicle cabin at different driving speeds when using the recirculation and fresh air modes. In the fresh air mode, the PM2.5 concentration reduces as the vehicle speed increases. This finding is reasonable since there are no significant sources of PM2.5 in the cabin, and hence the steady-state in-cabin concentration of PM2.5 is largely determined by the PM2.5 concentration of the incoming air. The outdoor PM2.5 level at the front of the vehicle tends to decrease at higher speeds due to greater vehicle spacing and an improved dispersion of the airborne pollutants. Consequently, the in-cabin PM2.5 level also reduces with an increasing speed.
When the ventilation system operates in the recirculation air mode, the in-cabin PM2.5 concentration is lower than that in the fresh air mode because the cabin air filters effectively remove particulates from the recirculating air. In this mode, the cabin air is largely isolated from the outdoor air, and hence the PM2.5 level remains relatively stable. However, as the vehicle speed increases, more outdoor air infiltrates into the cabin through body gaps due to pressure differences, and hence the PM2.5 concentration increases slightly.
The curve-fitting results show that the PM2.5 concentration and vehicle speed in the two ventilation modes are correlated as follows:
P M 2.5 c a b i n = 59.57 × v 0.3593     fresh   air   mode
P M 2.5 c a b i n = 8.282 × v 0.00259       recirculation   mode
where P M 2.5 c a b i n is the PM2.5 concentration inside the vehicle cabin (μg/m3), and v is the vehicle speed.
The results in Figure 9 show a good agreement between the power-law correlations and the experimental data for both ventilation modes. An inspection of the results presented in Figure 9 shows that the theoretical values of the PM2.5 concentration predicted by Equations (3) and (4) deviate from the experimental values by less than 8%. The R2 for the fresh air mode and recirculated air mode were 0.78 and 0.14, respectively. The 95% confidence intervals were 11.4–14.0 μg/m3 and 8.37–8.38 μg/m3, respectively. The RMSEs were 0.9 and 0.59, respectively. Thus, the accuracy of Equations (3) and (4) is confirmed.
Figure 10 shows the experimental results for the variation in the PM10 concentration inside the vehicle cabin with the driving speed under the two ventilation modes. The tendencies of the PM10 concentration under the fresh-air mode and recirculation air mode are consistent with those of the PM2.5 concentration. In particular, in the fresh air mode, the PM10 concentration approaches the ambient concentration due to the absence of PM10 sources in the cabin and reduces with an increasing vehicle speed. Similarly, in the recirculation air mode, the PM10 concentration is reduced owing to the filtering effect of the cabin air filters and is relatively stable, with only a slight increase observed as the vehicle speed increases.
The curve-fitting results show that the PM10 concentrations in the two ventilation models are related to the vehicle speed as follows:
PM10cabin = 41.224 × v−0.2766  fresh air mode
PM10cabin = 6.739 × v0.05128  recirculation mode
where PM10cabin is the PM10 concentration inside the vehicle cabin (μg/m3), and v is the vehicle speed.
An inspection of the results presented in Figure 10 shows that the theoretical values of the PM10 concentration predicted by Equations (5) and (6) deviate from the experimental values by less than 8%. The R2 for the fresh air mode and recirculated air mode were 0.79 and 0.09, respectively. The 95% confidence intervals were 11.5–13.5 μg/m3 and 8.29–8.54 μg/m3, respectively. The RMSEs were 0.68 and 0.52, respectively.
The results presented in Figure 7, Figure 9 and Figure 10 have several important implications for vehicle ventilation strategies and occupant health during highway driving. First, prolonged use of the recirculation air mode provides an effective means of lowering the in-cabin PM level but can lead to CO2 accumulation, potentially impairing driver alertness and safety. Conversely, the fresh-air mode maintains the CO2 concentration at a safer level but allows greater PM ingress. Yang et al. [37] studied the effects of different ventilation strategies on tunnel air quality. Their results showed that the mixed ventilation scheme was the most effective, with the wind speed in the tunnel increasing by 7.5% to 30.6%, the cooling rate increasing by 14.1% to 17.7%, and the CO volume fraction decreasing by 26.9% to 73.9%. Therefore, periodically switching between ventilation modes is recommended to mitigate health risks and maintain an acceptable in-cabin air quality. These insights can inform vehicle operation guidelines, driver education, and even the design of automated climate control systems that dynamically adjust the ventilation mode based on the in-cabin CO2 and PM levels.
The curve-fitting equations derived in this study quantify the empirical relationships between the vehicle speed and the in-cabin pollutant concentration under different ventilation modes. Notably, the exponents in the CO2 equations (Equations. (1) and (2)) indicate a stronger dependence of the in-cabin CO2 concentration on the vehicle speed in the recirculation mode than in the fresh-air mode, which is consistent with the higher degree of isolation from the ambient air in the recirculation mode. Meanwhile, the relatively small exponents in the PM2.5 and PM10 equations under the recirculation mode suggest that filtration and cabin sealing can effectively stabilize the particulate levels even if infiltration of the outdoor air increases slightly at higher speeds. Importantly, these equations, with maximum deviations of less than 8% compared to the experimental data, can serve as predictive tools for estimating the in-cabin air quality at highway speeds under different ventilation strategies. This capability is valuable for vehicle manufacturers and HVAC system designers, who can use these empirical models to optimize ventilation control algorithms that dynamically balance the CO2 and PM concentrations to maintain safe and comfortable cabin conditions.

4. Conclusions

This study has conducted an experimental investigation into the effects of two different ventilation strategies (fresh-air mode and recirculation air mode) on the in-cabin air quality of a standard passenger vehicle during continuous high-speed driving (60–120 km/h) on a highway system in southern Taiwan. The main findings of this study are summarized as follows:
  • In the recirculation air mode, more outdoor air leaked into the cabin through gaps in the vehicle body at higher driving speeds. resulting in a lower in-cabin CO2 concentration.
  • The use of the fresh air ventilation mode significantly reduced the in-cabin CO2 concentration, maintaining levels below 520 ppm at speeds above 40 km/h.
  • While driving on highways, the ventilation system should be periodically switched between the recirculation air mode and the fresh air mode to maintain an in-cabin CO2 concentration lower than the ASHRAE [36] recommended limit of 1000 ppm.
  • In the fresh air mode, the concentrations of PM2.5 and PM10 inside the cabin decreased with an increasing vehicle speed and approached the ambient concentrations.
  • In the recirculation air mode, the cabin air filters effectively reduced the particulate concentration, resulting in lower in-cabin PM levels than those in the fresh air mode.
  • The CO2, PM2.5, and PM10 concentrations exhibited linear relationships with the vehicle speed on a log-log scale. The fitted values of the CO2, PM2.5, and PM10 concentrations were in close agreement with the experimental measurements.
  • Passenger vehicles are broadly categorized into three types: sedans, Sport Utility Vehicles (SUVs), and Multi-Purpose Vehicles (MPVs). While these differ in size and space, their HVAC systems share similar design principles. Therefore, similar conclusions should apply to different passenger vehicle models.
The findings of this study provide useful practical guidelines for optimizing the vehicle ventilation strategy to improve the in-cabin air quality and enhance occupant health and safety during highway driving. Moreover, the findings of this study provide useful insights for vehicle design, automated HVAC system development in vehicle cabins, and driver guidelines, contributing to safer and healthier in-cabin environments.

Author Contributions

Conceptualization, T.-B.C.; Methodology, T.-B.C.; Investigation, J.-W.H.; Resources, T.-B.C.; Writing—original draft, J.-W.H.; Writing—review & editing, T.-B.C. All authors have read and agreed to the published version of the manuscript.

Funding

This research was funded by the National Science and Technology Council of Taiwan under Project Numbers NSTC 112-2221-E-415-007 and NSTC 113-2221-E-415-014-MY3.

Data Availability Statement

The original contributions presented in this study are included in the article. Further inquiries can be directed to the corresponding author.

Conflicts of Interest

The authors declare no conflict of interest.

References

  1. WHO. Outdoor Air Pollution a Leading Environmental Cause of Cancer Deaths 17 October 2013. Available online: https://www.who.int/europe/news/item/17-10-2013-outdoor-air-pollution-a-leading-environmental-cause-of-cancer-deaths (accessed on 17 June 2024).
  2. Gu, K.Y.; Zhou, M.; Luo, W.; Liu, Y.; Dou, P.Y.; Huang, C.; Di, Q. Long-term exposure to fine particulate matter and cardiovascular disease: The mitigation role of environmental concerns. Sci. Total Environ. 2023, 875, 162656. [Google Scholar] [CrossRef]
  3. Lee, W.H.; Choo, J.Y.; Son, J.Y.; Kim, H. Association between long-termexposure to air pollutants and prevalence of cardiovascular disease in 108 South Korean communities in 2008–2010: A cross-sectional study. Sci. Total Environ. 2016, 565, 271–278. [Google Scholar] [CrossRef] [PubMed]
  4. Raaschou-Nielsen, O.; Beelen, R.; Wang, M.; Hoek, G.; Andersen, Z.J.; Hoffmann, B.; Stafoggia, M.; Samoli, E.; Weinmayr, G.; Dimakopoulou, K.; et al. Particulate matter air pollution components and risk for lung cancer. Environ. Int. 2016, 87, 66–73. [Google Scholar] [CrossRef]
  5. Cakmak, S.; Hebbern, C.; Pinault, L.; Lavigne, E.; Vanos, J.; Crouse, D.L.; Tjepkema, M. Associations between long-term PM2.5 and ozone exposure and mortality inthe Canadian Census Health and Environment Cohort (CANCHEC), by spatial synoptic classification zone. Environ. Int. 2018, 111, 200–211. [Google Scholar] [CrossRef]
  6. McGuinn, L.A.; Ward-Caviness, C.K.; Neas, L.M.; Schneider, A.; Diaz-Sanchez, D.; Cascio, W.E.; Kraus, E.W.; Hauser, E.; Dowdy, E.; Haynes, C.; et al. Association betweensatellite-basedestimatesoflong-termPM2.5 exposure and coronary artery disease. Environ. Res. 2016, 145, 9–17. [Google Scholar] [CrossRef]
  7. Lanzinger, S.; Schneider, A.; Breitner, S.; Stafoggia, M.; Erzen, I.; Dostal, M.; Pastorkova, A.; Bastian, S.; Cyrys, J.; Zscheppang, A.; et al. Associations between ultrafine and fine particles and mortality in five central European cities—Results from the UFIREG study. Environ. Int. 2016, 88, 44–52. [Google Scholar] [CrossRef]
  8. Hassanvand, M.S.; Naddafi, K.; Faridi, S.; Nabizadeh, R.; Sowlat, M.H.; Momeniha, F.; Gholampour, A.; Arhami, M.; Kashanif, H.; Zareg, A.; et al. Characterization of PAHs and metals in indoor/outdoor PM10/PM2.5/PM1 in a retirement home and a school dormitory. Sci. Total Environ. 2015, 527–528, 100–110. [Google Scholar] [CrossRef]
  9. Barnett-Itzhaki, Z.; Levi, A. Effects of chronic exposure to ambient air pollutants on COVID-19 morbidity and mortality—A lesson from OECD countries. Environ. Res. 2021, 195, 110723. [Google Scholar] [CrossRef] [PubMed]
  10. Gall, E.T.; Chen, A.; Chang, V.W.C.; Nazaroff, W.W. Exposure to particulate matter and ozone of outdoor origin in Singapore. Build. Environ. 2015, 93, 3–13. [Google Scholar] [CrossRef]
  11. Choi, S.; Kim, E.M.; Kim, S.Y.; Choi, Y.; Choi, S.; Cho, N.; Park, H.J.; Kim, K.K. Particulate matter exposure exacerbates cellular damage by increasing stress granule formation in respiratory syncytial virus-infected human lung organoids. Environ. Pollut. 2022, 315, 120439. [Google Scholar] [CrossRef] [PubMed]
  12. Rasheed, H.; Jayasree, T.K. The multifaceted role of indoor plants: A comprehensive review of their impact on air quality health, and perception. Energy Build. 2025, 330, 115312. [Google Scholar] [CrossRef]
  13. Chen, X.C.; Ward, T.J.; Cao, J.J.; Lee, S.C.; Chow, J.C.; Lau, G.N.C.; Yim, S.H.L.; Ho, K.F. Determinants of personal exposure to fine particulate matter (PM2.5) in adult subjects in Hong Kong. Sci. Total Environ. 2018, 628–629, 1165–1177. [Google Scholar] [CrossRef] [PubMed]
  14. Kendrick, C.M.; Koonce, P.; George, L.A. Diurnal and seasonal variations of NO, NO2 and PM2.5 mass as a function of traffic volumes alongside an urban arteria. Atmos. Environ. 2015, 122, 133–141. [Google Scholar] [CrossRef]
  15. Prakash, J.; Choudhary, S.; Raliya, R.; Chadha, T.; Fang, J.X.; Biswas, P. PM sensors as an indicator of overall air quality: Pre-COVID and COVID periods. Atmos. Pollut. Res. 2022, 13, 101594. [Google Scholar] [CrossRef]
  16. Chuang, K.J.; Lin, L.Y.; Ho, K.F.; Su, C.T. Traffic-related PM2.5 exposure and its cardiovascular effects among healthy commuters in Taipei Taiwan. Atmos. Environ. 2020, 7, 100084. [Google Scholar] [CrossRef]
  17. Grange, S.K.; Fischer, A.; Zellweger, C.l.; Alastuey, A.; Querol, X.; Jaffrezo, J.L.; Weber, S.; Uzu, G.; Hueglin, C. Switzerland’s PM10 and PM2.5 environmental increments show the importance of non-exhaust emissions. Atmos. Environ. 2021, 12, 100145. [Google Scholar] [CrossRef]
  18. Beji, A.; Deboud, K.; Khard, S.; Muresan, B.; Flament, P.; Fourmentin, M.; Lumière, L. Non-exhaust particle emissions under various driving conditions: Implications for sustainable mobility. Environment 2020, 81, 102290. [Google Scholar] [CrossRef]
  19. Jeong, C.H.; Wang, J.M.; Hilker, N.; Debosz, J.; Sofowote, U.; Su, Y.S.; Noble, M.; Healy, R.M.; Munoz, T.; Dabek-Zlotorzynska, E.; et al. Temporal and spatial variability of traffic-related PM2.5 sources: Comparison of exhaust and non-exhaust emissions. Atmos. Environ. 2019, 198, 55–69. [Google Scholar] [CrossRef]
  20. Liu, Y.S.; Yi, L.; Xu, Y.; Cabison, J.; Eckel, S.P.; Chu, D.; Lurvey, N.; Lerner, D.; Johnston, J.; Bastain, T.M.; et al. Spatial and temporal determinants of particulate matter peak exposures during pregnancy and early postpartum. Environ. Adv. 2024, 17, 100557. [Google Scholar] [CrossRef]
  21. Kralla, J.R.; Adibah, N.; Babin, L.M.; Lee, Y.C.; Motti, V.G.; McCombs, M.; McWilliams, A.; Thornburg, J.; Pollack, A.Z. Estimating exposure to traffic-related PM2.5 for women commuters using vehicle and personal monitoring. Environ. Res. 2020, 187, 109644. [Google Scholar] [CrossRef] [PubMed]
  22. Branco, P.T.; Pinto, A.J.; Sousa, S.I. Characterising indoor air quality in private vehicle cabins under unprecedented traffic conditions during COVID-19 lockdown. Build. Environ. 2024, 262, 111797. [Google Scholar] [CrossRef]
  23. Beddows, D.C.S.; Harrison, R.M. PM10 and PM2.5 emission factors for non-exhaust particles from road vehicles: Dependence upon vehicle mass and implications for battery electric vehicles. Atmos. Environ. 2021, 244, 117886. [Google Scholar] [CrossRef]
  24. Chae, E.J.; Bae, S.H.; Lee, S.W.; Yun, J.H.; Choi, S.S.P.P. Characteristics of particulate matter from asphalt pavement and tire of a moving bus through driving tests in city road and proving ground. Environ. Pollut. 2024, 344, 123336. [Google Scholar] [CrossRef]
  25. Kim, N.G.; Jeong, S.B.; Jina, H.C.; Lee, J.W.; Kima, K.H.; Kima, S.; Park, Y.m.; Choi, W.S.; Kwak, K.H.; Lee, H.H.; et al. Spatial and PMF analysis of particle size distributions simultaneously measured at four locations at the roadside of highways. Sci. Total Environ. 2023, 893, 164892. [Google Scholar] [CrossRef] [PubMed]
  26. Matthaios, V.N.; Harrison, R.M.; Koutrakis, P.; Bloss, W.J. In-vehicle exposure to NO2 and PM2.5 A comprehensive assessment of controlling parameters and reduction strategies to minimise personal exposure. Sci. Total Environ. 2023, 900, 165537. [Google Scholar] [CrossRef]
  27. Lim, S.; Barratt, B.; Holliday, L.; Griffiths, L.J.; Mudway, I.S. Characterising professional drivers’ exposure to traffic-related air pollution: Evidence for reduction strategies from in-vehicle personal exposure monitoring. Environ. Int. 2021, 153, 106532. [Google Scholar] [CrossRef]
  28. Hasan Shahariar, G.M.; Sajjad, M.; Suara, K.A.; Jahirul, M.I.; Chu-Van, T.; Ristovski, Z.; Brown, R.J.; Bodisco, T.A. On-road CO2 and NOx emissions of a diesel vehicle in urban traffic. Transp. Res. Part D Transp. Environ. 2022, 107, 103326. [Google Scholar] [CrossRef]
  29. Chang, T.B.; Sheu, J.J.; Huang, J.W. Vehicle air leakage ventilation and its effect on cabin indoor air quality. Proc. Inst. Mech. Eng. Part E J. Process Mech. Eng. 2017, 231, 1226–1234. [Google Scholar] [CrossRef]
  30. Chang, T.B.; Hsu, Y.T.; Huang, J.h.W. Optimal ventilation strategies for balancing carbon dioxide and suspended particulate matter concentrations in vehicle cabins. Atmos. Environ. 2024, 334, 120697. [Google Scholar] [CrossRef]
  31. Chang, T.B.; Lin, Y.S.; Hsu, Y.T. CFD Simulations of Effects of Recirculation Mode and Fresh Air Mode on Vehicle Cabin Indoor Air Quality. Atmos. Environ. 2023, 293, 119473. [Google Scholar] [CrossRef]
  32. Chang, T.B.; Sheu, J.J.; Huang, J.W.; Lin, Y.S.; Chang, C.C. Development of a CFD model for simulating vehicle cabin indoor air quality. Transp. Res. Part D Transp. Environ. 2018, 62, 433–440. [Google Scholar] [CrossRef]
  33. Experimental Route Google Map. Available online: https://www.google.com/maps/dir/23.0474643,120.2525654/23.0214854,120.3255224/23.005986,120.2482406/23.0474634,120.2526039/@23.0140902,120.2018413,11z/data=!4m4!4m3!2m1!1b1!3e0?authuser=0&entry=ttu&g_ep=EgoyMDI1MDgxNy4wIKXMDSoASAFQAw%3D%3D (accessed on 19 August 2025).
  34. Telaire 7000 CO2 Sensor. Available online: https://www.amphenol-sensors.com/hubfs/Documents/AAS-920-315C-Telaire-T7000-Series-032614-web.pdf (accessed on 19 August 2025).
  35. BE-1190 Multi-Component Gas Analyzer. Available online: https://www.belltone.com.tw/Product/CatalogEng/BE-1190Eng.pdf (accessed on 19 August 2025).
  36. ANSI/ASHRAE Standard 62.1-2013; Ventilation for Acceptable Indoor Air Quality. ASHRAE: Atlanta, Georgia, 2013. Available online: https://ierga.com/wp-content/uploads/sites/2/2017/10/ASHRAE-62.1-2013.pdf (accessed on 17 June 2024).
  37. Yang, W.C.; Wang, J.; Deng, E.; Liu, Y.K.; Luo, L.S.; Yang, J. A hybrid ventilation scheme applied to bidirectional excavation tunnel construction with a long inclined shaft. J. Cent. South Univ. 2024, 31, 3187–3205. [Google Scholar] [CrossRef]
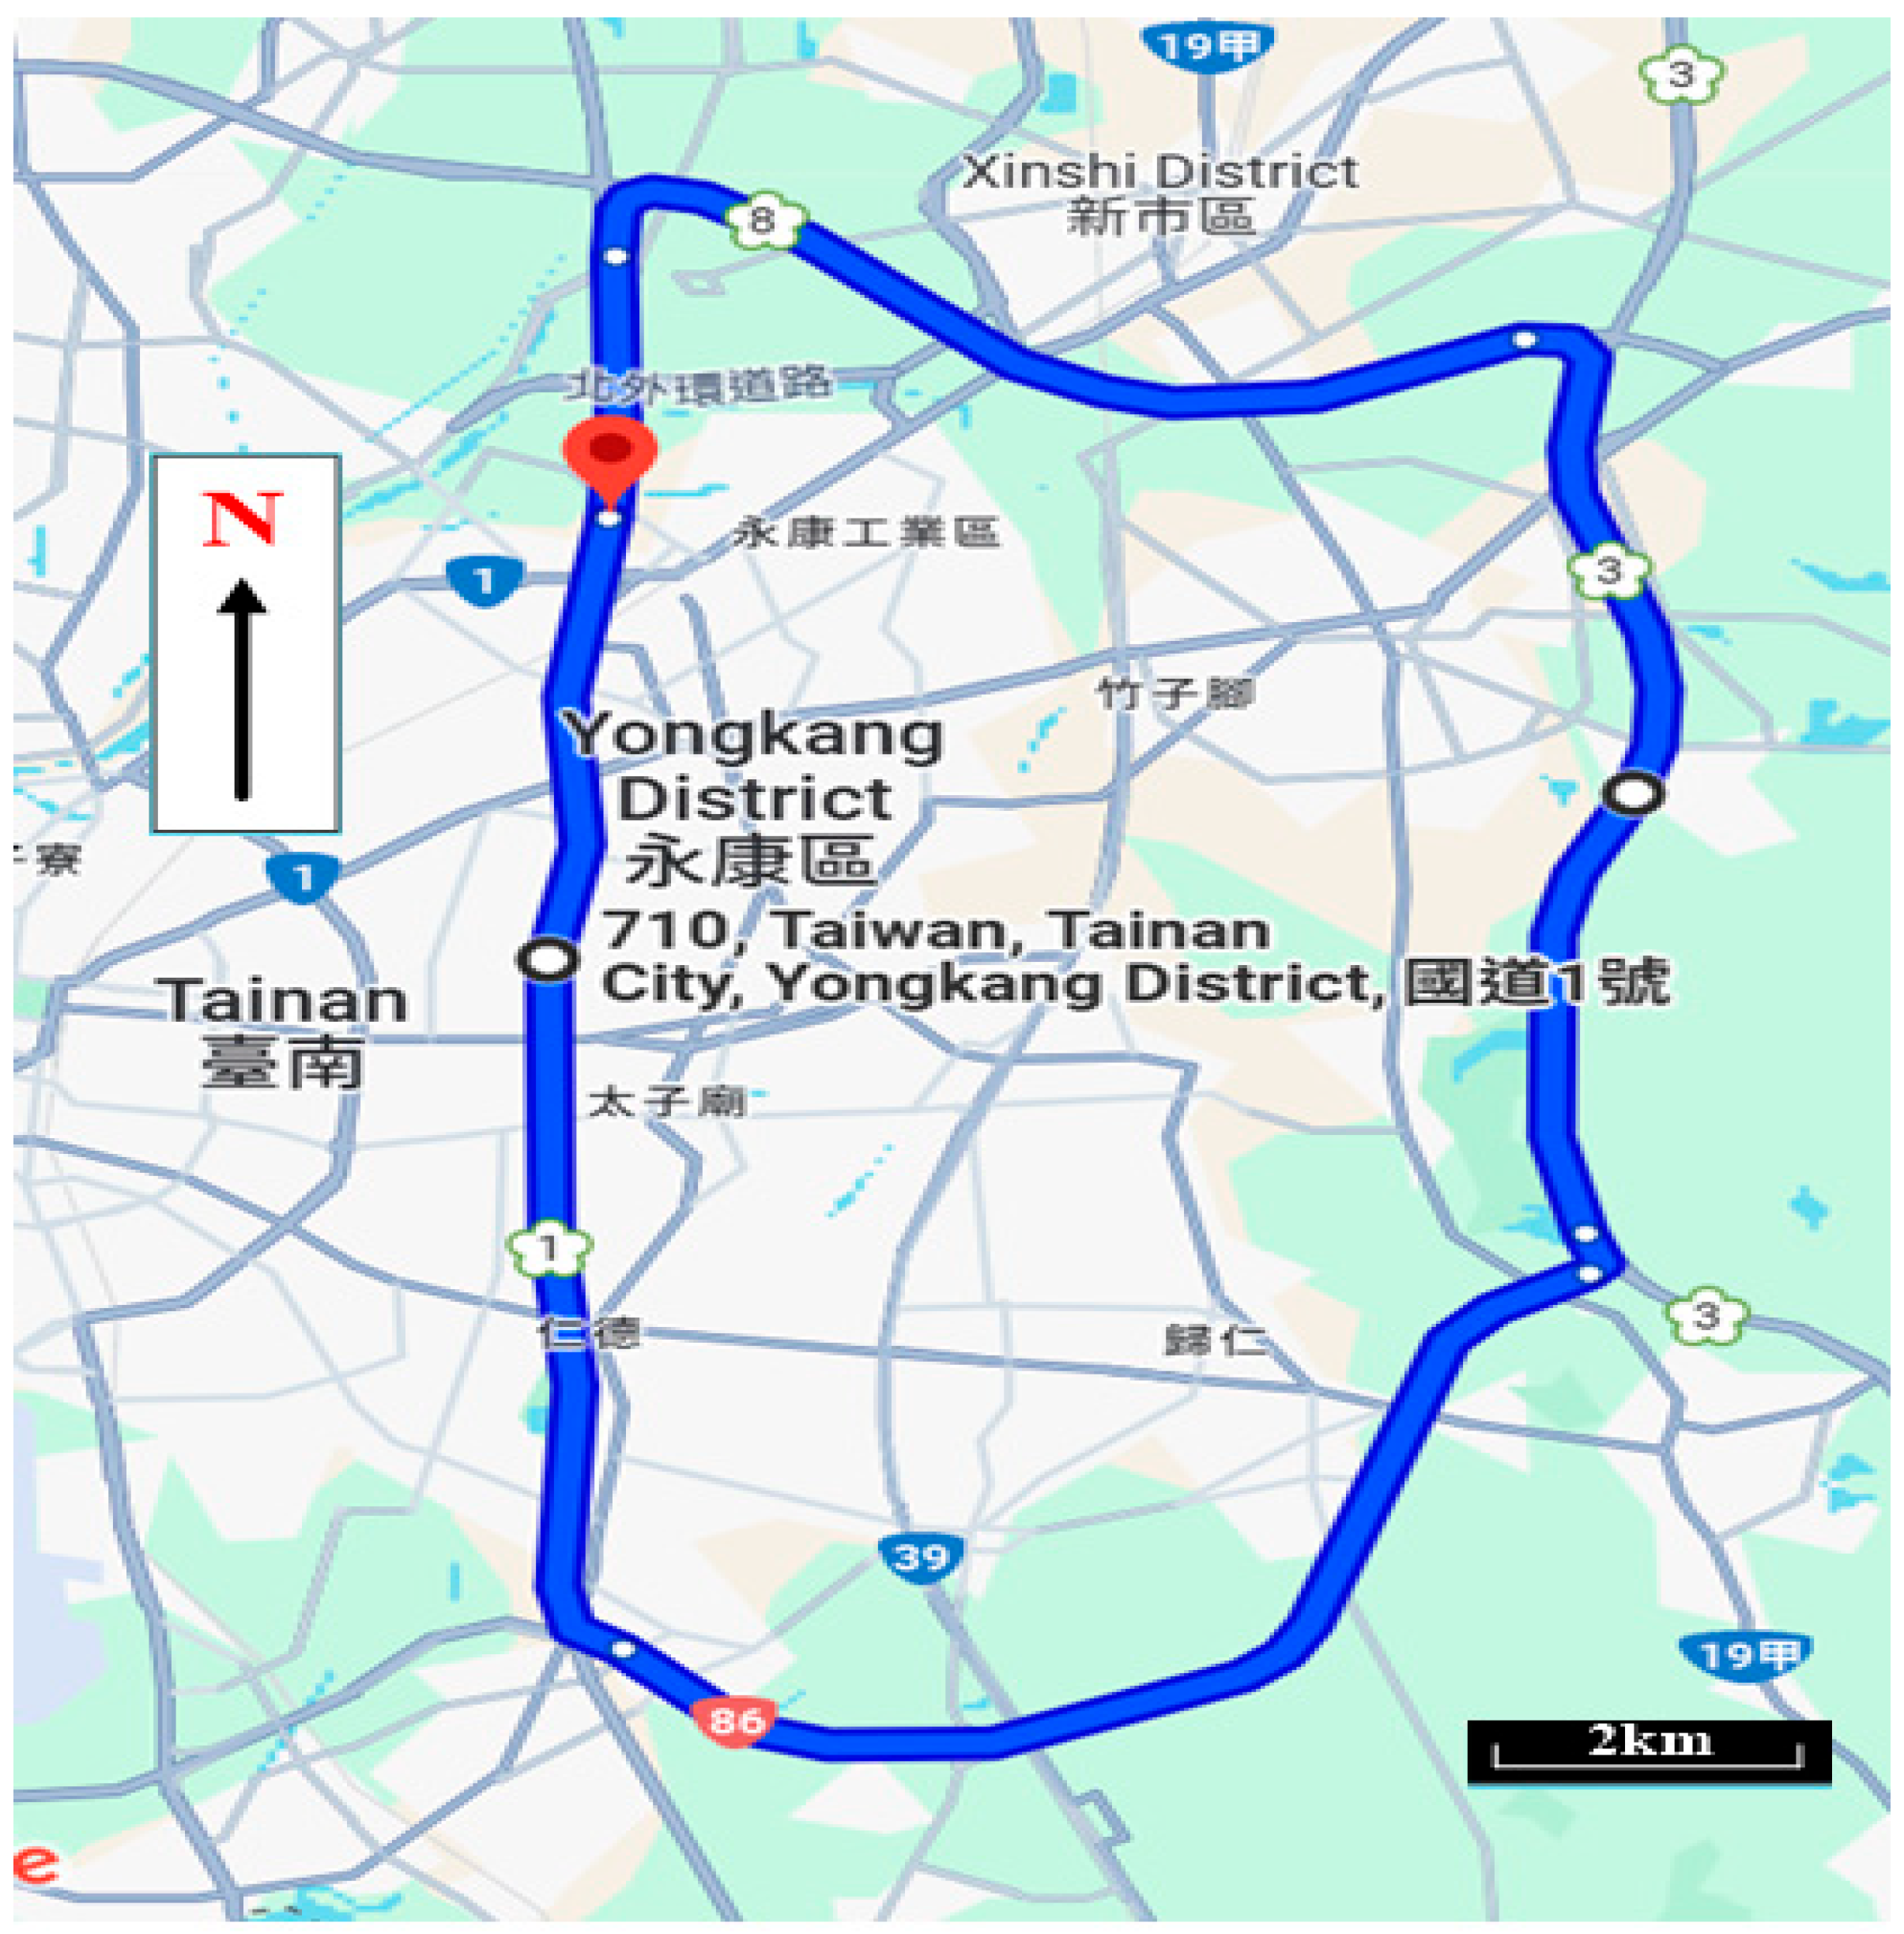
Figure 1. Experimental route [33].
Pollutants 05 00036 g001
Figure 2. Segment distances of experimental route.
Pollutants 05 00036 g002
Figure 3. Placement of measurement equipment.
Pollutants 05 00036 g003
Figure 4. Sampling point locations.
Pollutants 05 00036 g004
Figure 5. Sampling points at front of vehicle.
Pollutants 05 00036 g005
Figure 6. Sampling points on windshield.
Pollutants 05 00036 g006
Figure 7. CO2 concentration inside vehicle cabin at different driving speeds when using recirculation air mode and fresh air mode.
Pollutants 05 00036 g007
Figure 8. Schematic of leakage ventilation airflow into cabin of moving vehicle.
Pollutants 05 00036 g008
Figure 9. PM2.5 concentration inside vehicle cabin at different driving speeds when using recirculation air mode and fresh air mode.
Pollutants 05 00036 g009
Figure 10. PM10 concentration inside vehicle cabin at different driving speeds when using recirculation air mode and fresh air mode.
Pollutants 05 00036 g010
Table 1. The speed plan and dwell times per segment.
SegmentNational Highway No. 1National Highway No. 8National Highway No. 3Expressway No. 86
Speed
60 (km/h)14–16 (min)8–10 (min)10–12 (min)10–12 (min)
70 (km/h)12–14 (min)7–9 (min)8–10 (min)9–11 (min)
80 (km/h)10–12 (min)6–8 (min)7–9 (min)8–9 (min)
90 (km/h)9–11 (min)5–7 (min)6–8 (min)7–8 (min)
100 (km/h)8–10 (min)5–6 (min)6–7 (min)6–8 (min)
110 (km/h)7–9 (min)4–6 (min)5–7 (min)5–7 (min)
120 (km/h)7–8 (min)4–5 (min)5–6 (min)5–6 (min)
Table 2. Experimental equipment accuracy.
Equipment NameMeasured Parameter(s)Range/Accuracy
Telaire 7000 CO2 sensorCO2 concentration±5% for 0~2000 ppm [34]
±10% for 2000–10,000 ppm [34]
BE-1190 Multi-Component Gas AnalyzerPM2.5
PM10
CO2
±1 µg/m3 [35]
±1 µg/m3 [35]
±1 ppm [35]
Disclaimer/Publisher’s Note: The statements, opinions and data contained in all publications are solely those of the individual author(s) and contributor(s) and not of MDPI and/or the editor(s). MDPI and/or the editor(s) disclaim responsibility for any injury to people or property resulting from any ideas, methods, instructions or products referred to in the content.