Abstract
Milk and dairy products play a key role in the human diet but may also be vehicles for toxic contaminants, particularly heavy metals and metalloids (HMs), such as lead (Pb), cadmium (Cd), mercury (Hg), and arsenic (As). This integrative review examines peer-reviewed studies published between 2015 and 2025 to examine sources, occurrence, and health risks associated with HM contamination in milk and dairy products. Key sources include industrial emissions, agricultural runoff, contaminated feed and water, and inadequate packaging. This review highlights regulatory inconsistencies, limited surveillance, and underuse of metal speciation analysis, which hinder accurate toxicity assessment. Advances in trace-level HM detection systems are discussed in terms of sensitivity, accessibility, and feasibility. Studies from diverse geographic regions frequently report high levels of Pb and Cd in samples originating from industrialized areas in low- and middle-income countries. Health risk indicators, such as target hazard quotients (THQs) and margins of exposure (MOEs), often exceed safety thresholds, particularly in children, indicating significant public health risks, especially with prolonged exposure. These findings underscore the urgent need for systematic contaminant monitoring, harmonized regulations, source-focused mitigation policies, and investment in rapid, cost-effective testing technologies to safeguard milk and dairy product safety worldwide.
1. Introduction
Milk plays a vital role in human nutrition across all stages of life. It serves as the sole source of nutrients during the first six months, supporting optimal growth and development [1,2,3]. As individuals grow, their nutritional needs change, but milk and dairy products continue to be an important source of energy, high-quality proteins (3.0–3.9%), lipids (3.3–5.4%), and minerals (0.7–0.8%) [4,5,6,7].
These products make a significant contribution to the intake of calcium, phosphorus, magnesium, selenium, riboflavin, vitamin B12, and pantothenic acid [7,8]. Additionally, milk fat supports the absorption of fat-soluble vitamins (A, D, E, and K) [7].
Moreover, evidence from adult populations suggests an association between milk consumption and a reduction in risk factors for coronary heart disease, a lower incidence of type 2 diabetes in adults, and potential protective effects against certain types of cancer—most notably, colorectal and possibly bladder cancer [8,9]. The proteins and minerals in milk also contribute to increasing bone mineral density, improving intestinal health, preventing kidney stones, and regulating body weight [3,5,10].
These combined nutritional qualities and health benefits are reflected in global consumption trends. According to the Food and Agriculture Organization (FAO), more than 6 billion people worldwide consume milk and its derivatives, with per capita consumption having doubled in developing countries over the past sixty years [11,12]. The same organization forecasts a global increase in per capita consumption of 1.0% over the next decade [12].
As mentioned, milk and dairy products contain a small percentage of minerals, which include essential metals such as iron (Fe), calcium (Ca), zinc (Zn), and copper (Cu), which are vital for physiological and biochemical functions in living organisms [13]. Many of these elements function as enzyme cofactors, and their deficiencies can lead to functional impairments and pathological conditions [14,15,16,17,18,19].
Nevertheless, milk may also contain potentially toxic metal elements like lead (Pb), cadmium (Cd), and mercury (Hg), as well as arsenic (As), a metalloid. These elements have no biological role and can be hazardous at trace concentrations, making them a significant public health concern [2,7,16,20,21]. Exposure to such contaminants has been linked to a wide range of adverse health outcomes, including morphological abnormalities, cognitive deficits, central nervous system dysfunction, hepatic, prostatic, and renal impairments, hypertension, peptic ulcers, various forms of cancer, asthma, osteoporosis, endocrine disruption, gastrointestinal disorders, immune system suppression, and infertility [16,22,23].
Typically, the quantity of these species in milk is minimal, but several factors can substantially increase their levels, including environmental factors, agricultural practices, processing methods, and storage procedures [2,7,10,24,25].
Therefore, regulatory authorities recommend monitoring the levels of these and other contaminants in milk and dairy products to ensure their safety [21]. This quantification can also serve as an indirect indicator of environmental pollution in the area where the milk is produced [14].
Various analytical methodologies have been adopted to ensure this control, with special emphasis on atomic absorption spectroscopy (AAS), inductively coupled plasma optical emission spectroscopy (ICP-OES), and inductively coupled plasma mass spectrometry (ICP-MS) [26].
This review critically evaluates a wide range of peer-reviewed studies identified through an extensive literature search. The search was conducted using major databases, including PubMed, Web of Science, ScienceDirect, Google Scholar, and B-on. English-language keywords, such as “milk”, “dairy product”, “heavy metal”, “food safety”, “health risk”, “detection”, and “human health”, were used, combined with the Boolean operators “AND” and “OR.” Truncation with an asterisk (*) was applied to certain terms to capture variations in root words and enhance search sensitivity.
Inclusion criteria comprised articles published in English, available in full text, and dated between 2015 and 2025, with exceptions made for a limited number of earlier publications deemed relevant to the scope of the present work. Exclusion criteria included articles written in other languages, studies focusing on unrelated contaminants (e.g., aflatoxins, antibiotics, or pesticides), investigations involving heavy metals in human breast milk, and publications not available in full. The titles and abstracts from an initial set of 243 records were screened and assessed for inclusion in the review. A total of 72 articles were selected and thoroughly examined to draw conclusions about the current state of recent scientific evidence on heavy metal contamination in milk and dairy products. Of these, 14 studies that contained complete information related to the detection of Cd, Pb, As, and Hg in milk and dairy product samples from various countries were used to provide an overview of the contamination and assess the risk associated with human exposure to individual heavy metals through the consumption of these foods. Additional information was gathered from official government websites and relevant literature sources.
2. The Impact of Heavy Metals on Human Health
The concept of heavy metals (HMs) lacks a universally accepted definition; however, it typically refers to metals and metalloids that possess specific properties, such as a high density (exceeding 5–6 g/cm3) or molar mass ranging between 63.5 and 200 g/mol, a tendency to accumulate in the food chain, and significant toxicity to living organisms [26,27,28]. These toxic effects can cause damage to vital organs, such as the liver, heart, kidneys, and brain, compromising their functioning [1,2,29,30,31,32,33].
This category includes, among others, the toxic elements previously mentioned—Pb, Cd, Hg, and the metalloid As. Although they occur naturally in the environment—as a result of volcanic activity and rock weathering—their accumulation in soil, water, and air is primarily a consequence of anthropogenic activities associated with the lifestyle patterns of developed countries [34]. Population growth, urbanization, and the expansion of industrial and agricultural activities have led to increased concentrations of these elements in ecosystems. Key sources include industrial effluents, urban runoff, forest fires, sewage discharges, and pesticide use (Table 1) [26,35,36,37].
Unlike organic substances, HMs are essentially non-biodegradable and have a bioaccumulative nature—meaning that their concentrations increase as they move from lower to higher trophic levels in the food chain, a process known as biomagnification. Due to their low renal excretion rates, HMs can accumulate in the body over time, and prolonged exposure may result in carcinogenic, mutagenic, teratogenic, and endocrine-disrupting effects [24,32,38,39,40].
With a biological half-life of 15–30 years, Cd is primarily stored in the kidneys, bones, and liver, which—along with the respiratory and reproductive systems—are the main targets of its toxic effects (Table 1). Most toxicological studies on Cd have focused on its carcinogenic and nephrotoxic activities [41,42]; however, it is also known for its neurotoxicity and its ability to cross the placental barrier and reach fetal tissues [29].
Historical evidence from the late 1940s in Japan describes the emergence of Itai-Itai disease, a condition linked to excessive Cd exposure, which caused symptoms such as osteomalacia, osteoporosis, and frequent bone fractures [43]. Cd can also interfere with calcium deposition in bones, potentially leading to rickets [40]. In addition, exposure to Cd has been associated with the development of cardiovascular diseases and the alteration of metabolic pathways related to atherogenesis [44].
Lead is mainly absorbed through the respiratory and digestive systems and affects most organs in the human body, most notably, accumulating in the liver, kidneys, bones, and other tissues, similarly to calcium [22]. Its immunomodulatory, oxidative, and inflammatory mechanisms trigger hematological, cardiovascular, neurotoxic, and nephrotoxic effects (Table 1) [22,25,45,46]. Exposure to Pb can cause anemia, hypertension, kidney dysfunction, decreased cognitive function in adults, miscarriage, infertility in men, and behavioral disorders in children [2,31].
Mercury exists in three different chemical forms: elemental or metallic mercury (Hg), inorganic mercury (Hg22+ or Hg2+), and organic mercury (which contains methyl, ethyl, phenyl, or similar groups) [22,25]. It can impair normal mitochondrial function and cause oxidative stress, which may affect the nervous, cardiovascular, digestive, and immune systems, as well as the lungs, kidneys, skin, and eyes (Table 1) [20,26,40,47].
In the environment, As typically occurs as pentavalent arsenate (As5+) and trivalent arsenite (As3+), in both inorganic and organic forms, with the former being less toxic than the latter [22,26,43,48]. Its most common form in the air is Arsenic trioxide (As2O3), while organic forms are rare in water. In terrestrial food sources, the predominant forms are inorganic As and simple methylated species (methylarsonate, methylarsenite, and dimethylarsinate) [43].
The primary route of As absorption is through the small intestine. Once in the bloodstream, it is distributed to various tissues and organs, including the lungs, heart, kidneys, liver, muscles, and nervous tissue [22]. Both acute and chronic As toxicity are associated with the dysfunction of numerous vital enzymes, which are inhibited, resulting in widespread cellular damage (Table 1).

Table 1.
Main sources of heavy metal pollution and their health effects (adapted from [7,22,23,25,41]).
Table 1.
Main sources of heavy metal pollution and their health effects (adapted from [7,22,23,25,41]).
| Element | Main Source of Pollution | Consequences on Human Health |
|---|---|---|
| Cd | Phosphate fertilizers; industrial emissions; mining; smelting and refining of Cu and Ni; and production of pigments, plastics, and batteries | Neurotoxicity, carcinogenicity, nephrotoxicity, bone damage, liver toxicity, cardiovascular diseases, respiratory system effects, reproductive system effects, and fetal tissue damage. |
| Pb | Mining; smelting; and manufacture of batteries, paints, and gasoline | Cardiovascular diseases, neurotoxicity, nephrotoxicity, hematological changes (anemia), decreased cognitive function, miscarriage, infertility, and behavioral disorders. |
| Hg | Iron, steel, and cement industries; gold mining; recycling; batteries; fungicides; antiseptics; and disinfectants | Cardiovascular diseases, central nervous system damage, gastrointestinal disorders, immune system effects, renal and pulmonary dysfunction, ocular toxicity, dermatological effects, acrodynia, and excessive salivation. |
| As | Pesticides; herbicides; and insecticides | Cardiovascular diseases, liver damage, skin damage, central nervous system damage, gastrointestinal disorders, neurotoxicity, kidney, and lung and bladder cancer. |
Individuals who survive acute As poisoning may later suffer from diseases, such as melanosis, bone marrow suppression, hepatomegaly, and encephalopathy [29].
Chronic exposure to As is particularly dangerous for infants and young children [49]. Data suggest that its ingestion reduces IQ levels and leads to learning disabilities and mood disorders, such as depression [43,50].
Studies conducted on populations exposed to As by inhalation, particularly among miners and foundry workers, have shown higher rates of lung cancer. Additionally, increased exposure to As through drinking water has been associated with higher mortality rates from kidney, lung, and bladder cancers [29,43].
Skin lesions are one of the key symptoms of prolonged As exposure, which can be absorbed through the skin or wounds. Arsenic-induced skin cancers often indicate the development of other internal organ neoplasms, explained by immune dysregulation associated with As exposure [31,43].
3. Heavy Metals in Milk and Dairy Products
3.1. Sources of Contamination
Over the last decades, environmental contamination has risen exponentially, leading to significant ecological imbalances and negatively affecting both food quality and human health [25].
Plants, as fundamental components within natural as well as agricultural ecosystems, constitute the primary entry point for contaminants into terrestrial food chains, which subsequently propagate throughout the system and ultimately reach humans. In this context, the main contamination pathway is through the roots. Plants grown in polluted soils absorb and may accumulate HMs in their edible parts [24,32,51]. Consequently, animals that consume contaminated plants or feed are also exposed to HMs, which can accumulate in their tissues. In highly polluted areas, the risk of contamination is significantly higher [13,45].
In livestock, exposure can also occur via inhalation of contaminated air or ingestion of contaminated water. These metals can eventually be found in milk and its derivatives, given that mammary glands are among the most physiologically active parts of the body, making the transfer of toxic elements into milk plausible [2,4,24,35]. Additionally, several authors have reported that HM accumulation in milk is enhanced by the chemical affinity of these species to certain milk components—for example, Pb exhibits a strong binding affinity to casein [28,47].
This issue may be further aggravated by contamination occurring during transportation, processing, storage, and packaging [7,16,24,26]. Authors point out that milk is also subjected to chemical and biological contamination during the handling chain from the moment of milking to the point of pasteurization or sterilization and filling [28].
Figure 1 illustrates the multiple pathways through which HMs and other contaminants may enter the dairy production chain. These include environmental sources, such as contaminated feed, water, and soil, as well as atmospheric deposition and air pollution. Furthermore, post-harvest factors, such as packaging materials, can introduce or exacerbate contamination levels. This comprehensive model emphasizes the complexity of exposure routes, underscoring the importance of monitoring all stages—from farm to consumer.
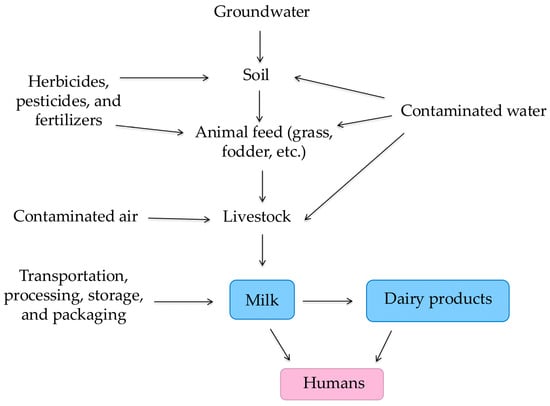
Figure 1.
Schematic representation of contamination pathways in the dairy production chain, including environmental (soil, water, and air), agricultural (feed), and post-harvest (packaging) sources that may contribute to heavy metal accumulation in milk and dairy products (adapted from [2,23]).
3.2. Regulatory Limits
Milk and dairy products are considered a high-risk food group in terms of HM contamination. Given their relatively low cost, high accessibility, and wide consumption across all age groups, it is essential to preserve their quality [24]. To address this risk, several governmental and international agencies have established regulatory limits for Pb in milk. Despite this, specific legal thresholds for dairy products or other HMs in milk remain largely undefined or are only applied to specific categories, such as infant formulas.
The European Commission has established in Regulation (EU) 2023/915 of 25 April 2023 on maximum levels of certain contaminants in foodstuffs a maximum Pb level of 0.020 mg/kg (wet weight) in raw milk, heat-treated milk, and milk intended for the manufacture of milk-based products [21]. Internationally, the Codex Alimentarius, developed by the FAO and WHO, sets the same maximum limit at 0.020 mg/kg for Pb in milk, aligning with European regulations [52].
Regarding Cd, regulatory authorities have not established specific maximum limits for milk itself. However, Regulation (EU) 2023/915 sets maximum concentration levels between 0.005 and 0.020 mg/kg for infant formulae and food for young children manufactured from cow’s milk proteins or cow’s milk protein hydrolysates [21].
Similarly, for As, Regulations (EU) 2023/915 and Commission Regulation (EU) 2023/465 of 3 March 2023 Amending Regulation (EC) N 1881/2006 as Regards Maximum Levels of Arsenic in Certain Foods establish maximum levels of 0.020 mg/kg (powdered form) and 0.010 mg/kg (liquid form) in infant formulae, follow-on formulae, food for special medical purposes intended for infants and young children, and formulae for young children [21,53]. Although no specific legal limits are set for milk and other dairy products, Regulation (EU) 2023/465 identifies milk and dairy products as significant contributors to dietary arsenic exposure and highlights the need for continued monitoring of this contaminant in food [53].
Commission Regulation (EU) 2018/73 of 16 January 2018 amending Annexes II and III to Regulation (EC) No 396/2005 of the European Parliament and of the Council as regards maximum residue levels for mercury compounds in or on certain products, sets the maximum residue limit for Hg (sum of mercury compounds expressed as mercury) in milk at 0.010 mg/kg; however, this value applies within the context of pesticide residue legislation rather than environmental contaminant regulation [54].
In line with the European regulatory framework, Codex limits are not established for Cd, Hg, or As in milk and dairy products, though general guidance exists for other food categories. Similarly, the U.S. Food and Drug Administration (FDA) does not define milk-specific limits for these elements, relying instead on broader toxicological risk assessments and good manufacturing practices to limit exposure [55]. Nevertheless, recent FDA guidelines set maximum levels of Pb in processed infant foods, including some dairy products, at 0.010 mg/kg for most products and 0.020 mg/kg for selected categories.
These differences highlight the importance of harmonized monitoring strategies to ensure public health protection globally.
3.3. Analytical Methodologies
Due to their essential or toxic nature, assessing the levels of trace elements in milk products is highly useful. As previously stated, these foodstuffs are a good source of Ca and Mg, while also supplying smaller amounts of essential elements such as Fe, Zn, and Cu. On the other hand, they may also contain varying levels of HMs that require careful monitoring.
HMs in milk and dairy products present a significant challenge due to the complex nature of these matrices and the typically low concentrations of the target elements [2,10,14]. The analytical procedures generally require sample pretreatment, often involving acid digestion, followed by elemental analysis using various detection techniques. Among the most commonly employed analytical techniques are AAS, ICP-OES, and ICP-MS [2,14]. AAS is a more affordable and straightforward option for the specific analysis of a limited number of elements, whereas ICP-OES and ICP-MS are preferred for multi-element analyses and when high sensitivity is required [56,57,58]. Each method has its own characteristics, and selecting the most appropriate one requires a careful evaluation of the advantages and limitations within the given context. For this reason, the literature reports a number of methodologies, including alternative detection techniques, such as electroanalytical techniques. Although generally less selective, these techniques are more cost-effective, easy to perform, reliable, and suitable for on-site applications [40,59].
AAS is a well-established and successful technique, widely used in analytical applications and quality control for the quantitative determination of elements at low concentrations in various matrices. One of its most distinctive features compared to emission procedures is its single-element nature, dependent on the availability of a specific radiation source for each element [23,60]. It is worth noting that, although not yet widely adopted, high-resolution continuum source AAS systems are now available. These emit radiation over a broad, continuous wavelength range, enabling the sequential analysis of multiple elements without the need to change the light source, thereby significantly enhancing its efficiency [61].
Regardless of the element under analysis, after sample preparation, atomization is required—a complex process where the sample is volatilized and decomposed to produce a gaseous atomic phase (Figure 2). The choice of atomization system depends mainly on the metal being determined, with four main options: flame atomization, electrothermal atomization, hydride generation, and cold vapor atomization [23]. Out of these, the latter two are often collectively referred to as chemical vapor generation.
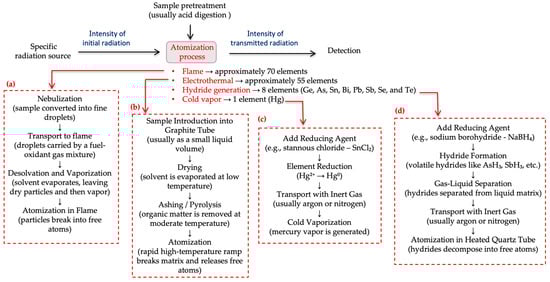
Figure 2.
Schematic representation of the atomic absorption spectroscopy (AAS) process, including simplified flowcharts of the four atomization techniques: (a) flame atomization, (b) electrothermal atomization, (c) hydride generation, and (d) cold vapor atomization. Each flowchart outlines the key steps involved in sample processing, atom formation, and detection.
The first two options allow atomization of dozens of elements, including Cd and Pb. In flame atomization (Figure 2a), the sample is first nebulized and then introduced into a flame, where compounds are dissociated into free atoms, which can then absorb radiation at specific wavelengths [23]. The amount of radiation absorbed by these atoms is measured and used to determine the concentration of the element in the sample being analysed. This system is operationally simple and low-cost. Despite these advantages, significant sample loss during nebulization (about 95%) and the short residence time of atoms in the flame greatly limit the method’s sensitivity, resulting in detection limits too high for quantitative applications involving trace-level elements [60,62].
Electrothermal atomization offers greater sensitivity than flame atomization and can be used for quantifying elements such as Cd and Pb (Figure 2b). In this case, the sample is atomized inside an electrically heated graphite tube, eliminating the need for a nebulization step. This approach offers improved detection limits, enhanced sensitivity, and requires smaller sample volumes [23] (Table 2). Nevertheless, analyses take longer, operation is more complex, precision is typically lower, costs are higher, and matrix interference risks are greater [60].
Table 2.
Comparison of some analytical characteristics of atomic spectrometry methods (adapted from [60,62,63]).
Regarding the determination of Hg (Figure 2c), it is carried out by cold vapor generation, because Hg is the only mineral element that can exist as a free atom in the gaseous state at room temperature. In this process, Hg is reduced to its atomic state and transported as vapor to the absorption cell. This process provides high sensitivity and specificity but requires specialized equipment and additional sample pretreatment steps [60].
Hydride generation (Figure 2d) is also an effective and sensitive method for determining As. In this process, As is converted into a volatile hydride, transported to a heated absorption cell where atomic vapor is formed and absorbance is measured [23]. Similar to the cold mercury vapor technique, this method offers high sensitivity, as sample loss due to nebulization is negligible, allowing for the detection of trace levels of As. Under normal conditions, only the analyte forms a volatile species, thus minimizing matrix interference effects. On the other hand, additional equipment is required for hydride generation, and special care is needed during sample preparation and handling [60].
While ASS methodologies remain suitable for routine low-cost analysis, ICP techniques are preferred for multi-element analysis at trace levels.
ICP-OES is widely used for the determination of metals in environmental samples, biological samples, water, food, etc. It is based on the thermal excitation of atoms or free ions in the gas phase and the subsequent emission of radiation as the excited species return to their ground energy state. The sample is introduced as an aerosol into the plasma (a cloud of ionized gas, usually argon, at temperatures between 6000 and 10,000 K). This energy is used to vaporize, dissociate, atomize, ionize, and excite the sample’s constituents. Each element emits radiation at a set of discrete and characteristic wavelengths upon returning to lower energy states. The emitted radiation is separated into its component wavelengths, allowing simultaneous quantification of multiple elements—one of the major advantages of atomic emission compared to AAS [60].
In addition to its multi-element capacity and more complete atomization compared to AAS, chemical interferences are largely eliminated due to the high plasma temperatures, and the analytical working range is much larger (4–6 orders of magnitude). The detection limits achieved are comparable to or slightly better than those of flame AAS but not as low as those obtained with electrothermal atomization [60]. The acquisition and maintenance costs of the equipment are quite high, operational complexity is greater, and matrix-related issues still persist—particularly physical interferences that can affect aspiration, nebulization, desolvation, and volatilization processes [60]. ICP-OES is also less suitable for determining more volatile elements (such as As).
Currently, ICP-MS is a widely used technique for the simultaneous determination of over 50 elements in just a few minutes [60]. As in ICP-OES, sample solutions are introduced into the plasma via a nebulizer, and the atoms and ions formed in the plasma are directed to a mass analyzer. The interface between the ICP and the mass spectrometer must ensure that a substantial portion of the ions produced is transported to the MS and that the ion beam maintains approximately the same composition as the plasma region from which it was extracted. The ions are then separated based on their mass-to-charge ratio (m/z) and sent to a detector, enabling the determination of elements at very low concentrations, with high sensitivity [60,63].
This technique offers a wide dynamic range and produces spectra that are generally simpler and easier to interpret than optical emission spectra [60]. These spectra are used to identify the elements in the sample and quantify them. In addition to the multi-element capability of ICP techniques, most elements can be detected at levels below parts per billion, limits lower than those achieved by electrothermal AAS.
The equipment is very expensive to purchase and maintain, requires specialized operators, and is susceptible to matrix interferences that require complex correction methods [60].
Table 2 summarizes the key features of the analytical techniques used for HM determination, highlighting differences in terms of detection limits, precision, sensitivity, sample throughput, and relative equipment cost (including maintenance). There are substantial differences in detection limits (LODs)—and, by extension, quantification limits (LOQs, typically ≥3 × LODs)—as well as in sensitivity (i.e., ability to distinguish between two closely spaced concentrations) and practical working range. ICP-MS exhibits the highest sensitivity, routinely achieving sub-ppb detection limits, and is, therefore, the most reliable choice for ultra-trace analysis. ICP-OES offers intermediate sensitivity, with LODs in the low-ppb range, while flame AAS generally presents higher LODs (often >1 ppb) and lower sensitivity. Consequently, measurements taken near the detection thresholds of AAS or ICP-OES may be less reliable than those from ICP-MS. However, for analyte concentrations well above all LODs, all three techniques yield consistent and mutually comparable results.
It is also important to note that method reliability also depends on factors beyond LODs and sensitivity—such as potential interferences, matrix effects, and sample-preparation protocols—which must be managed appropriately for each technique.
In conclusion, while all methodologies can provide accurate results within their optimal concentration ranges, ICP-MS offers the lowest detection limits and the broadest working range, making it the most reliable for trace-level quantification of HMs. Nevertheless, AAS techniques remain a useful cost-effective option for single-element determinations when simplicity and lower capital investment are priorities.
3.4. Reported Heavy Metal Levels in Milk and Dairy Products
This section provides an overview of levels of Cd, Pb, As, and Hg found in milk and dairy products, based on studies conducted by researchers from various countries using different analytical techniques. The aim is to provide a general idea of the levels of these contaminants in milk and dairy products worldwide.
In Italy, Esposito et al. [64] assessed 68 raw milk samples using ICP-MS and reported mean concentrations of 0.00302 ± 0.0017 mg/kg for As, 5.35 × 10⁻⁴ ± 5.3 × 10⁻⁴ mg/kg for Cd, 7.81 × 10⁻⁴ ± 1.5 × 10⁻⁴ mg/kg for Hg, and 0.00522 ± 0.0067 mg/kg for Pb (Table 3). Only one sample exceeded the Pb threshold, and despite being collected in an area polluted by industrial and domestic waste, the average levels were all below regulatory limits. This study suggests that determining HMs in raw milk can serve as an indirect tool for monitoring anthropogenic contamination.
Table 3.
Reported heavy metal concentrations in milk and dairy products 1.
A Chinese study, also using ICP-MS, analyzed 178 raw milk samples and found average As, Hg, and Pb concentrations of 1.31 × 10⁻³ ± 3.11 × 10⁻⁴ mg/kg, 2.24 × 10⁻³ ± 1.36 × 10⁻³ mg/kg and 8.25 × 10⁻³ ± 7.20 × 10⁻³ mg/kg, respectively, all below maximum limits [65] (Table 3). Cd was not detected. The authors also pointed out that HM analysis in milk is a useful indicator of environmental contamination and product quality. Therefore, these results indicate a low risk to consumers.
In southeastern Iran, a study analyzed 118 raw milk samples using electrothermal-AAS (ET-AAS), reporting Cd and Pb concentrations of 0.0047 ± 0.0010 mg/kg and 0.047 ± 0.0039 mg/kg, respectively [45] (Table 3). The Pb level exceeded the maximum permitted limit of 0.020 mg/kg. This finding was attributed to the proximity of the sampled farms to oil fields and petroleum-related infrastructure (pipelines and refineries).
Another study, carried out in two regions in southern Italy, determined the concentrations of Cd, Pb, and Hg in 79 samples of traditional cheese (both hard and fresh) using electrothermal AAS (ET-AAS) and chemical vapor AAS (CV-AAS) for Hg [66]. In hard cheese, the mean concentrations were Cd—0.004 ± 0.001 mg/kg, Hg—0.08 ± 0.03 mg/kg, and Pb—0.13 ± 0.10 mg/kg. In fresh cheese, the mean concentrations of Cd, Hg, and Pb were 0.002 ± 0.002 mg/kg, 0.04 ± 0.02 mg/kg, and 0.07 ± 0.04 mg/kg, respectively (Table 3). In this case, Pb and Hg exceeded the maximum permitted level in all samples. The authors highlight that the processes occurring during the production of hard cheese—particularly water loss during various stages—are among the main reasons for its higher HM content compared to fresh cheese. Other contributing factors include environmental conditions at processing sites, feed quality, the type of raw material used (cow, goat, and/or sheep milk), specific characteristics of the manufacturing processes, and potential contamination from equipment, packaging, and storage materials. The high Pb levels in the samples were attributed to environmental factors (i.e., local contamination) and contact of milk or cheese with metallic utensils during processing [28]. In contrast, the low Cd content was explained by minimal transfer of the metal from animal feed to milk. The presence of Hg may be linked to the excessive use of mercury-containing antifungal agents, or the consumption of food and/or water contaminated with this element [66].
In another study conducted in Mexico, As and Pb concentrations were determined using ICP-OES in 60 raw milk samples, 84 curd samples, 84 whey samples, and 24 samples of two cheese types (12 Oaxaca cheese and 12 Ranchero cheese) [67]. The concentrations in raw milk, fresh cheese, whey, and the two cheese types were 0.12 ± 0.08 mg/kg, 0.07 ± 0.05 mg/kg, 0.52 ± 0.4 mg/kg, 0.17 ± 0.1 mg/kg (Oaxaca), and 0.16 ± 0.07 mg/kg (Ranchero) for As and 0.03 ± 0.01 mg/kg, 0.02 ± 0.00 mg/kg, 0.07 ± 0.02 mg/kg, 0.05 ± 0.03 mg/kg (Oaxaca), and 0.11 ± 0.04 mg/kg (Ranchero) for Pb, respectively (Table 3). The concentration of Pb exceeded the regulatory limit. The highest Pb concentration was found in Ranchero cheese, while the highest As content was detected in whey, followed by the two cheese types, which showed similar levels. Cheese contamination was linked to the use of milk sourced from areas irrigated with industrial wastewater, as well as factors related to the cheese production process itself. Whey, formed during rennet-induced casein hydrolysis, contains most of the lactose, proteins, vitamins, and minerals, and is the precursor of Ranchero cheese. Its higher protein content leads to elevated Pb levels due to its affinity for whey proteins. Arsenic’s affinity for lipids explains its highest concentration in whey among all samples [67]. Several other studies [7,66,67] consistently reported that cheese contains higher levels of HMs than raw milk, due to its lower water content and higher protein levels.
In China, a larger-scale study involving the collection and analysis of 997 raw milk samples using ICP-MS reported mean concentrations of As, Cd, and Pb of 3.01 × 10⁻⁴ ± 9.90 × 10⁻⁴ mg/kg, 5 × 10⁻⁵ ± 7 × 10⁻⁵ mg/kg, and 1.70 × 10⁻³ ± 3.62 × 10⁻³ mg/kg, respectively [13] (Table 3). All of the values were below legal thresholds, likely due to minimal environmental contamination, leading to reduced HM transfer to pastures and water sources.
In Peru, a study by Chirinos-Peinado et al. [68] analyzed 20 raw milk samples collected from a farm located near a metallurgical complex using flame-AAS (F-AAS). The mean concentrations were 0.0197 ± 0.0073 mg/kg for Cd and 0.58 ± 0.018 mg/kg for Pb, exceeding the legal thresholds (Table 3). The elevated levels were explained by atmospheric emissions from metallurgical industries, whose airborne particle emissions, enriched with the HMs, settle into the soil and water, ultimately entering the food chain.
In Peru, Castro-Bedriñana et al. [69] quantified Cd and Pb in 40 raw milk samples collected near a mining–metallurgical industry using F-AAS. The mean concentrations were 0.01835 ± 0.0054 mg/kg for Cd and 0.577 ± 0.018 mg/kg for Pb (Table 3), exceeding the regulatory limits. These findings corroborate previous studies indicating that proximity to industrial areas contributes to environmental contamination, resulting in increased HM concentrations in milk.
In Iran, Jaafarzadeh et al. [1] analyzed 100 raw milk samples (from a region with intensive agricultural activity, as well as untreated municipal and industrial wastewater discharges) using ICP-OES. The mean concentrations of Pb and Cd were 0.53 ± 0.09 mg/kg and 0.0030 ± 0.0004 mg/kg, respectively (Table 3). Once again, Pb levels exceeded the legal threshold. The authors highlighted the contribution of industrial emissions and the need for management strategies, such as controlling industrial wastewater and waste discharge, to mitigate HM contamination.
A recent study conducted in Mansoura, Egypt, involving a total of 200 samples of milk and dairy products, reported mean concentrations of Hg in raw milk (n = 50), powdered milk (n = 50), fresh cheese (n = 50), and processed cheese (n = 50) of 0.0014, 0.0204, 0.0378, and 0.0022 mg/kg, respectively. For As, the values were 0.012, 0.120, 0.0764, and 0.052 mg/kg; for Pb: 0.1016, 0.3352, 0.2924, and 0.1256 mg/kg; and for Cd: 0.07, 0.1252, 0.1172, and 0.0576 mg/kg, respectively [7]. The analyses of As and Hg were performed using AAS with chemical vapor generation (CV-AAS), while Pb and Cd were determined using flame AAS (F-AAS) (Table 3). According to the results, Hg levels in raw milk were lower than the maximum permitted level (i.e., 0.010 mg/kg), while Pb was the predominant metal found in the analyzed samples, with levels exceeding the established limit in all samples. Of these, powdered milk showed the highest levels of all HMs. To explain these results, the authors pointed to both environmental contamination and additional factors such as the manufacturing process and the inappropriate use of packaging materials, including metal containers [7,47].
In Peru, Chirinos-Peinado et al. evaluated the Pb and Cd concentrations in the soil, pastures, and raw milk produced at three sites in the Mantaro River headwaters [32]. The average concentrations of these metals were 0.217 mg/kg for Pb and 0.178 mg/kg for Cd, regarded as alarming results and attributed to the use of phosphorus agrochemicals, irrigation waters, and mining activity. This study showed that the transfer and bioaccumulation of Cd from soil to grass and then to milk was significantly higher (41 times greater) than that of Pb, but that factors such as soil fertility, organic matter content, and plant-specific characteristics also influenced the bioaccumulation of these metals.
Alam et al. [3] assessed the concentrations of Pb, Cd (by ET-AAS), Hg, and As (using CV-AAS) in 46 branded liquid and powdered milk samples commonly consumed in Dhaka, Bangladesh. The researchers quantified metal contents and evaluated associated health risks for six age groups, including both sexes. The study found that while average concentrations of toxic metals were mostly within permissible limits, certain samples—particularly powdered milk—exceeded thresholds for Pb in 13–25% of cases. The authors concluded that improved regulation, green farming practices, and continuous monitoring are necessary to mitigate HM exposure through milk consumption.
Olowoyo et al. [2] conducted a study in South Africa assessing the levels of Pb and As in fresh milk samples obtained from dairy farms and retail stores. Pb concentrations ranged from 0.016 ± 0.003 to 0.070 ± 0.077 mg/kg in farm samples and from 0.013 ± 0.007 to 0.035 ± 0.017 mg/kg in store samples. The levels of As varied between 0.017 ± 0.017 and 0.028 ± 0.017 mg/kg in farms and 0.020 ± 0.032 and 0.028 ± 0.040 mg/kg in stores. Considering the mean concentration and standard deviations, the authors concluded that Pb and As levels were within the acceptable limits, observing no significant differences between the sample types, and emphasized the importance of regular HM monitoring.
In a recent study conducted in Egypt by Ibrahim et al. [17], the concentration of trace metals was analyzed in a variety of dairy products consumed by children, including UHT milk, pasteurized flavored milk, milk powder, yogurt, drinking yogurt, and ice cream. Cd and Hg were found to be below detection limits across all products, while in several samples, Pb exceeded the European Commission’s limit. The highest levels of Pb (0.104 mg/kg) and As (0.037 mg/kg) were detected in strawberry drinking yogurt and strawberry yogurt, respectively. These findings raised concerns about the safety of flavored dairy products, particularly those intended for children. The authors highlighted the urgency for stricter quality control measures in the sourcing of raw materials, such as cocoa and fruit purees, and in production processes to limit HM contamination. Regular monitoring and regulatory enforcement were recommended to ensure consumer safety, particularly for vulnerable populations, such as toddlers.
Overall, the literature shows that HM contamination in milk and dairy products tends to be more prevalent in developing countries, potentially due to less stringent environmental regulations. Differences among studies may also stem from analytical methodologies, sample size, geographical variation, and production conditions, as well as contamination during transport, processing, packaging, and storage.
3.5. Risk Assessment
The non-carcinogenic health risk associated with dietary exposure to HMs and metalloids through the consumption of milk and dairy products can be assessed using the target hazard quotient (THQ). This parameter estimates the risk level posed by the intake of a single contaminant as shown in Equation (1). THQ values below 1 suggest low risk, while values greater than 1 indicate possible health concerns [70].
where
- EDI is the estimated daily intake (mg/kg·body weight/day), and
- RfD is the reference dose (mg/kg body weight/day), a threshold below which adverse health effects are unlikely to occur.
The estimated daily intake (EDI) is calculated using Equation (2):
where
- DC is the daily consumption of the product (kg/day),
- Cm is the mean concentration of the metal or metalloid (m) in the product (mg/kg), and
- BW is the body weight (kg).
Daily consumption (DC) may vary depending on factors such as age, dietary habits, cultural background, geographic region, and lifestyle. According to national dietary surveys (e.g., USDA, EFSA, and China National Nutrition Survey), DC values range from 0.1 kg/day for low consumers to 0.5–1.0 kg/day for children or high consumers [71,72,73]. These variations significantly impact the EDI and should be considered when assessing both average and high-risk exposure scenarios.
To assess the potential health risks posed by toxic elements, regulatory agencies—including the U.S. Environmental Protection Agency (EPA), the European Food Safety Authority (EFSA), and the Joint FAO/WHO Expert Committee on Food Additives (JECFA)—have established reference values or risk assessment methodologies. These differ in both units and approach: the EPA traditionally expresses tolerable exposure levels as reference doses (RfDs, in mg/kg body weight/day), while EFSA uses tolerable weekly intakes (TWIs, in µg/kg body weight/week), which correspond to the maximum amount of a substance that can be ingested weekly over a lifetime without posing a significant risk to human health. JECFA established provisional tolerable weekly (or monthly) intakes (PTWI, in µg/kg body weight/week, or PTMI, in µg/kg body weight/month), defined as the estimated amount of a contaminant that can be ingested weekly or monthly over a lifetime without appreciable health risk. The term “provisional” indicates that the value may be revised as new scientific data become available.
When no threshold for safe intake can be established—as is the case for inorganic As and Pb—EFSA recommends applying the margin of exposure (MOE) approach, calculated as shown in Equation (3):
where
- BMDL is the benchmark dose lower confidence limit, expressed in mg/kg body weight/day, represents the lower confidence limit of the benchmark dose (BMD), a statistically estimated dose of a substance that produces a predefined low level of adverse effect (e.g., 1% or 10% increase in risk) in a population, and
- EDI is the estimated daily intake, expressed in mg/kg body weight/day, that reflects the actual human exposure from dietary or environmental sources.
The MOE is a dimensionless ratio used to estimate the proximity of actual exposure to a dose known to produce adverse effects. A higher MOE indicates that exposure is well below the reference point and therefore suggests a lower health risk. Conversely, a lower value means the exposure is closer to the harmful dose, implying a reduced safety margin and a potentially greater concern for adverse health effects. This method is especially relevant for substances with genotoxic or carcinogenic potential, for which no safe exposure threshold can be defined.
Table 4 summarizes reference values or risk assessment strategies currently in use for selected toxic elements.
Table 4.
Reference values for selected heavy metals and metalloids from EPA, EFSA, and JECFA [74,75,76,77,78,79].
When multiple contaminants are present in a food product, cumulative exposure can be assessed using the total target hazard quotient (TTHQ), as shown in Equation (4):
where is the target hazard quotient for the individual contaminant i, representing the non-carcinogenic health risk associated with exposure to a specific heavy metal or metalloid.
A TTHQ value greater than 1 indicates a potential health concern resulting from combined exposure to multiple toxic elements, particularly in the context of long-term consumption. This approach is especially important for complex food matrices like milk and dairy products, which may simultaneously contain Pb, Cd, Hg, and As at low but biologically relevant levels.
Table 5 presents a comparative overview of EDI values for As, Cd, Hg, and Pb resulting from the consumption of various dairy products across different geographical regions, as reported in the scientific studies. For each toxic element, the EDI values are provided along with the corresponding percentage of the provisional tolerable daily intake (PTDI) or BMDL, as well as the calculated THQ. When available, the table also differentiates between age groups—including toddlers, children, and adults—allowing for a clearer assessment of potential health risks associated with dietary exposure.
Table 5.
The estimated daily intakes (EDIs; mg/kg body weight/day), provisional tolerable daily intakes (PTDIs; %), benchmark dose lower confidence limits (BMDLs; %), margins of exposure (MOEs), and target hazard quotients (THQs) of the toxic elements analyzed in the different studies.
Several studies reported that Pb and Cd often exceed health-based safety thresholds, with THQ values reaching up to 6.03 in children, who are more vulnerable due to their higher intake relative to body weight [32,80]. These findings suggest that some consumers, particularly in younger age groups, may be exposed to non-negligible health risks through the intake of HMs from dairy products.
In contrast, the reported concentrations of Hg and As generally remained below critical thresholds, indicating lower health risks under typical consumption scenarios. These conclusions are further supported by recent probabilistic risk assessment studies, such as the study by Hasanvand et al., which reported mean THQ values for Pb and Cd as 70.77 and 9.11, respectively, far exceeding the threshold of 1 and highlighting serious potential health concerns. Conversely, the mean THQ values for As and Hg were significantly lower (0.28 and 0.08, respectively), implying comparatively reduced risk from these elements under the studied conditions [26].
Importantly, the same study calculated an overall TTHQ of 80.24, with Pb identified as the predominant contributor (88.2%), followed by Cd (11.35%), As (0.35%), and Hg (0.10%). These findings reinforce the notion that Pb contamination in milk remains a major driver of cumulative exposure risk and highlight the need for more targeted surveillance and regulatory control measures.
This perspective is further supported by two global systematic reviews that reveal concerning levels of HMs in milk. Boudebbouz et al. assessed HM concentrations in raw cow milk across various regions and found that average Pb levels frequently exceeded internationally recommended safety limits. Their review also underscored chronic exposure risks associated with Cd and Zn, particularly for vulnerable populations, and emphasized the lack of systematic monitoring in many developing countries [5].
Similarly, Kerdoun and Djafer conducted a global systematic review focusing on camel milk, which is widely consumed in arid regions. Their findings revealed elevated concentrations of elements such as Cd, Pb, and Al, with associated health risk assessments indicating that, especially in children, THQ values for both Cd and Pb frequently approached or exceeded the safety threshold of 1. The authors stressed the urgent need for region-specific food safety policies tailored to local production and consumption patterns [80].
Given the high toxicity, bioaccumulation potential, and known neurotoxic effects of As and Hg, the continued monitoring of these elements remains essential to protect public health—particularly among vulnerable groups, such as children.
It is also important to note that most existing studies report total concentrations of HMs. While this approach is valuable for establishing baseline exposure levels, it does not account for chemical speciation, which greatly influences both toxicity and bioavailability. For instance, total arsenic measurements do not distinguish between toxic inorganic forms and less harmful organic species, such as arsenobetaine. Likewise, total mercury quantification does not differentiate between inorganic mercury and methylmercury, the latter being more toxic and prone to bioaccumulation.
Although analytically more demanding, metal speciation can greatly enhance the accuracy of health risk assessments. A limited number of recent studies have demonstrated the feasibility of speciation analysis in dairy matrices. For example, Xiong et al. (2024) successfully applied high-performance liquid chromatography coupled with inductively coupled plasma mass spectrometry (HPLC-ICP-MS) to identify arsenic species in cow’s milk from seaweed-fed animals [81]. Likewise, Iwai et al. developed a high-throughput method for mercury speciation in human breast milk using the same methodology, paving the way for future applications in bovine milk and dairy products [82]. These pioneering efforts underscore the importance of incorporating chemical speciation in future research to more precisely evaluate the health implications of trace element exposure through milk consumption.
4. Conclusions
Milk and dairy products are nutritionally rich and widely consumed foods, but are increasingly recognized as potential vectors of exposure to toxic elements, particularly Pb, Cd, Hg, and As.
Contamination of milk and dairy products by HMs originates primarily from environmental and agricultural sources. Industrial activities, traffic emissions, mining operations, and the incineration of urban and industrial waste contribute to the contamination of soil, water, and air, which may affect grazing areas and water used in dairy farming. Additionally, the use of contaminated animal feed, irrigation with polluted water, and application of fertilizers and pesticides containing metal residues represent key pathways through which HMs can enter the food chain. During processing, migration from metallic equipment and containers has also been identified as a relevant source of contamination, particularly in regions with inadequate safety protocols or aging infrastructure.
Heavy metal contamination in milk and dairy products is a widespread issue, with several toxic elements often detected at elevated levels. In the case of Pb, concentrations frequently exceed established regulatory limit. Products such as cheese and powdered milk, which have lower water content and higher protein or fat levels, exhibit even higher metal concentrations.
The associated health risks are significant. Pb is especially concerning due to its well-established neurotoxicity in children, while Cd has been strongly associated with renal dysfunction and bone demineralization. Although Hg and As have been less frequently detected, their high toxicity, bioaccumulative potential, and endocrine-disrupting effects highlight the need for ongoing vigilance. Toxicological risk indicators calculated from selected data exceed accepted safety thresholds in several cases, with THQ values reaching 6.03 in children, indicating a significant public health concern, particularly with chronic exposure in contaminated regions.
In this context, it is essential to reinforce the regulatory and surveillance frameworks governing milk safety. Routine monitoring of HMs in dairy products should be established as standard practice. Regulatory limits must be harmonized and updated in line with current toxicological evidence, particularly to protect vulnerable populations, such as infants and children. Measures aimed at controlling upstream contamination, through the regulation of animal feed, irrigation water, fertilizers, and packaging materials, should be prioritized to prevent accumulation at the source. Moreover, the adoption of robust and sensitive hyphenated analytical techniques, such as chromatographic techniques coupled to ICP and MS, is crucial to reliably detect trace concentrations of contaminants. Special emphasis should be placed on integrating metal speciation analysis into routine practice, as it provides more accurate estimates of bioavailable and toxicologically relevant forms. At the same time, investment in portable, low-cost detection technologies can improve surveillance coverage, particularly in low-resource regions where laboratory infrastructure is limited. Promoting good agricultural and manufacturing practices, alongside capacity-building and training programs for producers and health professionals, is also essential to reduce contamination risks and enhance food safety awareness.
In conclusion, while milk and dairy products continue to represent an essential part of a balanced diet, their contamination with HMs constitutes a concrete and preventable food safety challenge. Ensuring the safety of these products requires coordinated regulatory action, technological innovation, and international collaboration to safeguard public health and preserve consumer confidence in the global dairy supply chain.
Author Contributions
Conceptualization, M.R.S.S. and E.T.R.S.; methodology, M.R.S.S. and E.T.R.S.; validation, M.R.S.S., A.M.P. and R.I.L.C.; formal analysis, M.R.S.S. and E.T.R.S.; investigation, E.T.R.S.; writing—original draft preparation, E.T.R.S.; writing—review and editing, M.R.S.S., A.M.P., R.I.L.C. and M.F.C.L.; visualization, M.R.S.S., A.M.P. and R.I.L.C.; supervision, M.R.S.S.; project administration, M.R.S.S. All authors have read and agreed to the published version of the manuscript.
Funding
This research received no external funding.
Data Availability Statement
No new data were created or analyzed in this study.
Conflicts of Interest
The authors declare no conflicts of interest.
Correction Statement
This article has been republished with a minor correction to the Data Availability Statement. This change does not affect the scientific content of the article.
Abbreviations
The following abbreviations are used in this manuscript:
| AAS | Atomic absorption spectroscopy |
| BMDL | Benchmark dose lower confidence limit |
| BW | Body weight |
| Cm | Average concentration of the metal or metalloid m in the product |
| CV-AAS | Chemical vapor generation atomic absorption spectroscopy |
| DC | Daily product consumption |
| EDI | Estimated daily intake |
| EFSA | European Food Safety Authority |
| EPA | Environmental Protection Agency |
| ET-AAS | Electrothermal atomic absorption spectroscopy |
| F-AAS | Flame atomic absorption spectroscopy |
| FAO | Food and Agriculture Organization |
| FDA | Food and Drug Administration |
| HM | Heavy metal |
| ICP-MS | Inductively coupled plasma mass spectrometry |
| ICP-OES | Inductively coupled plasma optical emission spectroscopy |
| JECFA | Joint FAO/WHO Expert Committee on Food Additives |
| MOE | Margin of exposure |
| PTDI | Provisional tolerable daily intake |
| PTMI | Provisional tolerable monthly intake |
| PTWI | Provisional tolerable weekly intake |
| RfD | Reference dose |
| THQ | Target hazard quotient |
| TTHQ | Total target hazard quotient |
| TWI | Tolerable weekly intake |
| WHO | World Health Organization |
References
- Jaafarzadeh, N.; Tari, K.; Samarghandi, M.R.; Panahi Fard, M.; Jorfi, S.; Feizi, R.; Mehrbakhsh, M. Non-carcinogenic risk assessment of cadmium and lead in raw milk from dairy production farms in Iran, using Monte Carlo Simulation approach. J. Food Compos. Anal. 2023, 115, 104864. [Google Scholar] [CrossRef]
- Olowoyo, J.O.; Mutemula, M.L.; Agbool, O.O.; Mugivhisa, L.L.; Olatunji, O.O.; Oladeji, O.M. Trace metals concentrations in fresh milk from dairy farms and stores: An assessment of human health risk. Toxicol. Rep. 2024, 12, 361–368. [Google Scholar] [CrossRef]
- Alam, M.N.E.; Ullah, A.K.M.A.; Hosen, M.M.; Maksud, M.A.; Khan, S.R.; Akon, S.; Nahar, Q.; Jolly, F.; Quraishi, S.B. Evaluation of essential and trace metals/metalloids distribution and probable human health risk implications from branded liquid and powder milks available in Dhaka City, Bangladesh. Biometals 2024, 37, 859–875. [Google Scholar] [CrossRef]
- Năstăsescu, V.; Mititelu, M.; Goumenou, M.; Docea, A.O.; Renieri, E.; Udeanu, D.I.; Oprea, E.; Arsene, A.L.; Dinu-Pîrvu, C.E.; Ghica, M. Heavy metal and pesticide levels in dairy products: Evaluation of human health risk. Food Chem. Toxicol. 2020, 146, 111844. [Google Scholar] [CrossRef]
- Boudebbouz, A.; Boudalia, S.; Bousbia, A.; Habila, S.; Boussadia, M.I.; Gueroui, Y. Heavy metals levels in raw cow milk and health risk assessment across the globe: A systematic review. Sci. Total Environ. 2021, 751, 141830. [Google Scholar] [CrossRef]
- Kamal, G.M.; Rehmani, M.; Iqbal, S.; Uddin, J.; Nazir, S.; Rehman, J.; Hussain, A. The determination of potentially toxic elements (PTEs) in milk from the Southern Cities of Punjab, Pakistan: A health risk assessment study. J. Food Compos. Anal. 2022, 108, 104446. [Google Scholar] [CrossRef]
- Elafify, M.; El-toukhy, M.; Sallam, K.; Sadoma, N.; Abd-Elghany, S.; Abdelkhalek, A.; El-Baz, A. Heavy metal residues in milk and some dairy products with insight into their health risk assessment and the role of Lactobacillus rhamnosus in reducing the lead and cadmium load in cheese. Food Chem. Adv. 2023, 2, 100261. [Google Scholar] [CrossRef]
- FAO. Milk and Dairy: Questions and Answers. Food and Agriculture Organization of the United Nations. Available online: https://www.fao.org/fileadmin/user_upload/newsroom/docs/Milk%20and%20Dairy%20Q&A.pdf (accessed on 2 February 2025).
- Castro-Bedriñana, J.; Chirinos-Peinado, D.; Ríos-Ríos, E.; Castro-Chirinos, G.; Chagua-Rodríguez, P.; De La Cruz-Calderón, G. Lead, cadmium, and arsenic in raw cow’s milk in a central Andean area and risks for the Peruvian populations. Toxics 2023, 11, 809. [Google Scholar] [CrossRef]
- Bakircioglu, D.; Topraksever, N.; Yurtsever, S.; Kizildere, M.; Kurtulus, Y.B. Investigation of macro, micro and toxic element concentrations of milk and fermented milk products by using an inductively coupled plasma optical emission spectrometer, to improve food safety in Turkey. Microchem. J. 2018, 136, 133–138. [Google Scholar] [CrossRef]
- FAO. Gateway to Dairy Production and Products. Available online: https://www.fao.org/dairy-production-products/products/en/ (accessed on 2 February 2025).
- FAO; OECD. Dairy and Dairy Products—OECD-FAO Agricultural Outlook 2019–2028. Available online: https://openknowledge.fao.org/server/api/core/bitstreams/2577ae88-f8de-4a5d-a931-4c4d6ba5aac3/content (accessed on 2 February 2025).
- Zhou, X.; Qu, X.; Zheng, N.; Su, C.; Wang, J.; Soyeurt, H. Large scale study of the within and between spatial variability of lead, arsenic, and cadmium contamination of cow milk in China. Sci. Total Environ. 2019, 650 Pt 2, 3054–3061. [Google Scholar] [CrossRef]
- Akele, M.L.; Abebe, D.Z.; Alemu, A.K.; Assefa, A.G.; Madhusudhan, A.; de Oliveira, R.R. Analysis of trace metal concentrations in raw cow’s milk from three dairy farms in North Gondar, Ethiopia: Chemometric approach. Environ. Monit. Assess. 2017, 189, 499. [Google Scholar] [CrossRef]
- Al Sidawi, R.; Ghambashidze, G.; Urushadze, T.; Ploeger, A. Heavy metal levels in milk and cheese produced in the Kvemo Kartli region, Georgia. Foods 2021, 10, 2234. [Google Scholar] [CrossRef]
- Rafiq, A.; Shah, M.H.; Mohany, M.; Tahir, A.A.; Elsadek, M.F.; Qayyum, M.A.; Abbasi, A.M. Evaluation of Potentially Toxic Trace Metals and Associated Health Risk Assessment in Buffalo Milk. Int. J. Environ. Res. Public Health 2022, 19, 14678. [Google Scholar] [CrossRef] [PubMed]
- Ibrahim, A.S.; Awaad, S.S.; Shehta, H.A.; Hegab, O.W. Dietary Exposure and Health Risk Assessment of Selected Toxic and Essential Metals in Various Flavored Dairy Products. Biol. Trace Elem. Res. 2025. Advance online publication. [Google Scholar] [CrossRef]
- Antunović, Z.; Mioč, B.; Novoselec, J.; Širić, I.; Držaić, V.; Klir Šalavardić, Ž. Essential trace and toxic element content in Lacaune sheep milk during lactation. Foods 2023, 12, 4291. [Google Scholar] [CrossRef]
- Zharykbasov, Y.; Kakimova, Z.; Kakimov, A.; Zharykbasova, K.; Mirasheva, G.; Ibragimov, N.; Toleubekova, S.; Muratbayev, A.; Tulkebayeva, G.; Yessimbekov, Z. Studying the concentration of xenobiotics in milk and developing the biosensor method for their rapid determination. Heliyon 2023, 9, e19026. [Google Scholar] [CrossRef] [PubMed]
- Sant’Ana, M.; Carvalho, T.; Silva, I. Concentration of heavy metals in UHT dairy milk available in the markets of São Luís, Brazil, and potential health risk to children. Food Chem. 2021, 346, 128961. [Google Scholar] [CrossRef] [PubMed]
- European Commission. Regulation (EU) 2023/915 of 25 April 2023 on Maximum Levels of Certain Contaminants in Foodstuffs; Official Journal of the European Union, L119, 5 May 2023; Publications Office of the European Union: Brussels, Belgium, 2023; pp. 103–157. [Google Scholar]
- Balali-Mood, M.; Naseri, K.; Tahergorabi, Z.; Khazdair, M.R.; Sadeghi, M. Toxic mechanisms of five heavy metals: Mercury, lead, chromium, cadmium, and arsenic. Front. Pharmacol. 2021, 12, 643972. [Google Scholar] [CrossRef]
- Aggarwal, A.; Verma, T.; Ghosh, S. Heavy metal residues in milk and milk products and their detection method. In Trends and Innovations in Food Science; El Samragy, Y., Ed.; IntechOpen: London, UK, 2022; pp. 1–13. [Google Scholar] [CrossRef]
- Dağcilar, K.; Gezer, C. Heavy metal residues in milk and dairy products produced in Northern Cyprus. Prog. Nutr. 2021, 23, e2021019. [Google Scholar] [CrossRef]
- Kafouris, D.; Christoforou, E.; Stefani, D.; Sarandi, A.; Stavroulakis, G.; Christou, E.; Yiannopoulos, S. Lead, Cadmium and Mercury Determination and Human Health Risk Assessment in Foods from Cyprus. J. Food Compos. Anal. 2024, 128, 106007. [Google Scholar] [CrossRef]
- Hasanvand, S.; Hashami, Z.; Zarei, M.; Merati, S.; Bashiry, M.; Nag, R. Is the milk we drink safe from elevated concentrations of prioritised heavy metals/metalloids?—A global systematic review and meta-analysis followed by a cursory risk assessment reporting. Sci. Total Environ. 2024, 948, 175011. [Google Scholar] [CrossRef]
- Alinezhad, Z.; Hashemi, M.; Tavakoly Sany, S.B. Concentration of heavy metals in pasteurized and sterilized milk and health risk assessment across the globe: A systematic review. PLoS ONE 2024, 19, e0296649. [Google Scholar] [CrossRef]
- Hassan, T.; Elarnaoutti, M.S. Heavy Metals Transfer from Milk into Milk Products. Turk. J. Agric. Food Sci. Technol. 2025, 13, 900–906. [Google Scholar] [CrossRef]
- Rehman, K.; Fatima, F.; Waheed, I.; Akash, M.S.H. Prevalence of exposure of heavy metals and their impact on health consequences. J. Cell. Biochem. 2018, 119, 157–184. [Google Scholar] [CrossRef] [PubMed]
- Ali, H.; Khan, E.; Ilahi, I. Environmental chemistry and ecotoxicology of hazardous heavy metals: Environmental persistence, toxicity, and bioaccumulation. J. Chem. 2019, 2019, 6730305. [Google Scholar] [CrossRef]
- Özbay, S.; Dikici, E.; Soylukan, C. Evaluation of biological (feed, water), seasonal, and geological factors affecting the heavy metal content of raw milk. J. Food Compos. Anal. 2023, 121, 105401. [Google Scholar] [CrossRef]
- Chirinos-Peinado, D.; Castro-Bedriñana, J.; Barnes, E.P.G.; Ríos-Ríos, E.; García-Olarte, E.; Castro-Chirinos, G. Assessing the Health Risk and Trophic Transfer of Lead and Cadmium in Dairy Farming Systems in the Mantaro Catchment, Central Andes of Peru. Toxics 2024, 12, 308. [Google Scholar] [CrossRef] [PubMed]
- Ayangbenro, A.S.; Babalola, O.O. A new strategy for heavy metal polluted environments: A review of microbial biosorbents. Int. J. Environ. Res. Public Health 2017, 14, 94. [Google Scholar] [CrossRef] [PubMed]
- Anyanwu, B.O.; Ezejiofor, A.N.; Igweze, Z.N.; Orisakwe, O.E. Heavy metal mixture exposure and effects in developing nations: An update. Toxics 2018, 6, 65. [Google Scholar] [CrossRef]
- Jolly, Y.N.; Iqbal, S.; Rahman, M.S.; Kabir, J.; Akter, S.; Ahmad, I. Energy dispersive X-ray fluorescence detection of heavy metals in Bangladesh cows’ milk. Heliyon 2017, 3, e00403. [Google Scholar] [CrossRef]
- Monteverde, V.; Camilleri, G.; Arfuso, F.; Pennisi, M.; Perillo, L.; Patitò, G.; Gioia, G.; Castronovo, C.; Piccione, G. Heavy Metal Levels in Milk and Serum of Dairy Cows from Different Farms Located near an Industrial Area. Animals 2022, 12, 2574. [Google Scholar] [CrossRef]
- Scutarașu, E.C.; Trincă, L.C. Heavy Metals in Foods and Beverages: Global Situation, Health Risks and Reduction Methods. Foods 2023, 12, 3340. [Google Scholar] [CrossRef]
- Dghaim, R.; Khatib, S.A.; Rasool, H.; Khan, M.A. Determination of heavy metals concentration in traditional herbs commonly consumed in the United Arab Emirates. J. Environ. Public Health 2015, 2015, 973878. [Google Scholar] [CrossRef]
- Sharafi, K.; Yunesian, M.; Nodehi, R.N.; Mahvi, A.H.; Pirsaheb, M. A systematic literature review for some toxic metals in widely consumed rice types (domestic and imported) in Iran: Human health risk assessment, uncertainty and sensitivity analysis. Ecotoxicol. Environ. Saf. 2019, 176, 64–75. [Google Scholar] [CrossRef]
- Ding, Q.; Li, C.; Wang, H.; Xu, C.; Kuang, H. Electrochemical detection of heavy metal ions in water. Chem. Commun. 2021, 57, 7215. [Google Scholar] [CrossRef]
- Genchi, G.; Sinicropi, M.S.; Lauria, G.; Carocci, A.; Catalano, A. The effects of cadmium toxicity. Int. J. Environ. Res. Public Health 2020, 17, 3782. [Google Scholar] [CrossRef]
- Mazzocco, J.; Jagadapillai, R.; Gozal, E.; Kong, M.; Xu, Q.; Barnes, G.; Freedman, J. Disruption of essential metal homeostasis in the brain by cadmium and high-fat diet. Toxicol. Rep. 2020, 7, 1164–1169. [Google Scholar] [CrossRef]
- Li, S.; Zhang, C.; Wang, S.; Liu, Q.; Feng, H.; Ma, X.; Guo, J. Electrochemical microfluidics techniques for heavy metal ion detection. Analyst 2018, 143, 4230–4246. [Google Scholar] [CrossRef] [PubMed]
- Tinkov, A.A.; Filippini, T.; Ajsuvakova, O.P.; Skalnaya, M.G.; Aaseth, J.; Bjørklund, G.; Gatiatulina, E.R.; Popova, E.V.; Nemereshina, O.N.; Huang, P.T.; et al. Cadmium and atherosclerosis: A review of toxicological mechanisms and a meta-analysis of epidemiologic studies. Environ. Res. 2018, 162, 240–260. [Google Scholar] [CrossRef] [PubMed]
- Norouzirad, R.; González-Montaña, J.R.; Martínez-Pastor, F.; Hosseini, H.; Shahrouzian, A.; Khabazkhoob, M.; Ali Malayeri, F.; Moallem Bandani, H.; Paknejad, M.; Foroughi-Nia, B.; et al. Lead and cadmium levels in raw bovine milk and dietary risk assessment in areas near petroleum extraction industries. Sci. Total Environ. 2018, 635, 308–314. [Google Scholar] [CrossRef]
- Wani, A.L.; Ara, A.; Usmani, J.A. Lead toxicity: A review. Interdiscip. Toxicol. 2015, 8, 55–64. [Google Scholar] [CrossRef] [PubMed]
- Christophoridis, C.; Kosma, A.; Evgenakis, M.; Bourliva, A.; Fytianos, K. Determination of heavy metals and health risk assessment of cheese products consumed in Greece. J. Food Compos. Anal. 2019, 82, 103238. [Google Scholar] [CrossRef]
- Pérez-Carrera, A.L.; Arellano, F.E.; Fernández-Cirelli, A. Concentration of trace elements in raw milk from cows in the southeast of Córdoba province, Argentina. Dairy Sci. Technol. 2016, 96, 591–602. [Google Scholar] [CrossRef]
- Zhou, X.; Zheng, N.; Su, C.; Wang, J.; Soyeurt, H. Relationships between Pb, As, Cr, and Cd in individual cows’ milk and milk composition and heavy metal contents in water, silage, and soil. Environ. Pollut. 2019, 255 Pt 2, 113322. [Google Scholar] [CrossRef]
- Tyler, C.R.; Allan, A.M. The effects of arsenic exposure on neurological and cognitive dysfunction in human and rodent studies: A review. Curr. Environ. Health Rep. 2014, 1, 132–147. [Google Scholar] [CrossRef]
- Djamgoz, M.B.; Akun, E.; Arslan, B. Cancer in North Cyprus: 1. Current status, an overview. Cyprus J. Med. Sci. 2017, 2, 9–12. [Google Scholar] [CrossRef]
- FAO/WHO—Codex Alimentarius Commission. General Standard for Contaminants and Toxins in Food and Feed (CXS 193-1995); Updated 2023; FAO: Rome, Italy, 1995; Available online: https://www.fao.org/fao-who-codexalimentarius/sh-proxy/en/?lnk=1&url=https%253A%252F%252Fworkspace.fao.org%252Fsites%252Fcodex%252FStandards%252FCXS%2B193-1995%252FCXS_193e.pdf (accessed on 23 July 2025).
- European Commission. Regulation (EU) 2023/465 of 3 March 2023 Amending Regulation (EC) No 1881/2006 as Regards Maximum Levels of Arsenic in Certain Foods; Official Journal of the European Union, L 68, 6 March 2023; Publications Office of the European Union: Brussels, Belgium, 2023; pp. 51–54. [Google Scholar]
- European Commission. Regulation (EU) 2018/73 of 16 January 2018 Amending Annexes II and III to Regulation (EC) No 396/2005 of the European Parliament and of the Council as Regards Maximum Residue Levels for Mercury Compounds in or on Certain Products; Official Journal of the European Union, L 13, 18 January 2018; Publications Office of the European Union: Brussels, Belgium, 2018; pp. 8–20. [Google Scholar]
- US Food and Drug Administration (FDA). Final Guidance for Industry: Action Levels for Lead in Processed Foods Intended for Babies and Young Children; FDA: Silver Spring, MD, USA, 2025. Available online: https://www.fda.gov/media/164684/download (accessed on 23 July 2025).
- Zwierzchowski, G.; Ametaj, B.N. Mineral Elements in the Raw Milk of Several Dairy Farms in the Province of Alberta. Foods 2019, 8, 345. [Google Scholar] [CrossRef]
- Pekou, A.; Manousi, N.; Zachariadis, G.A. Multielemental Method for Maternal Breast Milk Analysis by Inductively Coupled Plasma–Atomic Emission Spectrometry (ICP-AES) and Acid Digestion. Anal. Lett. 2023, 56, 14–24. [Google Scholar] [CrossRef]
- Silalahi, E.M.; Lioe, H.N.; Faridah, D.N. Heavy Metals Cd, Hg, and Pb in Fresh Milk from Dairy Farms in South Jakarta Analyzed by ICP-MS. Trop. Anim. Sci. J. 2023, 46, 502–508. [Google Scholar] [CrossRef]
- Chen, H.; Yao, Y.; Zhang, C.; Ping, J. Determination of heavy metals ions in infant milk powder using a nanoporous carbon modified disposable sensor. Foods 2023, 12, 730. [Google Scholar] [CrossRef]
- Pedersen-Bjergaard, S.; Gammelgaard, B.; Halvorsen, T.G. Introduction to Pharmaceutical Analytical Chemistry, 2nd ed.; Wiley: Chichester, UK, 2019; pp. 157–167. ISBN 9781119362739. [Google Scholar]
- Paixão, L.B.; Brandão, G.C.; Araujo, R.G.O.; Korn, M.G.A. Assessment of cadmium and lead in commercial coconut water and industrialized coconut milk employing HR-CS GF AAS. Food Chem. 2019, 284, 259–263. [Google Scholar] [CrossRef] [PubMed]
- Sahin, D. Atomic spectroscopy. In Modern Spectroscopic Techniques and Applications; Khan, M., Nascimento, G.M., El Azazy, M., Eds.; IntechOpen: London, UK, 2019; pp. 1–13. [Google Scholar] [CrossRef]
- CS Analytical. Comparison of Atomic Spectroscopy Techniques the Advantages of ICP-MS vs AA & ICP-OES. Available online: https://csanalytical.com/comparison-atomic-spectroscopy-techniques-advantages-icp-ms-vs-aa-icp-oes/ (accessed on 18 January 2025).
- Esposito, M.; Miedico, O.; Cavallo, S.; Pellicanò, R.; Rosato, G.; Baldi, L.; Chiaravalle, E. Trace elements in raw milk of buffaloes (Bubalus bubalis) from Campania, Italy. Food Chem. 2017, 233, 378–384. [Google Scholar] [CrossRef]
- Qu, X.Y.; Zheng, N.; Zhou, X.W.; Li, S.L.; Wang, J.Q.; Zhang, W.J. Analysis and Risk Assessment of Seven Toxic Element Residues in Raw Bovine Milk in China. Biol. Trace Elem. Res. 2018, 183, 92–101. [Google Scholar] [CrossRef]
- Barone, G.; Dambrosio, A.; Storelli, A.; Busco, A.; Ioanna, F.; Quaglia, N.; Giacominelli-Stuffler, R.; Storelli, M.M. Traditional Italian cheeses: Trace element levels and estimation of dietary intake. J. Food Compos. Anal. 2018, 66, 179–185. [Google Scholar] [CrossRef]
- Castro-González, N.P.; Calderón-Sánchez, F.; Castro de Jesús, J.; Moreno-Rojas, R.; Tamariz-Flores, J.V.; Pérez-Sato, M.; Soní-Guillermo, E. Heavy metals in cow’s milk and cheese produced in areas irrigated with waste water in Puebla, Mexico. Food Addit. Contam. Part B 2018, 11, 33–36. [Google Scholar] [CrossRef] [PubMed]
- Chirinos-Peinado, D.M.; Castro-Bedriñana, J.I. Lead and cadmium blood levels and transfer to milk in cattle reared in a mining area. Heliyon 2020, 6, e03579. [Google Scholar] [CrossRef] [PubMed]
- Castro-Bedriñana, J.; Chirinos-Peinado, D.; Ríos-Ríos, E.; Machuca-Campuzano, M.; Gómez-Ventura, E. Dietary risk of milk contaminated with lead and cadmium in areas near mining-metallurgical industries in the Central Andes of Peru. Ecotoxicol. Environ. Saf. 2021, 220, 112382. [Google Scholar] [CrossRef] [PubMed]
- Yan, M.; Niu, C.; Li, X.; Wang, F.; Jiang, S.; Li, K.; Yao, Z. Heavy metal levels in milk and dairy products and health risk assessment: A systematic review of studies in China. Sci. Total Environ. 2022, 851 Pt 1, 158161. [Google Scholar] [CrossRef]
- Yang, S.; Bhargava, N.; O’Connor, A.; Gibney, E.R.; Feeney, E.L. Dairy consumption in adults in China: A systematic review. BMC Nutr. 2023, 9, 116. [Google Scholar] [CrossRef]
- Ribeiro, I.; Gomes, M.; Figueiredo, D.; Lourenço, J.; Paúl, C.; Costa, E. Dairy Product Intake in Older Adults across Europe Based on the SHARE Database. J. Nutr. Gerontol. Geriatr. 2019, 38, 297–306. [Google Scholar] [CrossRef]
- Headey, D.D.; Alderman, H.; Hoddinott, J.; Narayanan, S. The glass of milk half-empty? Dairy development and nutrition in low and middle income countries. Food Policy 2024, 122, 102585. [Google Scholar] [CrossRef]
- EFSA Panel on Contaminants in the Food Chain (CONTAM). Scientific Opinion on Lead in Food. EFSA J. 2010, 8, 1570. [Google Scholar] [CrossRef]
- EFSA Panel on Contaminants in the Food Chain (CONTAM). Scientific Opinion on the risk for public health related to the presence of mercury and methylmercury in food. EFSA J. 2012, 10, 2985. [Google Scholar] [CrossRef]
- EFSA Panel on Contaminants in the Food Chain (CONTAM). Scientific Opinion on tolerable weekly intake for cadmium. EFSA J. 2011, 9, 1975. [Google Scholar] [CrossRef]
- EFSA Panel on Contaminants in the Food Chain (CONTAM). Update of the risk assessment of inorganic arsenic in food. EFSA J. 2024, 22, 8488. [Google Scholar] [CrossRef] [PubMed]
- US Environmental Protection Agency (EPA). Lead at Superfund Sites: Risk Assessment. Washington, DC, USA. Available online: https://www.epa.gov/superfund/lead-superfund-sites-risk-assessment (accessed on 25 July 2025).
- US Environmental Protection Agency (EPA). Reference Dose (RfD): Description and Use in Health Risk Assessments. Washington, DC, USA. Available online: https://www.epa.gov/iris/reference-dose-rfd-description-and-use-health-risk-assessments (accessed on 25 July 2025).
- Kerdoun, M.A.; Djafer, R. Heavy metal levels in camel milk and health risk assessment: A global systematic review. J. Trace Elem. Miner. 2024, 8, 100131. [Google Scholar] [CrossRef]
- Xiong, C.; Petursdottir, A.H.; Rikhardsson, G.; Stergiadis, S.; Raab, A.; Feldmann, J. Speciation of Arsenic in Milk from Cows Fed Seaweed. J. Sci. Food Agric. 2024, 104, 6957–6965. [Google Scholar] [CrossRef]
- Iwai, K.; Iwai-Shimada, M.; Tatsuta, N.; Kobayashi, Y.; Asato, K.; Nishimoto, M.; Nakai, K.; Nakayama, S.F. High-Throughput Mercury Speciation Analysis of Breast Milk Using HPLC-ICP-MS. Microchem. J. 2025, 211, 113142. [Google Scholar] [CrossRef]
Disclaimer/Publisher’s Note: The statements, opinions and data contained in all publications are solely those of the individual author(s) and contributor(s) and not of MDPI and/or the editor(s). MDPI and/or the editor(s) disclaim responsibility for any injury to people or property resulting from any ideas, methods, instructions or products referred to in the content. |
© 2025 by the authors. Licensee MDPI, Basel, Switzerland. This article is an open access article distributed under the terms and conditions of the Creative Commons Attribution (CC BY) license (https://creativecommons.org/licenses/by/4.0/).