Article

An Interdisciplinary Perspective of the Karst Springs’ Areas as Drinking Water: Perusal from Northeastern Slovenia

Faculty of Environmental Protection, 3320 Velenje, Slovenia
*
Author to whom correspondence should be addressed.
Pollutants 2025, 5(3), 19; https://doi.org/10.3390/pollutants5030019
Submission received: 18 December 2024 / Revised: 6 February 2025 / Accepted: 12 June 2025 / Published: 1 July 2025

Abstract

Karst aquifer systems are highly vulnerable due to their unique underground water flow characteristics, making them prone to contamination and abandonment. This study compares an active karst water source (Ljubija) with a previously abandoned one (Rečica) to assess freshwater quality and water protection risks, especially as water scarcity becomes a concern during dry summer periods. The Ljubija and Rečica catchments, designated as water protection areas (WPAs), were monitored over a year (January–December 2020). Groundwater (GW) and surface water (SW) were analyzed twice a month during both dry and wet periods, adhering to European and national guidelines. An interdisciplinary approach integrated natural and human impact indicators, linking water quality to precipitation, hydrogeography, and landscape characteristics. After Slovene regulation standards (50 mg/L), the Ljubija source demonstrated stable water quality, with low nitrate levels (average 2.6 mg/L) and minimal human impact. In contrast, the Rečica catchment was more vulnerable, with its GW excluded from drinking use since the 1990s due to organic contamination, worsened by the area’s karst hydrogeology. In 2020, its nitrate concentration averaged 6.0 mg/L. These findings highlight the need for improved monitoring regulations, particularly for vulnerable karst water sources, to safeguard water quality and ensure sustainable use.

1. Introduction

The nature of karst aquifers, involving their sensitive retention and self-purification capacity, rapid infiltration from the surface into the groundwater, and rapid subsurface flow, make them very susceptible to long-range pollution [1,2,3]. Groundwater flows and the pollutants they contain can reach speeds of up to several hundred meters per hour [4,5]. The risk of groundwater pollution is higher in areas where pollution sources accumulate [6].
When considering the factors that influence the spatial and temporal variation in nitrogen in karst watersheds, the unique karst hydrogeology cannot be ignored as an internal influencing factor, nor can natural factors such as meteorology, hydrology, and external factors, e.g., human activities [7] Prevailing land use enables human activities like forestry and (organic) farming, mostly extensive cattle breeding. General indicators are defined in the provisions for monitoring the chemical status of water [8,9,10,11] and the methodology for the assessment of the ecological status of rivers based on the general physico-chemical quality indicators [12] Turbidity, pH, electrical conductivity (EC), temperature, and hardness are usually measured to determine the impact of human activities that, together with natural conditions, pose a risk of groundwater pollution.
According to the United Nations Organization’s climate change prediction, the drinking water supply has been declared one of the most important environmental challenges of the 21st century in terms of the following: (a) to halt the further degradation of already burdened water sources, (b) to move towards rather than away from improvement, and (c) to preserve not yet stressed drinking water sources. European directives oblige member states to protect captured and potential groundwater resources [13,14]. The most important and challenging task of the water supply is to ensure adequate quality and enough drinking water even in periods of drought when the demand for water increases. Globally, karst water resources cover around a quarter of drinking water demand and in Europe, a third [15,16,17]. Around half of the world’s population has no access to hygienic and safe drinking water [18].
As karst aquifers are highly vulnerable to pollution, karst water resources must be managed appropriately and consistently. In Slovenia, large karst areas are usually quite remote and less suitable for intensive settlement and various activities due to unfavorable topography and climatic conditions. They are mainly forested areas or areas characterized by extensive agriculture [19]. An experienced assessment approach using the integrated indicators concept followed the appropriate protocol for the protection of karst water sources, which is not a common practice in Europe to improve legislation. Besides Slovenia, Germany has also introduced special regulations that define the procedure for establishing water protection areas, considering the specificities of karst aquifers [20,21].
Our study was aimed at proving the interdisciplinary approach of indicators as a research tool for studying karst water suitability, where we combined water ecological characteristics, landscape settings in connection to human impact, and (after the regulation) drinking water potential. Within the survey, we wanted to underscore the increased vulnerability of karst catchments and the importance of their unforeseeable size.

2. Materials and Methods

The applied interdisciplinary approach combined geographical and ecological research fields. A methodological set of indicators was developed in the karst water study to assess the land surface impacts and karst springs’ quality and evaluate them in terms of the established legislation.
The study included an optional and an active water supply area (WPA). Therefore, we focused on the comparison of their characteristics and the following research challenges to also verify the applicable water protection laws: (1) precipitation and the dependence of turbidity and nitrogen concentration indicators in karst areas, (2) existing agricultural land cover, (3) land use as a potential factor influencing nitrate concentrations in water bodies, and (4) drinking water supply in the context of national (and local) protection regulations. We aimed to answer the two following questions: is there an additional need for more specific restrictions? Are the catchment areas covered by sufficiently large water protection areas (WPAs)?
For the statistical analysis of natural nitrogen and turbidity dynamics, a field study was conducted in isolated karst springs in northeastern Slovenia (Figure 1), where water samples were regularly (y. 2020) taken and collected. We monitored nitrate levels as an indicator of the nutrient content in the water to check the impact of extensive (organic) agricultural activities taking place in the study areas. Additional emphasis was placed on turbidity, which is a key characteristic when talking about drinking water. Since we studied isolated karst regions, the EC indicator was added. Selected indicators were confronted with the environmental conditions, which included precipitation data.
As maps were included, we used data from the Ministry of Agriculture, Forestry and Food for the land use presentation, and research areas’ water bodies were positioned with the OpenStreetMap geographical information system.

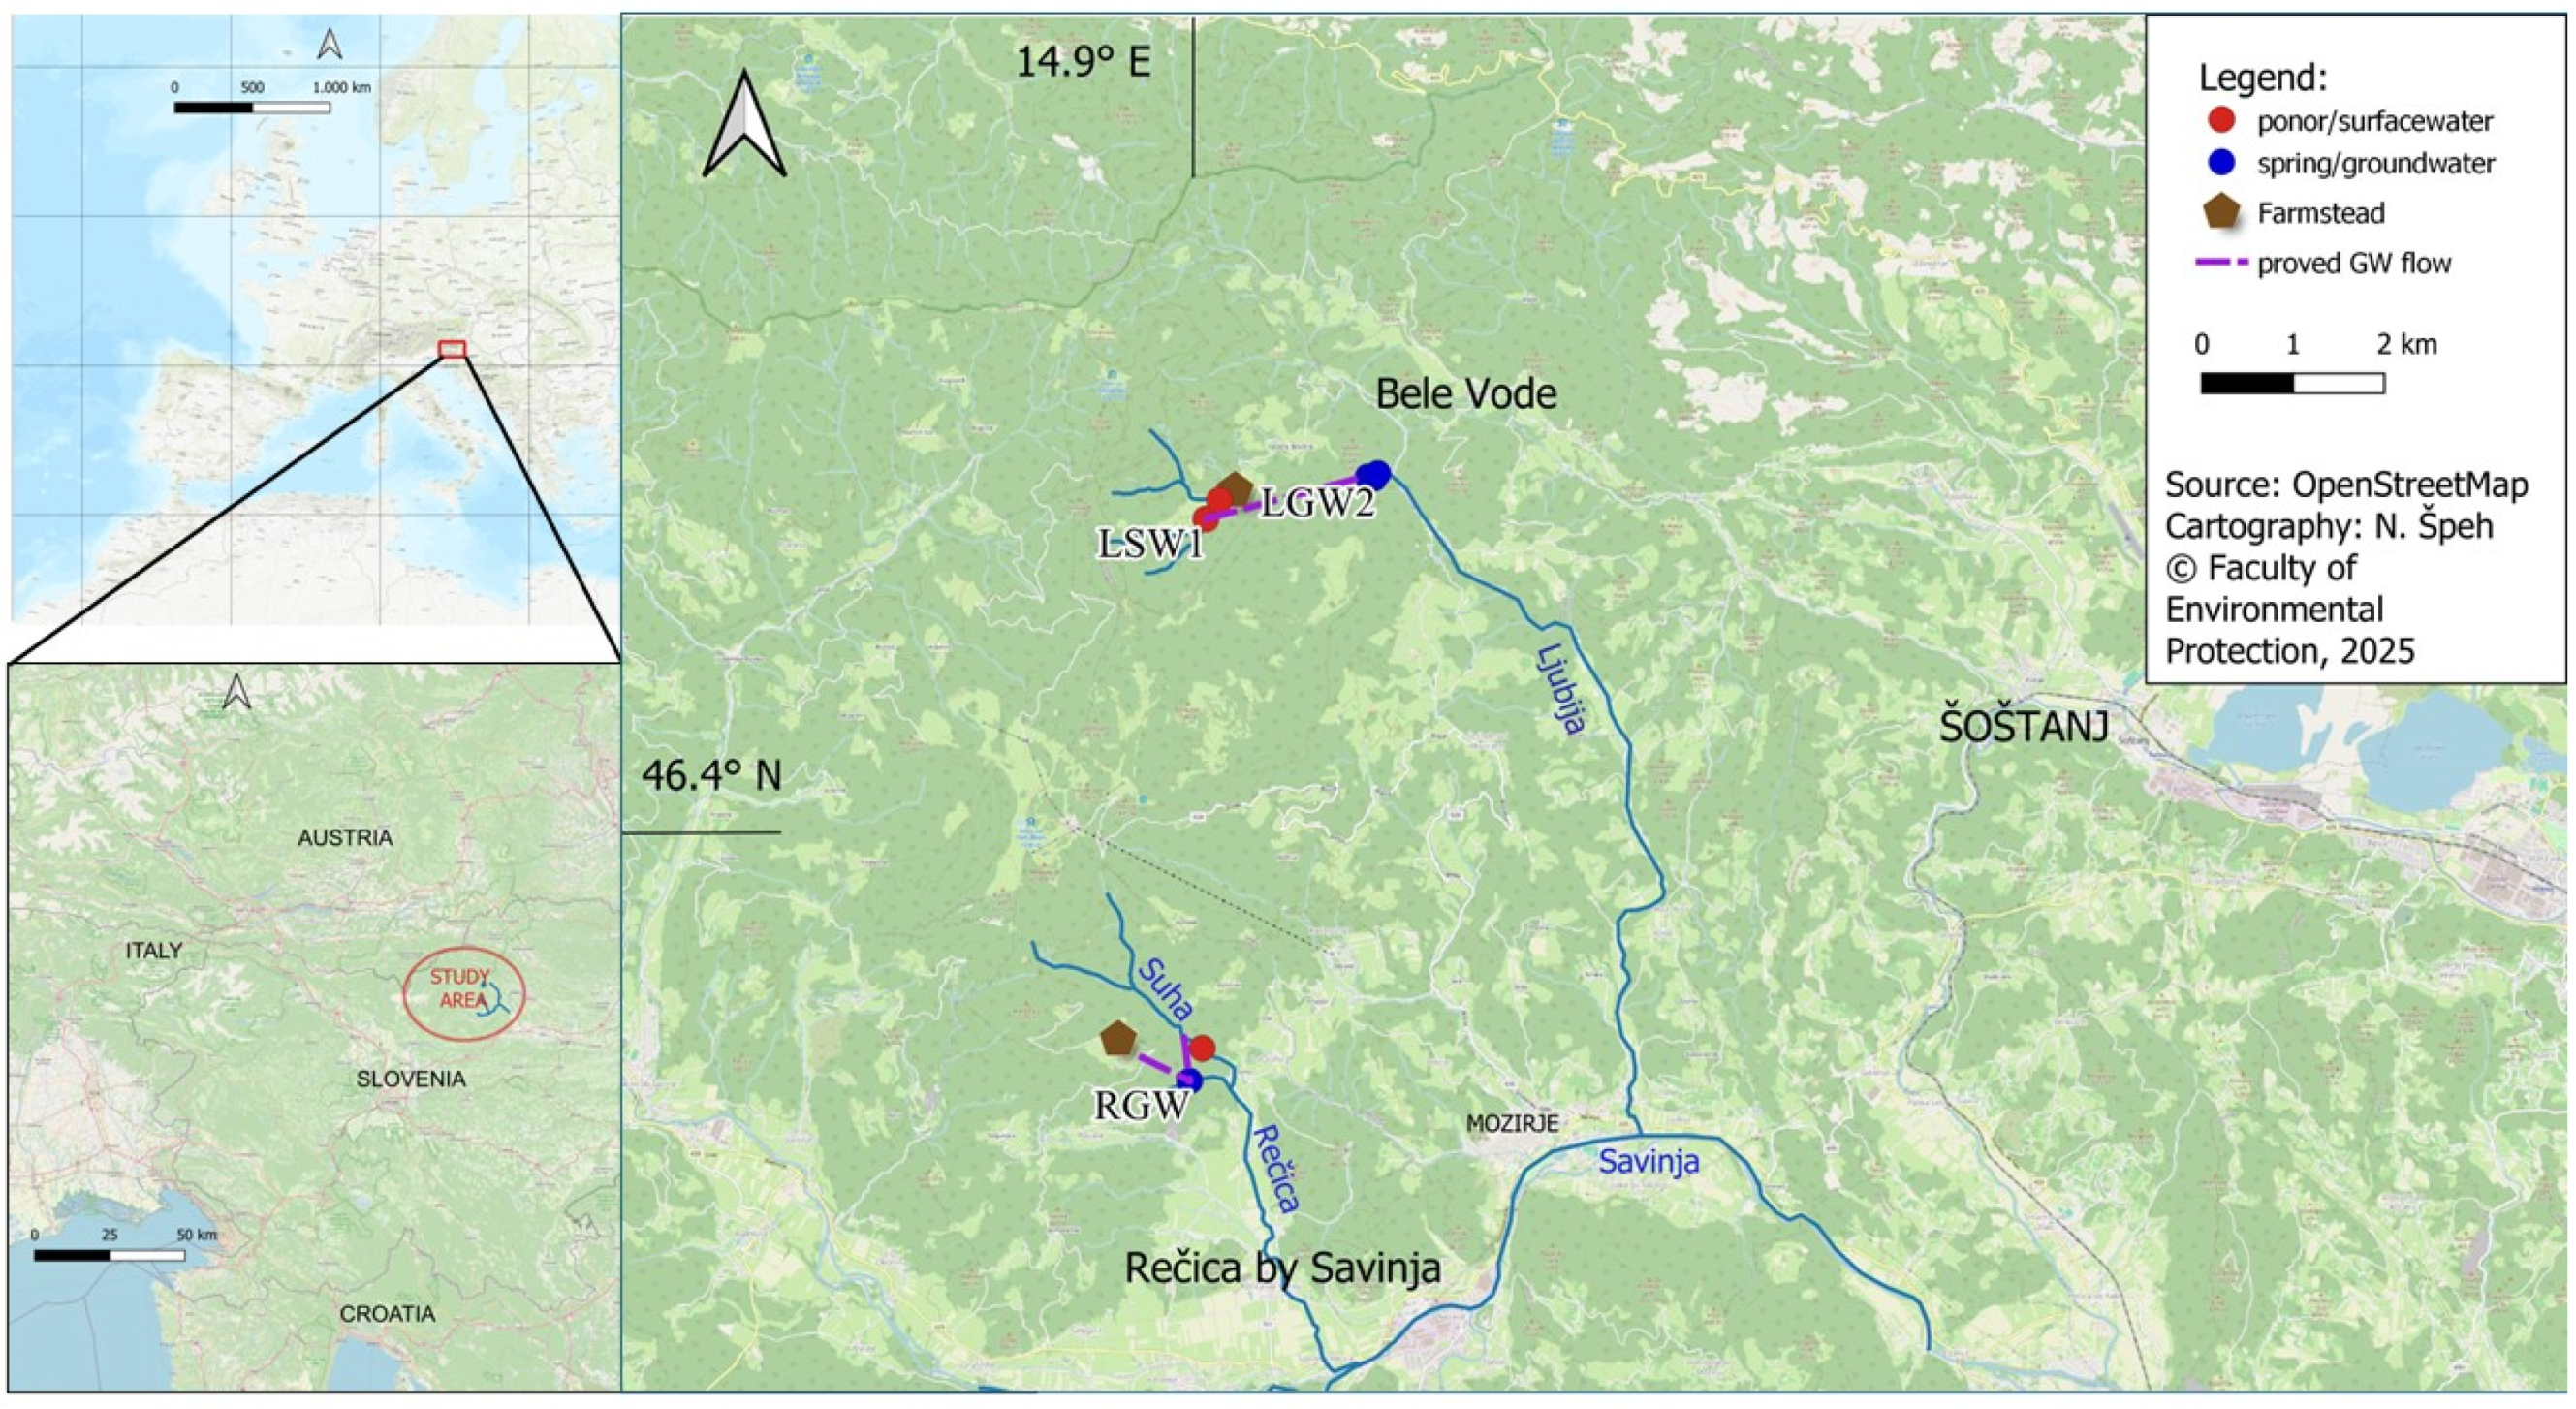
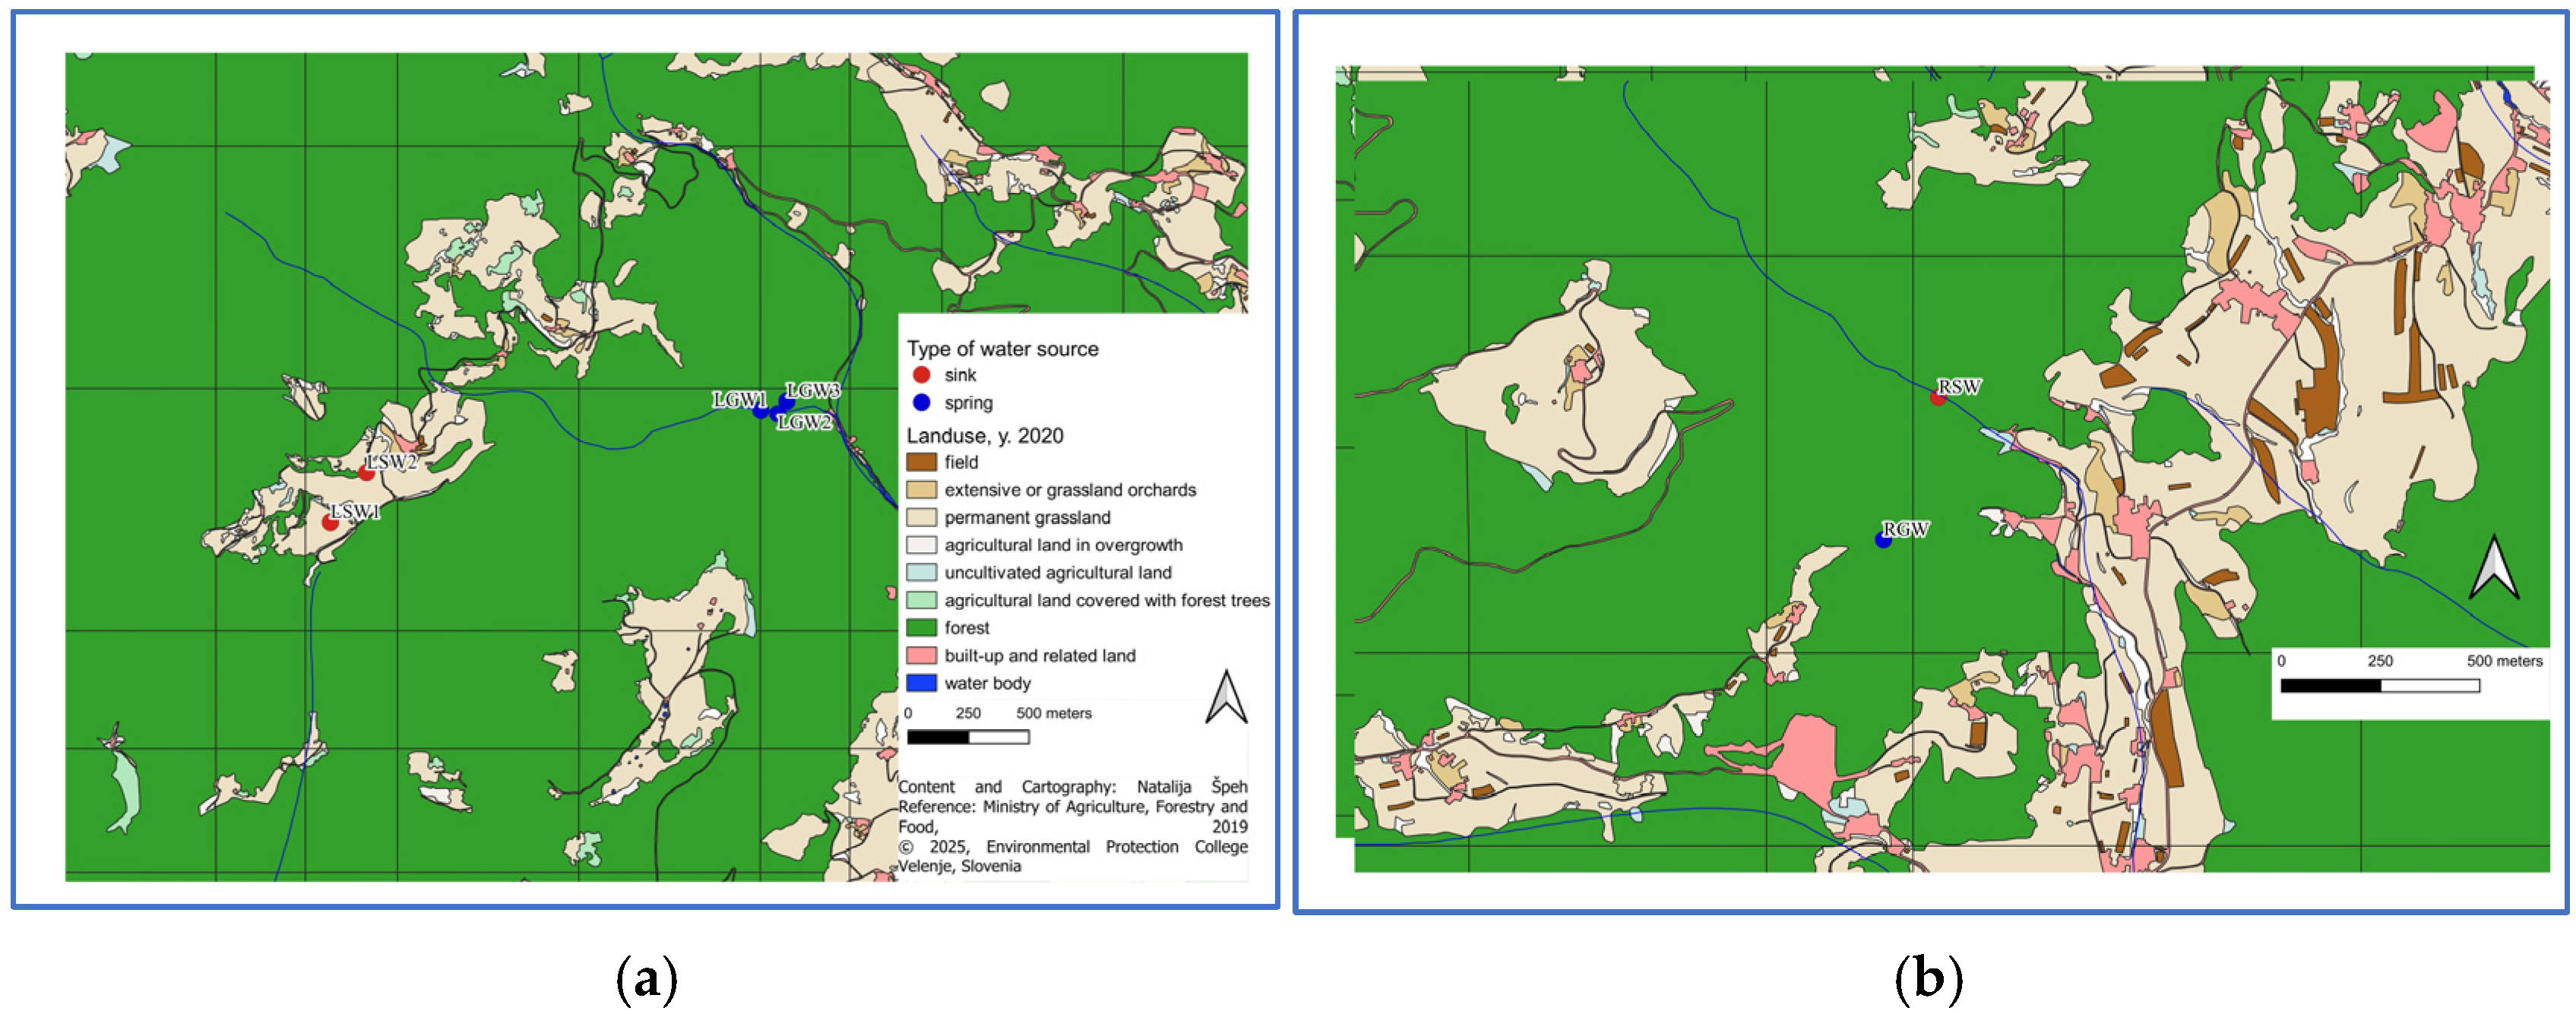
2.1. Environmental Conditions in Study Areas

The comparison of indicators to present the study areas’ state of the art will (a) focus on the precipitation regime with rainfall data, (b) be considered as vulnerable isolated karst landscape areas with extensive agriculture, and (c) be concluded with an assessment and relation to water supply.
In terms of meteorological conditions, both study areas belong to the Cfb subtype of the Koeppen–Geiger climate classification, with an average annual precipitation of 1400–1500 mm in the Ljubija spring and 1300–1400 mm in the Rečica area over the period of 1981–2010. The average annual air temperature in the same period was 6–8 °C in Ljubija and 8–10 °C in the Rečica area [17,22].
According to the Slovene Cave Registry [23], both areas are rich in underground karst forms; 16 caves more than 6 m deep/long were recorded in a 1.5 km radius around the Ljubija spring and 5 more caves were found around the Rečica spring. Geologically, the catchment areas consist partly of karstified carbonate rock, which is typical of the Dinarides macro-region. Due to the smaller outcrops of igneous rock, it would be assigned to the northern edge of the Karawanks [24].
Both study areas (Figure 1), the Ljubija and the Rečica catchment, are contact karst examples, which is very common for the isolated karst areas of the Slovenian Alpine macro-region [25] It can be further defined as a closed fluviokarst [26], which mostly develops on dolomites. The riverbed of the Rečica was formed in a small pocket valley, while Ljubija appears in the middle of a dry valley as a Vauclusian spring. Rečica has been formed by two karst tributaries, namely the spring of Žegnan as the main spring and another left tributary of Suha. Nomen est omen also applies to the naming of landscape features. Suha means ‘dry’, and it really comes from the normally dry riverbed that joins the Rečica torrent after leaving a narrow gorge.
The Ljubija stream has also formed a narrow valley, but the wider area of the spring, which is connected with upper ponors under the surface, is an open-air classroom for the study of karst phenomena (depressions with blind valleys, a (semi-) dry valley, a karst window, a ravine in the lower part of the valley, and a karst underground with a system of water chambers and caves upstream) in the steep slope above a spring and a Vaucluse-type pediment. In the upper part of the valley, the blind valley stream follows the lithological boundary, marked by volcanic rocks to the north and permeable carbonates to the south, but it is otherwise covered by alluvial material. When the stream reaches a larger section of exposed limestone, it disappears underground. According to surface water flow measurements at ponor LSW1, the flow was estimated at 0.5 L/s. In contrast, the Ljubija spring demonstrates a discharge ranging from 60 to over 180 L/s, consistently maintaining a biological minimum of 45 L/s [27,28].
The Rečica stream is fed by two springs that were included in the water supply before 1999, when the quality of the spring water was found to be insufficient. As microbiological contamination was detected and after additional tracer tests [29] in the wider area, the water supply from the two springs was interrupted. Due to the seasonally increased local water demand, the wider catchment area should be treated as a water protection area with a subsequent protection strategy. On the other hand, the Ljubija spring has proven its constant importance for water supply since the early 1980s and provides drinking water for the Savinja–Šalek subregion [28].
In terms of the self-cleaning capacity of the vegetation (sufficient soil cover at the gently sloping valley bottom), the study areas are well positioned. On the steep slopes surrounding the spring areas, forest landcover dominates with over 50% [30]. And in each area, there is only one active farm with cattle and pastures above the spring. The Ljubija catchment is on thick brown soil on pyroclastic rock, and an outdoor sheep farm on the thin and patchy Rendzina soil is above the Rečica springs. Soil characteristics, lithology, and the distance between the farm and the water source could influence the immunity of the source water to pollution.
The tracer test was used as a toxicologically safe hydrological method in karsts in both study areas. Artificial tracers were used to assess the underground water flow. The tracer test in the Ljubija area was carried out in the ponor LSW1 as early as 1978 to ensure the safety of the spring, and shortly after the investigation, it became (and still is) a significant water supply for over 30,000 people. After the tracer injection, colored water appeared in the spring within 23 h, and the groundwater flow was estimated at 73 m/h [31].
The tests in the Rečica area were applied for the first time in 1991 and resulted in an underground flow of 72 m/h [28]. Tracing was carried out again in 2019 (April) and 2020 (March) [17] at two injection spots as follows: 1. Suha ponor/RSW with a maximum flow velocity of 13 m/h and 2. at a higher altitude below the farmstead, after a more intensive rainfall and with additional 2.5 m3 of water, the maximum underground water flow velocity reached 49 m/h. Tracer infiltration revealed underground connections between the two water bodies at the area, Suha and Rečica. We included both in the monitoring, as the catchment was no longer used for drinking due to the detection of contaminated water in 1991. The average discharge of the Rečica spring (groundwater, GW) increases significantly after more intense rainfall, demonstrating a connection between groundwater and surface water flow (GW-SW interaction). To illustrate the karst features, during a rainfall event of 50 mm in just three hours, the Rečica discharge rose from 10 L/s to over 1500 L/s within five hours. Subsequently, within another 13 h, the discharge decreased to 390 L/s [17].
To disclose the natural conditions of the studied catchments (Figure 1), we examined the climatic, hydrogeological, geomorphological, and land use characteristics in detail. They were linked to the water ecological conditions of the karst water sources in the research areas.

2.2. Sampling and Analysis

2.2.1. Meteorological Data

To present the meteorological conditions of the studied areas, data on precipitation trends were considered. The precipitation data were evidenced by the Slovenian Environment Agency (ARSO) and the Statistical Office of the Republic of Slovenia (SORS). Land use, pedological, geological and geomorphological data were analyzed from the public database PISO (Spatial Information System for Municipalities).
The lithology and land use characteristics of the catchments exhibit similarities. However, distinctions emerge in terms of soil type and the proximity of inhabited farms to the springs. Specifically, in the Ljubija catchment (LGW1), we calculated a linear (air) distance of 1.46 km. In the case of the Rečica water sources, RGW1 is situated 1.7 km away, while RSW1 is 0.98 km further away from the elevated farm (Figure 1).

2.2.2. Water Sampling and Monitoring

Investigating the hydrogeological characteristics of both karst regions, we aimed to facilitate a thorough examination of six pivotal physical and chemical water quality indicators, encompassing temperature (°C), pH, turbidity (NTU), electrical conductivity (µS/cm), water hardness (°d), and nitrate concentration (mg/L).
The rationale behind our choice of monitoring parameters was driven by their intrinsic significance in comprehending the groundwater dynamics reaching karst springs. Previous studies [32,33] underscored the importance of temperature and electrical conductivity as valuable indicators of spring water conditions. Moreover, the influence of the underlying bedrock on pH and water hardness was considered, with pH further modulated by water temperature and biological activity within the water. Water hardness, conversely, was elucidated as contingent on the dissolved mineral content, predominantly calcium (Ca2+) and magnesium (Mg2+) ions [34].
All water sources accessible at each area were included, with two in Rečica and five in Ljubija, judiciously selected as 3 springs and 2 sinks as strategic sampling sites. In the Rečica catchment, we meticulously selected 1 spring and 1 sink as comparative sampling sites to observe variation trends in the selected indicators. To streamline our analytical approach, we categorized sampling sites into two distinct groups, with groundwater (GW) and surface water (SW) sites.
Within the Ljubija catchment, the chosen springs were delineated as the Ljubija Groundwater group (LGW1-3), while the sinks were denoted as the Ljubija Surface Water group (LSW1-2). Similarly, in the Rečica catchment, the spring in Žegnan Studenec received the nomenclature of Rečica Groundwater (RGW1), and the sink Suha was classified as Rečica Surface Water (RSW1).
A comprehensive summary, inclusive of detailed information regarding each sampling site, is presented in Table 1 for reference.
The monitoring period spanned a year, from January to December 2020, during which measurements were conducted bi-monthly. A total of 23 fieldwork observations were executed for each sampling site, resulting in 161 measurements. Groundwater and surface water samples were numbered 92 and 69, respectively.
Field measurements, including indicators such as temperature, pH, turbidity, and electrical conductivity, were conducted using the Vernier LabQuest 2 interface—a data collection device equipped with appropriate sensors. Water hardness and nitrate concentration (NO32−) were determined spectrophotometrically in the laboratory through rapid cuvette tests (Hach Lange LCK 327 for water hardness and LCK 399 for NO32−) following the manufacturer’s guidelines.
Finally, we discussed the monitored catchments within an assessment of previously researched data and a comparison of fieldwork finding to derive comprehensive insights.

2.2.3. Data Analysis

To assess statistical significance and facilitate a comprehensive comparison of annual indicator values, we employed descriptive statistics. A one-way analysis of variance (ANOVA) was specifically chosen to discern significant differences in the selected indicators across distinct parameters, including geographical areas (Ljubija vs. Rečica), site types (GW and SW), and seasons (winter, spring, summer, and autumn). A significance level of p ≤ 0.05 was considered statistically significant. The data analyses were executed using Excel 2020 (Microsoft Corporation, Redmond, WA, USA) and GraphPad Prism 9 (GraphPad Software, San Diego, CA, USA, www.graphpad.com), ensuring a robust and reliable evaluation of the dataset.
The AI-assisted technology (ChatGPT 4.0) was used for language editing and grammar checking.

3. Results and Discussion

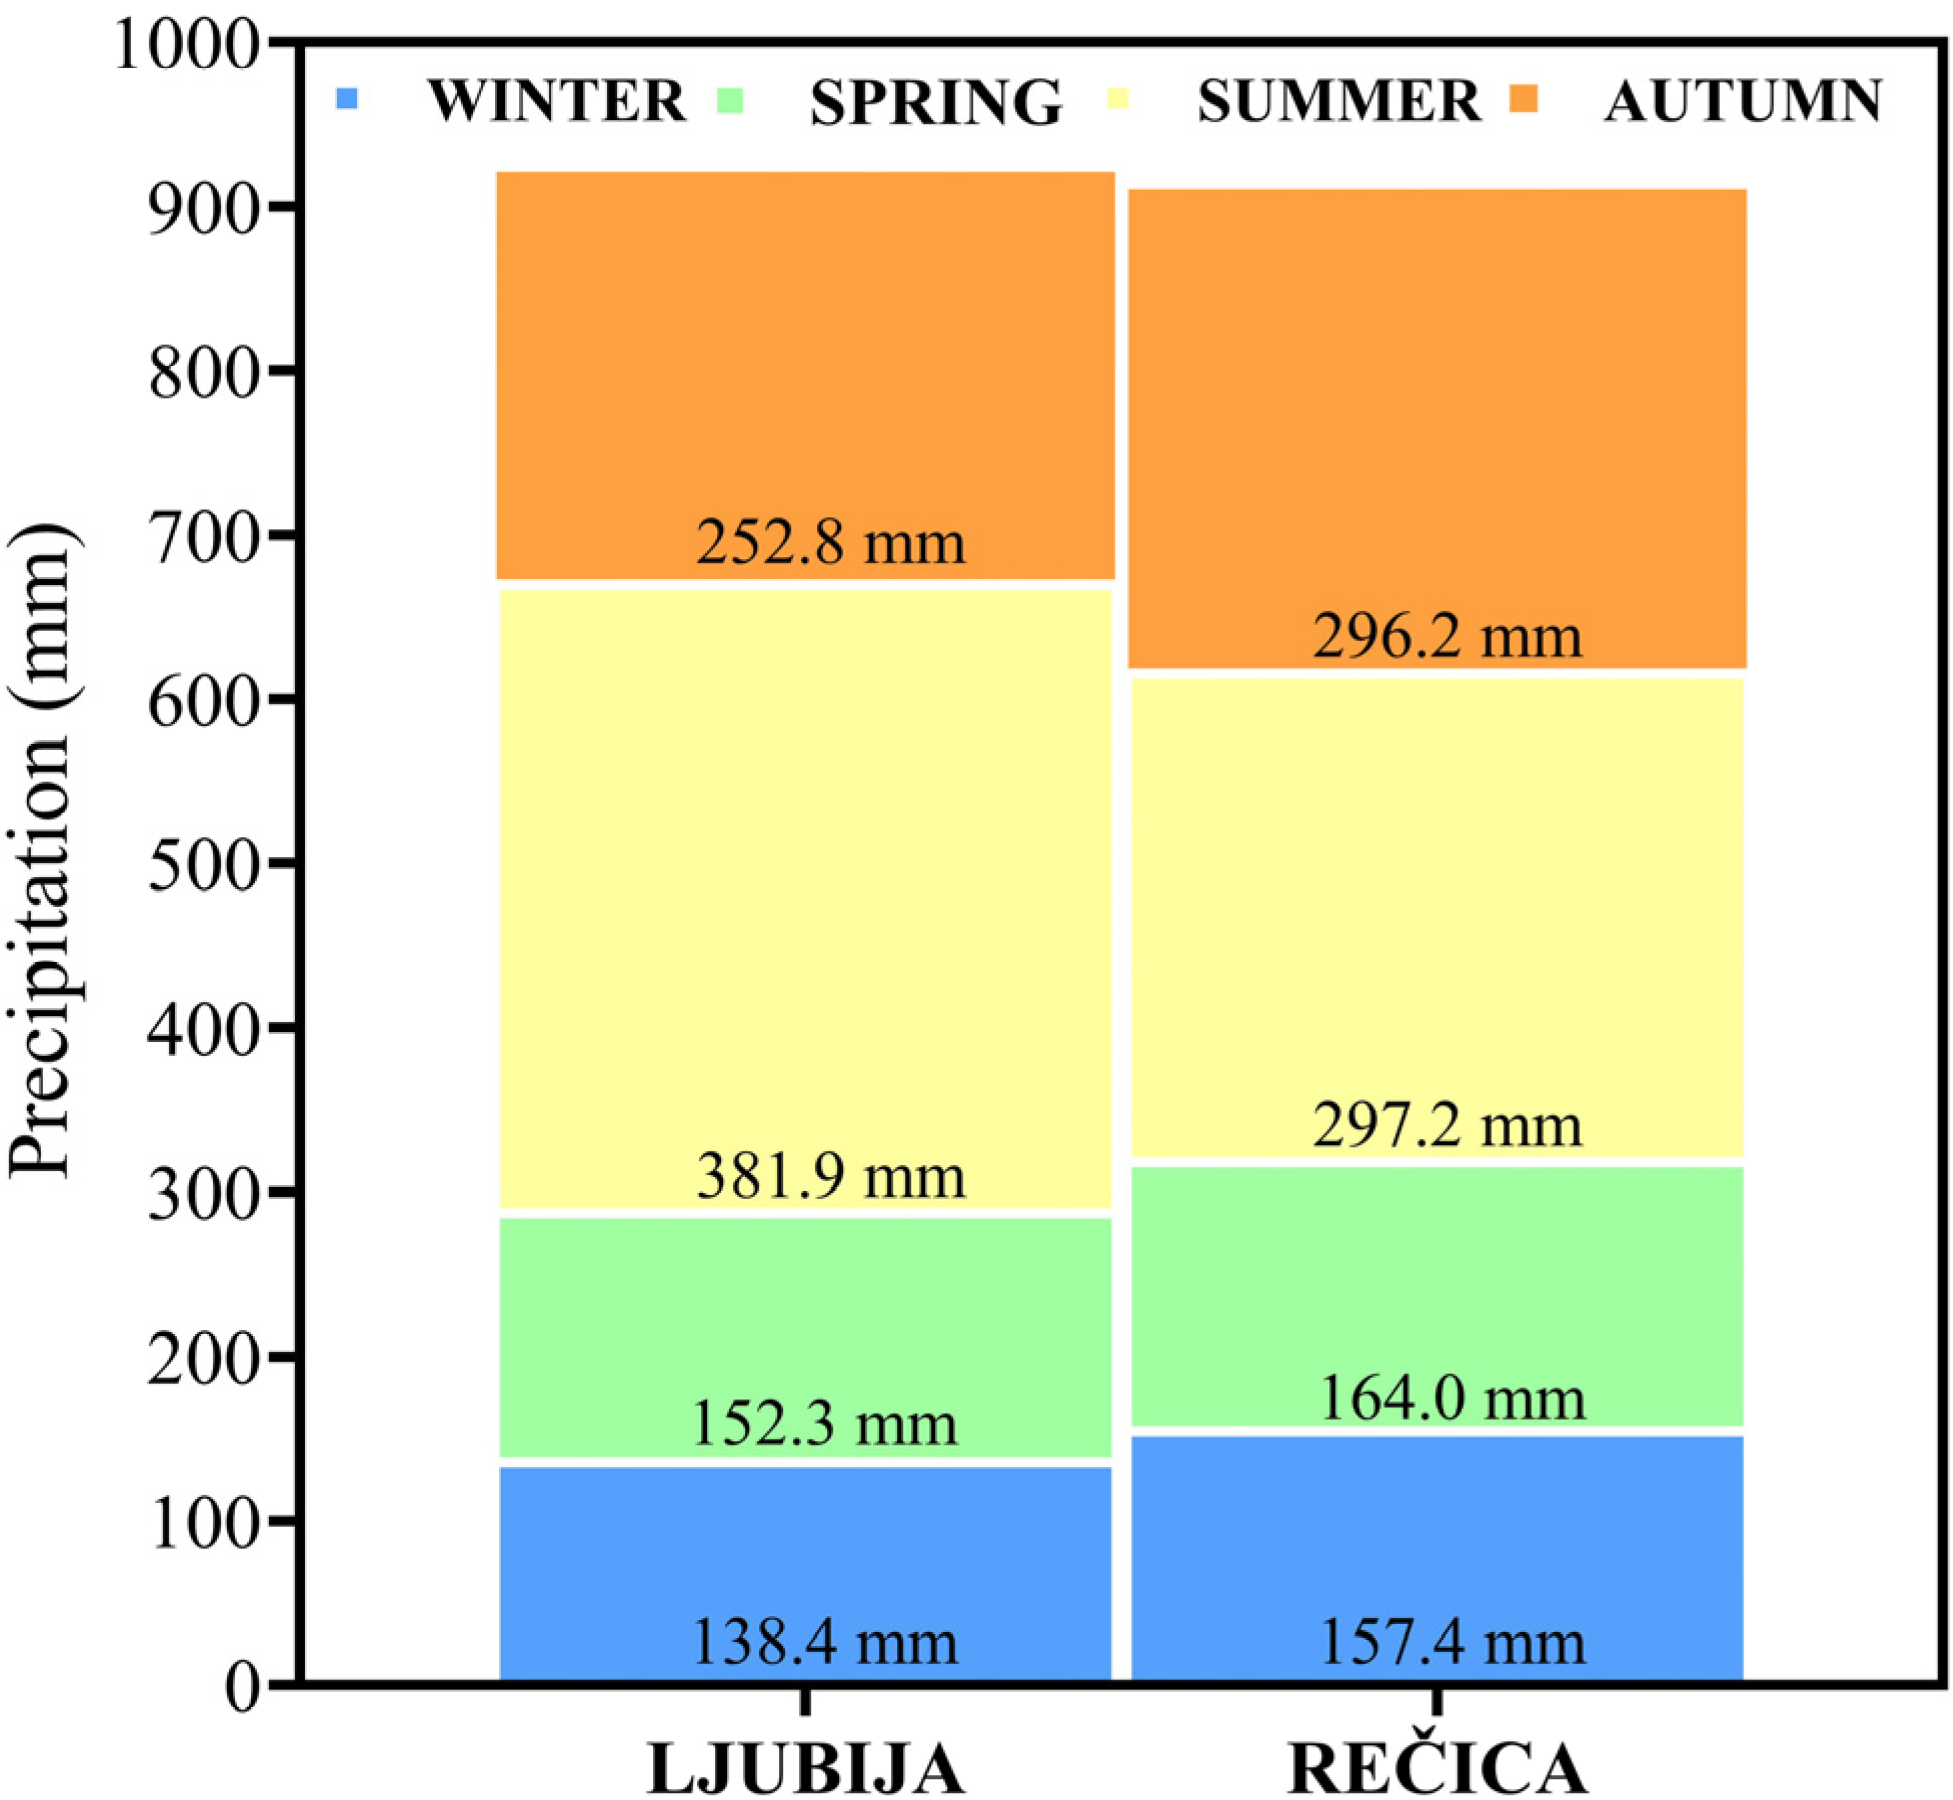
3.1. Precipitation Characteristics

Given the limitations associated with the availability of open access air temperature data from a distant meteorological station (MS), we considered it as not reliable enough. Both study areas fall within the temperate continental climate zone of the central part of Slovenia. This climatic classification is characterized by several key features, namely (1) an average air temperature higher in October than in April, (2) a subcontinental precipitation regime with peak precipitation occurring in May and June as outlined [35], and (3) an average annual precipitation ranging between 1000 and 1300 mm.
Further on, our analysis focused exclusively on the regular and automatically measured precipitation indicator. The meteorological station is situated at an air distance of 2.6 km in the Ljubija area and 2.3 km in the Rečica area, ensuring proximity to our monitored sampling sites. This approach allows us to glean valuable insights into the precipitation patterns influencing the water quality dynamics in the studied catchments.
The precipitation data obtained from the Bele Vode MS (1026 m a.s.l.) in the Ljubija catchment reveals a departure from the typical temperate climate classification, with an average annual precipitation ranging between 1300 and 1400 mm during the period of 1981–2010. Similarly, the Radegunda MS (794 m a.s.l.) in the Rečica catchment also exhibits a deviation from climatic norms, reporting an average annual precipitation between 1400 and 1500 mm during the same period. Regarding values, they suggest a transitional climatic position, indicative of a subcontinental climate zone likely influenced by altitude.
Considering the karstic nature of the studied area, we interpret precipitation data as time series (Figure 2) influenced by (a) monitoring dates, initiated ten days before sampling and organized by season and (b) the discussion of precipitation trends within the rainfall regime. The springs, characterized by a pronounced karstic behavior, respond dynamically to precipitation events, exhibiting short-term, intense flows that swiftly rise after heavy rainfall and subsequently recede rapidly [17,31].
Furthermore, we examined the inclination between the spring and farm locations, defining mountain karst conditions. The inclination in the Ljubija catchment measured 12.9%, while in the Rečica catchment, it was recorded as 41.3% (linear air distance factored in). This topographical information enhances our understanding of the local hydrological dynamics and provides crucial context for interpreting the water quality variations observed during the study.
In the year 2020, the average monthly precipitation in the Ljubija catchment was 133.7 mm, while in the Rečica catchment, it was registered 129.2 mm, as reported by the Slovenian Environment Agency [22]. When analyzing the precipitation data collected 10 days before sampling, we observed consistent rainfall trends in both catchments. Notably, the average annual precipitation during wet conditions was more than twice as high as that during dry conditions, as illustrated in Figure 2 (embedded). A seasonal perspective revealed a distinct peak in summer precipitation, depicted in Figure 3, for both areas, commencing notably in May (Figure 2).
To evaluate the precipitation regime, we conducted a thorough analysis of a longer 10-day data series and plotted linear trend lines, revealing an inclining trend for both meteorological stations (Figure 3). The promising rainfall data is corroborated by the total precipitation recorded for the summer period (June–August), measuring 381.9 mm in Ljubija and 297.2 mm in the Rečica catchment. Another notable peak in precipitation occurs in the period from September to November, with the Rečica area experiencing higher levels (296.2 mm) compared to Ljubija (252.8 mm). These findings contribute valuable insights into the seasonal dynamics of precipitation, shedding light on the hydrological conditions during the research period.
When discussing the natural settings of the researched karst catchments, there are Slovenian Environmental Agency-interpolated maps (data) for air temperature available [22], which were intended to be incorporated in the comparison of precipitation features and analysis (Figure 3, Figure 4 and Figure 5).

3.2. Water Ecological Monitoring

The comprehensive findings from a year of water ecological monitoring are succinctly presented in Table 2.
The temperature (T) of water samples, measured consistently during each sampling, exhibits a harmonious correlation with the natural attributes of the respective areas. In the Ljubija catchment, the annual water temperature averaged 8.0 °C, with LGWs registering 7.9 °C and LSWs recording 8.1 °C. Contrarily, in the Rečica catchment, higher average water temperatures were identified in RGW at 9.3 °C compared to 8.7 °C in RSW. Given the limited frequency of temperature monitoring solely on sampling dates, it is worth noting that more regular assessments could potentially reveal more pronounced temperature variations, particularly in response to heavy precipitation. In our study, temperature (T) demonstrated a degree of seasonal insensitivity.
Across all sampling sites in both areas, pH values exhibited negligible variations, remaining consistently slightly basic and stable. In the Ljubija catchment, the average pH was 7.4 (7.5 in LGWs and 7.4 in LSWs), while in the Rečica catchment, it averaged 7.8. The observed pH values denote a remarkable stability, providing an essential baseline for understanding the water quality dynamics in both catchments.
Electrical conductivity (EC), governed by a limit value of 2500 µS/cm at 20 °C for drinking water [36], serves as a crucial indicator often exhibiting fluctuations linked to various parameters, such as precipitation events, which may contribute to water contamination. In our investigation, the Rečica catchment’s groundwater (RGW) and surface water (RSW) displayed the highest average annual EC values, measuring 417.0 µS/cm and 377.3 µS/cm, respectively, with a modest 9.5% average difference between them. Conversely, a significant disparity of almost 50% in average annual EC values was observed in Ljubija between the two site types, with LGW recording 260.0 µS/cm and LSW at 137.2 µS/cm. Intriguingly, LGW exhibited higher EC values compared to LSW, presenting a contrasting trend to the Rečica catchment’s dynamics, as summarized in Table 2. This variation underscores the nuanced interplay of local factors influencing EC levels and underscores the importance of detailed site-specific analysis in water quality assessment.
Conductivity serves as a practical surrogate for estimating water hardness; it provides an assessment of the total dissolved ions in water, unlike hardness, which specifically quantifies the concentration of divalent cations, primarily Ca and Mg. In our investigation, we noted a direct correlation between water hardness values and conductivity measurements.
The average annual water hardness across all sampling sites was 5.2 °d in the Ljubija catchment and 10.8 °d in the Rečica catchment. In Ljubija, groundwater (GW) exhibited a higher average hardness at 6.8 °d compared to surface water (SW) at 3.6 °d, a trend mirrored in the Rečica catchment with annual GW and SW hardness values at 10.6 °d and 9.9 °d, respectively. Notably, Ljubija displayed a more pronounced difference in hardness between the two water sources, indicating that SW is comparatively deficient in Mg2+ and Ca2+ ions.
Contrastingly, water hardness values for both water types in the Rečica catchment were more comparable, aligning with the characteristics of moderately hard water (°d ≥ 8). It was observed that the surface water source RSW Suha occasionally influenced the characteristics of the groundwater source RGW Žegnan Studenec [28]. Moreover, the shorter air distance between surface and groundwater sources in Rečica (192 m) compared to Ljubija (LSW2-LGW1 distance: 1.5 km) contributed to a more cohesive water quality profile.
In the Ljubija catchment, approximately 68% of water samples exhibited low hardness (4 ≥ °d ≤ 8), 29.6% were very soft (°d ≤ 4), and only 2.6% fell into the medium–hard category. These findings illuminate the nuanced variability in water hardness, providing valuable insights into the ion composition of the studied catchments.
Turbidity serves as an important indicator of the presence of particles smaller than 1 mm, encompassing both inorganic and organic matter, as well as microorganisms. In our study, we specifically focused on the turbidity results for the Ljubija spring (LGW3), a crucial source for drinking water supply. To enhance the context, we compared these results with annual data spanning three years (2019–2021), gathered within the framework of the emission monitoring of water quality by the Slovenian Environment Agency [22] (Table 3).
Comparisons revealed generally comparable data across various parameters, except for turbidity, where our study in 2020 reported a slightly elevated average (9.2 NTU). This disparity can be attributed to our measurement strategy, which focuses on the current state during a short sampling period (Table 2). Intriguingly, the Rečica area exhibited even higher turbidity values, averaging 13.4 NTU for groundwater. Despite a similar precipitation regime compared to the Ljubija catchment, the hydrogeological characteristics of the Rečica catchment proved to be more sensitive to precipitation events, elucidating the nuanced response of different geological settings to environmental factors, e.g., the degree of karstification of the catchment.
The evaluation of nitrate content serves as a key parameter for estimating human impact factors on groundwater ecosystems, with a stipulated threshold for aquifers in Slovenia set below 10 mg NO32−/L [37]. In the Rečica area, the observed values slightly surpassed the values of the Ljubija catchment (average 1.8 mg/L for SW and 3.2 mg/L in GW samples), measuring 7.3 mg/L for surface water (SW) and 4.8 mg/L in groundwater (GW), a variation potentially influenced by hydrogeological conditions.
In both study areas, marginal differences of approximately 5% were noted between measurements during dry and wet conditions for both site types. It is worth noting that a farm situated at a higher elevation from the measured water sources may contribute to these variations. The alert level of concern is set at values exceeding 50.0 mg/L [36]. Notably, due to organic contamination, Rečica groundwater (RGW) was excluded from public drinking water supply in 1986 [28].
In the Rečica area, both sampling sites (RGW and RSW) are positioned almost parallel, while in the Ljubija catchment, groundwater monitoring locations with lower nitrate values are situated below the higher-lying farm, contrasting with the surface water sites in terms of altitude (Table 1).
The indicator of nitrate concentration reflects stable and healthy water ecological conditions in the Ljubija catchment, with an average value of 3.2 mg/L. This aligns with the national monitoring [22] findings from 2019 to 2021 (Table 3), signifying a congruence between our study’s outcomes and broader regional assessments.
The karstic origin of both catchments has introduced water protection zones. The highest protection (due to the highest vulnerability) regime zone represents 88% of the Rečica drainage area (3 km2). Vulnerability is reduced in greater soil thickness conditions with a lower permeability of rocks [17]. The Ljubija WPA covers 0.75 km2, and 2.7% of the area belongs to the highest vulnerable zone [27].
The land cover data of the researched WPAs depicted in Figure 4 reveals that both catchment areas are predominantly forested, a characteristic that contributes positively to the quality of water sources within these regions. Our water ecological research was challenged to compare the active WPA (Ljubija catchment) with a proven degradation of the Rečica spring after more than 30 years, and it has still not been in use for fresh water supply [28].
The nitrate indicator was checked to assess the actual human (agricultural) pressure on the water quality. The monitoring results (2.6 ± 1.6 mg/L) showed that the water bodies of Ljubija were less burdened with NO32−/L on average than in the Rečica WPA (6.0 ± 1.9 mg/L). Connecting water quality data and land use, the treatment of the agricultural land of the observed areas evidently respected water regeneration capacities, aligning with the observed state of the researched water bodies, which demonstrates a satisfactory condition; none of the analyzed water samples exceeded the threshold value of 10 mg/L. This favorable scenario is further reinforced by the self-purifying mechanisms facilitated by adequate precipitation levels and the inherent natural regulation of underground water processes.

3.3. Seasonal Dynamics of Selected Indicators

Electrical conductivity (EC) dynamics are analogous to temperature. Their seasonal variations correlate with (a) precipitation events and discharges, (b) the altitude of the drainage area, and (c) the level of karstification.
Both study areas exhibited heterogeneous dynamics in the seasonal behavior of electrical conductivity. Intense rainfall events, particularly during the summer period, resulted in the highest measured EC values in the groundwater (GW) of both regions. Rečica demonstrated a smaller disparity between GW and SW (surface water) EC values compared to Ljubija’s surface water bodies. The more pronounced EC fluctuations observed at Ljubija sampling sites were consistent across all seasons, as illustrated in Figure 5.
Electrical conductivity values are intricately linked to precipitation, particularly heavy rainfall. Initially, precipitation mixes with the inflow of mineralized water stored underground, referred to as old water. Subsequently, a noticeable decrease in EC occurs due to the infusion of newly infiltrated water, as elucidated by prior studies [17]. The outcomes of tracer tests coupled with additional precipitation events [27,28,31] revealed that the maximum flow velocity of underground water indicating a higher degree of karstification in the Ljubija area (16 caves in the Ljubija spring neighborhood, five in the Rečica catchment) surpassed that of Rečica (73 m/h compared to 49 m/h), which could also be under conditions of drainage from more distant areas.
On the other hand, the inclination data considering the topography between the nearby elevated farm and the spring indicated a steeper landscape in the Rečica area, characteristic of mountain karst conditions.
In tandem with EC, turbidity also responds to heightened rainfall, facilitating the arrival of new water to the spring, while the conventional flow of so-called old water remains relatively unaffected (Figure 6a,b). As our sampling occurred on selected dates, we documented seasonal turbidity fluctuations, noting higher turbidity values during the dry season (Oct–Apr) for both groundwater (GW) and surface water (SW) samples in the studied areas of Ljubija and Rečica. Rečica groundwater (RGW) attained its maximum turbidity value at 13.4 NTU (based on Table 2 and Figure 6b).
The variation in nitrate content according to location (Ljubija and Rečica catchments) and type of sampling point (surface water and groundwater) is shown in Figure 7. The annual variability of nitrate content is significantly lower in the Ljubija area (p value = 1.32 × 10⁻⁶) compared to Rečica (p value = 1.04 × 10⁻⁶). It was lower within each sample site and between both sample site types. However, both observed differences are statistically significant. An even more statistically significant difference was observed between sampling sites in the Rečica area compared to Ljubija, with nitrate levels almost doubling for GW (p value = 4.65 × 10⁻⁵) and SW (p value = 1.54 × 10⁻²⁶) site types. Moreover, the trend of the differences between the two types of sites was reversed; in comparison to Ljubija, nitrate levels in SW samples were higher than in GW samples. Consequently, the differences and the statistical significance between the same site types are even more pronounced between the investigated areas.

4. Comparison of Two Karst Catchments (WPAs)

In delineating the water sources into ground (GW) and surface (SW) categories across the Rečica and Ljubija research areas, our discussion involved three key aspects, namely (1) the significance of wet and drought periods, (2) variations across the year (seasonal dynamics), and (3) intercorrelations among the surveyed indicators.
In periods characterized by minimal rainfall and sustained evapotranspiration, the consequential decline in water levels manifests in elevated turbidity and increased nitrate concentrations in the Ljubija catchment area. Notably, the most pronounced instances occurred at LGW3 in April 2020, where turbidity exceeded 800 NTU and nitrate content peaked at 11.5 mg/L. This divergence from average rainfall events indicates the potential influence of leachate reaching the water source, a phenomenon masked during typical rainfall due to dilution. Speaking of nitrate indicators, our findings have shown its accumulation downstream. While the risk of impact from settlement and agriculture in the immediate hinterland persists, the extent of waterlogging introduces an additional layer of complexity.
To compare, turbidity indicators for Rečica water sources, on average, were higher than those of Ljubija water bodies. This observed trend, alongside higher nitrate levels in Rečica surface water (7.3 mg/L), raises prolonged concerns about potential leachate influx, particularly considering the proximity of agricultural activities. Despite the application of water protection regulations and adherence to organic farming guidelines in both catchment areas, Rečica’s water sources demonstrated less quality at times (Table 2), emphasizing the vulnerable potential of WPAs.
In our assessment of nitrate content, the Ljubija area exhibited very low concentrations (<4 mg/L), indicating a natural origin. Conversely, slightly elevated nitrate levels in Rečica surface water could align with the location’s topography, situated bellow agricultural land. The overall quality of water sources in both areas has been well maintained, with Rečica demonstrating a degree of variability. Our investigation underscores the intrinsic vulnerability of WPAs, where the convergence of karst features, water supply dynamics, and agricultural demands necessitate nuanced management. Thus far, the collaborative efforts in implementing drinking water protection strategies have been commendable, particularly in the researched communities of Rečica ob Savinji, Šoštanj, and Mozirje. The ongoing commitment to safeguarding karst water sources, despite occasional fluctuations, attests to the resilient co-management and protocol for the protection of these critical landscapes [20,21].
The remaining selected indicators consistently demonstrated a highly satisfactory state:
(a)
Temperature data: Throughout the year, temperature data exhibited minimal fluctuations, attesting to the stability of the hydrological conditions irrespective of the precipitation events and season of the year.
(b)
pH values: The pH values consistently aligned with the natural background, affirming their appropriateness within the ecological context.

5. Recommendations and Proposals

Regarding the research goals, the assessment of two WPAs using the multi-indicator method demonstrated the following: (1) validation of the research concept, (2) the sensitivity of karst systems due to their unpredictable hydrogeology (e.g., underground connections), and (3) previous research data highlighting the vulnerability of karst water sources to human activities. One of the starting points of our research was to address the optimization of regulation, a practice that remains uncommon in Europe. As anticipated, the study confirmed a significant need for a comprehensive understanding of the complex interactions within water bodies in karst catchments to support their protection and land use planning.
The application of the interdisciplinary indicator method proved effective in assessing the current state and advocating for potential improvements in water supply legislation. Its utility was particularly evident in the Rečica catchment, where human pressures on the environment have intermittently affected water ecosystem quality in the past. However, given the vulnerable and complex nature of karst systems, further integration of disciplines such as (hydro)geology would enhance the depth of our understanding and support more nuanced recommendations for improvement. The comprehensive integration of diverse scientific perspectives has proven to be a robust strategy for strengthening our insights into the intricate dynamics of water ecosystems and refining legislative frameworks accordingly.

6. Conclusions

In our paper, the exploration of the water ecological dynamics within the karstic water areas and their protection was highlighted. We discussed the need for additional treatment that karst catchments deserve. We grounded our investigation in a meticulous comparison of existing water sources in two catchments situated in subalpine Slovenia. To involve natural settings in our assessment, we juxtaposed data on precipitation levels and connected it with physico-chemical parameters and the characteristics of land use, thereby gauging the existing limits for the quality of water supply sources:
  • The analytical outcomes unearthed intricate connections between environmental variables and various water ecological indicators, notably including precipitation, temperature, pH value, water hardness, electrical conductivity (EC), turbidity, and nitrates. Three indicators—pH, turbidity, and electrical conductivity—adhered to the stipulations outlined in the drinking water regulations [36]. As anticipated, electrical conductivity demonstrated a proportional increase in tandem with the total hardness of the water. The monitoring data on water hardness revealed that the ponors (LSW1 and LSW2) exhibited very soft water (<4 °d), while the springs recorded a medium hardness range (6–8 °d) due to natural chemical processes, including corrosion. Furthermore, in the Rečica catchment, the average water hardness of groundwater (GW) exceeded even more than that of surface water (SW), measuring 11.5 °d and 10.1 °d, respectively.
  • In the Ljubija catchment, a downstream increase in nitrate concentrations was observed, aligning with the expected pattern. Notably, the variables of hardness and nitrate concentration, while independent of each other, both exhibited an increase downstream, reflecting the influence of groundwater undersurface flow dynamics.
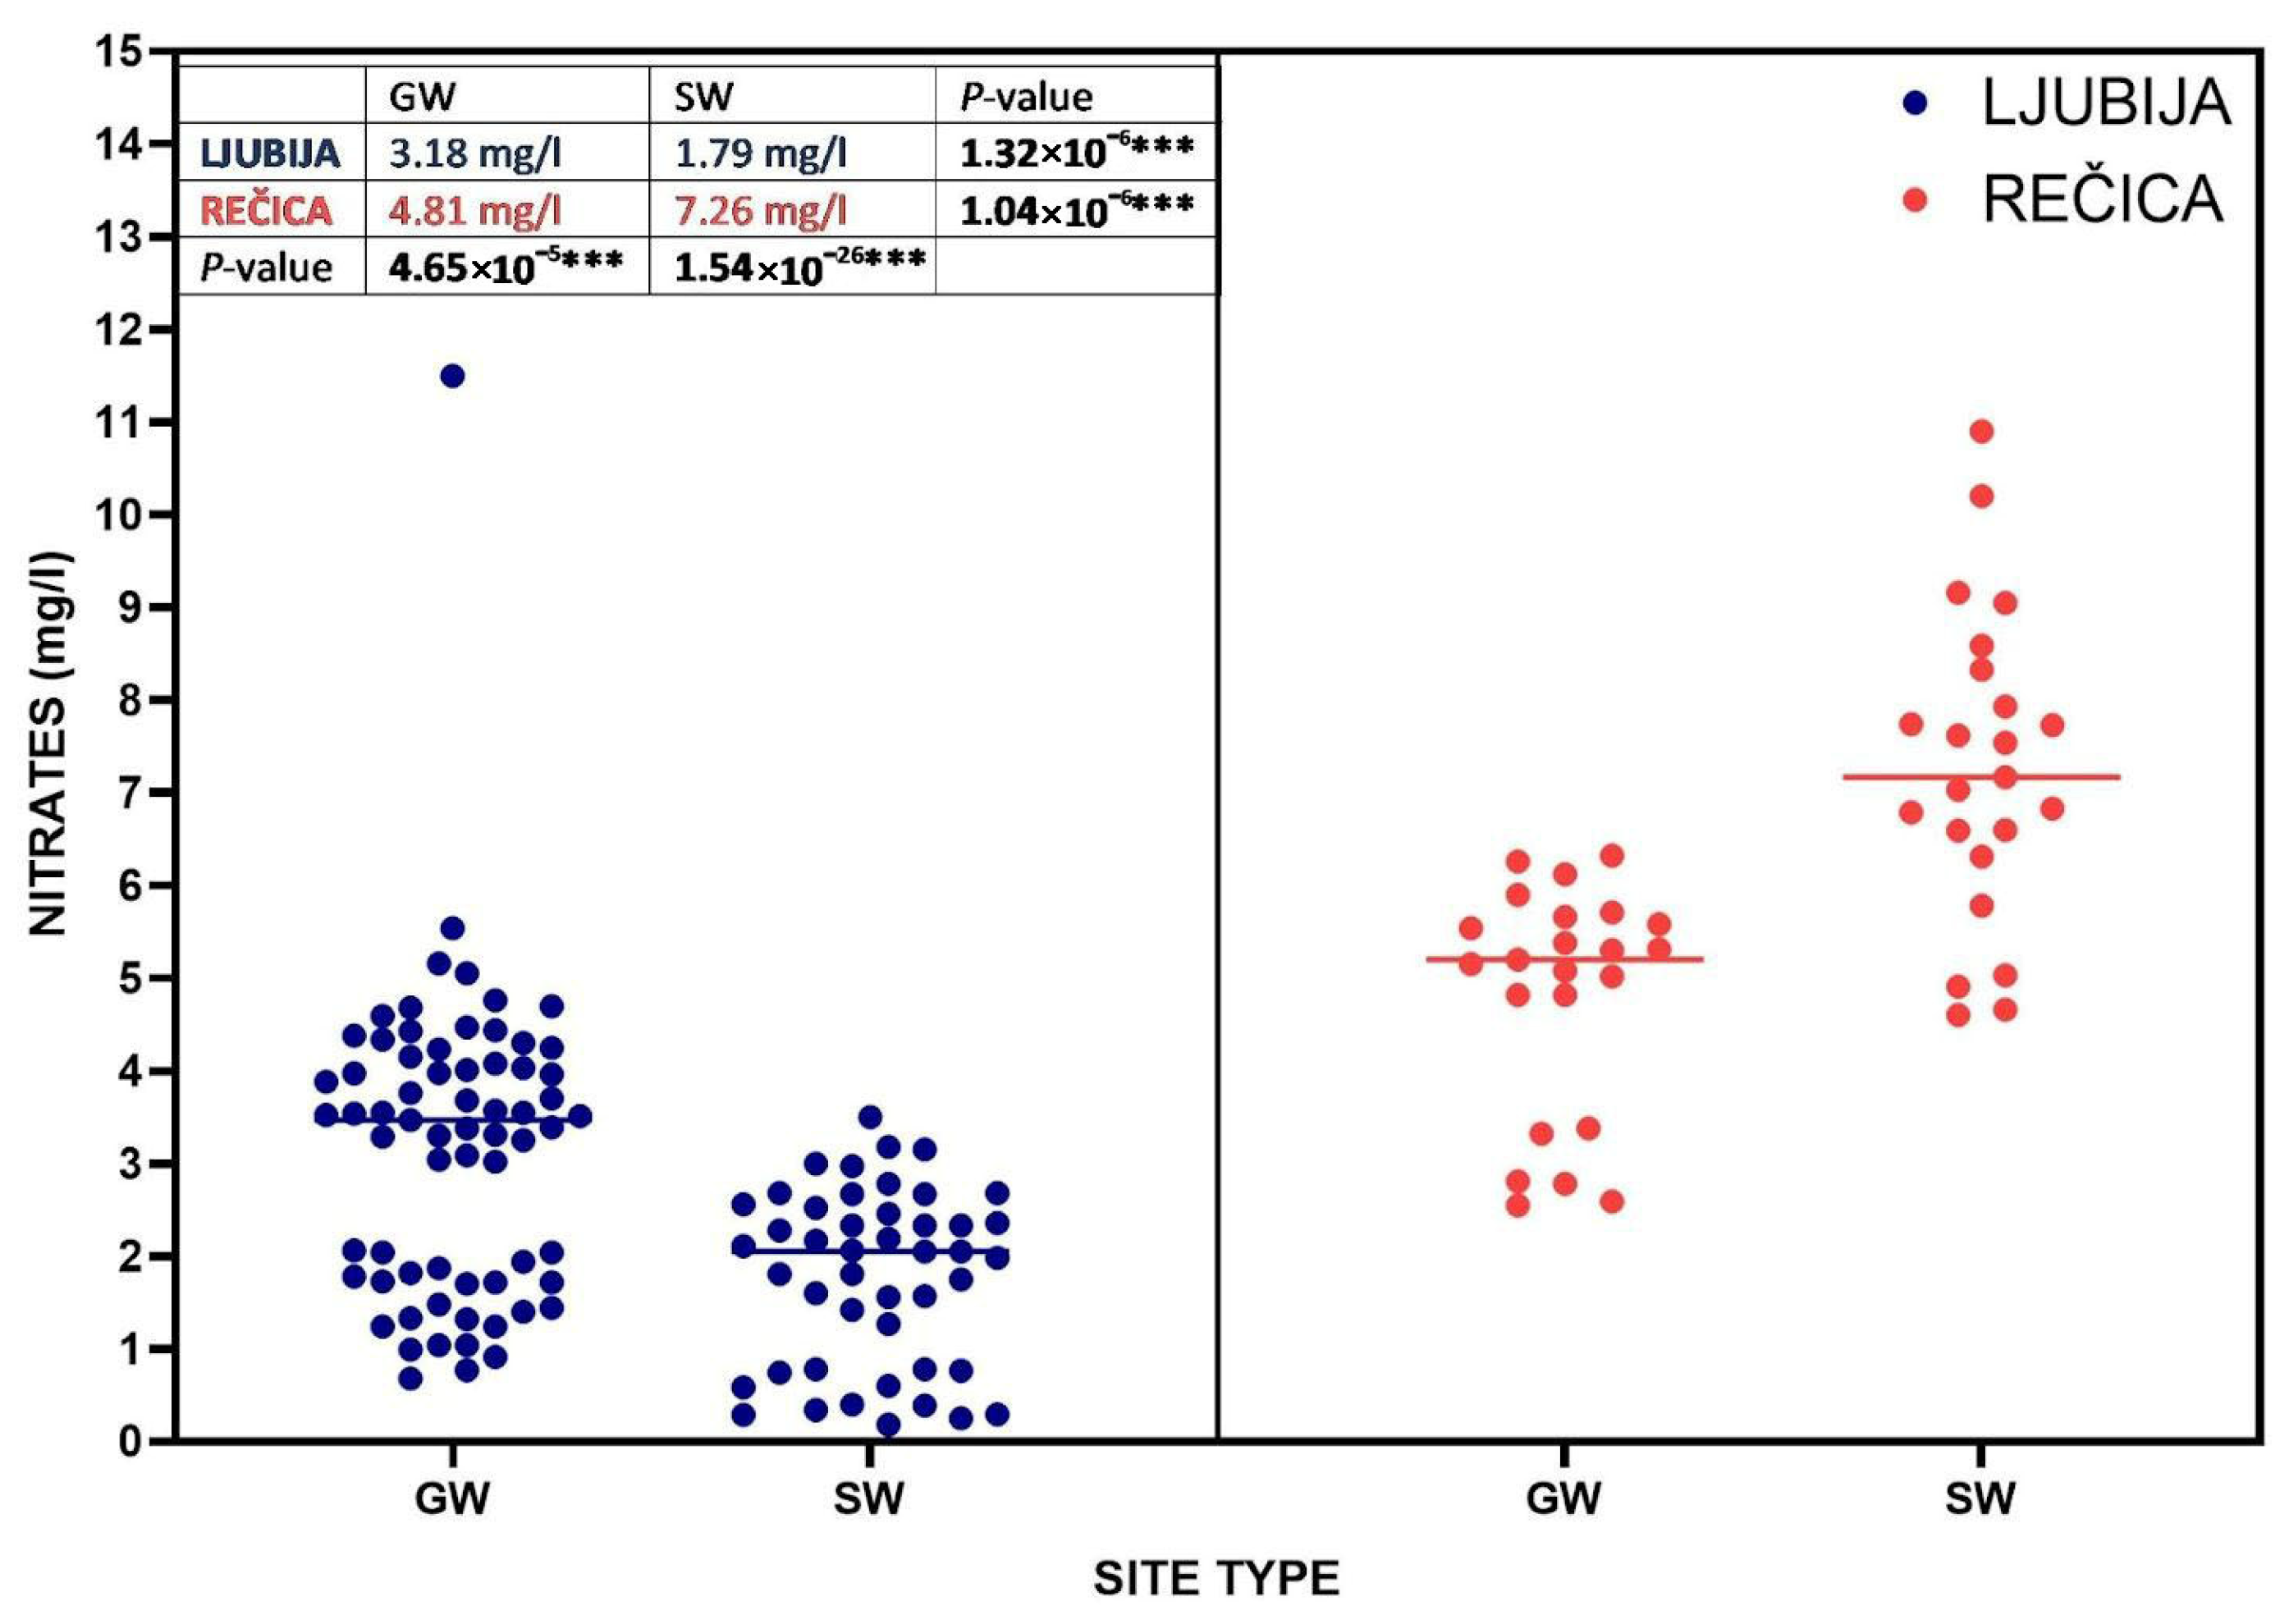
  • Comparative analysis reveals that, on average, nitrates values for Rečica water sources surpassed those of Ljubija samples; Ljubija catchment’s average was 1.8 mg/L for SW and 3.2 mg/L in GW samples, and Rečica area’s average measurements were 7.3 mg/L for surface water (SW) and 4.8 mg/L for groundwater (GW).

Author Contributions

Conceptualization, N.Š. and A.B.; methodology, A.B. and N.Š.; formal analysis, A.B.; investigation, A.B. and N.Š.; writing—original draft preparation, A.B. and N.Š.; writing—review and editing, A.B. and N.Š.; visualization, A.B. and N.Š. All authors have read and agreed to the published version of the manuscript.

Funding

This research received no external funding.

Data Availability Statement

The original contributions presented in this study are included in the article. Further inquiries can be directed at the corresponding author.

Conflicts of Interest

All authors declare that there are no conflicts of interest.

References

  1. Zwahlen, F. Vulnerability and Risk Mapping for the Protection of Carbonate (Karstic) Aquifers. Final Report COST Action 620; European Commission, Directorate-General for Research: Brüssel, Luxemburg, 2004; Available online: https://libra.unine.ch/handle/123456789/14179 (accessed on 20 July 2023).
  2. Worthington, S.R.H. Management of Carbonate Aquifers. In Karst Management; Van Beynen, P.E., Ed.; Springer: New York, NY, USA, 2011; pp. 252–253. [Google Scholar]
  3. Bonacci, O.; Patekar, M.; Pola, M.; Roje-Bonacci, T. Analyses of Climate Variations at Four Meteorological Stations on Remote Islands in the Croatian Part of the Adriatic Sea. Atmosphere 2020, 11, 1044. [Google Scholar] [CrossRef]
  4. Bakalowicz, M. Karst groundwater: A challenge for new resources. Hydrogeol. J. 2005, 13, 148–160. [Google Scholar] [CrossRef]
  5. Worthington, S.R.H. Diagnostic hydrogeologic characteristics of a karst aquifer (Kentucky, USA). Hydrogeol. J. 2009, 17, 1665–1678. [Google Scholar] [CrossRef]
  6. Xiong, Y.; Liu, J.; Yuan, W.; Liu, W.; Ma, S.; Wang, Z.; Li, T.; Wang, Y.; Wu, J. Groundwater Contamination Risk Assessment Based on Groundwater Vulnerability and Pollution Loading: A Case Study of Typical Karst Areas in China. Sustainability 2022, 14, 9898. [Google Scholar] [CrossRef]
  7. Pan, L.; Dai, J.; Wu, Z.; Huang, L.; Wan, Z.; Han, J.; Li, Z. Spatial and Temporal Variations of Nitrogen and Phosphorus in Surface Water and Groundwater of Mudong River Watershed in Huixian Karst Wetland, Southwest China. Sustainability 2021, 13, 10740. [Google Scholar] [CrossRef]
  8. Drinking Water Directive (DWD) 98/83/EC. 2020/2184. Available online: https://eur-lex.europa.eu/eli/dir/2020/2184/oj (accessed on 20 July 2023).
  9. Water Directive (WD) 2000/60/EC. Available online: https://eur-lex.europa.eu/eli/dir/2000/60/oj (accessed on 20 July 2023).
  10. Groundwater Directive (GWD) 2006/118/EC. Available online: https://eur-lex.europa.eu/eli/dir/2006/118/oj (accessed on 20 July 2023).
  11. ARSO, Monitoring and Assessment of the State of Surface and Groundwater in Slovenia; Slovenian Environment Agency, Ministry of the Environment, Climate and Energy. 2016. Available online: https://www.gov.si/en/state-authorities/ministries/ministry-of-the-environment-climate-and-energy/ (accessed on 25 July 2023). (In Slovene)
  12. ARSO, Methodology of Evaluation of Ecological Status of Rivers Based on General Physic-Chemical Quality Elements; Slovenian Environment Agency, Ministry of the Environment, Climate and Energy. 2017. Available online: http://www.statika.evode.gov.si/fileadmin/direktive/WFD_P/2013/2013_I_1_2_6_TP_04.pdf (accessed on 25 July 2023). (In Slovene)
  13. Janža, M.; Lapanje, A.; Šram, D.; Rajver, D.; Novak, M. Research of the geological and geothermal conditions for the assessment of the shallow geothermal potential in the area of Ljubljana, Slovenia. Geologija 2017, 60, 309–327. [Google Scholar] [CrossRef]
  14. Bonacci, O.; Bonacci, D.; Patekar, M.; Pola, M. Increasing Trends in Air and Sea Surface Temperature in the Central Adriatic Sea (Croatia). J. Mar. Sci. Eng. 2021, 9, 358. [Google Scholar] [CrossRef]
  15. Hartmann, A.; Goldscheider, N.; Wagener, T.; Lange, J.; Weiler, M. Karst water resources in a changing world: Review of hydrological modeling approaches. Rev. Geophys. 2014, 52, 218–242. [Google Scholar] [CrossRef]
  16. Stevanović, Z. Managing Karst aquifers—Conceptualizations, solutions, impacts. In Karst Aquifers—Characterization and Engineering; Stevanović, Z., Ed.; Springer International Publishing: Cham, Switzerland, 2015; pp. 403–419. [Google Scholar]
  17. Ravbar, N.; Petrič, M.; Blatnik, M.; Švara, A. A multi-methodological approach to create improved indicators for the adequate karst water source protection. Ecol. Ind. 2021, 126, 107693. [Google Scholar] [CrossRef]
  18. Farzin, M.; Asadi, A.; Pukanska, K.; Zelenakova, M. An Assessment on the Safety of Drinking Water Resources in Yasouj, Iran. Sustainability 2022, 14, 3619. [Google Scholar] [CrossRef]
  19. Petrič, M.; Ravbar, N. Kraški vodni viri in njihovo varovanje. In Kras [Trajnostni Razvoj Kraške Pokrajine]; Luthar, O., Ed.; ZRC Publishing House: Ljubljana, Slovenia, 2008; pp. 81–84. (In Slovene) [Google Scholar]
  20. Petrič, M.; Kogovšek, J.; Ravbar, N. Adjustment of the Slovene legislation to the special characteristics of karst aquifers. In Karstology and Development Challenges on Karst, 1—Water; Knez, M., Petrič, M., Slabe, T., Eds.; Karst Research Institute at ZRC SAZU: Postojna, Slovenia, 2011; pp. 124–136. [Google Scholar]
  21. Živanović, V. Delineation of Karst groundwater protection zones. In Karst Aquifers—Characterization and Engineering; Stevanović, Z., Ed.; Springer International Publishing: Cham, Switzerland, 2015; pp. 625–642. [Google Scholar]
  22. ARSO, Climatological Data Archive; Slovenian Environment Agency, Ministry of the Environment, Climate and Energy. 2022. Available online: https://meteo.arso.gov.si/met/sl/archive/ (accessed on 14 July 2023).
  23. Slovene Cave Registry. 2020. Available online: https://www.katasterjam.si/Home/DetailedCaveMap (accessed on 20 October 2023).
  24. Kralj, P. Zeoliti v vulkanoklastičnih kamninah smrekovškega podgorja (severna Slovenija). Geologija 1997, 40, 247–281. [Google Scholar] [CrossRef]
  25. Melik, A. Slovene Alpine Region; Slovenska Matica: Ljubljana, Slovenia, 1954. (In Slovene) [Google Scholar]
  26. Gams, I. Karst in Slovenia in Space and Time; Scientific Research Centre of the Slovene Academy of Science and Art: Ljubljana, Slovenia, 2003; p. 510. (In Slovene) [Google Scholar]
  27. Špeh, N.; Bubik, A.; Barborič, B. Water-ecological conditions in Zaloka Valley. Geog. Bull. 2021, 93, 57–71. [Google Scholar]
  28. Municipal Company Velenje, Drinking Water Supply. Available online: https://www.kp-velenje.si/images/vsebina/Vodooskrba.pdf (accessed on 25 June 2023). (In Slovene).
  29. Novak, D. Hidrogeološke raziskave v zaledju izvira Župnekovo žrelo. Var. Nar. 2002, 19, 151–153. (In Slovene) [Google Scholar]
  30. Špeh, N.; Bubik, A.; Barborič, B. Quality of water sources and land use in the Ljubija Water Protection Area. In Regional Development Yesterday, Today, Tomorrow, 1st ed.; Nared, J., Polajnar Horvat, K., Razpotnik Visković, N., Eds.; ZRC Publishing House: Ljubljana, Slovenia, 2021; pp. 147–161. Available online: https://omp.zrc-sazu.si/zalozba/catalog/view/1974/8135/1519-2 (accessed on 20 October 2023). (In Slovene)
  31. Krajnc, A. 1979: Kras v povirju Ljubije. Geog. Bull. 1979, Ll, 31–42. Available online: https://zgs.zrc-sazu.si/Portals/8/Geografski_vestnik/2_Pred1999/GV_5101_031_042.pdf (accessed on 25 June 2023). (In Slovene).
  32. Petrič, M.; Kogovšek, J. Water temperature as a natural tracer—A case study of the Malenščica karst spring (SW Slovenia). Geol. Croatica 2010, 63, 171–177. [Google Scholar] [CrossRef]
  33. Ravbar, N.; Engelhardt, I.; Goldscheider, N. Anomalous behavior of specific electrical conductivity at a karst spring induced by variable catchment boundaries: The case of the Podstenjšek spring, Slovenia. Hydrol. Process. 2011, 25, 2130–2140. [Google Scholar] [CrossRef]
  34. Devetak, I.; Zupanc, N.; Vinko, L.; Slapničar, M. Določanje Trdote Vode: Zbirka Eksperimentov/Determination of Water Hardness—A Collection of Experiments; Faculty of Education, University of Ljubljana: Ljubljana, Slovenia, 2019. [Google Scholar]
  35. Ogrin, D. Podnebni tipi v Sloveniji/The climate types in Slovenia. Geog. Bull. 1996, 68, 39–55. [Google Scholar]
  36. Decree on Drinking Water; Official Gazette of the Republic of Slovenia. 2023. Nos. 61/23. Available online: https://www.uradni-list.si/glasilo-uradni-list-rs/vsebina/2023-01-1848/uredba-o-pitni-vodi (accessed on 5 September 2024). (In Slovene).
  37. Nitrati v Podzemni Vodi (in Slovene)/Nitrates in the Groundwater. Available online: https://kazalci.arso.gov.si/en/content/nitrates-groundwater-9 (accessed on 5 September 2024).
Figure 1. Position of the studied water bodies in NE Slovenia and detailed map of the researched area.
Pollutants 05 00019 g001
Figure 2. Precipitation data for the 10 days before sampling dates and the rainfall regime trend [22].
Pollutants 05 00019 g002
Figure 3. Seasonal variation in precipitation (in mm) in Ljubija and Rečica catchments 10 days before sampling [22].
Pollutants 05 00019 g003
Figure 4. Land use maps of study areas (legend is valuable for both maps): Ljubija (a) and Rečica catchment (b).
Pollutants 05 00019 g004
Figure 5. EC seasonal fluctuations at monitoring sites, namely Ljubija and Rečica areas.
Pollutants 05 00019 g005
Figure 6. Turbidity dynamics of the observed Ljubija water bodies (a) and turbidity dynamics of the monitored spring and sink in the Rečica area (b).
Pollutants 05 00019 g006
Figure 7. Nitrates concentration variations in water in Rečica and Ljubija catchments. *** denotes a significant difference in nitrate concentrations among 4 measuring sites (one-way ANOVA, p < 0.001).
Pollutants 05 00019 g007
Table 1. Typology of the sampling sites of the Ljubija and Rečica catchment areas.
AreaSampling SiteSite DescriptionAltitude
(in m) a.s.l.
Coordinates
(GKX, GKY)
Ljubija catchment LGW1left side of the Ljubija
riverbed
720140,402 495,247
LGW2right side of Ljubija670140,410 495,256
LGW3Ljubija spring669140,387 495,161
LSW1sink in the Rupa cave929139,959 493,354
LSW2sink below the organic farm910140,201 493,568
Rečica catchmentRGW1spring in Žegnan Studenec 429133,349 493,746
RSW1sink Suha 465133,630 493,700
Table 2. Results of the aggregated series of the sampling water bodies: GW—groundwater; SW—surface water.
AreaSampling
Site
Site TypeTwater
(°C)
pH
Turbidity
(NTU)
EC
(µS/cm)
Hardness
(°d)
Nitrates (mg/L)
Ljubija catchmentLGW1groundwater8.3 ± 2.47.5 ± 0.68.8 ± 6.3272.1 ± 46.76.7 ± 1.03.2 ± 2.3
LGW2groundwater7.8 ± 2.57.5 ± 0.58.6 ± 7.7262.9 ± 48.06.9 ± 0.83.0 ± 1.2
LGW3groundwater7.6 ± 2.27.4 ± 0.59.2 ± 5.4246.0 ± 61.16.2 ± 0.53.3 ± 1.4
LGW averagegroundwater7.9 ± 2.37.5 ± 0.58.9 ± 6.5260.0 ± 52.86.7 ± 0.83.2 ± 1.7
LSW1surface water8.4 ± 5.77.4 ± 0.411.5 ± 8.2172.1 ± 40.13.8 ± 0.81.9 ± 0.9
LSW2surface water7.9 ± 5.37.4 ± 0.69.0 ± 5.4102.4 ± 31.52.3 ± 0.61.7 ± 0.9
LSW averagesurface water8.1 ± 5.57.4 ± 0.510.2 ± 7.0137.2 ± 50.13.1 ± 1.11.8 ± 0.9
AVERAGE8.0 ± 3.97.4 ± 0.59.4 ± 6.7210.0 ± 79.55.2 ± 2.02.6 ± 1.6
Rečica catchmentRGW1groundwater9.3 ± 1.87.8 ± 0.413.4 ± 7.7417.0 ± 95.511.5 ± 0.44.8 ± 1.2
RSW1surface water8.7 ± 3.97.8 ± 0.69.9 ± 7.2377.3 ± 88.210.1 ± 0.67.3 ± 1.7
AVERAGE9.0 ± 3.17.8 ± 0.511.7 ± 7.6397.2 ± 93.110.8 ± 0.96.0 ± 1.9
Type of parameter *physicalchemicalindicator indicator physicalchemical
* According to the legislation [36], three groups of parameters (microbiological, chemical, and indicator parameters) are determined. For indicator parameters, limit values are not necessarily correlated with a threat to health and serve as a warning of the potential threat to water quality.
Table 3. Annual parameters (mean values) of Ljubija drinking water supply [22].
201920202021Measured Data
Twater (°C)7.47.07.27.6
pH8.38.28.27.4
turbidity (NTU)2.72.02.09.2
EC (µS/cm)224.1299.6214.2246.0
hardness (°d)6.26.76.16.2
nitrates (mg/L)3.43.43.33.3
Disclaimer/Publisher’s Note: The statements, opinions and data contained in all publications are solely those of the individual author(s) and contributor(s) and not of MDPI and/or the editor(s). MDPI and/or the editor(s) disclaim responsibility for any injury to people or property resulting from any ideas, methods, instructions or products referred to in the content.

