Article

Source Apportionment and Risk Assessment of Heavy Metals in Soils During Dry and Rainy Seasons in Southern Malawi

by
Constance Chifuniro Utsale
1,2,
Chikumbusko Chiziwa Kaonga
1,
Fabiano Gibson Daud Thulu
1,*,
Petra Chiipa
1,
Stellah James
1 and
Ishmael Bobby Mphangwe Kosamu
1
1
Department of Physics and Applied Sciences, Malawi University of Business and Applied Sciences, Private Bag 303, Blantyre 312225, Malawi
2
Environment Department, Central East African Railways, Stations Road, Limbe P.O. Box 5144, Blantyre 312229, Malawi
*
Author to whom correspondence should be addressed.
Pollutants 2025, 5(1), 6; https://doi.org/10.3390/pollutants5010006
Submission received: 21 December 2024 / Revised: 10 February 2025 / Accepted: 24 February 2025 / Published: 5 March 2025
(This article belongs to the Section Impact Assessment of Environmental Pollution)

Abstract

:
The recent increase in industrial activities has raised concerns regarding environmental quality in urban areas in Malawi. In this study, the contents of heavy metals [copper (Cu), zinc (Zn) and cadmium (Cd)] were analysed in 15 sites selected from Makata, Limbe, Maselema, Chirimba, and Maone industrial zones of Blantyre City in Malawi. Soil sampling was conducted during dry and rainy seasons, followed by laboratory analysis. The results revealed a few cases of elevated content of heavy metals exceeding permissible England and Canadian standards with higher content detected during the dry season than in the rainy season. Chirimba soil had the highest mean Zn content of 822 mg/kg in the rainy season and 579 mg/kg in the dry season. Maone soils had the highest Cd content, measuring 2.09 mg/kg in the rainy season and 3.06 mg/kg in the dry season. Chirimba soils also had the highest Cu content with levels of 105 mg/kg in the dry season and 79 mg/kg in the rainy season. The geo-accumulation index indicated that Zn posed the most severe pollution. The results of the Positive Matrix Factorisation model suggest that heavy metal pollution primarily originates from metal processing and manufacturing industries, followed by plastic manufacturing industries. This finding is supported by the nature of emissions from these sectors, where metal processing activities release heavy metals through particulates and waste to the environment, suggesting collective actions to prevent soil contamination.

1. Introduction

Pollution introduces harmful substances and energy into water, air, or soil, harming living organisms and degrading resource quality for future use [1]. Global pollution is a critical challenge affecting mankind, causing harmful consequences for both living and non-living entities [2]. Pollution stems from many natural and man-made activities, with industrial activities being a significant contributor [3,4,5].
There is a persistent heavy metal contamination of soil and crops irrigated with wastewater from treatment plant effluent Blantyre City in Malawi [6]. The content levels of heavy metals in these areas surpass both Malawi Standards (MSs) and World Health Organization (WHO) limits [7,8].
To assess the ecological risk of heavy metal contamination content, diverse technical methods have been developed. Such methods include the geo-accumulation index and contamination factor, which consider factors like overall concentration, bioavailability, and the toxicity of heavy metals [9]. Furthermore, these methods are commonly employed to evaluate soil pollution caused by heavy metals [10]. The geo-accumulation index is defined as a measure of the pollution content in samples compared to a reference environment, which assists in classifying the level of contamination into various grades [11]. It offers many advantages such as being easy to calculate and interpret. It offers high accuracy in reflecting anthropogenic impacts [12].
A comprehensive ecological and health risk assessment was conducted for heavy metals present in soils from Chinese enterprises. The assessment focused on agricultural areas, to provide valuable information for the development of policies which minimise exposure and manage risks associated with metals [13]. This assessment found that various sources such as mining activities, heavy metal processing and smelting areas, ordinary industrial areas, food crop plantations, and vegetable plantations among other sites contribute to heavy metal pollution.
Analysing pollution sources serves as a fundamental tool in preventing and managing heavy metal pollution [13]. One such analytical tool is the Positive Matrix Factorisation (PMF). This tool can identify sources through multivariate factor analysis [14]. In this tool, factors are used to show sources of pollutants. For example, Wang et al. used an integrated method for the source apportionment of heavy metal(loid)s in agricultural soils and model uncertainty analysis. They incorporated a three-factor solution of the PMF model to accurately show sources of heavy metals collected from orchard agricultural soils [15]. The PMF model assumes that the uncertainties in the measurements are known and accurately quantified. The composition of the sources impacting the sites does not change between sites, and both the source profiles and their contributions are not negative [16]. This model offers various advantages such as flexibility since it does not need prior information about the structure or spread of the sources. It also includes uncertainties in the analysis, which ensures that the source apportionment results are reliable [17].
A study conducted in sub-Saharan Africa showed that excessive soil pollution has posed an economic threat and has been enhanced due to the less stringent implementation of policies related to heavy metal management [18,19]. Furthermore, research has shown that over 80% of Malawi’s industrial sector, which is primarily consisting of manufacturing, agriculture, and construction, poses a higher risk of environmental pollution due to the lack of strict environmental policy enforcement [20]. Despite the existence of studies analysing heavy metal levels in soil, there have been few extensive studies specifically targeting the designated industrial sites in Malawi. This lack of comprehensive information underscores the potential threat that unmonitored heavy metal pollution poses to the local population, particularly those living and working in close proximity to these industrial areas. The exposed population primarily includes industrial workers and nearby residents who are at risk of chronic exposure to these pollutants through direct contact with contaminated water, soils, the inhalation of dust particles, and the consumption of locally grown crops [21].
Various studies have been performed to analyse water quality in Blantyre. One such study analysed water quality in streams and wastewater treatment plants. The study disclosed that Blantyre City streams are currently contaminated by heavy metals, rendering them unsafe for human consumption and detrimental to aquatic organisms [22]. A study assessing the effects of urbanisation on seasonal water quality in Blantyre’s Mudi River revealed that pollutants are from various sources such as industrial effluents, blocked sewer lines, agricultural activities, improper waste disposal, and inefficient wastewater treatment plants. Wastewater treatment plants in Blantyre city are found to be ineffective in significantly reducing heavy metals in wastewater. These wastewater treatment plants were primarily designed to handle organic pollutants [23].
Another study associated with evaluating the content of heavy metals on the riverbank soils along Mudi River, which flows through the city’s industrial zone, was performed. It reported the average content as follows: Cr (8.19 mg/kg), Cu (10.13 mg/kg), Ni (4.32 mg/kg), Pb (3.49 mg/kg), Zn (17.45 mg/kg), and Cd (0.18 mg/kg). Industrial effluents were identified as the contributing factor to heavy metal pollution [24]. Lastly, another study on soil heavy metals in Blantyre indicated that the average content of Cd (4.48 mg/kg) at the Manase Wastewater Treatment Plant surpassed the permissible limits set by the WHO (0.8 mg/kg) and Canada (0.5 mg/kg) [6]. These studies concentrated on assessing the heavy metal pollution levels in water and river banks. This indicates a knowledge gap in industrial contribution, as performed in other countries. In this study, we extend the research by investigating heavy metal soil samples from industrial sites in Blantyre city, which is located in the Southern Region of Malawi [5].
The content of copper (Cu), zinc (Zn) and cadmium (Cd) were studied in 15 sites selected from Makata, Limbe, Maselema, Chirimba, and Maone industrial zones. Cd, Cu, and Zn are commonly associated with the types of industrial activities present in these areas, making them critical indicators of pollution levels and potential risks to human health and the environment. Previous studies in water from streams around industrial areas in Blantyre city focused on the analysis of similarly heavy metals [21,24]. The geo-accumulation index was used to assess the pollution risk of heavy metals in the studied areas. The Positive Matrix Factorisation (PMF) model was used to conduct the source apportionment of heavy metals. Furthermore, this study evaluated the heavy metal pollution characteristics and associated risks, as well as source apportionment. A better understanding of these metals is crucial for protecting public health, preserving the environment, ensuring regulatory compliance, raising community awareness, and promoting long-term environmental sustainability.

2. Materials and Methods

2.1. Study Area

Blantyre city is the urban centre of Blantyre District in Southern Malawi. It has an area of 240 km2. Blantyre District has an overall population of 900,000 people [25]. This study was conducted at 15 sites situated in industrial zones, specifically Makata, Limbe, Maselema, Chirimba, and Maone, as shown in Figure 1. All industrial zones are located alongside the main rivers or streams in Blantyre city. These zones rely on water in their line production processes. This leads to the generation of effluents that are subsequently discharged into the water bodies [26]. Industries in Blantyre fall under the following categories: textile and leather products, paints, pharmaceuticals and other chemicals, metal and wood processing, petroleum and plastics, power distribution, dairy products and abattoir, beer breweries, tobacco processing, and food processing.

2.2. Soil Sampling

The sampling sites were selected based on their potential to capture variations in soil quality, influenced by their homogeneity and work-related characteristics. Consideration was also given to the time available for research, financial limitations, and the accessibility of the sampling points in both seasons. Soil samples were collected from all the 15 sampling points, with three points selected from each of the five industrial areas [27,28]. No normal (non-industrial) soil samples were included in this study, as the focus was specifically on assessing heavy metal contamination in soils directly impacted by industrial activities. Soil samples were collected in the morning hours of dry and rainy seasons in 2023.
Soil samples were collected within the topsoil range (0–15 cm) using a soil auger. During the sampling process, care was taken to remove any surface vegetation or organic matter to ensure that the samples represented the mineral soil layer. This approach allowed for a more accurate assessment of heavy metal content in the soil while minimising the influence of vegetative cover. Five soil samples were collected randomly at each point and were mixed in a bucket before sub-sampling (quartering) [29]. The samples were collected in plastic bags and taken to the laboratory located at Malawi University of Business and Applied Sciences for analysis.

2.3. Determination Method for Heavy Metals in Soil

In this work, the content of heavy metals was determined using Atomic Absorption Spectrophotometry (AAS) in reference to standard methods from the American Public Health Association. AAS offers many advantages, including accuracy, precision, and versatility in the analysis of trace elements. However, it does have some limitations, such as its inability to analyse multiple elements simultaneously and its reduced sensitivity when dealing with samples containing extremely low element content. While we acknowledge these limitations, the decision to use AAS was based on its suitability for the specific content ranges expected in our samples and the need for precise quantification.
The preparation of soil samples involved removing any waste matter and plant residues, followed by oven drying at 105 °C. The soil samples were then crushed in a motor with a small force to make then fine. The milled samples were then sieved to ensure uniformity through a sieve of 2 mm mesh. After sieving, the samples were finely ground into a powder to blend them thoroughly. From this homogenised soil, 1 g was weighed using an analytical balance in triplicates and then placed in a Teflon digester for further analysis.
Digestion of the soils, which were weighed, was performed with a blend of 10 mL concentrated hydrochloric acid (HCl) and 3.5 mL of concentrated nitric acid (HNO3). The blends were left under a fume hood overnight. Later, the samples were exposed to 105 °C of heat for a period of 2 h through the microwave digestion system (weight digestion). Afterwards, 20 mL of distilled water was added, and the samples were filtered using the Whatman filter paper No. 42, which is known for its fine particle retention. This step was essential to remove any remaining solid particles and obtain a clear solution for subsequent analysis. The filtrate was topped up to 100 mL in a volumetric flask with distilled water up to the mark. After that, the samples were analysed using the Atomic Absorption Spectrophotometry (AAS) machine with GBC 32AB MODEL [30]. These standards were used to calibrate the instrument for the accurate quantification of Cu, Zn, and Cd in the samples. The instrument detection limits for Cu, Zn, and Cd are 0.01 mg/L, 0.005 mg/L, and 0.002 mg/L, respectively [30].

2.4. Source Apportionment of Soil Heavy Metals

To identify quantitatively the source of the soil heavy metal parameters in the study areas, a Positive Matrix Factorisation (PMF) model was used in the analysis through EPA PMF 5.0 (US) software [16].

2.5. Data Analysis

The open-source software R Studio version 4.3.1 was used in statical analysis of the results [31]. A t-test was used to observe the variations among the sample means and between the sample types, respectively, at a 95% confidence interval. The Microsoft Excel 2016 Windows programme was used in calculating the geo-accumulation index. A significance level (α) of 0.05 was used for all statistical tests in this study.
PMF was used to ascertain the potential sources of soil heavy metals by utilising the steps detailed in the USEPA guidelines. In this model, the content data matrix for samples was divided into a factor distribution and contribution matrix. The factor numbers were configured to 2, 3, 4, 5, and 6, with 40 runs as a total to ensure stability of the model [16].
The pollution risk assessment was computed using the geo-accumulation index ( I g e o ) to estimate the heavy metal contamination level of the soil exposure and is applied to evaluate pollution due to a single element [32]. The I g e o was calculated using Equation (1) as presented by Kowalska et al.,
I g e o = L o g 2 C n 1.5 × G B
where C n is the content of individual heavy metal. G B is the geochemical background, and 1.5 is a constant that allows for an analysis of the variability of heavy metals as a result of natural processes [33]. In this study,   G B values (which are a characteristic of lithology) were calculated (by averaging) from previous studies performed in Blantyre by Malikula et al. [6] and a review by Kaonga et al. [21]. The averaged values were used as reference for Cu, Zn, and Cd to assess present pollution levels in industrial sites. The background values for Cu, Zn, and Cd were 0.2, 0.5 and 0.6 mg/kg, respectively.

3. Results and Discussion

3.1. Heavy Metal Content Levels in Soil

Table 1 shows levels of heavy metals in soil from the sampling points. Due to the absence of soil quality standards in Malawi, reference was made to international soil quality standards, namely, Canadian [34] and England standards [35]. The results show that there are some notable extremes in heavy metal levels which are above the acceptable threshold in some sites for the monitored period, for example, a value of 822 ± 2.3 mg/kg for Zn from Chirimba AP.

3.1.1. Copper Content Levels

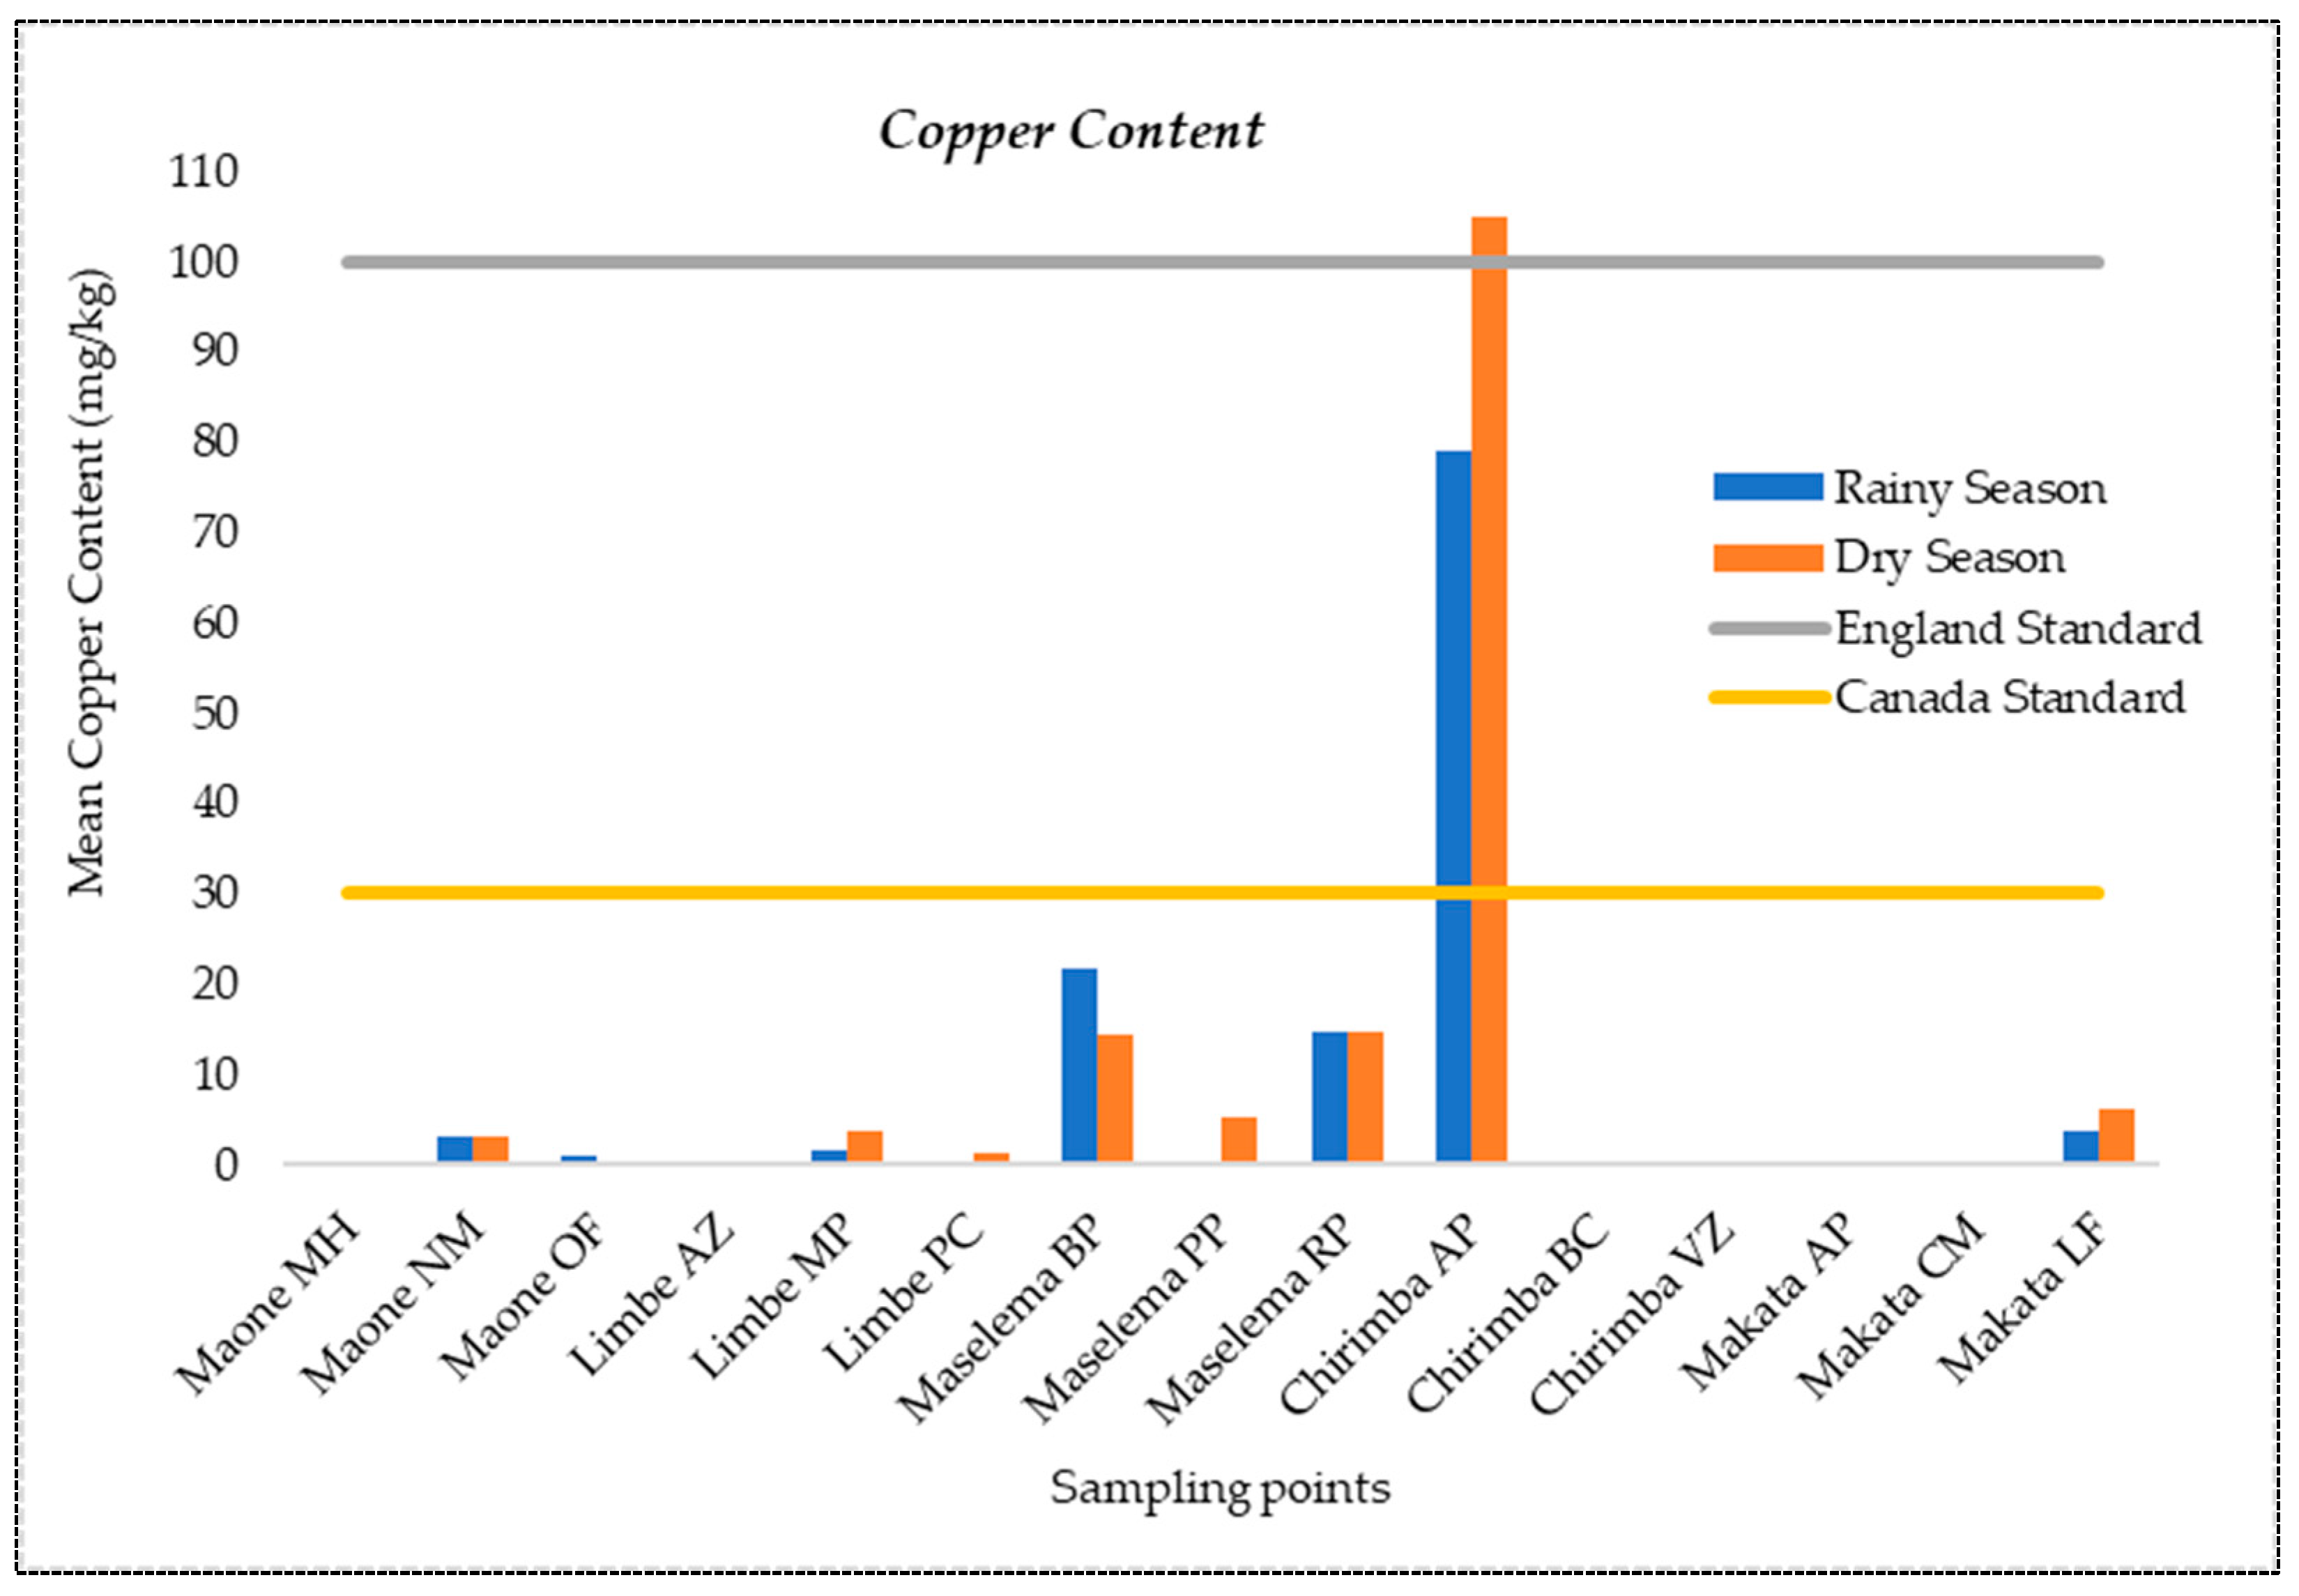
Observations of the soil show variations in Cu content levels between rainy and dry seasons. The content ranged from 0.001 to 79 mg/kg during the rainy season and 0.001 to 105 mg/kg during the dry season, respectively (Figure 2). The highest Cu contents were observed in soils from Chirimba AP, with content levels of 105 mg/kg during the dry season and 79 mg/kg during the rainy season. The content of copper was mostly below the England standard limit of 100 mg/kg but exceeded the Canadian standard of 30 mg/kg in some cases. Cu content levels in the studied areas were within acceptable limits according to England standards in 100% of rainy season samples and 93% of dry season samples but exceeded the Canadian standard in 7% of cases. It was also observed that all industrial sites had higher Cu content values compared to background content values.

3.1.2. Zinc Content Levels in Soil

Elevated Zn contents were observed in areas such as Limbe MP, Limbe PC, and Makata LF. In the rainy season, the range of Zn content in soils was 3.95–822 mg/kg, while, in the dry season, it was 0.263–579 mg/kg (Figure 3). The highest Zn contents were observed from soils taken from Chirimba AP and were 822 mg/kg for the rainy season and 579 mg/kg for dry seasons. The content of zinc was generally below the limit of the England standard of 300 mg/kg but higher than the Canadian standard of 60 mg/kg. In the rainy season, 93% of Zn values were below the England standard, and 40% of the values were below the Canadian standard. In the dry season, 87 and 13% of Zn content values were below the England and Canadian standards, respectively. All industrial sites had higher Zn content values compared to background content values.

3.1.3. Cadmium Content Levels in Soil

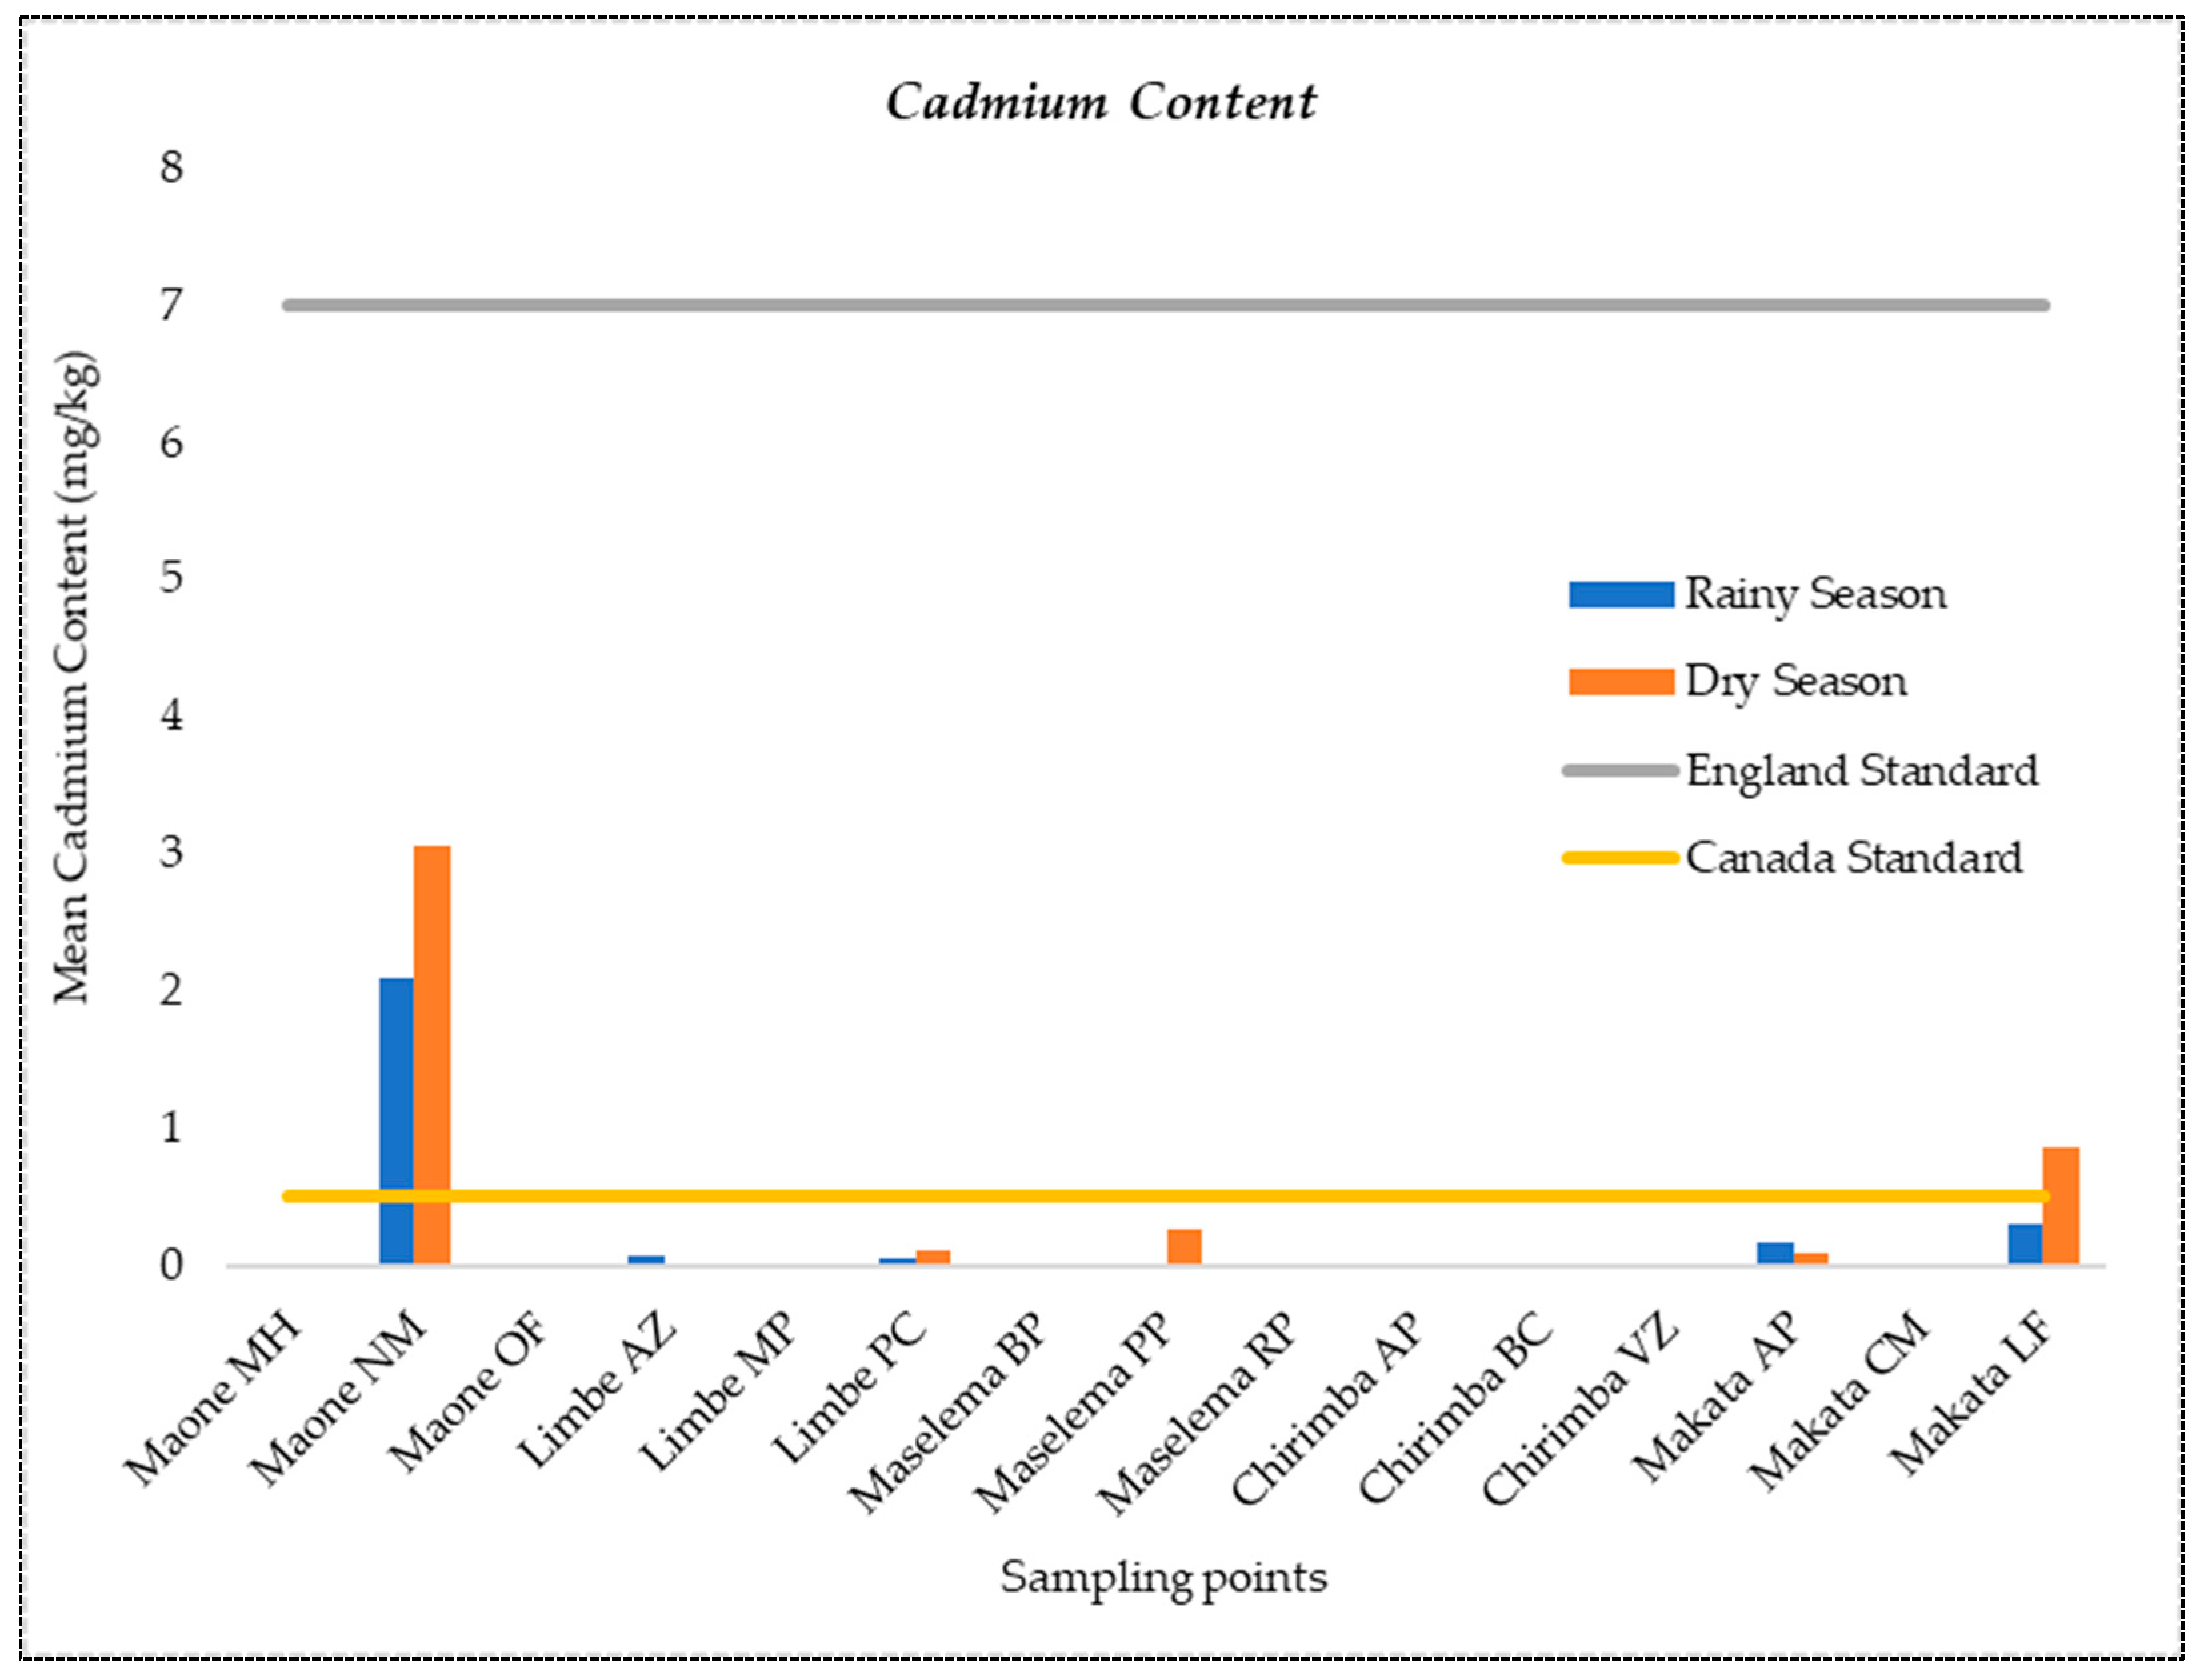
In the rainy season, the range of Cd content in soils ranged from below the detection limit (bdl) to 2.09 mg/kg, while, in the dry season, it ranged from bdl to 3.06 mg/kg (Figure 4). The highest Cd contents were observed from soils taken from Maone NM, which were 2.09 mg/kg and 3.06 mg/kg during the rainy season and dry season, respectively. Higher Cd contents observed in soils were detected from Makata LF, Makata AP, Maselema PP, and Limbe PC. The content of Cd was generally below the England standard of 7 mg/kg but higher than the Canadian standard of 0.5 mg/kg. In the rainy season, 100% of Cd values were within the England standard, while approximately 93% of the values were within the Canadian standard. Similarly, in the dry season, 100% of Cd values met the England standard, with approximately 93% meeting the Canadian standard. Except for Maone, the Cd content values were relatively lower as compared to the background content values.

3.2. Discussion on Content Levels of Heavy Metals

3.2.1. Copper Content Levels in Soil

The Cu contents recorded at Chirimba AP (105 mg/kg) were significantly higher than those reported by Saka and Ambali [36], who reported Cu levels of 10 mg/kg in riverbank soils. Similarly, Zhang et al. [37] found Cu content in sediments ranging between 30.9 and 44.3 mg/kg. The elevated Cu levels at Chirimba AP, particularly during the dry season, are likely due to its proximity to industrial sources known for copper. Their findings underscore the role of precipitation in mitigating heavy metal accumulation, with significant seasonal variations influenced by weather conditions. Although Cu levels varied between seasons, no significant difference was observed (p < 0.05) as shown in Table A1, suggesting consistent pollution sources year-round. The exceedance of the Canadian standard (30 mg/kg) at Chirimba AP highlights severe soil contamination linked to improper industrial and municipal waste disposal. Stricter waste management and remediation efforts are urgently needed to mitigate contamination and protect public health.

3.2.2. Zinc Content Levels in Soil

The highest Zn content at Chirimba AP, likely originating from surface run-off from metal processing industries (observed during motoring period), were significantly higher than those recorded by Kumar et al. [38], (31.78–461 mg/kg) in industrial soils of India, and by Orvestedt [39] (130–210 mg/kg) in Zomba City. These elevated levels highlight the impact of industrial activities on soil quality. While most Zn content complied with the England standard, many exceeded the Canadian standard, especially during the dry season, reflecting seasonal influences and reduced compliance in drier conditions. However, no significant differences in Zn content were observed between the rainy and dry seasons (p < 0.05) as shown in Table A1. These findings underscore the role of anthropogenic activities, such as metal processing and waste disposal, as key contributors to soil Zn pollution.

3.2.3. Cadmium Content Levels in Soil

The recorded Cd content, ranging from 4 to 10 mg/kg, align with Orvestedt [39], who reported similar levels in Zomba City soils, and Kumar et al. [38], who found a range of 0.15–34.9 mg/kg in industrial soils of India. The highest content, particularly from Maone NM, are likely attributed to surface run-off from metal processing industries (observed during the motoring period), consistent with findings by Ignatavičius et al. [40], who linked urban run-off to particle-bound pollutants, including heavy metals. Key sources of Cd pollution in industrial soils include waste disposal, coal combustion, steel production, vehicle emissions, and phosphate fertiliser use. Seasonal variations played a role, with consistently higher Cd levels during the dry season, although no significant differences were observed between seasons (p < 0.05). These results emphasise the influence of industrial activities and seasonal dynamics on soil Cd contamination.

3.3. Source Apportionment (Examination of Sources)

The PMF model with six factors demonstrated stability, as the difference between Qtrue and Qrobust was minimal. Scaled residual values for heavy metals ranged between 0.00001 and 0.00040 during the dry season and were 0.00003 during the rainy season, indicating that the parameters were normally distributed, as values falling between +3 and −3 are considered normal (Ahmed et al. [30]). This validates the reliability of the model and the accuracy of the factor analysis.
Using the PMF model, the signal-to-noise ratio (S/N) was applied to classify variables. Components with S/N ≤ 0.5 were eliminated as “bad”, those with 0.5 < S/N ≤ 1.0 were weighted as “weak”, and those with S/N > 1.0 were deemed “strong”, meeting the model’s calculation requirements (as per [41]). For the dry season, S/N ratios ranged from 1.769 to 7.319, and, during the rainy season, they varied between 2.290 and 5.123, confirming that zinc, copper, and cadmium exhibited strong signals, with zinc recording the highest content as shown in Table 2. This underscores the robustness of the PMF model in identifying key contributors to heavy metal distribution.
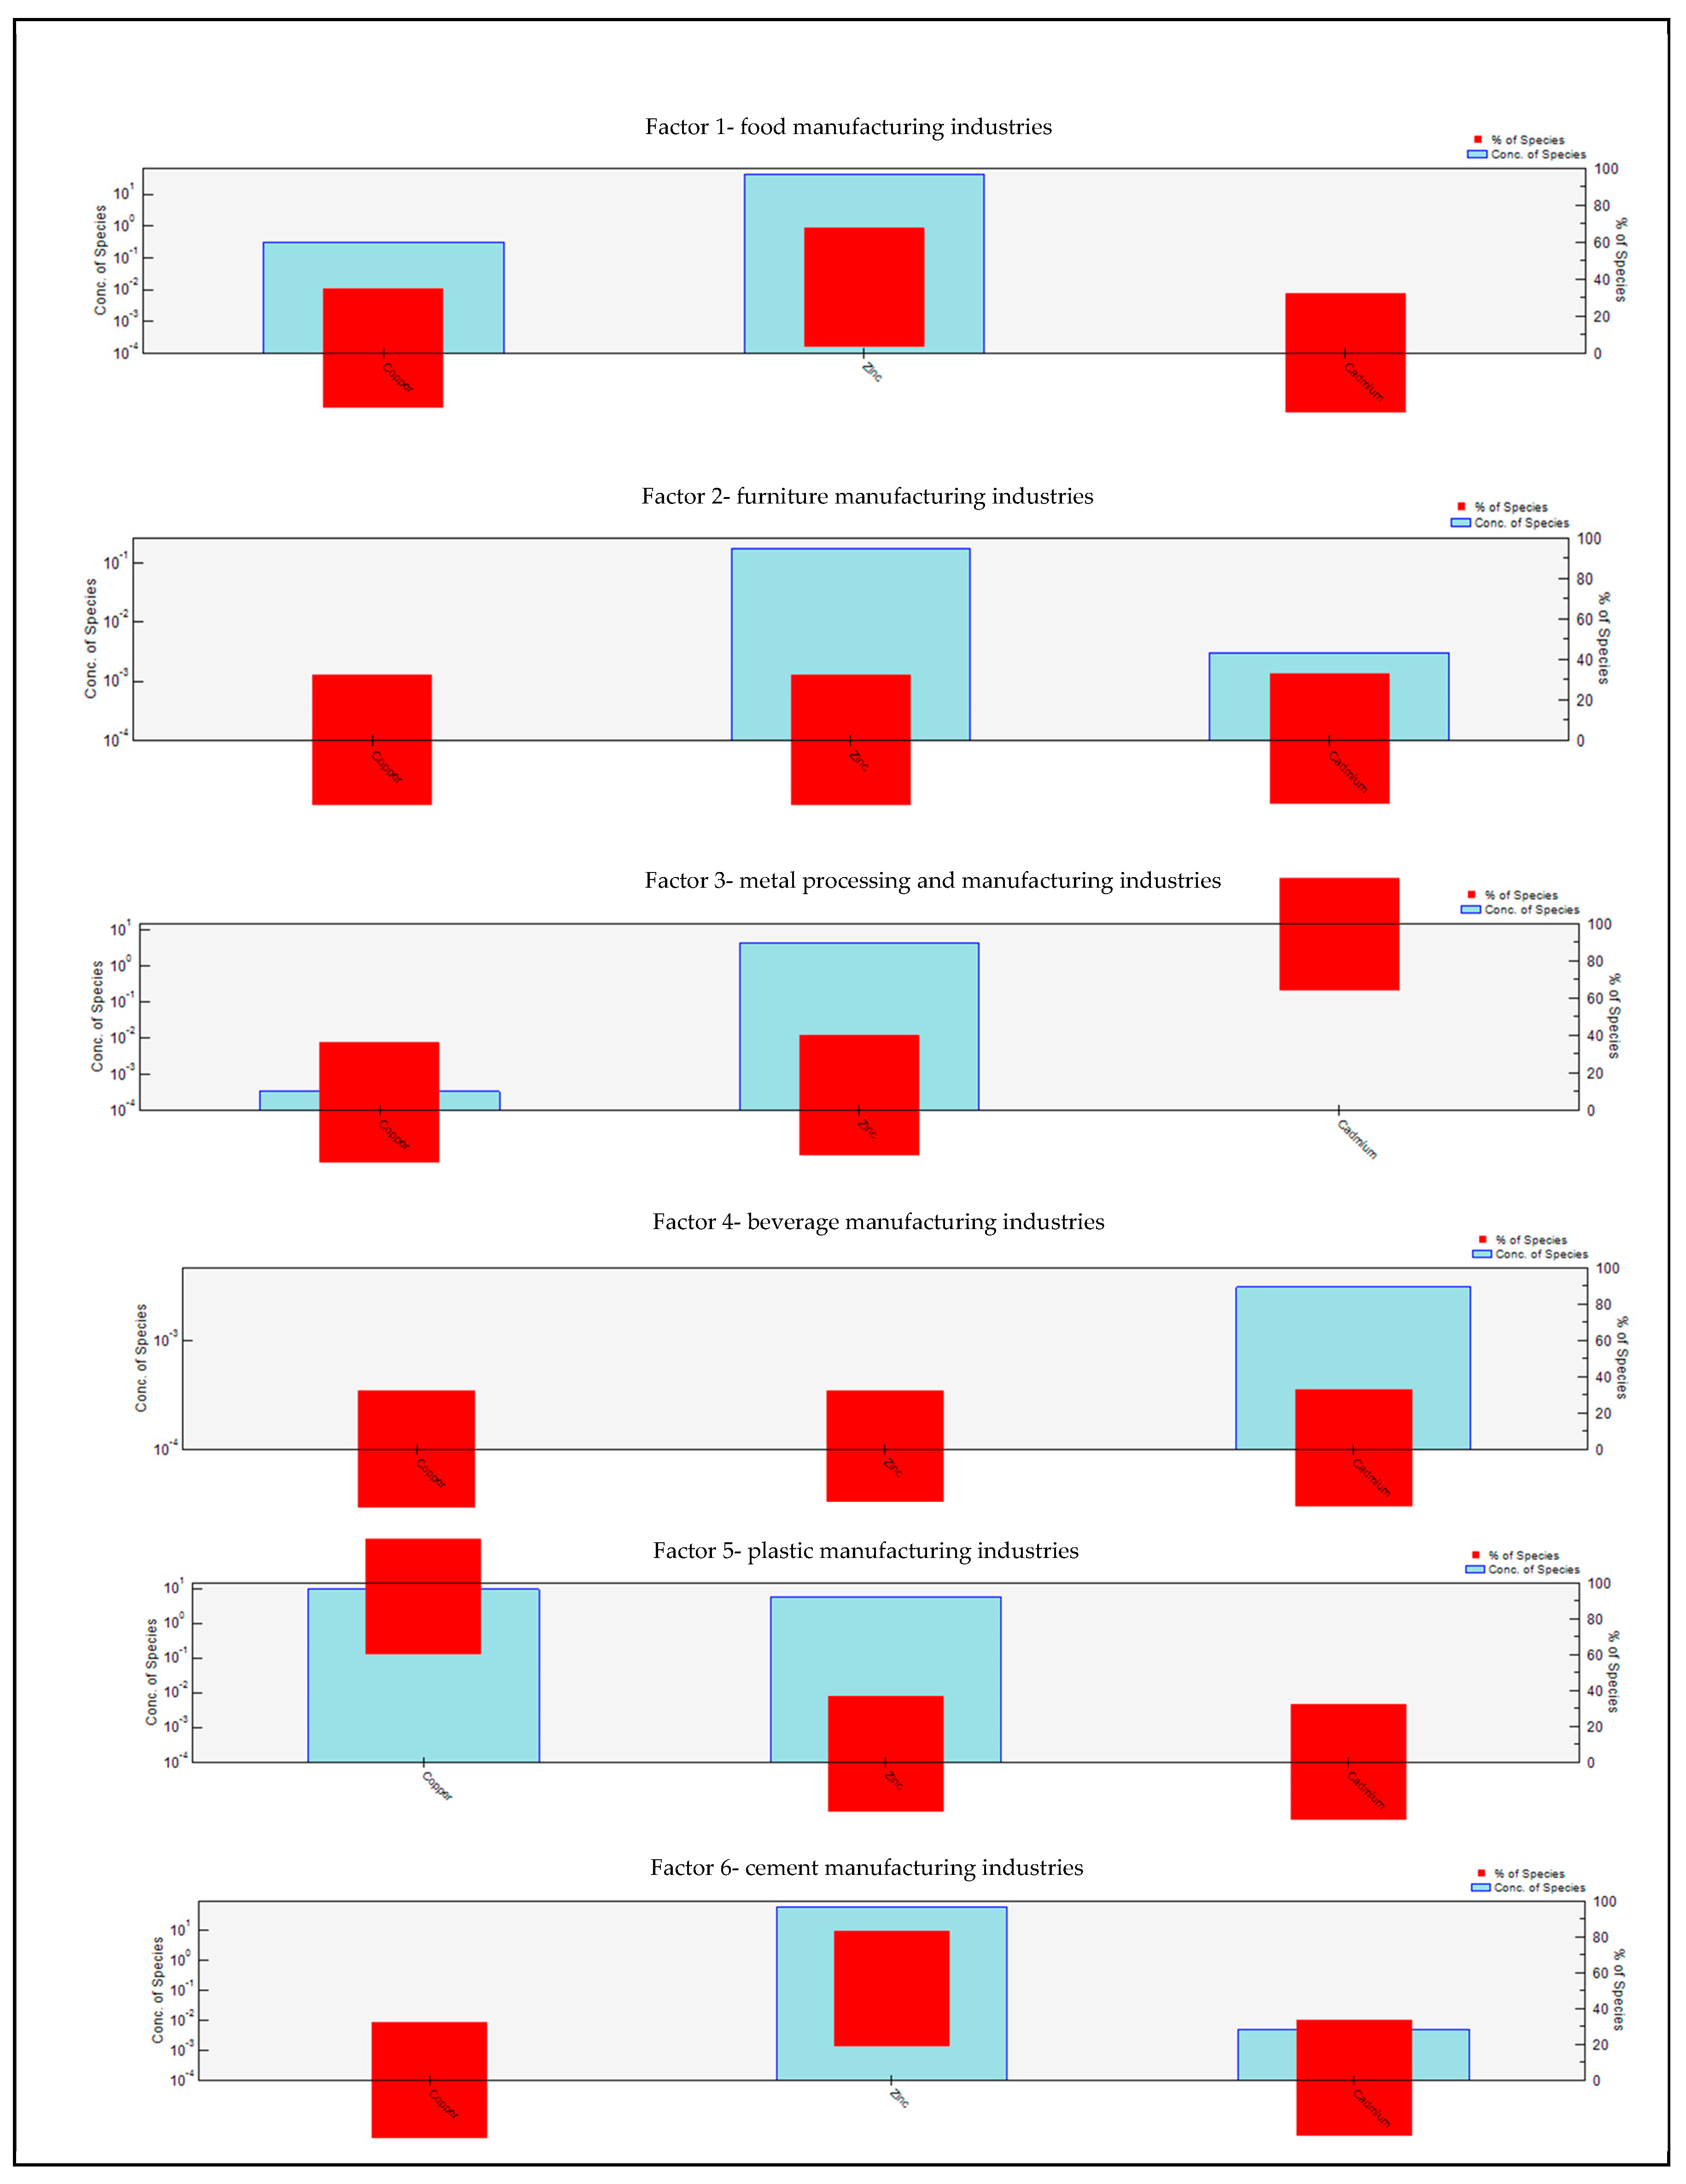
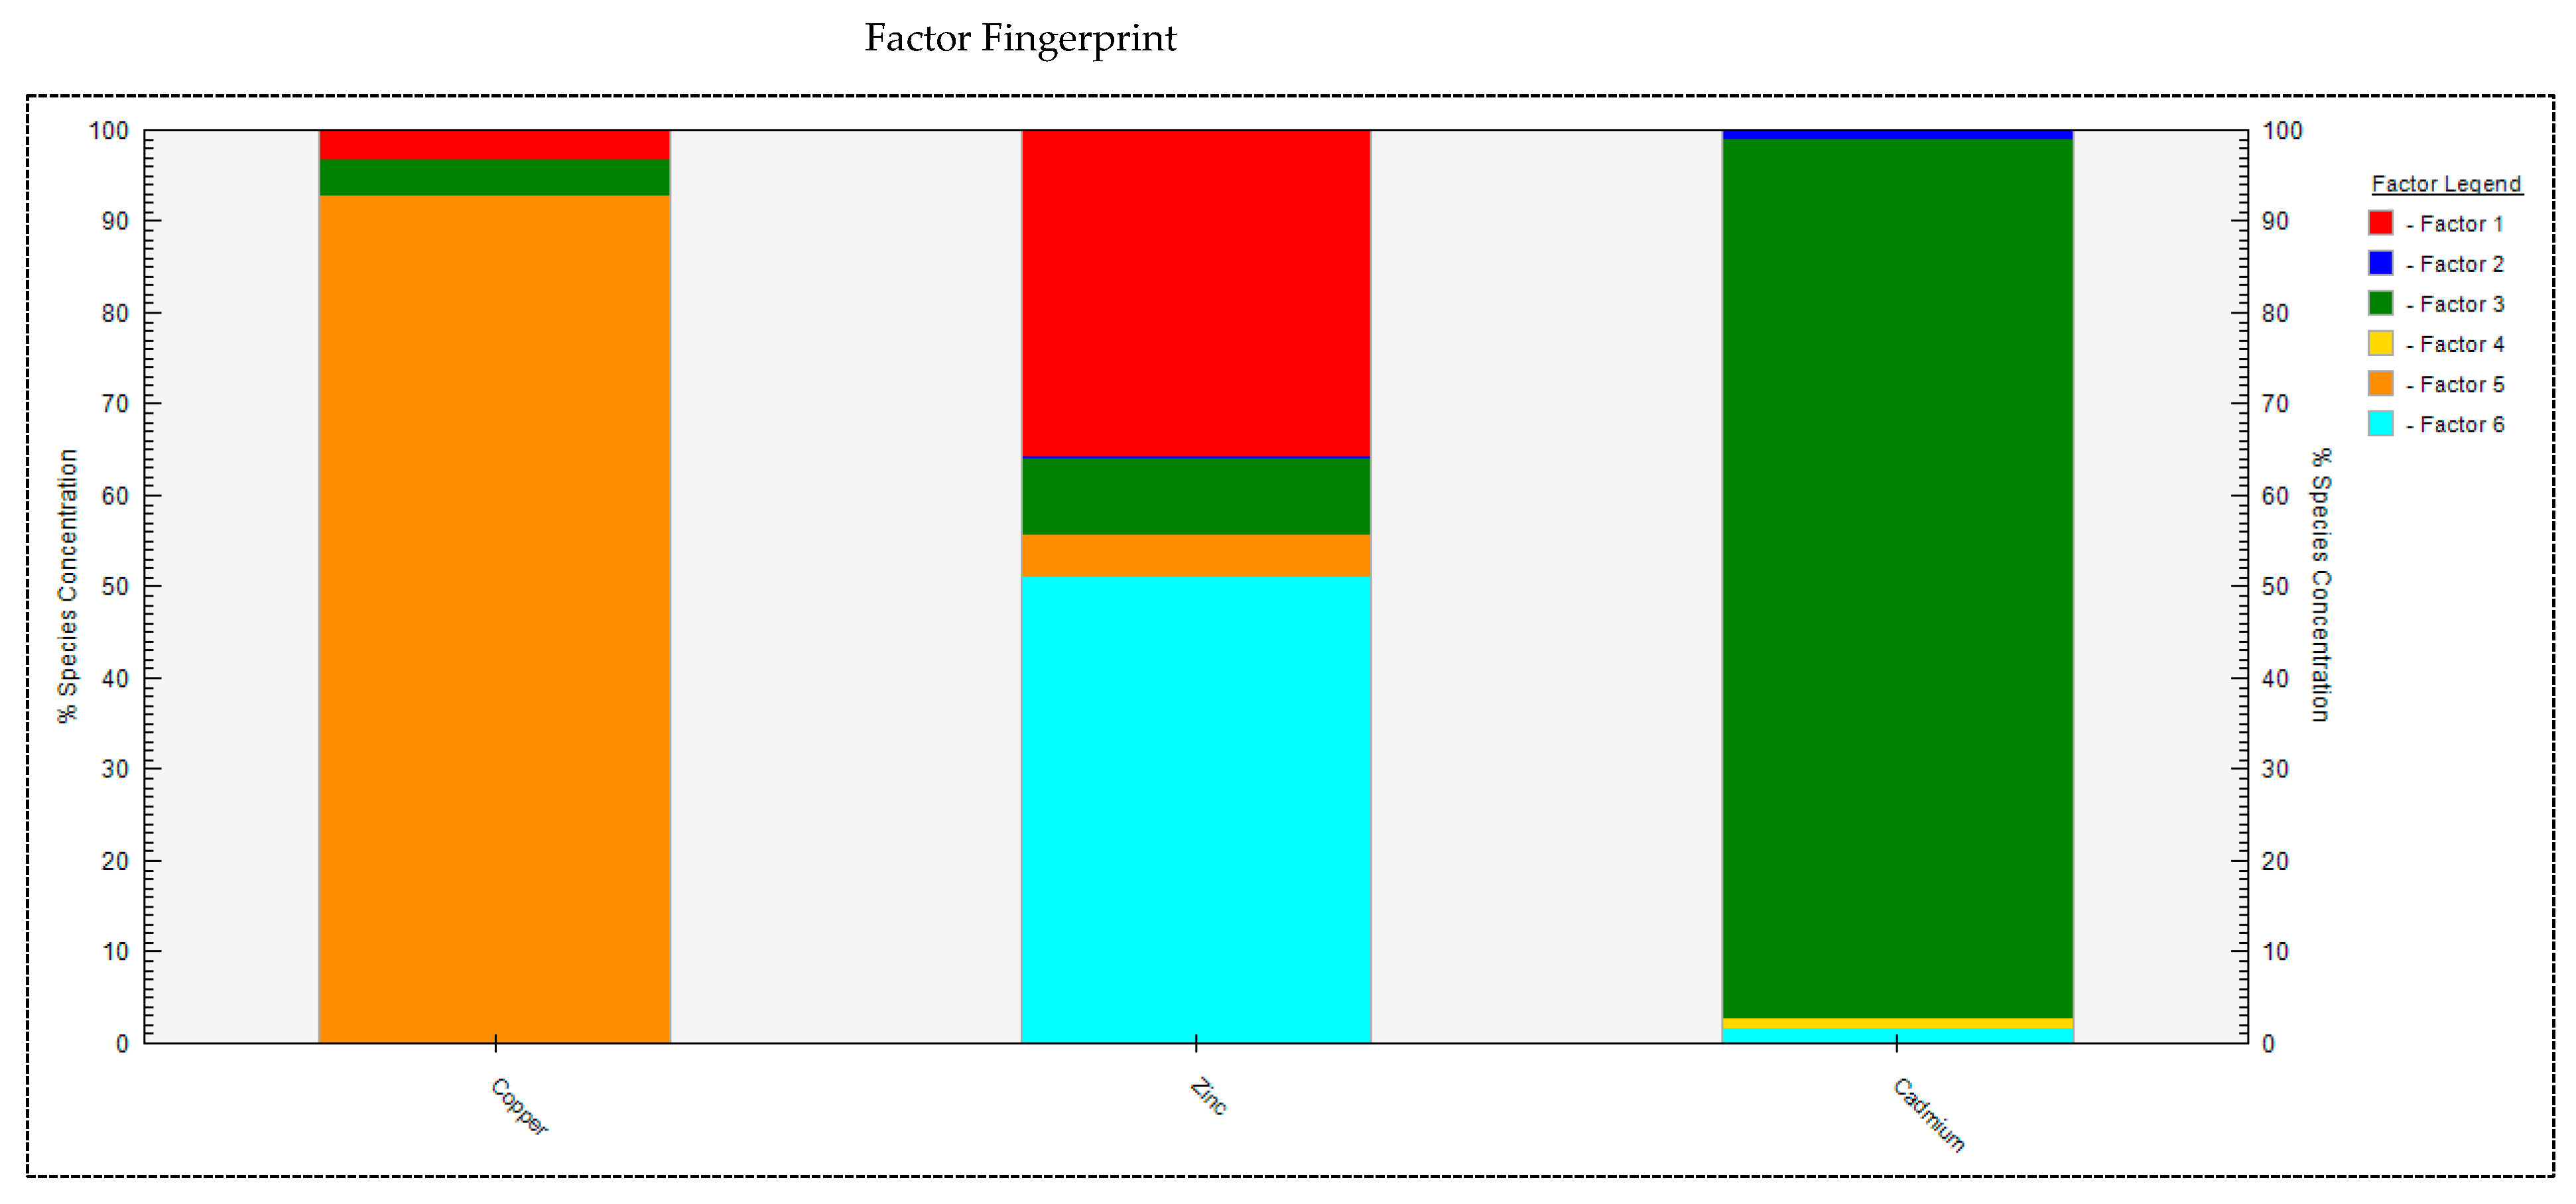
Figure 5, Figure 6, Figure 7 and Figure 8 highlight seasonal variations in the contributions of Zn and Cu to Factor 1, which is attributed to food manufacturing industries. During the rainy season, Zn and Cu contributed 52.9% and 6.3%, respectively, whereas, during the dry season, their contributions decreased to 35.8% and 3.1%. This decline suggests reduced industrial production during the dry season, leading to lower emissions of heavy metals. The seasonal reduction in Zn contributions from food manufacturing industries aligns with changes in production capacity and with lower contributions during periods of reduced activity. This indicates that industrial activity is a significant source of heavy metal pollution, as periods of lower production correlate with improved soil quality.
In Factor 2, the contribution of Cu and Zn during the rainy season was 40.3% and 2.8%, respectively. In contrast, during the dry season, the contributions of Cd and Zn were significantly lower, at 1.0% and 0.1%, respectively. These low percentages align with findings from Ali et al. [42], who suggested that the presence of Cd is often associated with corrosion-resistant plating processes in industrial settings. This observation is consistent with the types of industries present in the study area. The low percentage of Zn may be attributed to the galvanising industry, which is known for its effectiveness in corrosion resistance [43]. This suggests that Factor 2 is likely representative of furniture manufacturing industries, where electroplating processes are used, though they are not predominant. The substantial Cu contribution during the rainy season, at 40.3%, further supports this association, as it may be linked to atmospheric deposition and runoff, with no significant Cu contributions observed during the dry season.
During the rainy season in Factor 3, Cd and Zn provided 95.4% and 5.1% respective contributions. During the dry season in Factor 3, Cd, Zn, and Cu accounted for 96.2%, 8.3% and 4.1% respective contributions. Cd was dominant during both dry and rainy seasons with 96.2% and 95.4% contributions, respectively. Some of these heavy metals are usually used as alloy catalysts and additives, as well as raw materials for electroplating processes. Studies demonstrated that Cd among other elements often originated from various industrial activities, such as mining, the smelting of ores, coal usage, steel production and the processing of metal [44,45]. There were some metal material processing industries within the study area with high contents of Zn and Cd in the soil [43]. Factor 3 represents the metal processing and manufacturing industries. Cd contributions from metal processing and manufacturing industries increased slightly from the rainy to dry seasons from a 95.4% to 96.2% contribution to the total content of Zn, Cd, and Cu.
In Factor 4, during the rainy season, Cu, Zn, and Cd contributed 24.1%, 9.4%, and 1.2%, respectively. In the dry season, Cd contributed only 1.1%. Previous studies have suggested that Cd at lower content is primarily sourced from coal consumption in industrial processes [46]. In contrast, Cu contributions have been linked to the combustion of fuels in production processes, as demonstrated in research conducted in China [47]. The relatively low contribution of Cd (1.1%) in the dry season aligns with the types of industries observed in the study area. Therefore, Factor 4 likely represents the activities of beverage manufacturing industries, where such low levels of Cd are expected.
During the rainy season in Factor 5, Zn, Cd and Cu provided 14.2%, 1.4%, and 0.9% respective contributions. During the dry season in Factor 5, Cu and Zn provided 92.8% and 4.6% respective contributions. As Cu is used in plastic pipe manufacturing among other uses [48], their enhancement in the environment is apparent [49]. Furthermore, Researchers also stated the contribution of Cu in building material industries, of which some are plastic [50]. These activities release great proportions of industrial waste and dust containing heavy metals, mostly Cu, which lead to soil pollution. Therefore, Factor 5 is the plastic manufacturing industries. The Cu contribution from plastic manufacturing industries increased from the rainy to dry season from 0.9% to 92.8% contribution to the total c content of Zn, Cd and Cu.
In Factor 6, during the rainy season, Cu, Zn, and Cd contributed 28%, 15.6%, and 2.0%, respectively. During the dry season, Zn and Cd contributed 51.1% and 1.7%, respectively. Zinc is often associated with cement production processes, where it can be deposited in the surrounding environment [43,51]. Additionally, studies have shown that industrial plants, particularly those involved in chemical production, can release Zn into the soil [52]. In the case of cement production, research from China indicates that a significant portion of the industry uses vertical kilns, and the dust collection systems in cement kilns may not always meet proper standards, leading to the discharge of Zn and Cd in the form of dust into the environment [53]. Therefore, Factor 6 is likely linked to cement manufacturing industries.
Overall, the findings indicate that metal processing and manufacturing industries are major contributors to cadmium levels in the soil around industrial sites during both the rainy and dry seasons. This highlights the need for targeted mitigation measures to address cadmium contamination in these areas. Similarly, plastic manufacturing industries are the primary source of copper in the soil during the dry season, suggesting that mitigation efforts should focus on these industries as well. Zinc levels are most significantly impacted by food manufacturing industries during both seasons, making these sites a key target for mitigation strategies. Additionally, cement manufacturing industries contribute notably to zinc levels, particularly in the dry season, and should also be considered in the development of appropriate environmental management practises.

3.4. Pollution Risk Assessment of Heavy Metals in Soil

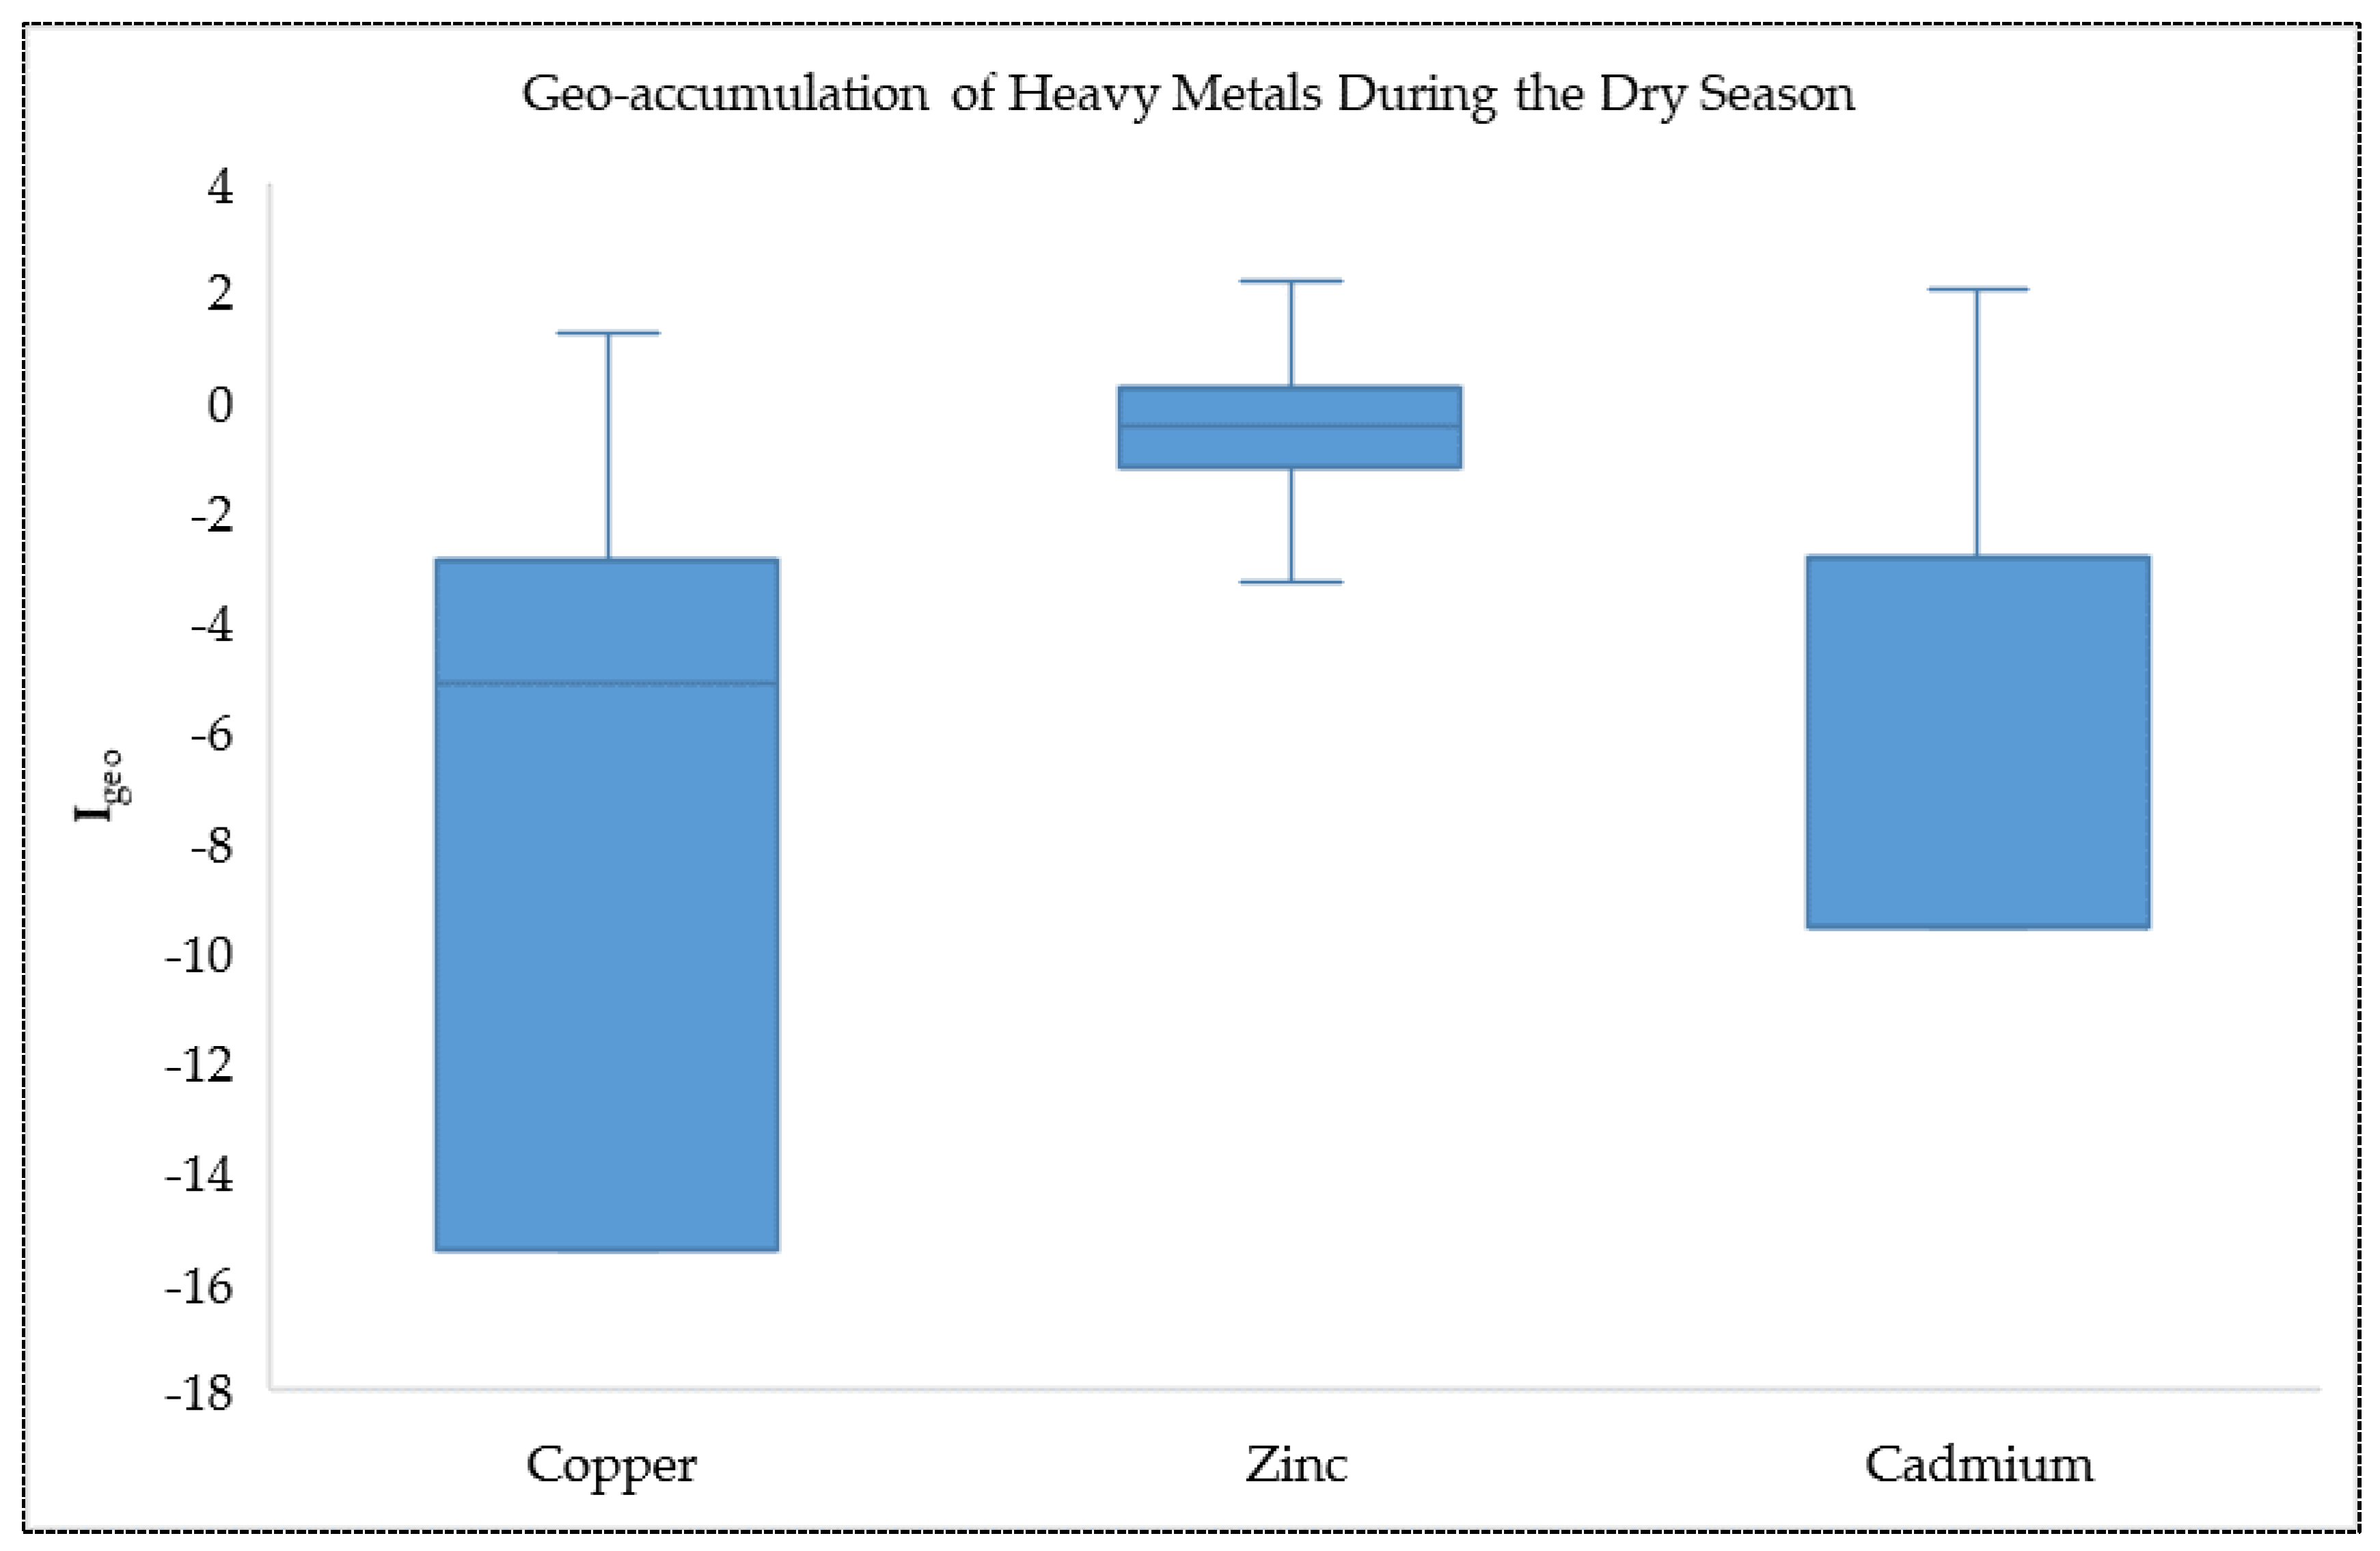
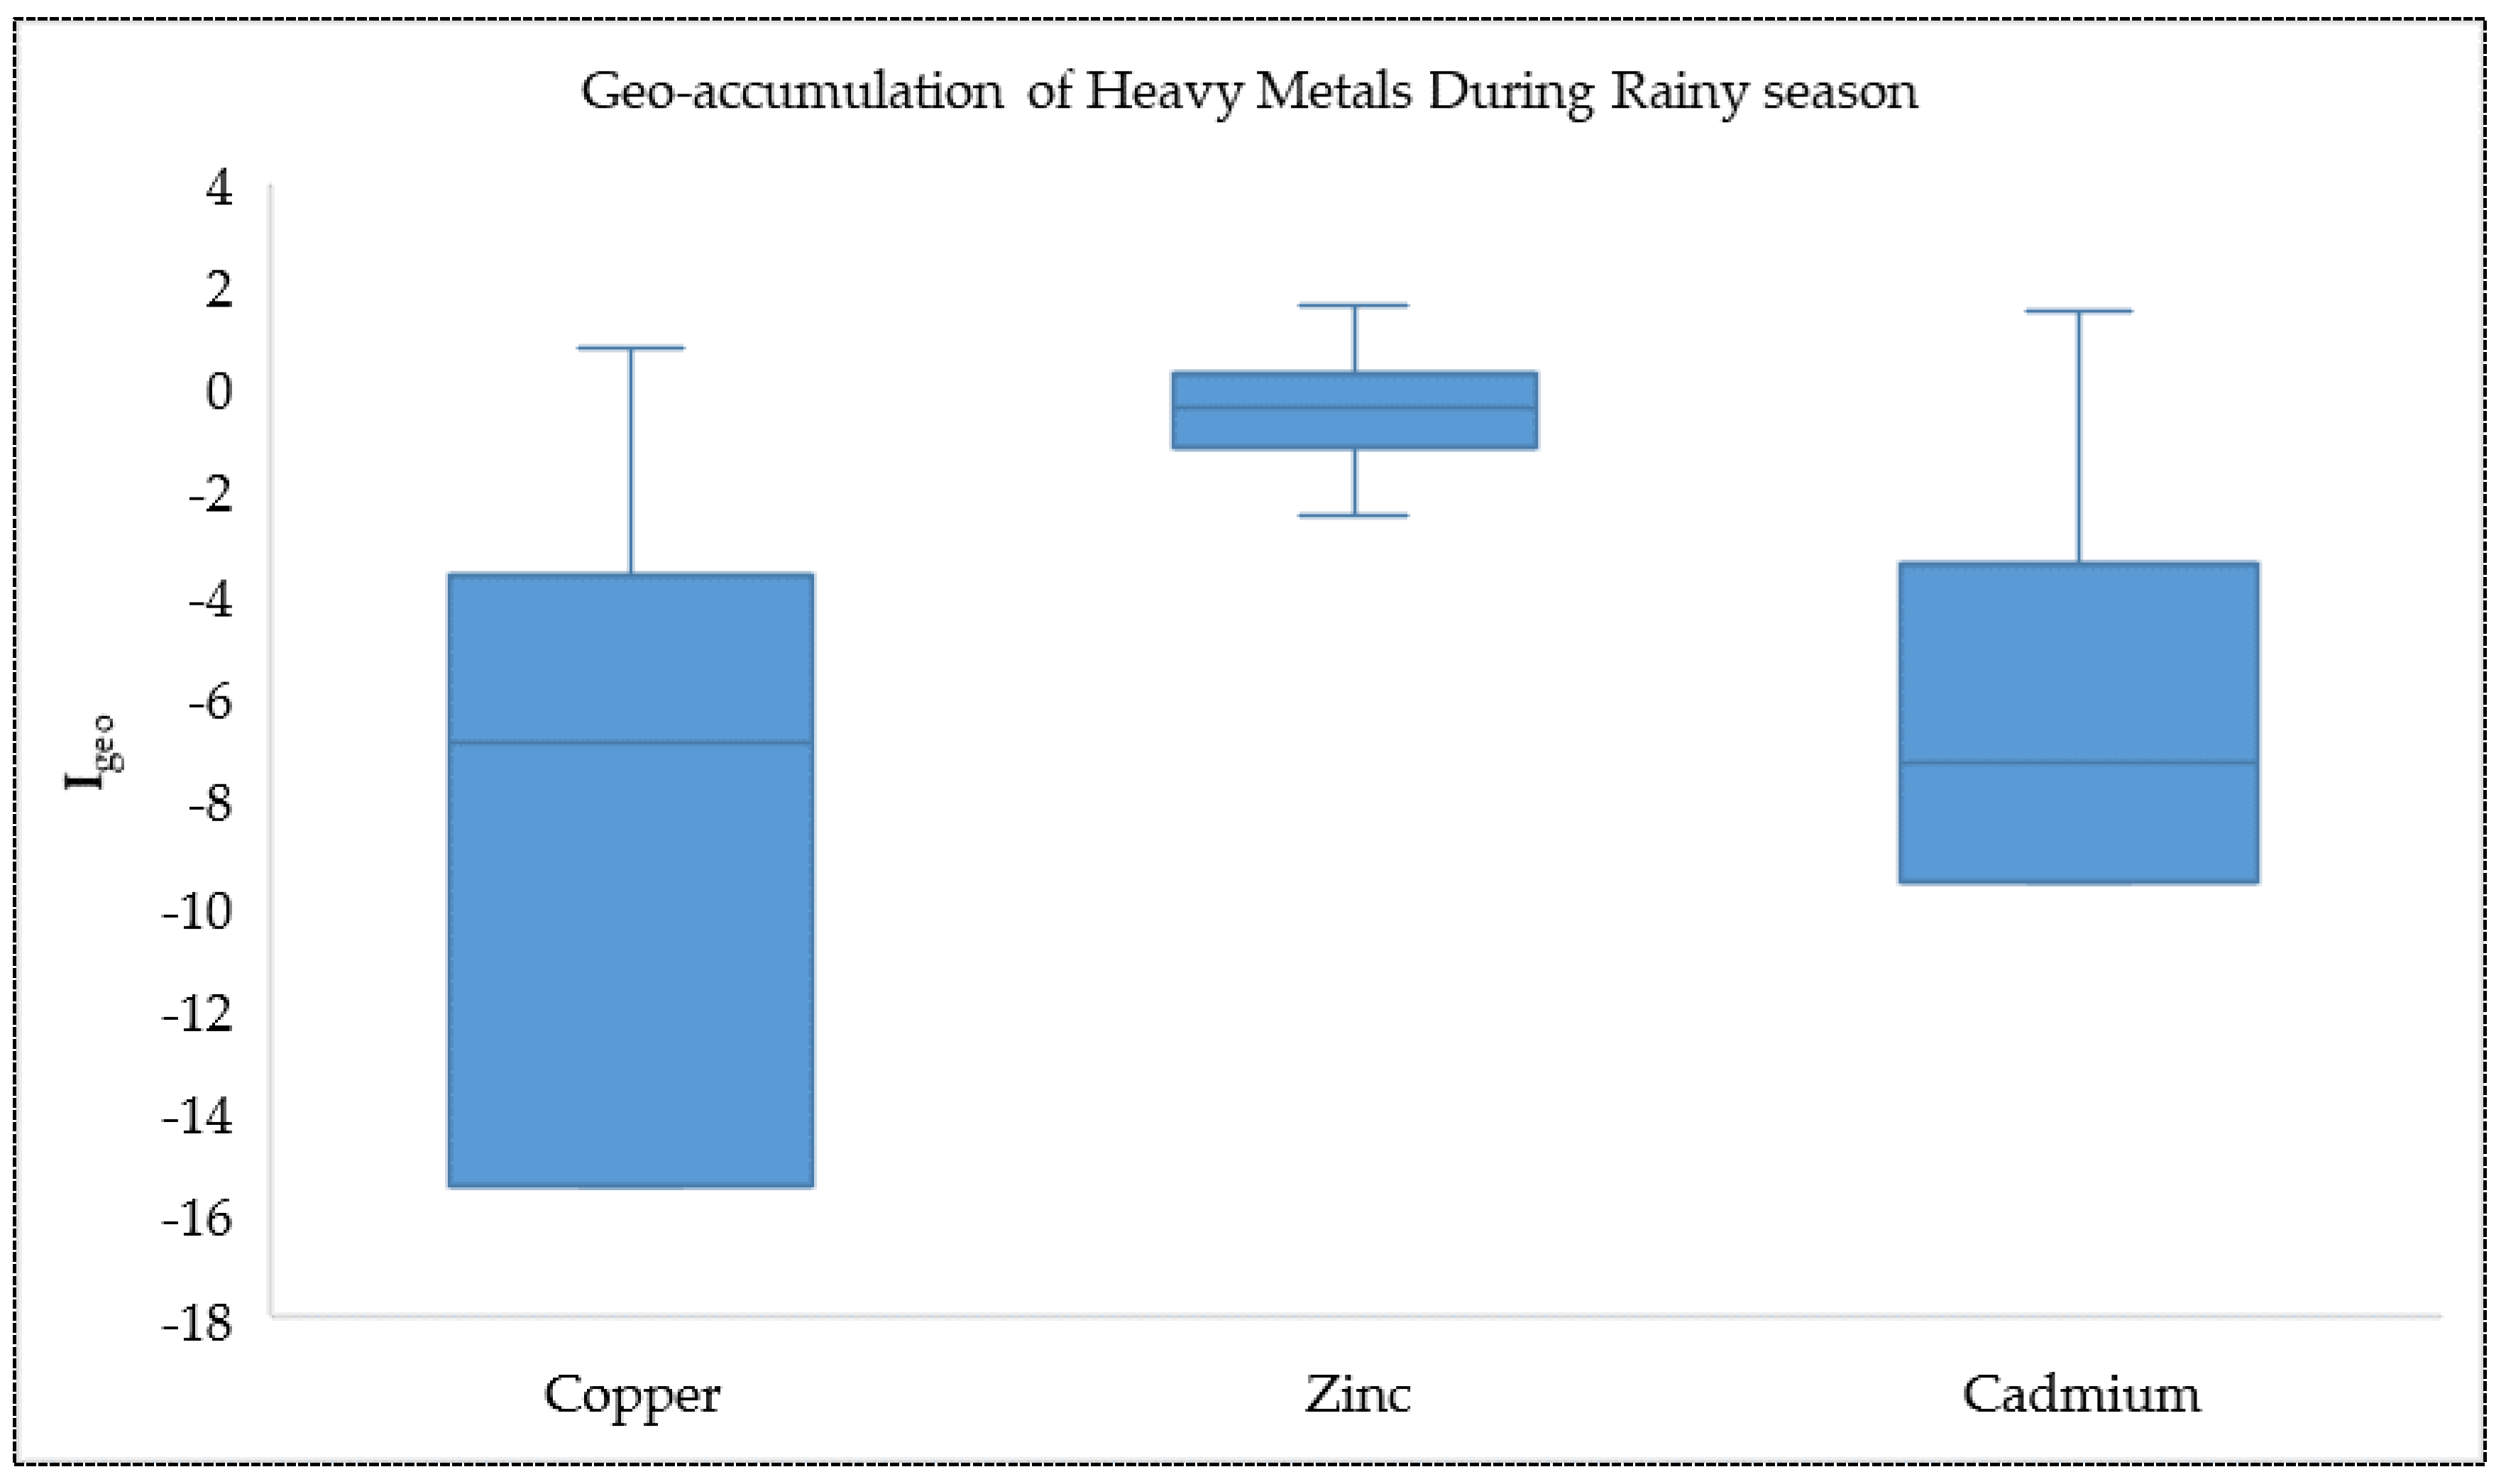
Based on the results of Igeo (Figure 9 and Figure 10) and the level of geo-accumulation index from Table 3 below, during the rainy season, most of the sampling sites were not contaminated by Cd, Cu, and Zn. The contamination of Zn was much higher than the other heavy metals with its highest Igeo value at 3.19 (observed at Chirimba AP industrial site), indicating a “highly contaminated” Igeo Class. Copper was in the “not contaminated-moderately contaminated” Igeo Class as its Igeo value was 0.81 (also observed at Chirimba AP industrial site). During the dry season, also bearing in mind the Igeo results, most of the sampling sites were not contaminated by Cd, Cu, and Zn but varied from “not contaminated” to “highly contaminated” Igeo values. It is worth noting that the contamination of heavy metals was at their highest at some sites with Igeo values of 2.18 (observed at Makata LF industrial site) and 2.69 (detected at Chirimba AP industrial site) for Zn as well as 2.03 (detected at the Maone NM industrial site) for Cd. This therefore shows that zinc was the main contaminant as it was prominent in both seasons, thus presenting a high pollution and ecological risk. This means that the release of heavy metals to the environment through the manufacturing processes is the prominent factor causing the fluctuating levels of these elements in the soil.

4. Conclusions

This current study covered the determination of content levels of heavy metals (cadmium, zinc, and copper) from sites in industrial areas (Makata, Limbe, Maselema, Chirimba and Maone). This study found that the content of heavy metals in soil were 87% below the England standards except for those from two sites, namely, Chirimba AP and Makata LF. In terms of the Canada standards, heavy metals in soil were 27% below the maximum permissible levels and these were from Maone MH, Chirimba VZ, Makata AP and Makata CM sites. These values were attributed to atmospheric deposition and surface run-off from metal processing industries. Additionally, it was observed that the overall pattern indicated a higher distribution of elevated heavy metal values in soil samples, with 20% recorded during the dry season and 7% during the rainy season. The reason for this is due to decreased levels of dilution in soil during the dry season since there is a lack of precipitation. Even though the heavy metal values are generally low, they could pose a threat in the future due to their ability to bio-accumulate.
The analysis results of the Positive Matrix Factorisation (PMF) model indicated that there were six main factors affecting the accumulation of heavy metals, namely, (1) metal processing and manufacturing industries, (2) plastic manufacturing industries (3) cement manufacturing industries, (4) food manufacturing industries, (5) beverage manufacturing industries, and (6) furniture manufacturing industries. The geo-accumulation index was employed to assess the pollution risks of heavy metals in soil. It was observed that soil was highly contaminated with Zn during both rainy and dry seasons at some sites. Cd was also detected as one of the highly contaminated heavy metals at Maone NM, posing a risk. Future assessments need to be performed to include other parameters such as Chromium (Cr), Lead (Pb) and Iron (Fe), which are also important since they may be of concern to the health of people but were not included due to time and financial limitations.

Author Contributions

C.C.U.: conceptualisation, sampling, laboratory work, and writing; C.C.K., F.G.D.T. and I.B.M.K.: conceptualisation, supervising, reviewing, and writing; P.C. and S.J.: reviewing and writing. All authors have read and agreed to the published version of the manuscript.

Funding

This research received no external funding.

Institutional Review Board Statement

This study was conducted in accordance with the ethical and regulatory requirements and approved by the National Commission for Science and Technology (NCST) for the risk assessment aspect of this study.

Informed Consent Statement

Not applicable.

Data Availability Statement

Data are available from the corresponding author upon request.

Acknowledgments

Environmental Solutions, Malawi Bureau of Standards, MUBAS, and Steve Afuleni should receive our gratitude for providing the sampling and analysis equipment. We are grateful to Enock Simumba and Lezzie Chirambo for providing support during the sampling exercises and statistical analysis, respectively.

Conflicts of Interest

The authors declare no conflicts of interest.

Appendix A

Table A1. Statistical analysis (seasonal variations using paired t test).
Mean DifferenceConfidence IntervaltdfStderrp-Value (α = 0.05)
Variable Lower Upper
Copper−1.862−12.4448.72006−0.355445.2506620.7246
Zinc10.860−72.03793.7560.264014441.1320.793
Cadmium−0.115−0.223−0.007−2.147440.0540.03739

References

  1. Thulu, F.G.D.; Tembo, D.; Nyirongo, R.; Mzaza, P.J.C.; Kamfosi, A.; Mawenda, U.C. Electromagnetic Frequency Pollution in Malawi: A Case of Electric Field and Magnetic Flux Density Pollution in Southern Africa. Int. J. Environ. Res. Public Health 2023, 20, 4413. [Google Scholar] [CrossRef] [PubMed]
  2. Prabhu, D.S.M. Environmental pollution analysis in developing countries. Int. J. Stat. Appl. Math. 2022, 7, 134–138. [Google Scholar] [CrossRef]
  3. Manojkumar, N.; Basha, K.; Srimuruganandam, B. Assessment, Prediction and Mapping of Noise Levels in Vellore City, India. Noise Mapp. 2019, 6, 38–51. [Google Scholar] [CrossRef]
  4. Assanov, D.; Zapasnyi, V.; Kerimray, A. Air quality and industrial emissions in the cities of Kazakhstan. Atmosphere 2021, 12, 314. [Google Scholar] [CrossRef]
  5. Hsu, C.Y.; Chi, K.H.; Wu, C.-D.; Lin, S.L.; Hsu, W.C.; Tseng, C.C.; Chen, M.J.; Chen, Y.C. Integrated analysis of source-specific risks for PM2.5-bound metals in urban, suburban, rural, and industrial areas. Environ. Pollut. 2021, 275, 116652. [Google Scholar] [CrossRef]
  6. Malikula, R.S.; Kaonga, C.C.; Mapoma, H.W.T.; Chiipa, P.; Thulu, F.G.D. Heavy Metals and Nutrients Loads in Water, Soil, and Crops Irrigated with Effluent from WWTPs in Blantyre City, Malawi. Water 2022, 14, 121. [Google Scholar] [CrossRef]
  7. Masindi, V.; Muedi, K.L. Environmental contamination by heavy metals. Heavy Met. 2018, 10, 115–133. [Google Scholar]
  8. Eijsackers, H.; Reinecke, A.; Reinecke, S.; Maboeta, M. Heavy metal threats to plants and soil life in Southern Africa: Present knowledge and consequences for ecological risk assessment. Rev. Environ. Contam. Toxicol. 2020, 249, 29–70. [Google Scholar] [CrossRef]
  9. Łyszczarz, S.; Błońska, E.; Lasota, J. The application of the geo-accumulation index and geostatistical methods to the assessment of forest soil contamination with heavy metals in the Babia Góra National Park (Poland). Arch. Environ. Prot. 2020, 46, 69–79. [Google Scholar] [CrossRef]
  10. Olatunde, K.A.; Sosanya, P.A.; Bada, B.S.; Ojekunle, Z.O.; Abdussalaam, S.A. Distribution and ecological risk assessment of heavy metals in soils around a major cement factory, Ibese, Nigeria. Sci. Afr. 2020, 9, e00496. [Google Scholar] [CrossRef]
  11. Muller, G. Heavy metals in the sediment of the Rhine-Changes seity. Umsch. Wiss. Tech. 1979, 79, 778–783. [Google Scholar]
  12. Gayathri, S.; Krishnan, K.A.; Krishnakumar, A.; Maya, T.V.; Dev, V.V.; Antony, S.; Arun, V. Monitoring of heavy metal contamination in Netravati river basin: Overview of pollution indices and risk assessment. Sustain. Water Resour. Manag. 2021, 7, 20. [Google Scholar] [CrossRef]
  13. Yang, Y.; Christakos, G.; Guo, M.; Xiao, L.; Huang, W. Space-time quantitative source apportionment of soil heavy metal concentration increments. Environ. Pollut. 2017, 223, 560–566. [Google Scholar] [CrossRef]
  14. Kuerban, M.; Maihemuti, B.; Waili, Y.; Tuerhong, T. Ecological risk assessment and source identification of heavy metal pollution in vegetable bases of Urumqi, China, using the positive matrix factorization (PMF) method. PLoS ONE 2020, 15, e0230191. [Google Scholar] [CrossRef]
  15. Wang, Y.; Guo, G.; Zhang, D.; Lei, M. An integrated method for source apportionment of heavy metal(loid)s in agricultural soils and model uncertainty analysis. Environ. Pollut. 2021, 276, 116666. [Google Scholar] [CrossRef]
  16. USEPA. EPA Positive Matrix Factorization (PMF) 5.0 Fundamentals and User Guide; Norris, G., Ed.; Steve Brown, Song Bai Sonoma Technology, Inc.: Petaluma, CA, USA, 2014; p. 94954.
  17. Huang, J.; Wu, Y.; Sun, J.; Li, X.; Geng, X.; Zhao, M.; Fan, Z. Health risk assessment of heavy metal (loid) s in park soils of the largest megacity in China by using Monte Carlo simulation coupled with Positive matrix factorization model. J. Hazard. Mater. 2021, 415, 125629. [Google Scholar] [CrossRef]
  18. Thulu, F.; Kaonga, C.; Kosamu, I.; Nyirongo, R. Longitudinal Analysis of Annual PM2.5 Concentration Variations in Blantyre City, Malawi. Clean Air J. 2024, 34, 1. [Google Scholar] [CrossRef]
  19. Anyanwu, B.O.; Ezejiofor, A.N.; Igweze, Z.N.; Orisakwe, O.E. Heavy metal mixture exposure and effects in developing nations: An update. Toxics 2018, 6, 65. [Google Scholar] [CrossRef]
  20. Commonwealth Network. Available online: http://www.commonwealthofnations.org/sectorsmalawi/business/industry_and_manufacturing/ (accessed on 14 January 2024).
  21. Kaonga, C.C.; Kosamu, I.; Lakudzala, D.D.; Mbewe, R.; Thole, B.; Morris, M.; Russel, C.G.C.; Stephen, K.; Samson, M.I.S. A review of heavy metals in soil and aquatic systems of urban and semi-urban areas in Malawi with comparisons to other selected countries. Afr. J. Environ. Sci. Technol. 2017, 11, 448–460. [Google Scholar] [CrossRef]
  22. Sajidu, S.M.I.; Masamba, W.R.L.; Henry, E.M.T.; Kuyeli, S.M. Water quality assessment in streams and wastewater treatment plants of Blantyre, Malawi. Phys. Chem. Earth 2007, 32, 1391–1398. [Google Scholar] [CrossRef]
  23. Chikabvumbwa, R.; Malairajan, S.; Chisale, S. Impacts of Urbanization on Seasonal Water Quality Dynamics in Mudi River in Blantyre District, Malawi. Int. Res. J. Sci. Technol. 2021, 2, 398–405. [Google Scholar] [CrossRef]
  24. Kaonga, C.; Monjerezi, M. Periphyton and Earthworms as Biological Indicators of Metal Pollution in Streams of Blantyre City, Malawi. In Water Pollution; IntechOpen: London, UK, 2012; pp. 1–22. [Google Scholar] [CrossRef]
  25. National Statistical Office. Malawi Population and Housing Census Report; Issue May. 2019. Available online: https://malawi.unfpa.org/sites/default/files/resource-pdf/2018%20Malawi%20Population%20and%20Housing%20Census%20Main%20Report%20%281%29.pdf (accessed on 19 January 2024).
  26. Utsale, C.C.; Kaonga, C.C.; Thulu, F.G.D.; Kosamu, I.B.M.; Thomson, F.; Chitete-Mawenda, U.; Sakugawa, H. Source Apportionment of Air Quality Parameters and Noise Levels in the Industrial Zones of Blantyre City. Air 2024, 2, 122–141. [Google Scholar] [CrossRef]
  27. Larasari, H.A.; Soekirno, S.; Simanullang, R. Measurement and analysis of air quality impacts caused by CO and NO2 on Margonda Raya street Depok. J. Phys. Conf. Ser. 2020, 1528, 012046. [Google Scholar] [CrossRef]
  28. Alam, A.; Chaudhry, M.N.; Mahmood, A.; Ahmad, S.R.; Butt, T.E. Development & application of Conceptual Framework Model (CFM) for environmental risk assessment of contaminated lands. Saudi J. Biol. Sci. 2021, 28, 6167–6177. [Google Scholar] [CrossRef] [PubMed]
  29. Ahmed, M.; Matsumoto, M.; Ozaki, A.; Van Thinh, N.; Kurosawa, K. Heavy metal contamination of irrigation water, soil, and vegetables and the difference between dry and wet seasons near a multi-industry zone in Bangladesh. Water 2019, 11, 583. [Google Scholar] [CrossRef]
  30. APHA. APHA. APHA Standard Methods. In Standard Methods for the Examination of Water and Wastewater, 23rd ed.; Rodger, B., Andrew, E., Eugene, R., Eds.; American Public Health Association: Washington, DC, USA, 2017. [Google Scholar]
  31. Integrated Development for R. RStudio, Inc. Available online: http://www.rstudio.com (accessed on 14 January 2024).
  32. Guan, Q.; Wang, L.; Wang, F.; Pan, B.; Song, N.; Li, F.; Lu, M. Phosphorus in the catchment of high sediment load river: A case of the Yellow River, China. Sci. Total Environ. 2016, 572, 660–670. [Google Scholar] [CrossRef]
  33. Kowalska, J.B.; Mazurek, R.; Gąsiorek, M.; Zaleski, T. Pollution indices as useful tools for the comprehensive evaluation of the degree of soil contamination–A review. Environ. Geochem. Health 2018, 40, 2395–2420. [Google Scholar] [CrossRef]
  34. Bohn, H.L.; McNeal, B.L.; O’Connor, G.A. Soil Chemistry; John Wiley and Sons: New York, NY, USA, 1979. [Google Scholar]
  35. Alloway, B.J.; Ayres, D.C. Chemical Principles of Environmental Pollution, 2nd ed.; Blackie Academic & Professional: London, UK, 1997. [Google Scholar]
  36. Saka, J.D.K.; Ambali, A.J.D. A biochemical study of pollution in the middle and lower Shire River, Malawi. Malawi J. Sci. Technol. 1999, 5, 63–73. [Google Scholar]
  37. Zhang, M.; Sun, X.; Xu, J. Heavy metal pollution in the East China Sea: A review. Mar. Pollut. Bull. 2020, 159, 111473. [Google Scholar] [CrossRef]
  38. Kumar, V.; Sharma, A.; Kaur, P.; Singh Sidhu, G.P.; Bali, A.S.; Bhardwaj, R.; Thukral, A.K.; Cerda, A. Pollution assessment of heavy metals in soils of India and ecological risk assessment: A state-of-the-art. Chemosphere 2018, 216, 449–462. [Google Scholar] [CrossRef]
  39. Orvestedt, S. Waste Management and Impact on People’s Health When Cultivating on Sites Contaminated with Heavy Metals—Minor Field Study Made in Zomba, Malawi. Master’s Thesis, Swedish University of Agricultural Sciences, Uppsala, Sweden, 2015; pp. 1–87. Available online: https://stud.epsilon.slu.se/8630/1/orvestedt_s_151119.pdf (accessed on 19 January 2024).
  40. Ignatavičius, G.; Valskys, V.; Bulskaya, I.; Paliulis, D.; Zigmontienė, A.; Satkūnas, J. Heavy metal contamination in surface runoff sediments of the urban area of Vilnius, Lithuani. Est. J. Earth Sci. 2017, 66, 13–20. [Google Scholar] [CrossRef]
  41. Liu, S.; Zhou, Y.; Liu, S.; Chen, X.; Zou, W.; Zhao, D.; Li, X.; Pu, J.; Huang, L.; Chen, J.; et al. Association between exposure to ambient particulate matter and chronic obstructive pulmonary disease: Results from a cross-sectional study in China. Thorax 2017, 72, 788–795. [Google Scholar] [CrossRef] [PubMed]
  42. Ali, M.Y.; Hanafiah, M.M.; Khan, M.F.; Latif, M.T. Quantitative source apportionment and human toxicity of indoor trace metals at university buildings. Build. Environ. 2017, 121, 238–246. [Google Scholar] [CrossRef]
  43. Wang, Y.; Duan, X.; Wang, L. Spatial distribution, and source analysis of heavy metals in soils influenced by industrial enterprise distribution: Case study in Jiangsu Province. Sci. Total Environ. 2020, 710, 134953. [Google Scholar] [CrossRef]
  44. Shrivastava, M.; Ghosh, A.; Bhattacharyya, R.; Singh, S.D. Urban pollution in India. In Urban Pollution: Science and Management; Wiley: Hoboken, NJ, USA, 2018; pp. 341–356. [Google Scholar] [CrossRef]
  45. Zhang, X.; Wei, S.; Sun, Q.; Wadood, S.A.; Guo, B. Source identification and spatial distribution of arsenic and heavy metals in agricultural soil around Hunan industrial estate by positive matrix factorization model, principle components analysis and geo statistical analysis. Ecotoxicol. Environ. Saf. 2018, 159, 354–362. [Google Scholar] [CrossRef] [PubMed]
  46. Qu, M.K.; Li, W.D.; Zhang, C.R.; Wang, S.Q.; Yang, Y.; He, L.Y. Source apportionment of heavy metals in soils using multivariate statistics and geostatistics. Pedosphere 2013, 23, 437–444. [Google Scholar] [CrossRef]
  47. Jiang, Y.; Chao, S.; Liu, J.; Yang, Y.; Chen, Y.; Zhang, A.; Cao, H. Source apportionment and health risk assessment of heavy metals in soil for a township in Jiangsu Province, China. Chemosphere 2017, 168, 1658–1668. [Google Scholar] [CrossRef]
  48. Messner, F. Towards a Sustainable Copper Industry? Trends in Resource Use, Environmental Impacts, and Substitution in the Global Copper Industry. EconStor UFZ-Diskussionspapiere. 2001. UFZ Discussion Papers 1/2001, Helmholtz Centre for Environmental Research (UFZ), Division of Social Sciences (ÖKUS). Available online: https://ideas.repec.org/p/zbw/ufzdps/12001.html (accessed on 19 January 2024).
  49. Liu, T.T.; Hu, W.Z.; Wang, G.F.; Xue, J.P. Assessment of Heavy Metal Pollution in Soil Around a Plastic Metal Factory in Jiaxing, China. IOP Conf. Ser. Earth Environ. Sci. 2020, 446, 032040. [Google Scholar] [CrossRef]
  50. Li, Y.; Yuan, Y.; Sun, C.; Sun, T.; Liu, X.; Li, J.; Fang, L.; Fan, Z. Heavy metals in soil of an urban industrial zone in a metropolis: Risk assessment and source apportionment. Stoch. Environ. Res. Risk Assess. 2020, 34, 435–446. [Google Scholar] [CrossRef]
  51. Egbe, E.R.; Nsonwu-Anyanwu, A.C.; Offor, S.J.; Opara Usoro, C.A.; Etukudo, M.H. Heavy metal content of the soil in the vicinity of the united cement factory in Southern Nigeria. J. Adv. Environ. Health Res. 2019, 7, 122–130. [Google Scholar]
  52. Hoshyari, E.; Hassanzadeh, N.; Keshavarzi, B.; Jaafarzadeh, N.; Rezaei, M. Spatial distribution, source apportionment, and ecological risk assessment of elements (PTEs, REEs, and ENs) in the surface soil of Shiraz City (Iran) under different land-use types. Chemosphere 2023, 311, 137045. [Google Scholar] [CrossRef] [PubMed]
  53. Yang, S.; He, M.; Zhi, Y.; Chang, S.X.; Gu, B.; Liu, X.; Xu, J. An integrated analysis on source-exposure risk of heavy metals in agricultural soils near intense electronic waste recycling activities. Environ. Int. 2019, 133, 105239. [Google Scholar] [CrossRef] [PubMed]
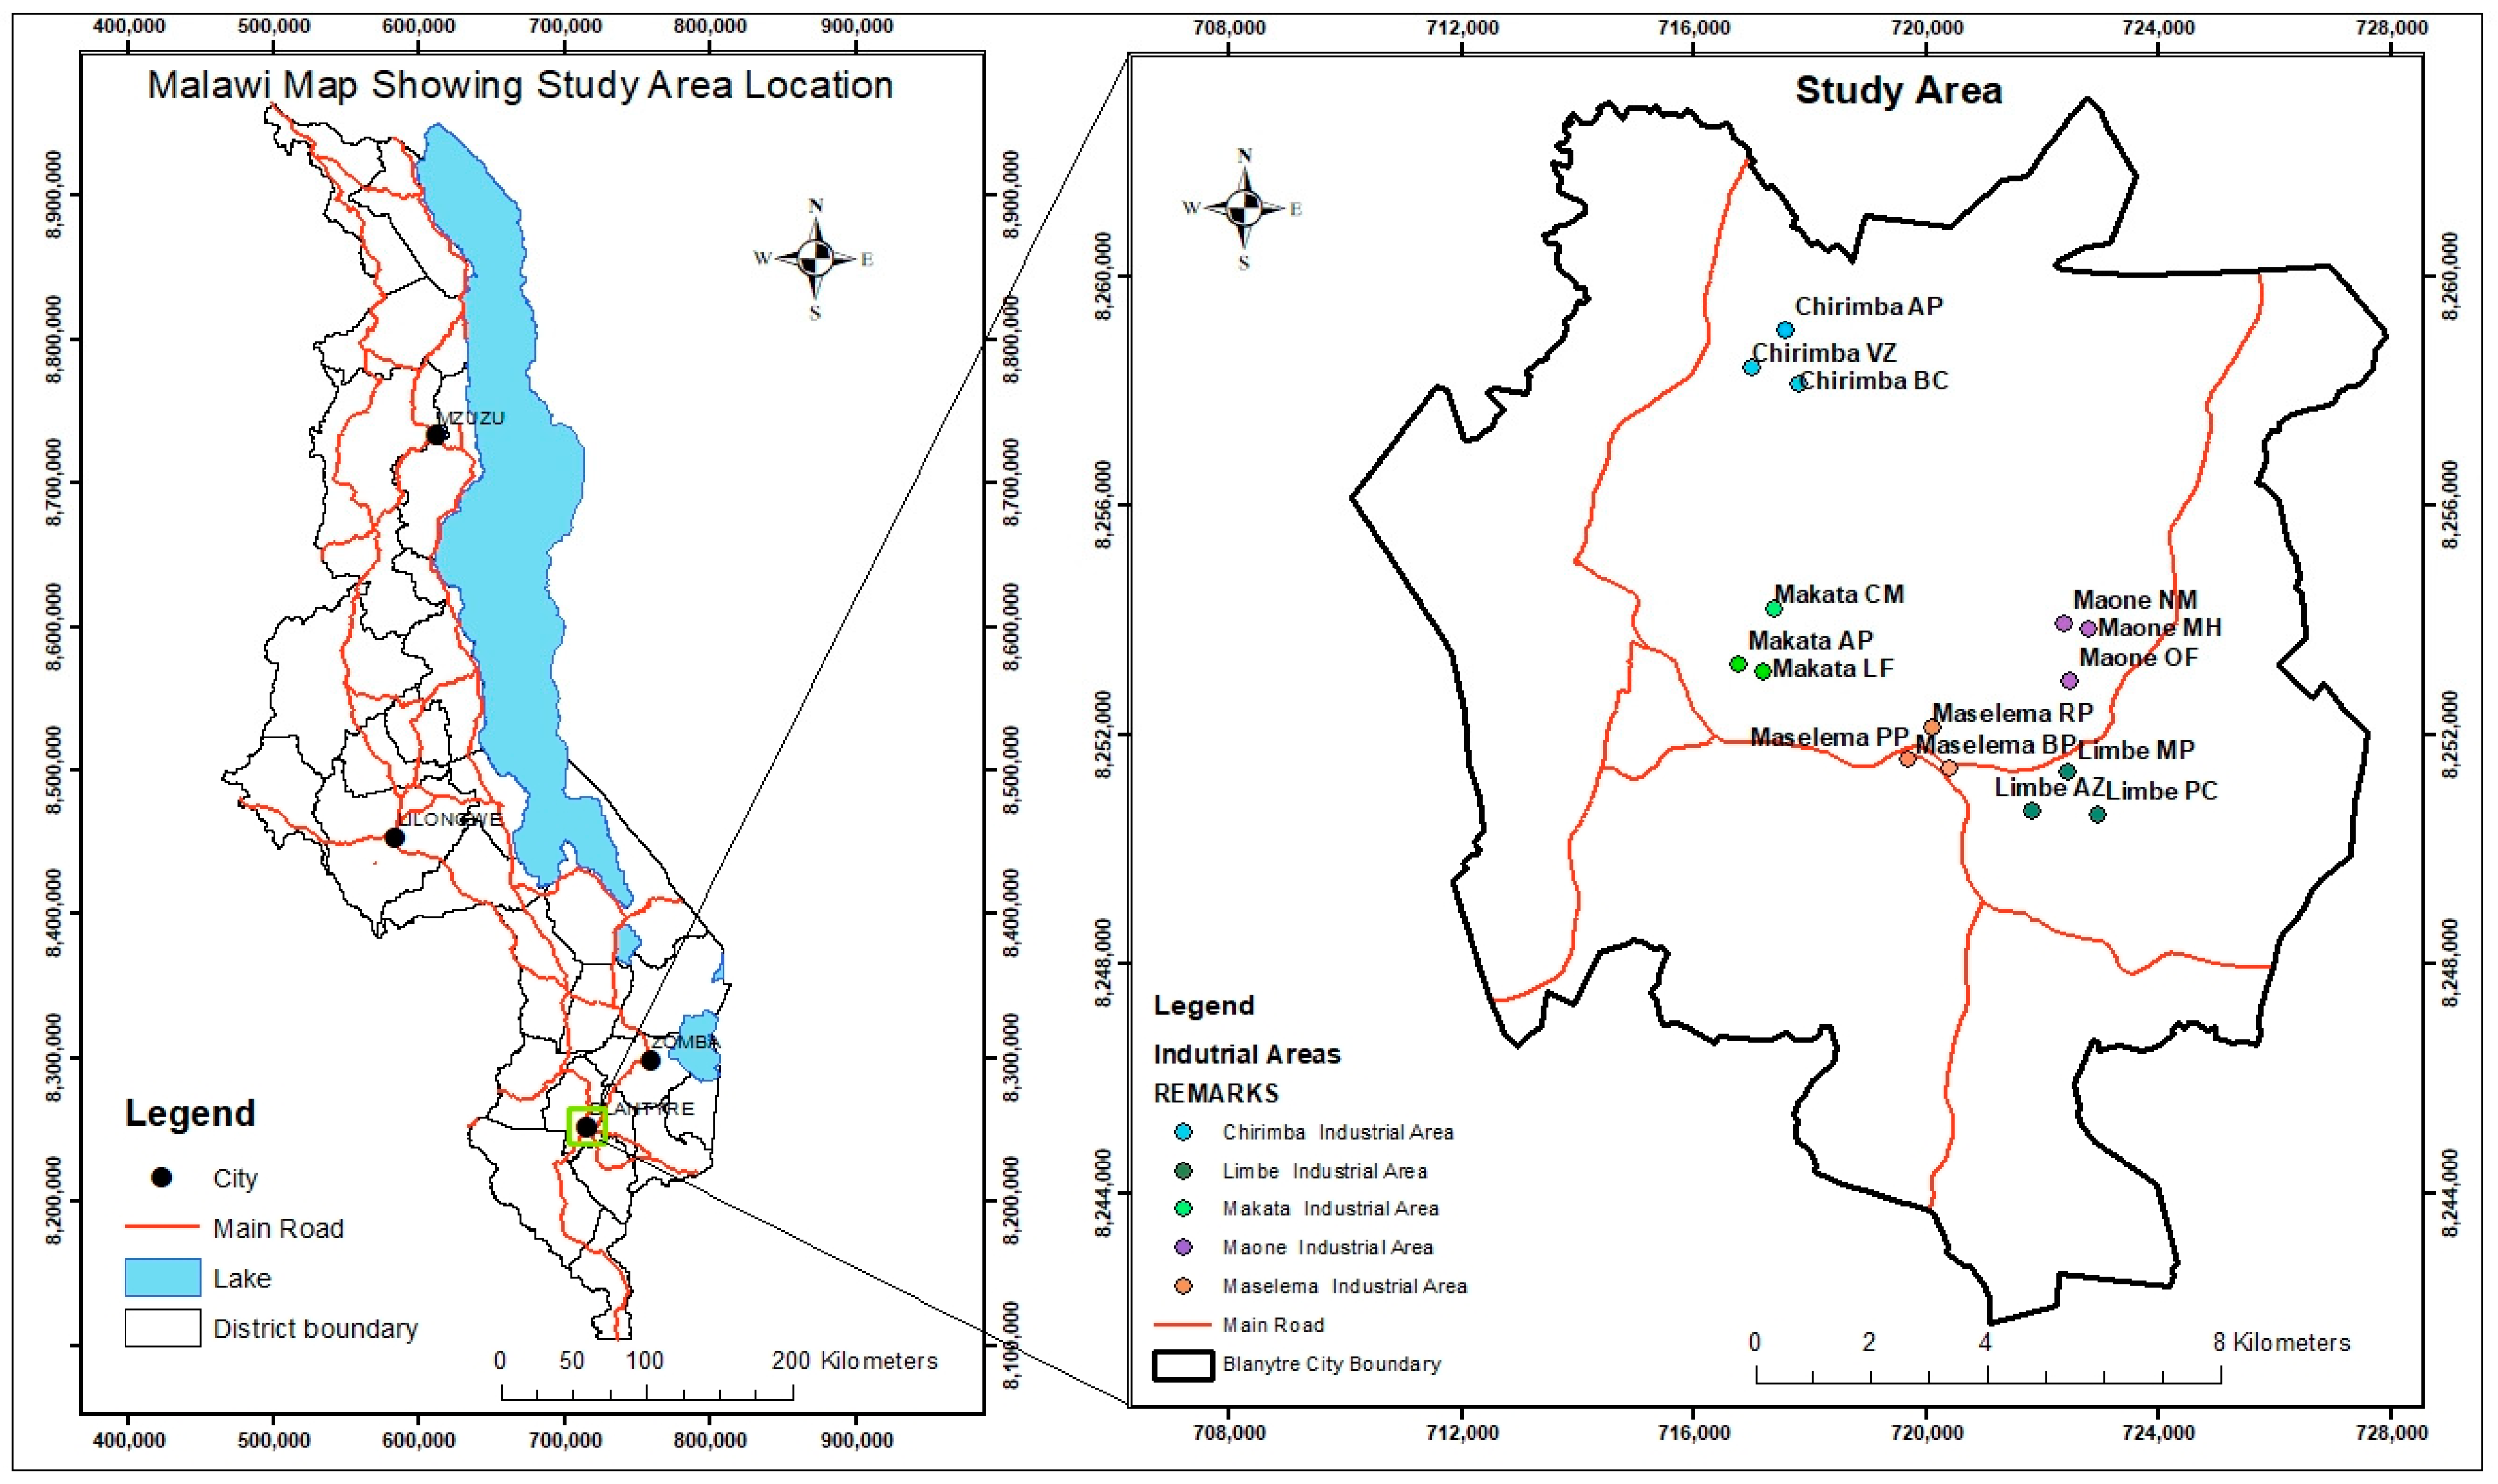
Figure 1. Map of Blantyre showing sampling points.
Pollutants 05 00006 g001
Figure 2. Copper content levels in soil for rainy and dry seasons.
Pollutants 05 00006 g002
Figure 3. Zinc content levels in soil for rainy and dry seasons.
Pollutants 05 00006 g003
Figure 4. Cadmium content levels in soil for rainy and dry seasons.
Pollutants 05 00006 g004
Figure 5. Factor profile and content percentage of heavy metals in the soil during the dry season from the PMF model.
Pollutants 05 00006 g005
Figure 6. Factor fingerprint of 3 heavy metals based on species content (%) for dry season.
Pollutants 05 00006 g006
Figure 7. Factor profile and content percentage of heavy metals in the soil during the rainy season from the PMF model.
Pollutants 05 00006 g007
Figure 8. Factor fingerprint of 3 heavy metals based on species content (%) during rainy season.
Pollutants 05 00006 g008
Figure 9. Risk assessment (Igeo) results of heavy metals by the study area during the dry season.
Pollutants 05 00006 g009
Figure 10. Risk assessment (Igeo) results of heavy metals by the study area during rainy season.
Pollutants 05 00006 g010
Table 1. Mean content values of heavy metal in soils for the dry and rainy seasons.
Sampling PointLocation (UTM)Cu (mg/kg) Zn (mg/kg) Cd (mg/kg)
Rainy SeasonDry SeasonRainy SeasonDry SeasonRainy SeasonDry Season
Maone MH722,465.48, 8,252,921.50BDLBDL30.7 ± 2.9127.9 ± 3.8BDLBDL
Maone NM722,776.63, 8,253,824.173.21 ± 0.43.11 ± 0.8468.4 ± 0.6105 ± 11.12.09 ± 0.13.06 ± 0.1
Maone OF722,362.96, 8,253,936.391.15 ± 0.24BDL71.2 ± 2.00.26 ± 0.11BDLBDL
Limbe AZ721,243.21, 8,251,341.22BDLBDL81.4 ± 1.3069.3 ± 9.00.07 ± 0.01BDL
Limbe MP721,442.83, 8,251,262.551.51 ± 0.023.66 ± 1.0192 ± 1.06185 ± 13.80.02 ± 0.01BDL
Limbe PC721,442.83, 8,251,536.570.38 ± 0.051.26 ± 0.2141.3 ± 1.0559.6 ± 7.320.05 ± 0.040.11 ± 0.06
Maselema BP719,681.90, 8,251,556.4021.8 ± 0.714.3 ± 3.24111 ± 0.994.8 ± 8.25BDLBDL
Maselema PP719,820.04, 8,251,666.62BDL5.31 ± 1.71104 ± 0.1896.5 ± 1.70.02 ± 0.010.26 ± 0.07
Maselema RP720,395.01, 8,251,396.0214.6 ± 1.014.6 ± 1.070 ± 1.8742.9 ± 1.93BDLBDL
Chirimba AP717,577.34, 8,259,052.2979 ± 1.4105 ± 8.62822 ± 2.3 579 ± 5.14BDLBDL
Chirimba BC717,587.15, 8,258,489.82BDLBDL51.2 ± 3.966.5 ± 1.84BDLBDL
Chirimba VZ717,201.70; 8,258,647.93BDLBDL3.95 ± 0.239.29 ± 1.0BDLBDL
Makata AP717,182.33, 8,253,101.410.05 ± 0.010.22 ± 0.0716.2 ± 0.3339.1 ± 3.70.17 ± 0.010.09 ± 0.01
Makata CM 716,748.68, 8,253,219.58BDLBDL55.5 ± 1.0848.1 ± 3.3BDLBDL
Makata LF717,841.57, 8,253,638.503.73 ± 0.196.13 ± 0.9275 ± 10.54408 ± 6.220.31 ± 0.40.87 ± 0.21
England Standards 100.00 mg/kg 300.00 mg/kg 7.00 mg/kg
Canadian Standards 30.00 mg/kg 60.00 mg/kg 50.0 mg/kg
* Background Content 0.2 0.5 0.6
* Heavy metal background content levels for soils in Blantyre obtained as averages from Malikula et al. [6] and Kaonga et al. [21].
Table 2. The signal-to-noise ratio of heavy metals.
Signal-to-Noise Ratio (S/N)
SpeciesDry SeasonRainy Season
Copper3.1625.123
Zinc7.3199.956
Cadmium1.7692.289
Table 3. The levels of geo-accumulation index [11].
Igeo ClassIgeo ValueLevel of Contamination Classification
0Igeo ≤ 0Not contaminated
10 < Igeo < 1Not contaminated to moderately contaminated
21 < Igeo < 2Moderately contaminated
32 < Igeo < 3Moderately to highly contaminated
43 < Igeo < 4Highly contaminated
54 < Igeo < 5Highly to extremely contaminated
6Igeo ≥ 6Extremely contaminated
Disclaimer/Publisher’s Note: The statements, opinions and data contained in all publications are solely those of the individual author(s) and contributor(s) and not of MDPI and/or the editor(s). MDPI and/or the editor(s) disclaim responsibility for any injury to people or property resulting from any ideas, methods, instructions or products referred to in the content.