Article

Exploitation of Waste Algal Biomass in Northern Italy: A Cost–Benefit Analysis

1
Department of Humanistic Study, University of Ferrara, 44124 Ferrara, Italy
2
Department of International Economics, Institutions and Development, Catholic University of the Sacred Heart, 20123 Milan, Italy
3
Department of Economics and Management, University of Ferrara, 44124 Ferrara, Italy
4
Department of Environmental Sciences and Prevention, University of Ferrara, 44124 Ferrara, Italy
*
Author to whom correspondence should be addressed.
Pollutants 2024, 4(3), 393-423; https://doi.org/10.3390/pollutants4030027
Submission received: 20 July 2024 / Revised: 24 August 2024 / Accepted: 2 September 2024 / Published: 6 September 2024
(This article belongs to the Section Environmental Systems and Management)

Abstract

:
Aquaculture and waste valorization have the potential to show solid achievements toward food security and improvements in the circularity of resources, which are crucial aspects of achieving a sustainable lifestyle in agreeance with Agenda 2030 goals. This study aims to optimize and simplify the decision-making processes for the valorization of marine wastes (natural and from aquaculture) as secondary raw materials to produce high-value-added market goods. However, significant concentrations of pollutants may be present within wastes, compromising overall quality, and social dynamics can hinder their usage further. Goro’s lagoon was chosen as a case study, where the relations between the ecosystem services, a thriving bivalve economy, and social dynamics are deeply rooted and intertwined. Therefore, in the manuscript cost–benefit and foresight analyses are conducted to determine the best usage for algal biomass considering pollution, social acceptance, and profitability. These analyses are virtually conducted on bio-refineries that could be operating in the case study’s area: briefly, for a thirty-year running bio-plant, the CBA indicates the two best alternatives with an income of 5 billion euros (NPV, with a 5% discount rate) for a biofuel-only production facility, and a half for a multiproduct one, leading to the conclusion that the first is the best alternative. The foresight, instead, suggests a more cautious approach by considering external factors such as the environment and local inhabitants. Hence, the main innovation of this work consists of the decision-maker’s holistic enlightenment toward the complexities and the hidden threats bound to this kind of closed-loop efficiency-boosting process, which eventually leads to optimized decision-making processes.

1. Introduction

It is known that anthropic impacts are deeply influencing the planet’s equilibria in negative ways, and some effects and consequences are already observable from an overall detrimental perspective. Among the most concerning are climate change, natural resource depletion, pollution, biodiversity, and ecosystem services losses, which are increasingly posing threats to the environment and biosphere, especially toward delicate and fragile ecosystems [1,2,3]. A crucial issue for the future of humanity is related to the achievement of global food and resource security in a scenario of a growing world population while reducing environmental impact and conserving ecological services [4].
Aquaculture represents a promising way to produce and secure food and other products without wasting land and drastically reducing the resources needed [5]. However, some crucial aspects connected to impacts and environmental tolls must be solved [6,7]. Asian countries are also exploiting algal biomass and marine wastes from Indo-Pacific waters for phytoremediation and improved circularity purposes [8,9,10].
However, since the advent of climate change, the consequent rise in temperatures is modifying the natural cycles of marine life, as water temperature is a regulator for many ecological processes and the distribution of species [11]. In addition, the introduction of chemical substances, such as plastic debris and persistent, bioaccumulative, and toxic (PBT) species, is causing direct and long-term damage to ecosystem quality [12,13,14,15,16]. In addition, nutrients can lead to nutrient pollution, which is the enrichment of nutrients coming from households, agriculture, and industries, such as nitrogen (N), phosphorous (P), minerals, organic matter, and other chemicals in a water body [17].
Nutrient pollution can affect primary producers with eutrophication phenomena, with various repercussions on the whole ecosystem [11,18], in some cases generating harmful algal blooms (HABs), which can lead to the death of the ecosystem itself and the loss of the services it provided. In addition, the loss of amenity value must be considered; in fact, out of the expensive clean-up operations, a reduction in visiting tourists and spatial inaccessibility for recreational users, sailors, and fishers translates to even more economic losses [19]. In fact, $2.2 billion annually is the estimated cost of damage mediation for eutrophication damages in the U.S. alone [20]. The phenomena of aggressive and severe algal blooms are happening worldwide with growing intensity; some examples can be found in the works of [19,21,22,23,24,25,26,27]; nonetheless, it is predicted that the frequency and severity are likely to increase [27].
Transitional waters (TWs) are often characterized by shallow waters, a limited and specialized taxonomic richness, and a geomorphological isolating and sheltering structure; in other words, a protected shuffle point for nutrients and species, sited between freshwater and marine environments [28]. Hence, they are most suitable to host aquaculture activities but are also especially prone to suffer from prolonged external variations and negative events, such as the above-mentioned HABs.
The aim of the manuscript is to match the need for a holistic approach toward the resolution of problems according to all aspects of sustainability: environmental, economic, and social, entangled with the need to enforce aquaculture and circularity of resources in TWs. Hence, in this study, cost–benefit (CBA) and foresight analyses are performed to systematically determine the best ways to exploit the problematic waste algal biomasses from HABs, thus restoring and safeguarding the ecosystem services effectiveness of TWs, also by taking into consideration the socio-cultural, historical, and environmental contexts. Therefore, the CBA is used to compare various industrial processes to transform biomass into marketable goods, while the SWOT Foresight analysis enriches the output of the CBA by also considering social factors and pollution status. Hence producing a strategic tool for stakeholders, leading to simplified and shortened decision-making processes.
The case study is the valuable Goro’s lagoon: a fruitful but endangered TW location suffering from HABs and anthropogenic stress, which could benefit from a sustainable tutelage strategy. Thus, matching the Sustainable Development Goals “affordable and clean energy”, “industry, innovation and infrastructure”, and “life below water” [29].
In Section 2 and Section 3, a literature review and a case study will be introduced. The options will be described in Section 4, as well as the comparison method of the cost–benefit analysis and foresight technique. Section 5 and Section 6 will discuss the results of both CBA and foresight. Last, in Section 7 and Section 8, there are discussions and conclusions with final remarks and suggestions for further analysis.

2. Background

Ecosystem services (ES) are of fundamental importance to our well-being [30,31]; hence, preserving ES quality and productivity should also be of primary interest for improving economic returns, savings, and lifestyle quality. However, ecosystems are becoming so degraded that many regions in the world risk ecological collapse 4; thus, the first move should be acting toward stress reduction/elimination, possibly turning problems into solutions.

2.1. Algae

Among various stressors, the increased frequency of nuisance macroalgal blooms is unlikely to change in the immediate future; the challenge is then to exploit the problematic algal biomasses coming from HABs (not exclusively) as secondary raw material to produce marketable goods, promoting the sustainable use of biomass, innovation, and development, also restoring the health and quality of the ecosystem, especially when many natural resources are becoming increasingly scarce.
Algal biomass is indeed a resource suitable for producing a panorama of products for multiple purposes: fuels, drugs, food, integrators, and platform chemicals [30,31,32,33].
However, some limiting agents stand against the exploitability of this re-discovered resource, among others, the immaturity of the infrastructures and the lack of a functioning bioeconomy. In fact, the lack of market readiness for bio-products acceptance represents an important obstacle to algal product diffusion [34,35,36]. Moreover, the chemical composition of the biomass itself and the presence of pollutants that can interfere with the exploitation routes are also important limiting factors. However, CO2 sequestration, renewable energy production, improved circularity of resources, environmental protection, bioremediation, and the opening of new markets are some of the benefits that could derive from a strong algal bioeconomy.
Other than the peculiar behavior and morphology of different phyla, algae show characteristic amounts of carbohydrates, lipids, minerals, and proteins; this chemical composition varies across species, seasons, and with environmental factors such as solar irradiation, water temperature, and composition [37,38]. Algae can also selectively metabolize [39] or accumulate substances, especially heavy metals, from the environment; for example, in [40], 6 g per liter of water are used to deplete the concentration of As, Cd, Pb, Cu, Cr, Hg, Mn, and Ni elements, with an efficiency ranging from 48% for arsenic to 98% for mercury, in a timeframe of 12 h for 50% removal. In light of these interactions, their usage as bio remediators is nowadays studied; some examples from the literature are reported [41,42]. Regarding this manuscript, algae could play a double role, at first cleaning and remediating TWs for further recollection of valuable metals and elimination of the other toxicants, plus the production of the above-discussed products.

2.2. Biomass and Biorefinery

Biomass is crude oil’s most promising substitute since it is an abundant and renewable carbon-neutral source to produce energy, platform chemicals, and biomaterials. Biomass may be made of organic wastes, by-products, and residues. Therefore, biomass feedstocks are classified by their origin in “generations” [43,44].
Third-generation biomass includes animal manure (e.g., poultry litter, dairy manure, and swine manure), municipal solid waste, industrial effluent (textile effluents, paper, pulp industry wastes, tannery effluents, pharmaceutical wastes, etc.), sewage sludge, and micro and macroalgae [43]. This third kind is “dirtier” (meaning that it could also ruin the working apparatus) than first- and second-generation biomasses, also carrying conspicuous amounts of phosphorous, nitrogen, pollutants, and/or pathogens. Therefore, aquatic biomass is considered a third-generation biomass but also an advanced biofuel feedstock because of its perennial and inherent growth.
Biomass can be transformed in a biorefinery (BR), which is a general term that indicates an industry where the feedstock input is of a biological nature, i.e., biomass [44]; therefore, it should reintegrate and maintain the carbon cycle. In fact, BR is being identified as the biological and green version of an oil refinery; however, while a core process of fragmented distillation defines the oil refinery, biorefineries are more complex to define since there is no common ground among facilities. Moreover, BRs are in an embryonic technological stage; thus, the number of operating biorefineries is quite exiguous; therefore, finding and confronting similarities among facilities is not an easy task. Furthermore, there are no generally accepted classification criteria for BRs, and in the literature, a number of different naming strategies can be found, for example, according to the feedstock used, the transformation processes, or the type and quantity of products. However, there is a strategy to summarize some factors by introducing the “phase” description, a classification that considers the input and output of the BR to identify the plant’s complexity and flexibility [44]:
  • Phase 1: one feed source/nonflexible main processes/only one product
  • Phase 2: one feed source/rather flexible main processes/multitude of products
  • Phase 3: various feed sources/flexible main processes/multitude of products
Nowadays, BRs are mainly phase 1, whereas very few are phase 2, and phase 3 facilities exist only on a conceptual level.
In this work, the focus is set on the usage of algae, both micro and macro, as biomass feedstock for processes typical for BR, such as biofuel production.
Unfortunately, the literature on BR technologies for biofuels is still immature, as can be seen in Figure 1 and Table A1 (Appendix A). For industrial purposes, it should be noted that transforming microalgae is easier, and their composition is more controllable. The drawback is that the growing structure for them is quite always necessary on land, while macroalgae can be grown in seawater, so the biomass may be more polluted and have lesser control over its composition.
Thus, given the exiguous number of papers in the literature on biorefinery and algal biomass management, studying solutions compatible with the cascade utilization of natural seaweeds to produce high-value intermediate and end products is a complex matter. In addition, if compared to fossils, biorefinery products are hardly economically competitive. However, technical publications on the topic are more and more accompanied by economic feasibility analysis and lifecycle cost analysis [45,46,47,48,49,50,51]. Nevertheless, bio products’ impact evaluations and market acceptability are being made in the literature with increasing frequency [52], which is a good sign for the increased installation of bio-plants. Biorefineries also hold a tremendous potential for innovation and are compatible with renewable sources of energy.

3. The Case Study

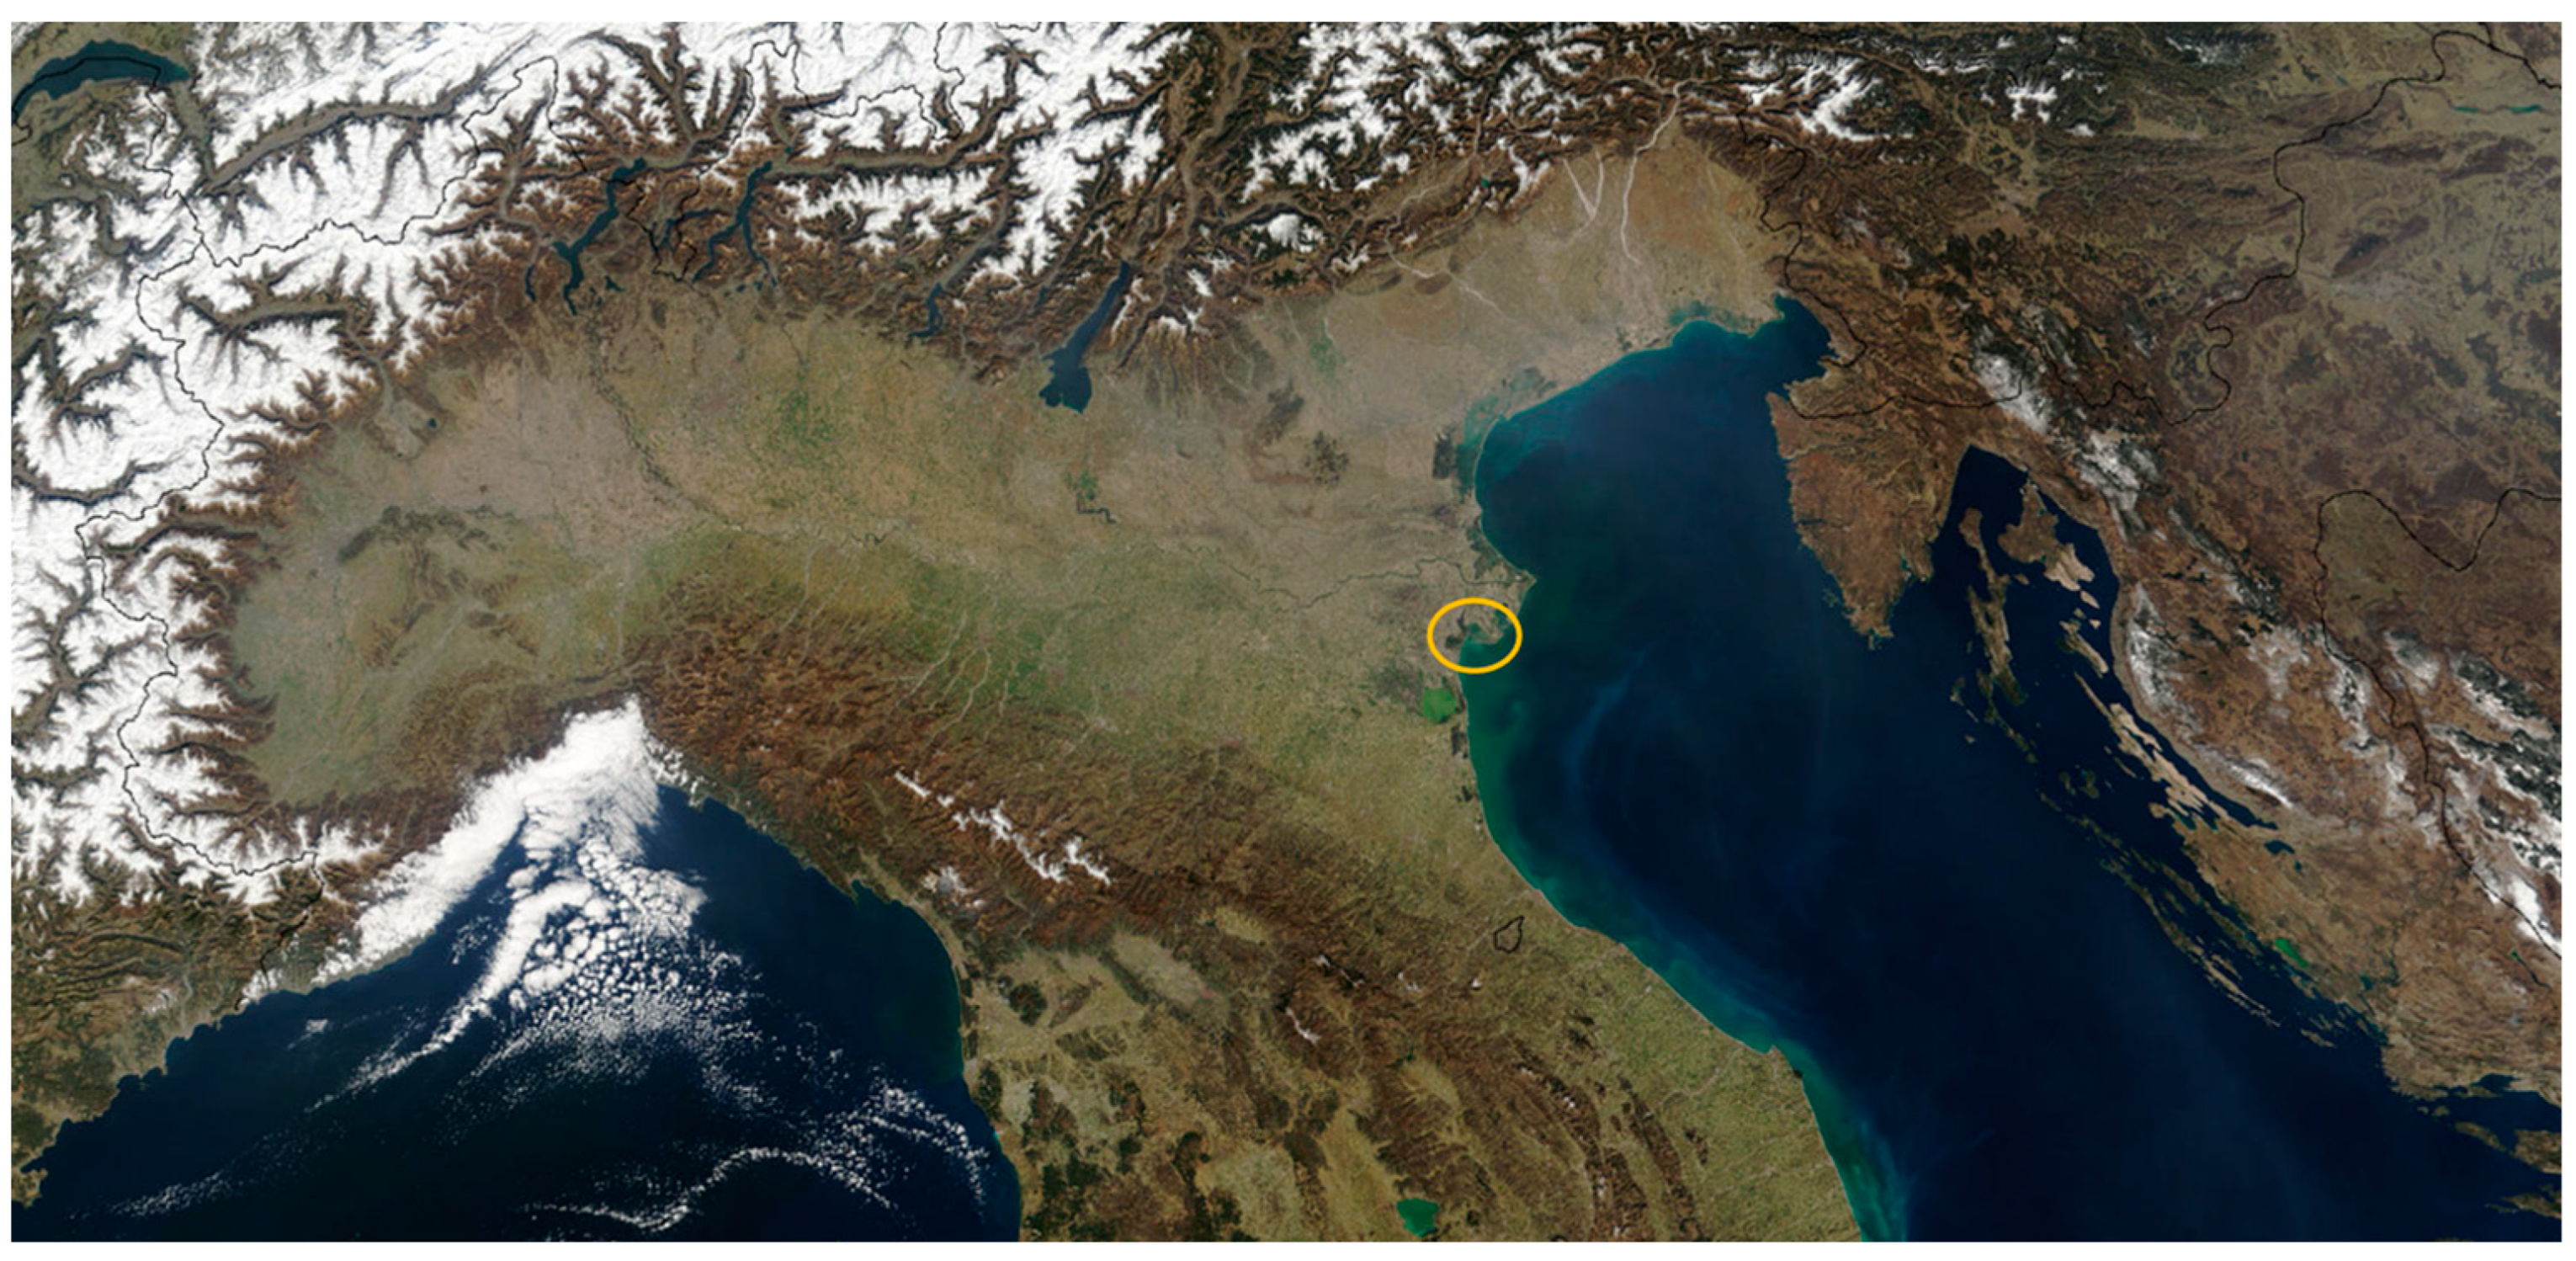
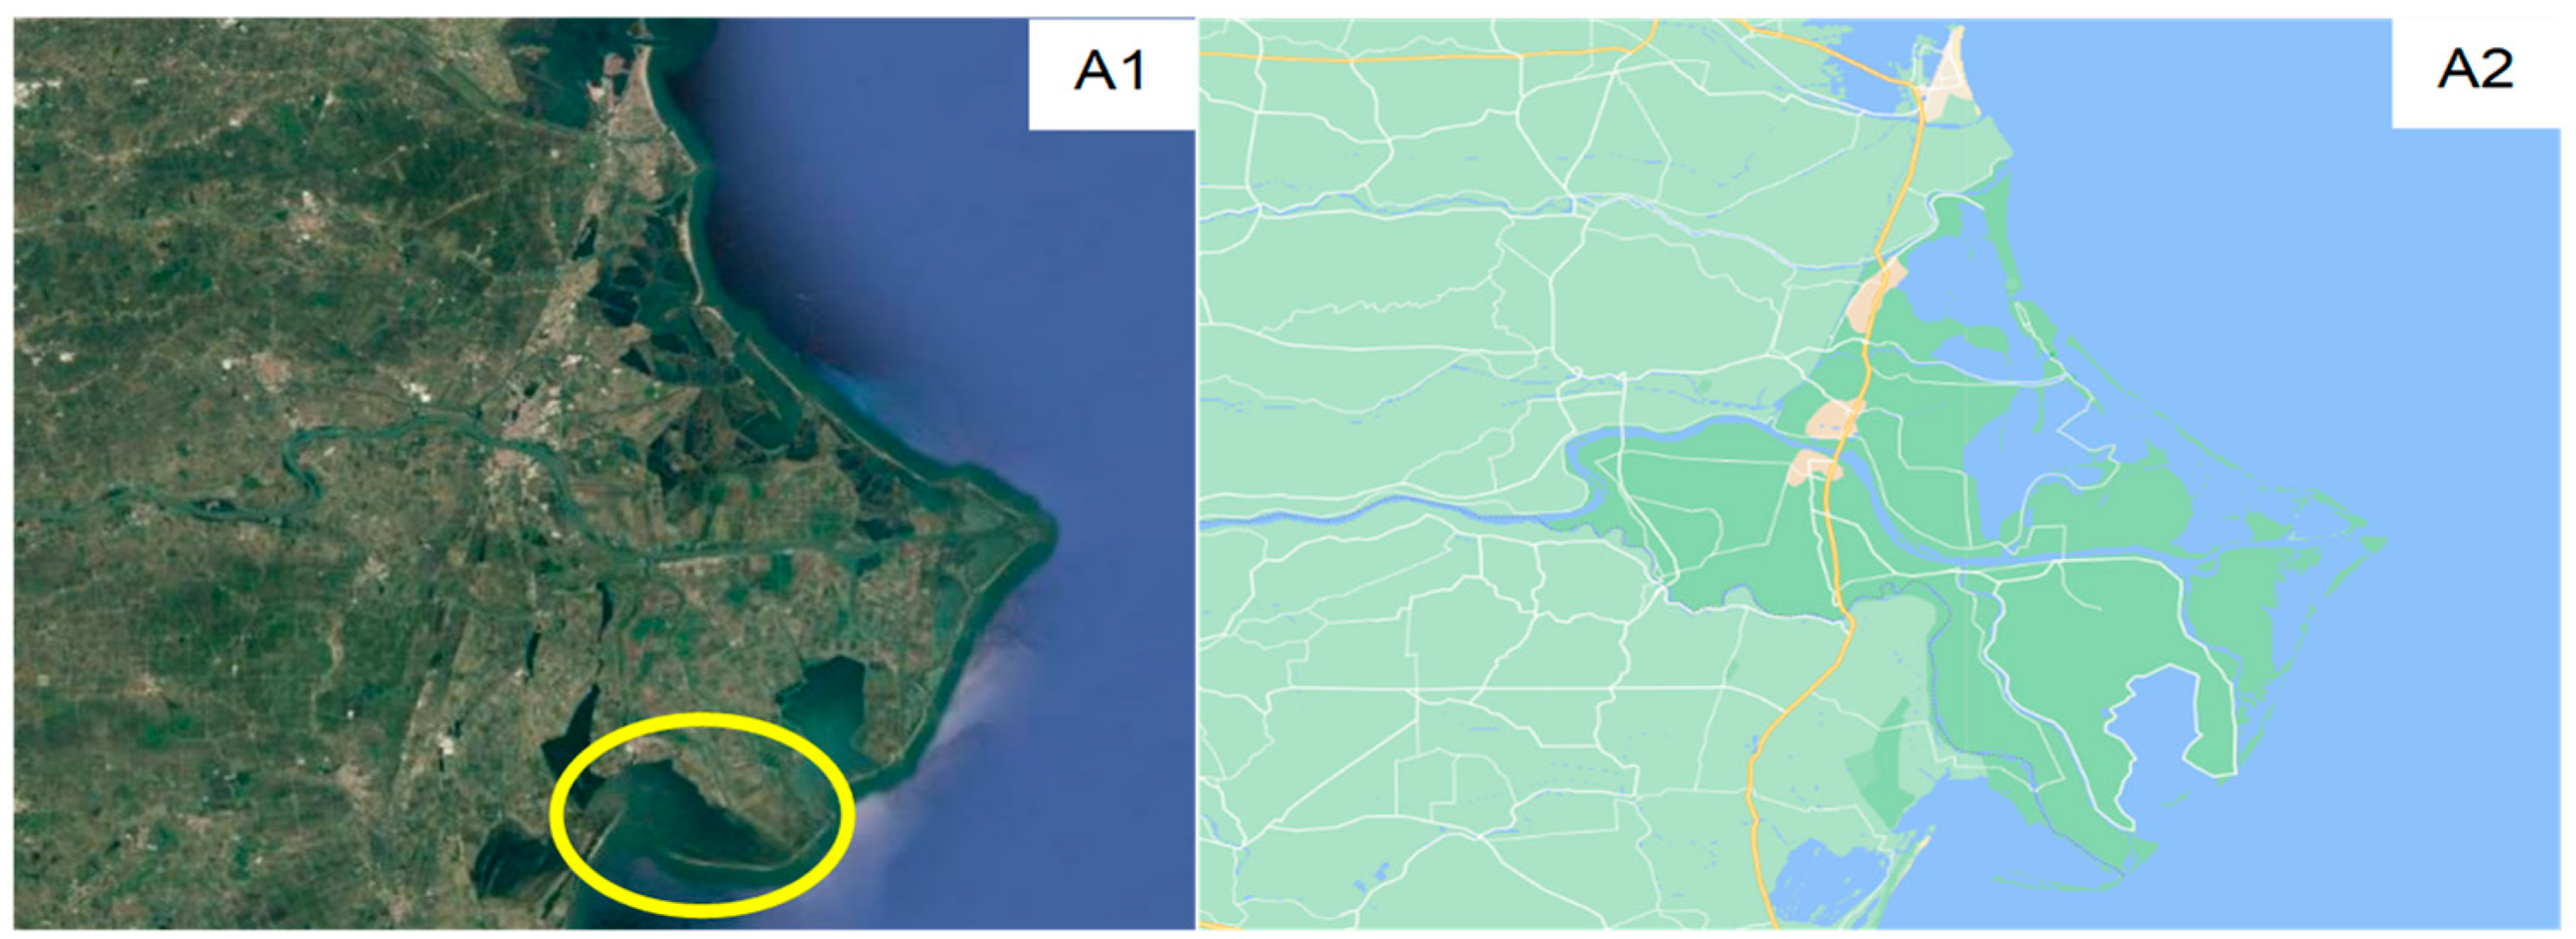
The area chosen for the case study is Goro’s Lagoon, the so-called “Sacca di Goro”, which is an iconic and valuable transitional water region upon the Po River delta in the northern Adriatic Sea in Ferrara’s province in the North–East of Italy (Figure 2 and Figure 3). The productivity of the area is remarkable since it accounts for 14/15 thousand tons of mussels yearly, 54% percent of Italian production, and 40% of European production [53,54].
The Goro’s lagoon (in Italian “Sacca di Goro”), along with other nearby lagoons, is part of the “Delta del Po” protected park (UNESCO) [56] and is a water surface extending for 20 square kilometers, with sandy bottoms on average 60–70 cm deep, with some 2 m deep zones (“Parco Del Delta Del Po”). The lagoon environment is evolving, which means that it is slowly changing and mutating; although these natural changes are due to the natural water circulation between freshwater and tides, human intervention also introduces morphological modifications to slow down these naturally occurring processes. One of the most recent anthropic interventions was made to improve the hydrodynamic circulation by the opening of additional freshwater outputs in the lagoon, for example, the ones on the southwestern side of the lagoon.
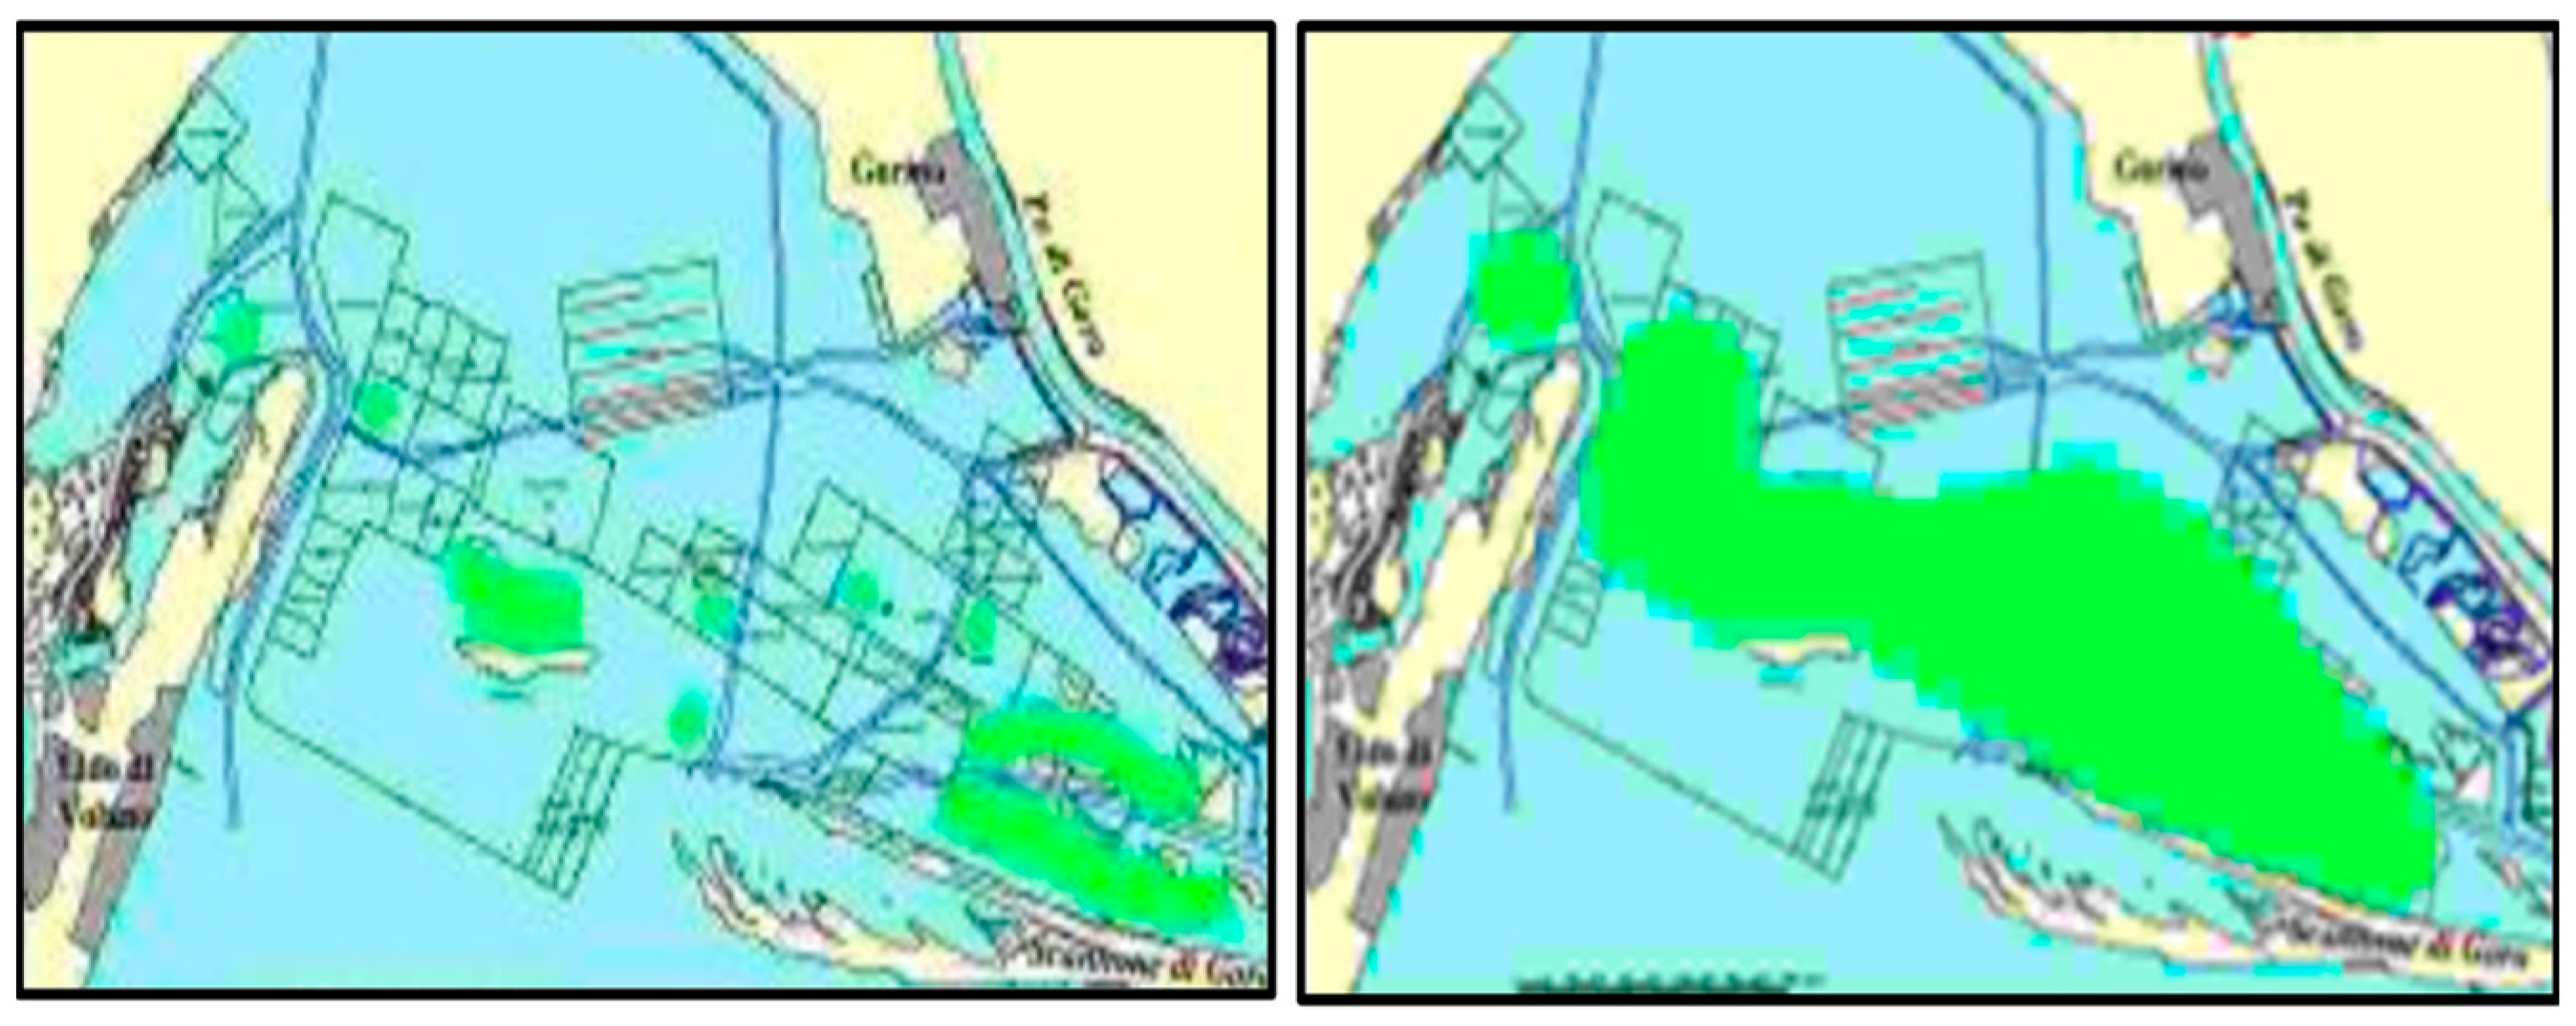
As previously mentioned, productivity is remarkable, and it stands as the solid base for a strong, bivalve aquaculture economy that boasts several million euros per year. Thus, there exists a profound and rooted bond between the social and economic context of this transitional location. Since the early 2000s, this area has been suffering from extraordinary algal bloom phenomena of growing proportion (e.g., Figure 4), with a peak in the 2014–2015 years, with consequent damages to the ecosystem and mussel’s die-offs, severely affecting the socio-economic local tissue.
In this transitional lagoon, algal presence is mostly made by the two macroalgal species of Ulva Lactuga and Gracilaria [58], which are the two species majorly present as well during HABs in this location, of which an example from local newspapers [59].
The seaweed Ulva Lactuga belongs to the Chlorophyta phylum and shows a deep green pigmentation because of its chlorophyll content. The biomass of this origin performs well as a soil conditioner, fertilizer, and feedstock for aquaculture organisms, although it is especially suitable for the extraction of high-value-added chemicals and the production of biofuels. This alga shows a peculiar mix of lipids, which can be isolated or turned into biodiesel, phenols, which can be extracted and used as antioxidants, polysaccharides, and saccharides, which have a plethora of uses, among which the production of biopolymers or the transformation into bioethanol [32,33,60,61].
Gracilaria belongs to the Rhodophyta phylum and is characterized by a brownish-red pigmentation because of the major presence of phycoerythrin (red algae version of chlorophyll) and carotenoids. This biomass, instead, shows a more fibrous structure and is already used in production plants for edible goods (in China and Japan mostly), such as the phycocolloid known as “agar” used worldwide for culinary purposes, and the extraction of alginate (polysaccharide), other than fodder for organisms [62]. However, the exiguous amount of lipids and the high amount of carbohydrates make Gracilaria suitable for producing bioethanol [63,64,65].
Other uses for these can be found in additional references reported in Appendix A.
Unfortunately, biomass exploitation is not a straightforward and clean process for multiple reasons. First, the marine biomass comes as a mixture of seaweeds and not as a single phylum. In addition, sand, salt, and solid debris, e.g., shells, exoskeletons, organisms, plastic debris, and microplastics, must be washed away, adding extra costs. Moreover, the biomass may have accumulated not negligible amounts of pollutants from the water column and sediments. This latter issue is discussed in the foresight analysis under Section 6.

4. Methods

4.1. Cost–Benefit Analysis

To develop an eco-industrial system, ex-ante studies are often conducted to pinpoint hotspots of profitability with significant economic costs and benefits data. The cost–benefit analysis (CBA) is a standard method to evaluate the best choice among different investments or projects in uncertain situations regarding their payback and overall effects. CBA is a systematic process for calculating and comparing benefits and costs of alternative choices (e.g., scenarios, projects, investments); thus, it is mainly adopted to help the decision-making process to allocate resources in the most profitable way [66]. Therefore, CBA has a long history in management and economic studies, both for private and public investments and since the 1930s, it has also been used for policy and environmental projects [67,68]. Generally, this method helps to avoid being swept by the fashions of the moment [69] by relying on economic data and evaluating the economic return, or loss, over a fixed timespan, with various discount rates.
Therefore, in the presence of multiple choices for project development, an ex-ante CBA helps and guides the selection of the most profitable one, which maximizes the value of the investment by the comparison of net cash flows (discounted benefits minus costs) generated along a selected time frame. These values are expressed in monetary terms and reported to present values by applying a fixed discount rate (Equation (1)); in this analysis, five discount rates have been chosen for further comparisons, namely: 0.5%, 1%, 3%, 5%, and 10% to simulate different investment opportunities and risks, and to match a realistic timeframe of thirty years for the operative lifespan of medium-big industries. More specifically, discounting reflects a social opportunity cost, such as the return on the private or corporate investment displaced by government funding, the rate at which society is willing to trade-off consumption today for consumption tomorrow, the rate at which society expects wealth to increase in the future (and marginal utility of future benefits to decrease) thanks to economic growth. However, in this specific case, the discount rates are the expression of the risks connected to biomass exploitation. Eventually, a rational decision-maker should opt for the investment with the highest economic return [70]. The formula of the CBA is shown in Equation (1).
NPV = t = 0 n R t 1 + i t t = 0 n C t 1 + i t
Equation (1) Net Present Value Formula [71], where Rt is revenue, Ct is the cost, i is the discount rate, and t is the year of the timeframe.
Hence, in this study, different approaches for biomass exploitation are confronted on the structural basis of bio-plants costs and products to determine the best manner to approach the exploitation of biological waste in such a delicate socio-economic context. However, because of the young age of these technologies and the little literature surrounding this topic, approximations and assumptions are necessary. As previously mentioned, the CBA collects and confronts different scenarios, among which a “status quo” option as the real baseline, which is relatively the cheapest but does not solve any problem nor create circular value, and various biorefinery approaches for biofuel production and more. In detail, a timeframe of 30 years has been chosen, given the complexity and the time needed to build and run facilities similar to the ones under discussion in this paper, which are reported in Section 4.3.3, especially considering the difficulties involved in the commercialization of bioproducts given the relative absence of a wide and functioning bioeconomy.
However, this is also a case where it is somehow complicated to express an economical value to community goods or fears, especially for the ecosystem’s service quality (that allows for mussels to grow and thrive) and the intertwined social dynamics of people relying on it; nonetheless, also pollution can represent a complicated parameter to consider economically. Therefore, scenarios, including pollution and social aspects, are built with foresight techniques; thus, they are analyzed and discussed, starting from the results of the CBA and considering a real failed case.

4.2. Foresight Analysis

Foresight analysis is a systemic, interactive, and creative process of strategical evaluations to go beyond the visible, to perceive the utility of new choices, to gain awareness of hidden threats and problems, to develop visions for the future in the medium-long period (over 10 years), and thus detect possibilities innovations and further development, to optimize decision-making and policy interventions towards targets [71]. Then, the role of foresight is to help and drive the allocation of limited resources toward a solid target. The call for business success requires perfect timing and the management of investments since today is winning not only who comes first to innovation but mainly who is able to commercialize it first with products and services readily accepted by the market [72,73]. It is therefore important to develop a business strategy in agreement with transitional water ecosystem services improvement and safeguard it in the present and future, as well as its surrounding economy, people, and markets.
There are many viable methods in the literature to perform a foresight analysis; the ones adopted in this work are the “Strengths”, “Weaknesses”, “Opportunities”, and “Threats” (SWOT) analysis, with the purpose of “identifying the issue” [74,75,76]. SWOT is chosen as the proper tool for refining the CBA output by taking into consideration social and pollution issues upon algal biomass exploitation. The evaluations are made based on historical data and facts from the grey literature regarding a similar project that has failed to be completed. Therefore, the SWOT consists of a refinement process that helps overcome challenges and determine what measures to adopt to pursue the targets effectively. Hence, the primary objective of a SWOT analysis is to develop a full awareness of all the factors involved in making decisions [77].

4.3. Scenarios

4.3.1. The Baseline, or “Status Quo”

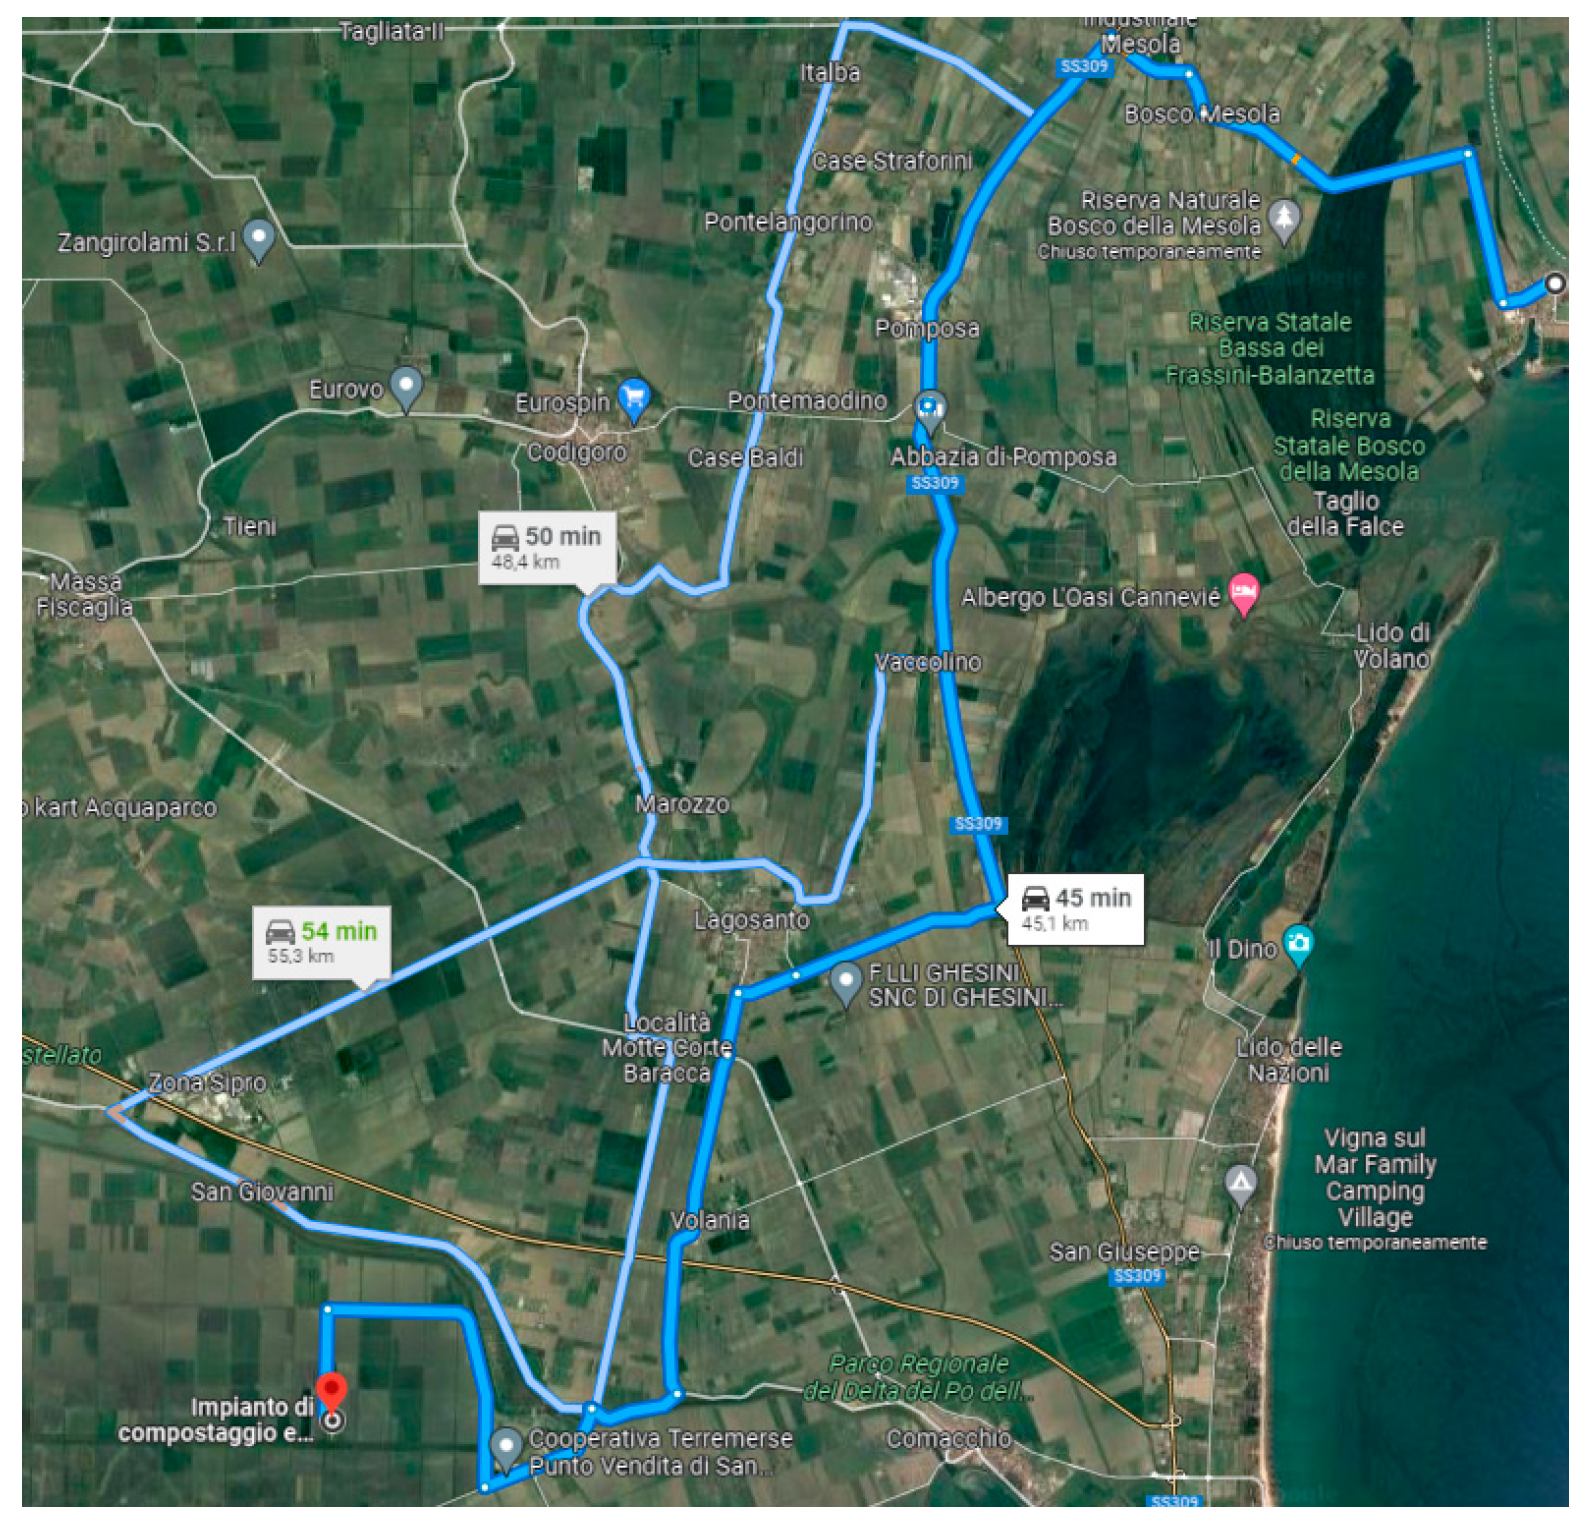
The “status quo”, or scenario zero, is not included in the CBA, but it is only reported as a baseline of how the situation is being managed, i.e., without circularity actions toward algae’s aggressive blooms (HABs), then undergoing related damages and losses, whereas only a physical removal by the hands of the locals, aqua-cultivators, and fishermen is made. The biomass collected is then transported to a compost plant in the surroundings (Ostellato, around 50 km) to produce a bio-stabilized sent-in landfill or to be used as a covering layer again in the landfill. Thus, little to no energy is recovered, and the carbon cycle is interrupted, not to mention the marginal utilization of two facilities, a composter, and a landfill, with their related costs and soil usage.
However, despite being the less impactful case from a social perspective, it might not be the best solution given the loss from HABs damages to mussels’ population and collection, maintenance, disposal, and transportation costs; in Figure 5, the routes from Goro’s city to Ostellato’s composter, with a 50 km and 50 min mean mileage; plus, an equal distance and time from the composter to the landfill.
Hence, the “do nothing” option has been working well in standard situations, but in the case of HABs, it is not of use at all, given the multitude of anoxic crises detected from 2000 [58] and the consequent bivalve die-offs with a drop in productivity even down to an 80% loss. However, the monetary losses coming from cultivation destruction are not quantifiable precisely, but to obtain an idea of whether it is possible to confront it with an annual income of more than 50 million euros for a single subject (e.g., consortia and cooperatives) when at 100% productivity [78].
Therefore, the income reduction from the lack of products to sell and the expenditure for disposal and restoration accounts heavily depend on the relatively small reality of this transitional water body, both in terms of economic and social tissue. In Table 1, the clean-up, disposal, and maintenance costs are reported from 2016 up to 2021. In those years, some modifications have been made to the lagoon’s hydrodynamic circulation, and the HABs problem was appeased temporarily.
From Table 1, it is possible to note that in 2016, the amount of algal biomass was higher than in the subsequent years, possibly confirming the success of the 2016/2017 interventions to improve hydrodynamic circulation.
However, in 2020, there was no excess biomass to be removed; thus, it could be interesting to highlight, in further studies, the possible correlations between the absence of excess biomass and the restrictive measures adopted to respond to the COVID-19 pandemic.
In 2022, another dangerous bloom (caused by drought and high temperatures) caused severe troubles in the lagoon’s ecosystem, with anoxic crises that led to fauna die-offs, along with the correlated economic losses, the locals’ general worries and preoccupations, which are forced to “fish algae” to spare the residual low levels of dissolved oxygen [79,80]
Given that this real scenario relies on the presence of a landfill and a composter, as reported in Appendix A, for indicative reasons, capital costs per hectare for a landfill structure installation, and its end-life costs [81]. Whilst the composter’s installation capital costs are available indicatively in this work [82], for the end-life costs both for the composter and for the scenarios’ bio-plants discussed in the next sections, a table with demolition expenditure is reported at the end of Appendix A.

4.3.2. Scenarios’ Common Grounds

The scenarios analyzed in this study consist of various biorefinery approaches, which differ in terms of processes, complexity, capacity, flexibility, feedstock/s, and product/s; in other words, there is no common structure or process. So, to avoid redundancies, in this first part, some common grounds are discussed where the idea is to stress the determination of the best approach toward algal biomass usage.
The first point is that scenarios capacities for algal biomass largely outmatch the Goros’ lagoon’s potential production; in fact, during a HAB situation, the biomass removed is an average of 160 tonne/day [78]. Therefore, the focus of the comparison should be set on the optimal usage of the biomass rather than calculating the proper plant scaling. However, it must be pointed out that, given a standard scale and capacity, the industrial complexity will set a difference among the cases by having a proportional, and not negligible, impact only on the end-life demolition costs. Speaking of costs, the only adjustment to data is the actualization to 2021 euros (In addition, considering inflation on dollars for each case and the change rate with 2021 euros).
Second, to make confrontations among cases, the starting biomass composition: “macro- or micro-algae” and “chloro-, rhodo- or ochro-phytha”, is relatively not considered since, in general, the processes are based on bromatological composition rather than the phylum. However, a crucial hidden factor is that algal biomass in each case is acquired as a resource; thus, the selling price of the final product/s will depend mainly on this expenditure, and since algae production is an uncommon activity, it is rather expensive. In our case, instead, the biomass costs are mainly the ones for removing excess biomass, of which we have some cues in the table, thus implying cheaper final product/s, more competitive on markets.
Another point concerns the adaptability of all bio-plants with symbiotic satellite structures, which push biomass exploitation even further. For example, incinerators for heat and energy production and fermenters to produce biogas that can (fully or partially) respond to the factory’s energy demand. In addition, it is possible to have a small structure to pack and prepare the incinerator’s ashes, with the possibility of recovering metals prior to being sent to the landfill or preparing the completely exhausted biorefinery organic waste, such as a digestate cake (from satellite fermenters), to be used as a soil conditioner, or to be sent to a landfill.
In addition, they are easily connectable with innovations and renewable in general, for example, with a hypothetical wind/wave-and-macroalgae marine farm combination plant. The latter will also answer the problem of using seasonal biomass and the consequent instability of the feedstock flow, given the episodic nature of the HABs. Therefore, a small-scale plant with storage for seasonal biomass should be critically studied, or a larger, combined biorefinery–algal farm plant should be designed. The latter could open opportunities for terrestrial microalgae farms and/or marine structures that can be built coupled with wind, waves, shrimps, fish, and bivalve farms [50,82,83,84,85].
Last, the industrial complexity, which can be assumed as the phase (I, II, and III) of the plant, will impact the construction costs and demolition costs, of which there is a table in Appendix A.

4.3.3. Scenarios Description

In this subsection, the approaches are described, and at the end, a resume table (Table 2) with technicalities is available. The benefits and costs for the CBA come from the following techno-economic papers [52,53,86,87]. These scenarios are chosen based on “biomass usage” criteria, starting with the sole production of biofuels, then biofuels plus a single compound of interest, then a full biorefinery that produces biofuels and multiple products, and last, a biorefinery without biofuels.

First Scenario [52]: “Biofuels Only”, “1”

It is quite straightforward: the bio-plant produces biodiesel starting from algal biomass, with a satellite that produces bioethanol through fermentation. Basically, it exploits the biomass fatty component and the final exhausted biomass to produce biofuels. Despite the relatively simple structure and efficiency, this kind of approach is not very resilient on the market given the “one in/one out” formula typical of the phase I structure, which is also rather inflexible toward changes but well-performing.

Second Scenario [88]: “Biofuels + One Bioproduct” “2 a/b”

This case consists of two scenarios, where there is a common industrial base that produces only ethanol and another that also has a line for the side-stream production of a functional product accordingly to the biomass composition under study, in this case, alginate. Therefore, this case brings by itself a phase I and a phase “I/II” confrontation (meaning that there is an extra layer of industrial complexity, placing the overall complexity somewhat between phases I and II). However, in this paper, some data are lacking; therefore, some approximations are made to carry out the CBA. Specifically, we approximated the values of “fixed and variable operating costs” by proportioning the other scenarios’ trends of these costs, then adjusting for the operating total, which was available. Unfortunately, the total capital investment was not available; thus, it was approximated by rescaling the values of cases 2c and 2d (which are the most similar) based on the feedstock annual capacity. Eventually, the bio-plant dimensions and capacities introduce the problem of market saturation since the alginate produced by that single plant will outmatch the whole global demand (even though it is increasing annually).

Third Scenario [87]: “Multi-Product Biorefinery”, “2 c/d”

This case is quite similar to the previous one, but in this case, there are more side-stream functional product lines, which lead to a full phase II biorefinery. It is to be noted, however, that this kind of approach is extremely dependent on the biomass composition and phylum/phyla’s biological peculiarities in terms of active biomolecules, which can be used as food supplements, anti-inflammatory drugs, and more. In this case, bioethanol, mannitol, alginate, proteins, and soil conditioner are produced.

Fourth Scenario [86]: “Bioproducts”, “3”

This last case is not fuel-oriented; instead, it represents a refinery approach to produce food, food supplements, fodder, and fertilizers starting from various algal biomasses. This alternative is a phase II biorefinery that exploits different feedstocks and produces multiple products, such as laminarin and fucoidan. Similar to the previous multiproduct case, also this structure is resilient toward market volatility and changes, but since the idea is to use natural algae, these can collect pollutants from the environment, which might represent a problem in terms of products for human consumption.

4.3.4. Resume Table

Data regarding the above-mentioned scenarios are reported in the table below (Table 2), of which some concerns constitutive, purpose, and complexity parameters, and the remaining involve fixed and variable capital expenditure as well as the income; each monetary value has been actualized in 2021 dollars, so to have fair confrontations.
The table shows three regions, ranging from “biofuel only” to “bioproducts only”, between the four sub-scenarios of “biofuels + product/s”.
Table 2. Resume table of all scenarios, actualized in 2021 million euros.
Scenarios:1: Biofuels2a–d: Biorefineries3: Food/Fodder
Phase III/IIIIIII
Product/sBiodiesel, bioethanol, biogasBioethanolbioethanol + alginatebioethanolbioethanol + mannitol, alginate, proteins, and soil conditionerfood supplement: laminarin + fucoidan, and fertilizers
building time (months)6 (planning) + 246 (planning) + 246 (planning) + 24363612
months for startup6: 50% gain with 75% variable expenses6: 50% gain with 75% variable expenses6: 50% gain with 75% variable expenses33none (paper assumption)
Variable operating costs (M€/Y)237.39186.23695.9363.37107.9649.61
Fixed operating cost (M€/Y)15.0111.5843.273.8710.80.54
Total operating costs (M€/Y)252.4197.81739.1967.24117.5850.15
total direct cost (M€)298.24257.51514.14181.06361.543.12
total indirect cost (M€)178.88154.48308.43108.66216.861.87
total capital investments (M€)503.05435.94870.37307.09613.135.4
Total annual sales (M€/Y)695.33218.63832.8929.22370.46166.15

5. Cost–Benefit Analysis, Results

5.1. NPV

Using data from Table 2 and by applying “Equation (1)”, Net Present Values are produced in millions of euros and reported on the right side of the table below (Table 3) in relation to the discount rate, which has been chosen as a range from 0.5 to 10%.
All alternatives show a decreasing pattern in agreement with the NPV equation, except for “Multiproduct biorefinery 2.c”, which shows an increasing pattern due to the fact that the NPV is always negative throughout the totality of the timeframe; therefore, this output can be discarded.
Hence, it can be observed that the most remunerative scenario is the “biofuels only” oriented, followed by the “multiproduct biorefinery”; the third one for economic convenience is the “multiple products”. From this elaboration, it appears that producing only bioethanol could lead to a failure path since, in both cases, the NPV with 5% is negative. In contrast, bioethanol production plus one bioproduct appears slightly more competitive but still not very profitable in the long run, given the major and more realistic discount rate.
In fact, an overall “negative perspective” has been adopted to represent the hindering factors towards a possible project, such as the alternatives studied; this topic will be discussed in detail in the next section.

5.2. Fixed Discount Rate

This case study can contain numerous and varied obstacles; hence, it was necessary to analyze the various scenarios through a spectrum of discounts, from 0.5% to 10%, similar to a sensitivity analysis for testing the sustainability of the circular tutelage project. Hence, with a 0.5% discount, a virtual income for the first scenario of more than ten billion is projected, in comparison to slightly more than two and a half billion with a discount of 10%: basically, a 75% income reduction. The comparison with other scenarios shows losses up to 80%, and some that are not resilient enough to produce positive incomes throughout the various discounts; thus, little to no sustainable.
In other words, the discount rate is substantially the representation of the level of confidence that future income streams will equal what it is projected today; hence, it is a measure of risk. In fact, a higher discount rate generally means that there is more risk associated with the investment opportunity. Therefore, future cashflows should be attuned to a greater discount rate percentage because they are less likely to be achieved. Conversely, if the investment is less risky, then theoretically, the discount rate should be lower on the discount rate spectrum. Thus, given the uncertainties related to the markets’ acceptability of bioproducts, social fears, distrust, pollution, and regulations, a high risk for this investment is present. Therefore, a discount rate of 10% should be chosen to compensate for this multifaced risk. However, the overall sustainability and the positive economic and environmental effects coming from the restored ecosystem quality and its services can stabilize these uncertainties, lowering the overall risk and fear of investments. Eventually, a discount rate of 5% is chosen for further analyses and comparisons among scenarios as the most representative of the trade-off between risks and benefits proper of this case study.
In addition, the breakeven point occurrence is a key factor in determining the robustness of an alternative in general and in comparison to the others. In a few words, the breakeven point is the year when the cashflow hits zero, and it starts to hit positive values, thus positive revenues.
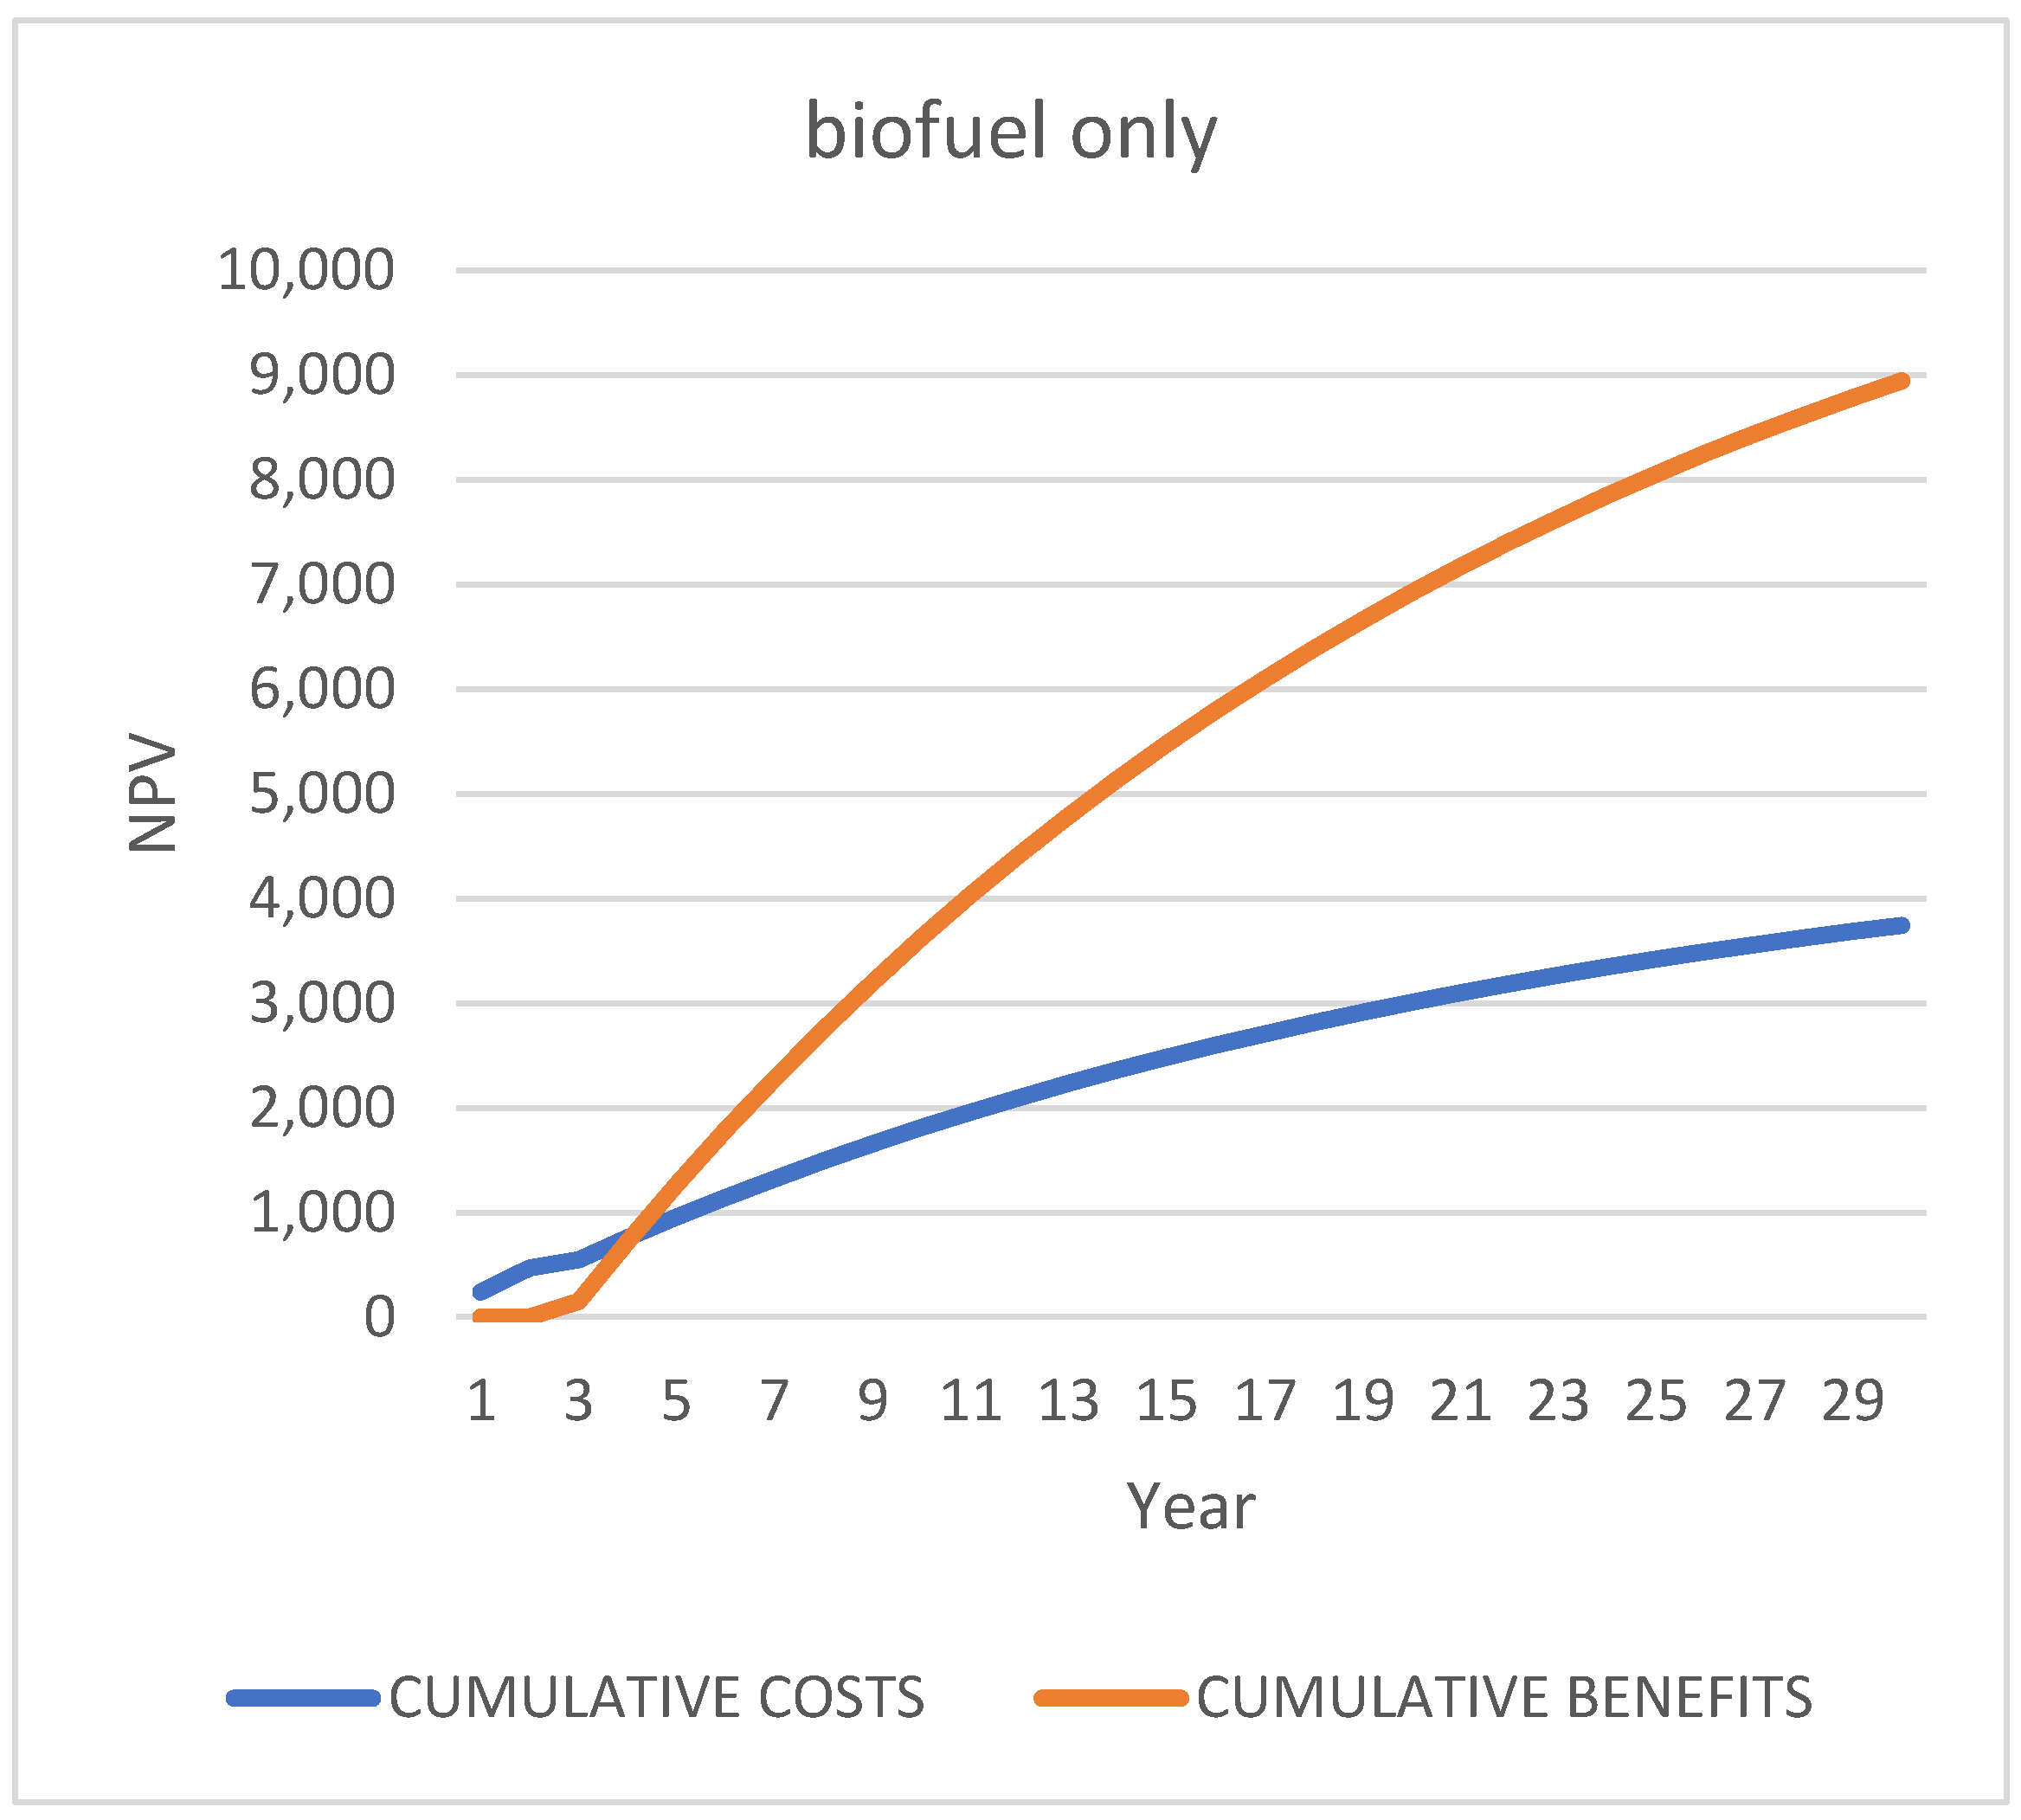
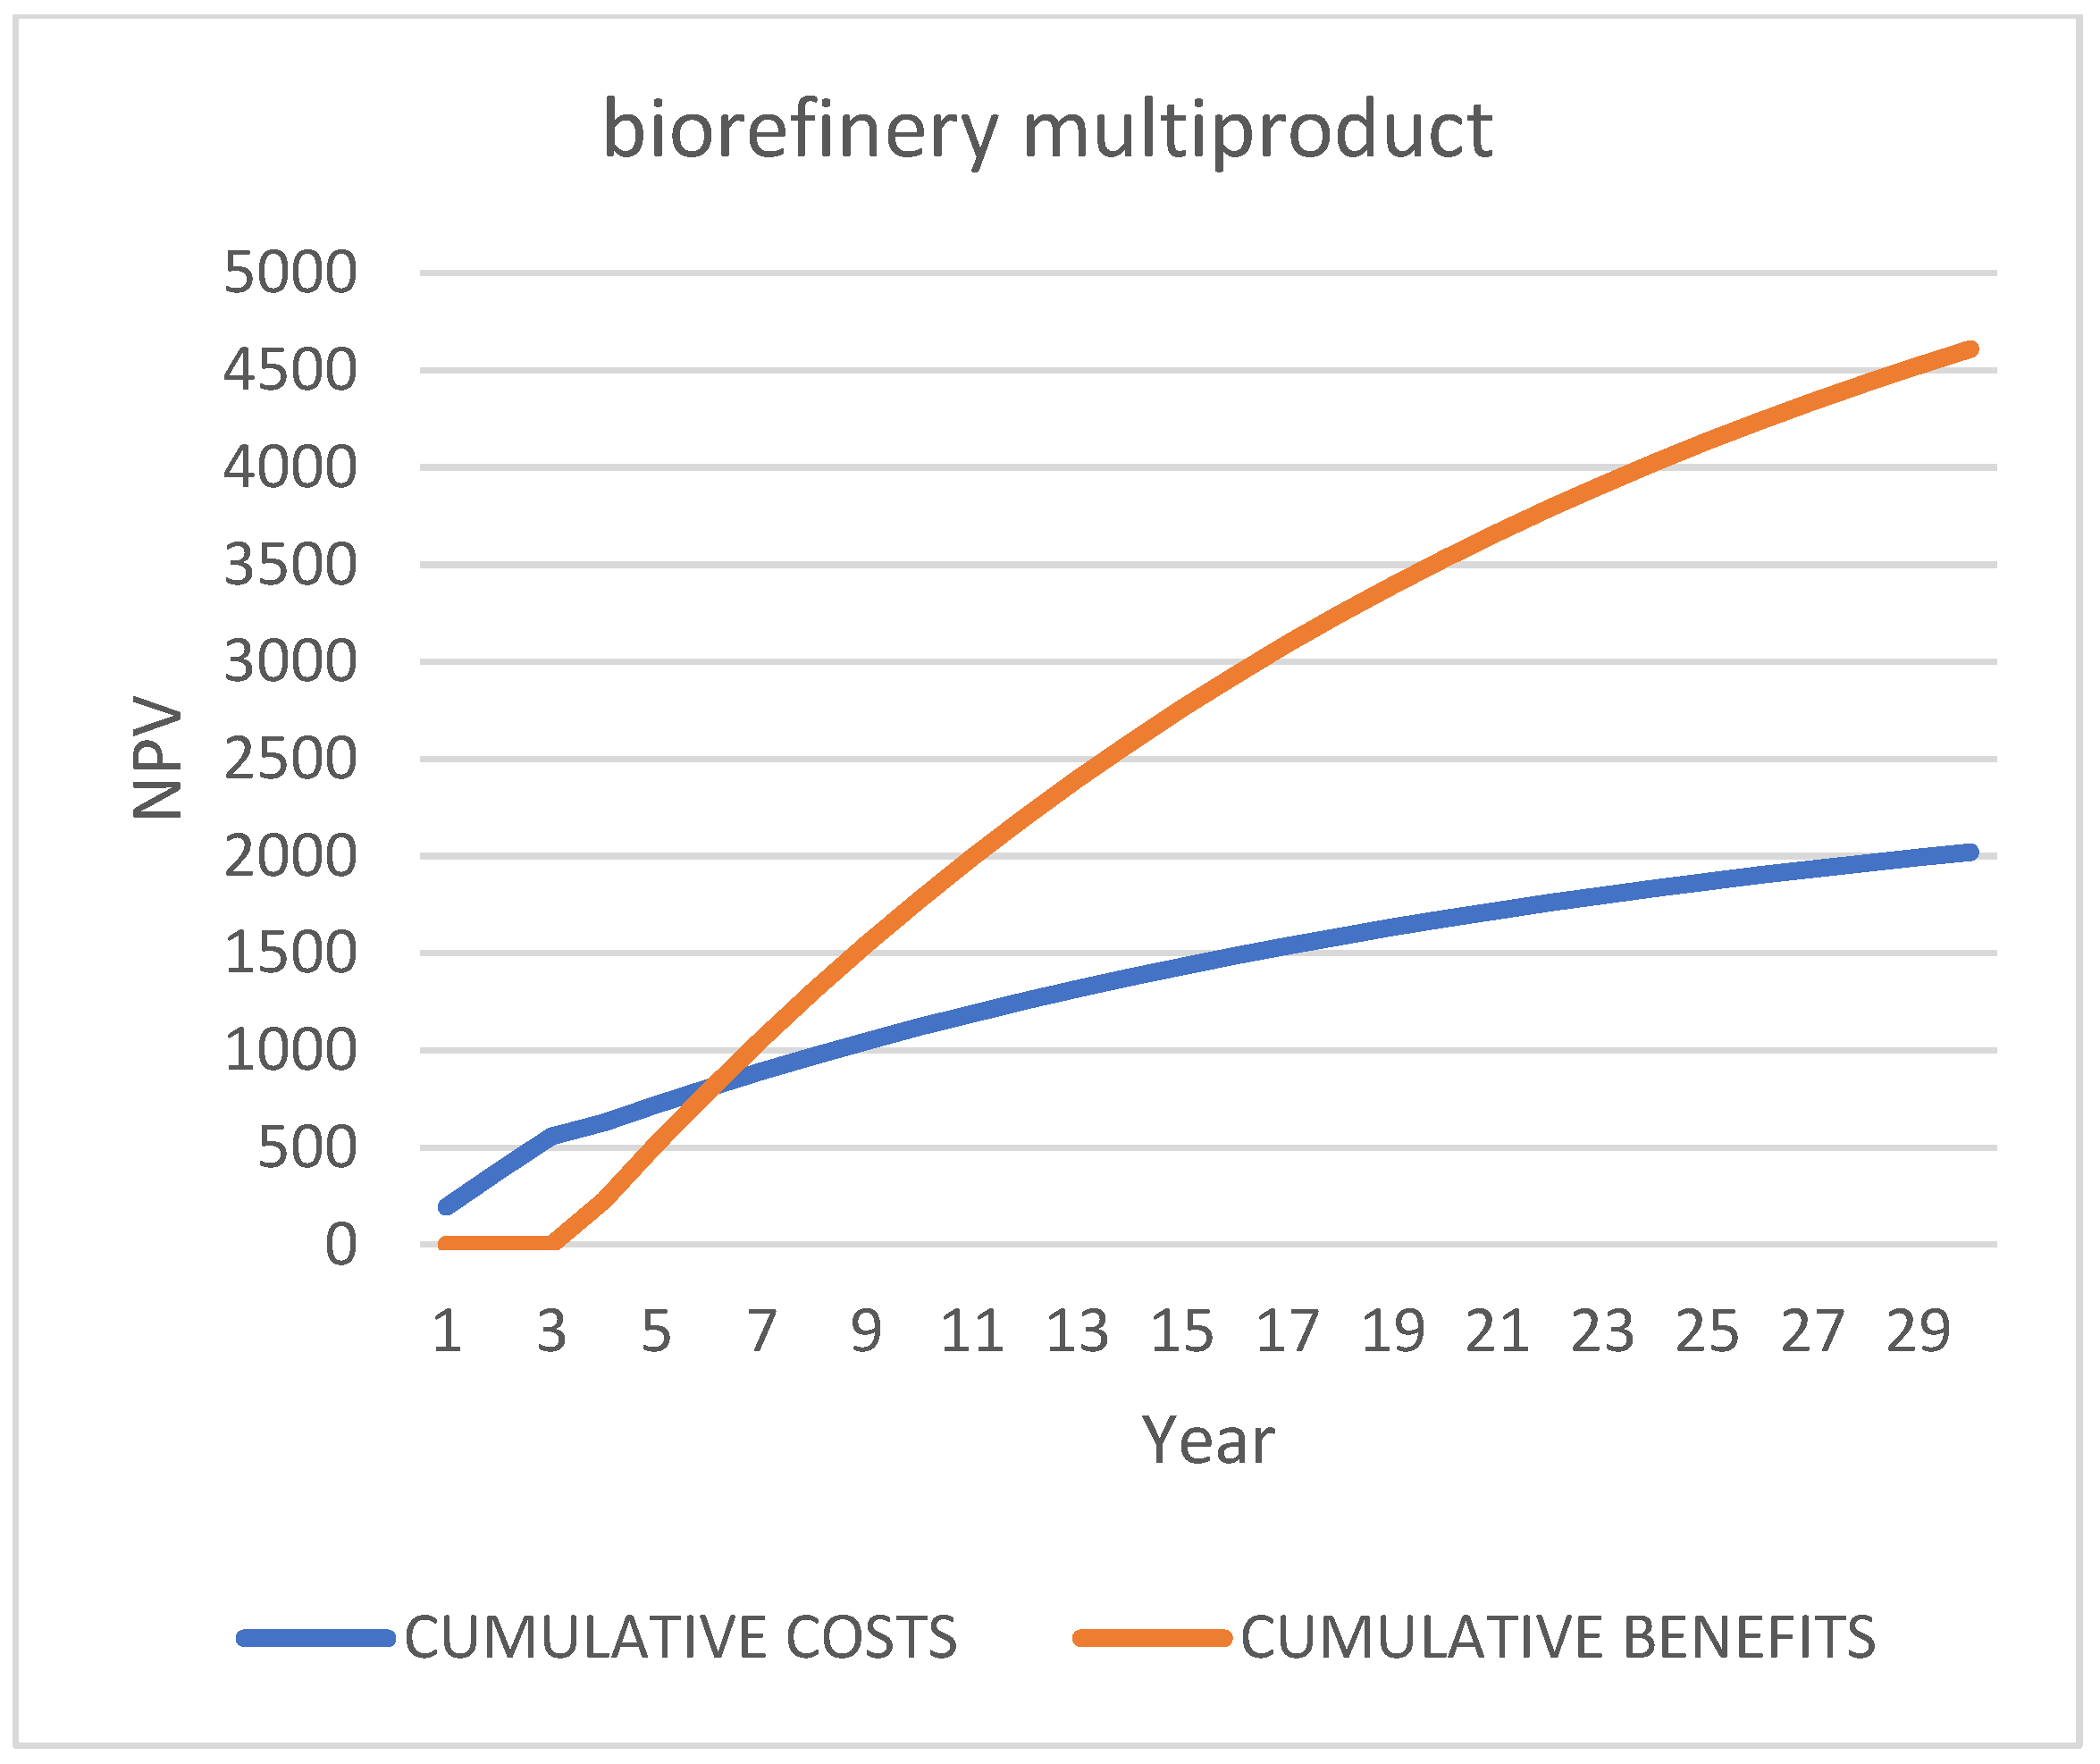
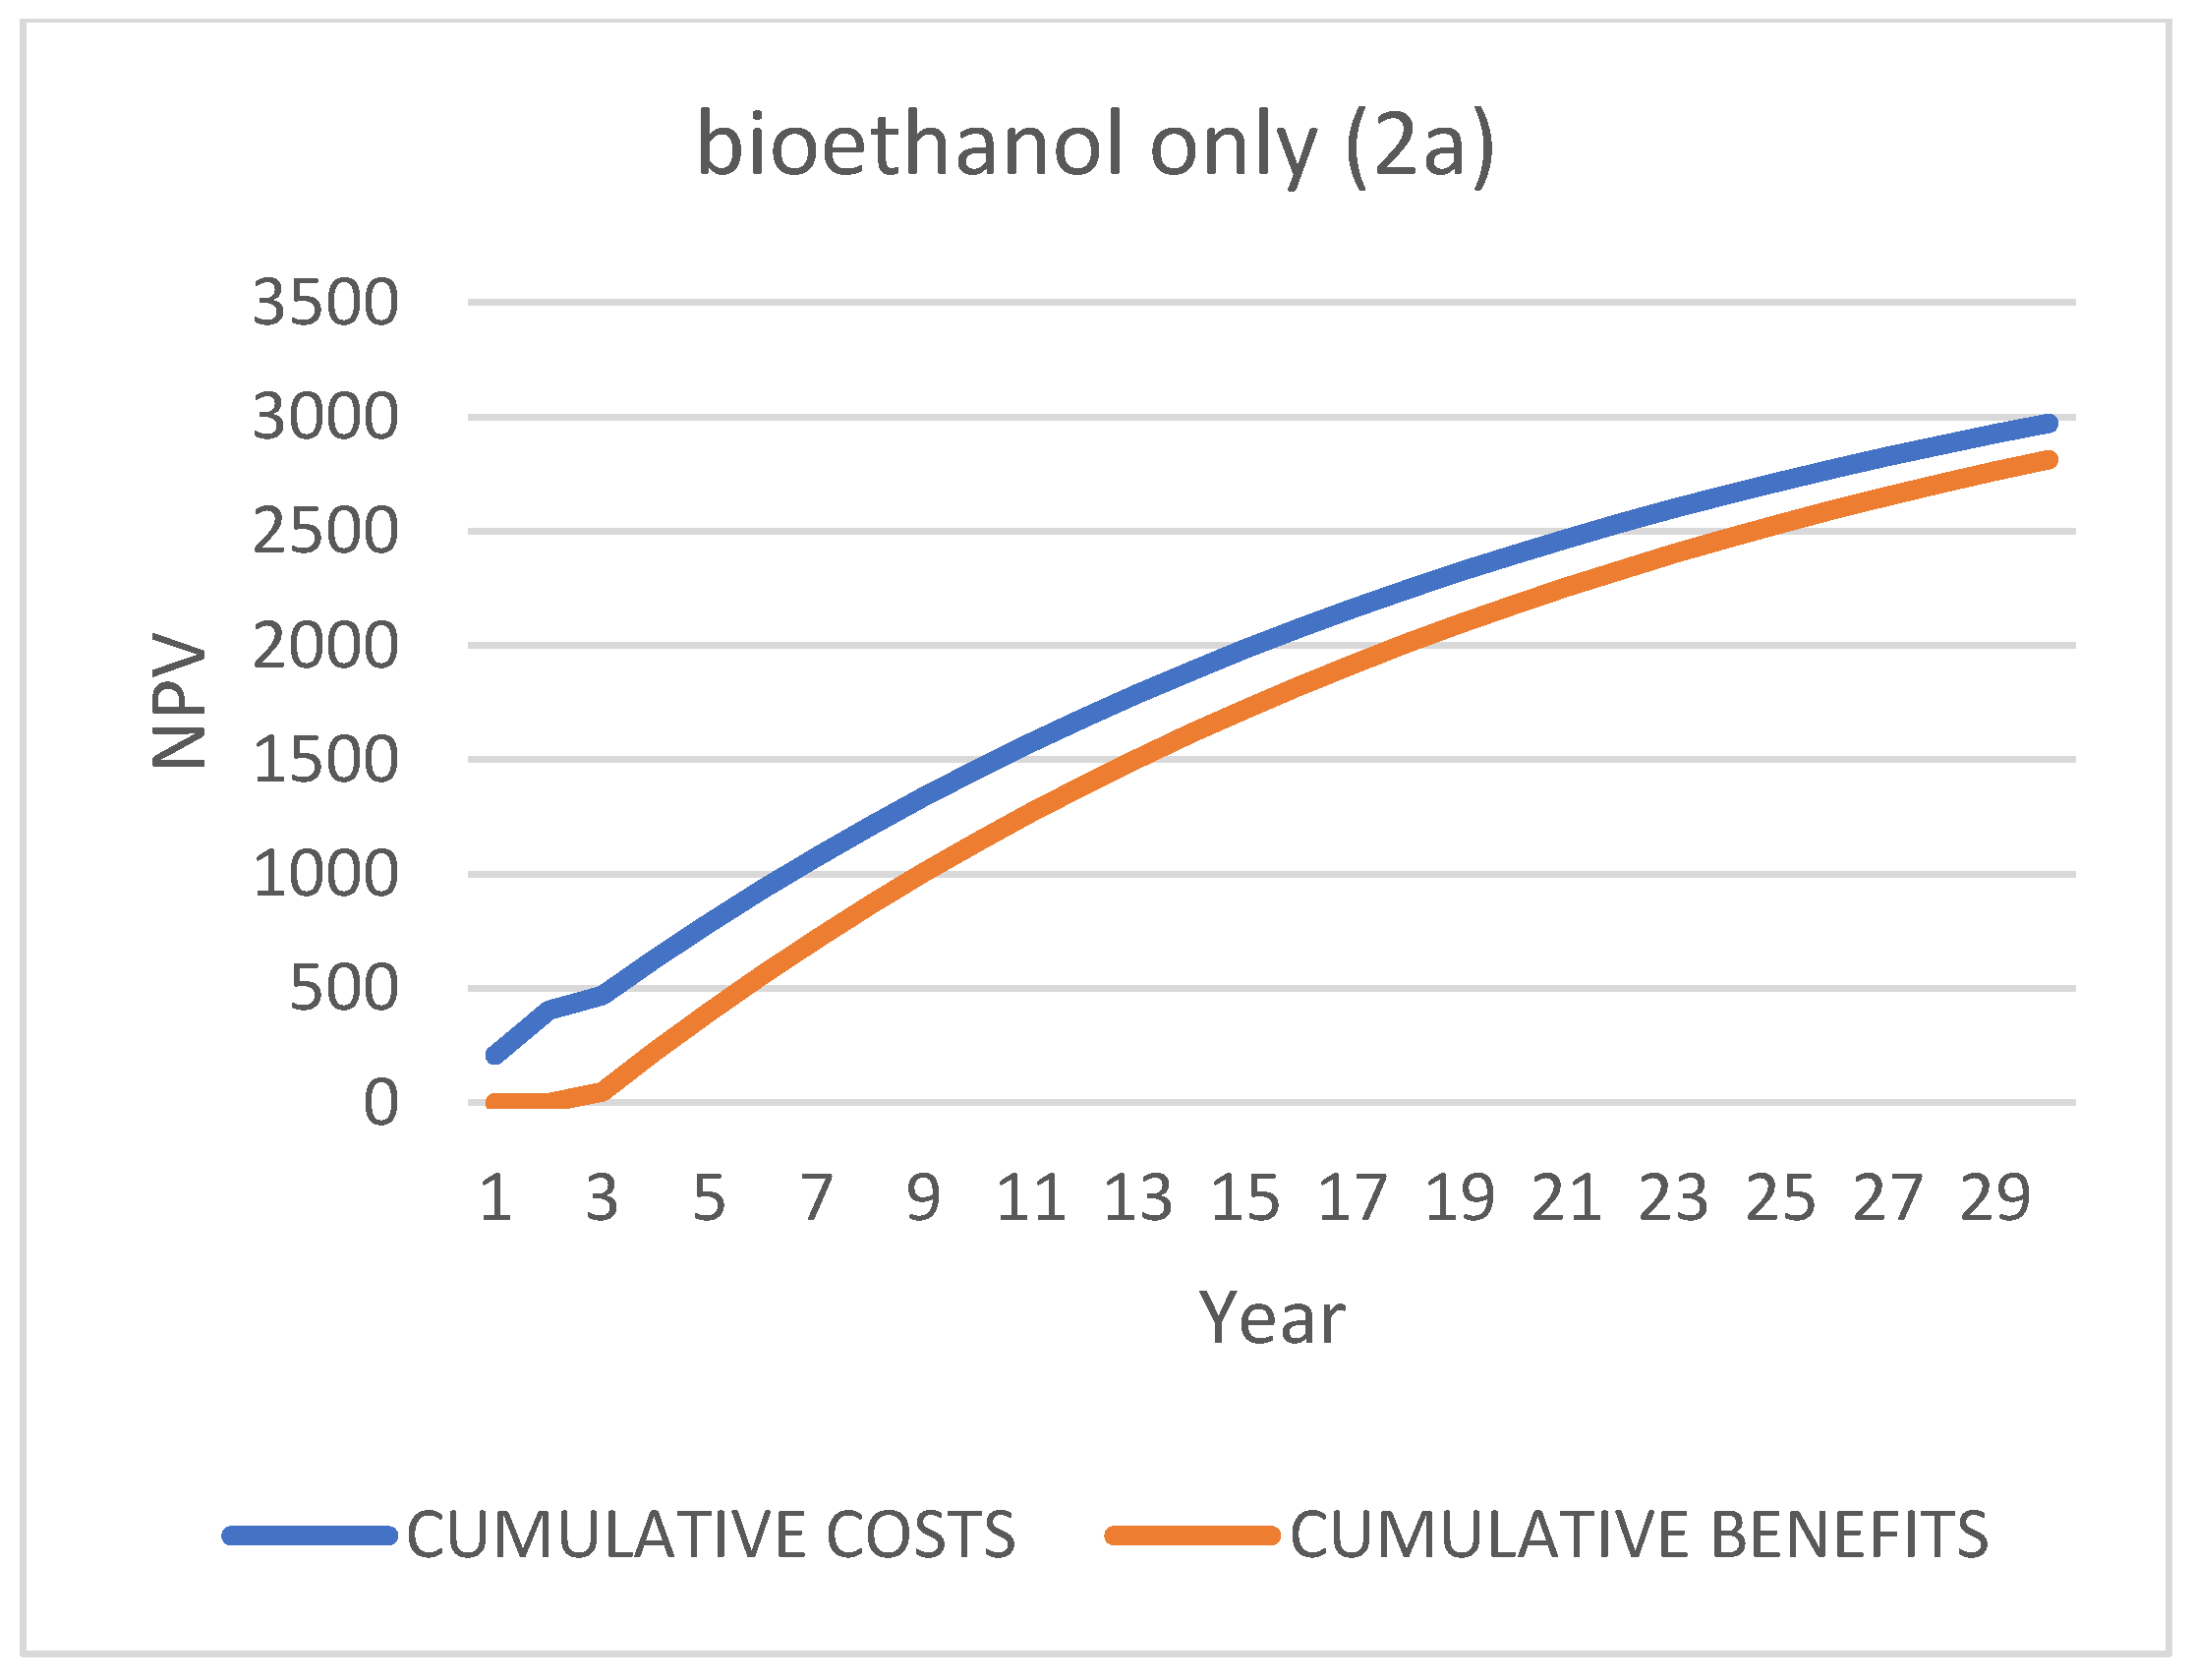
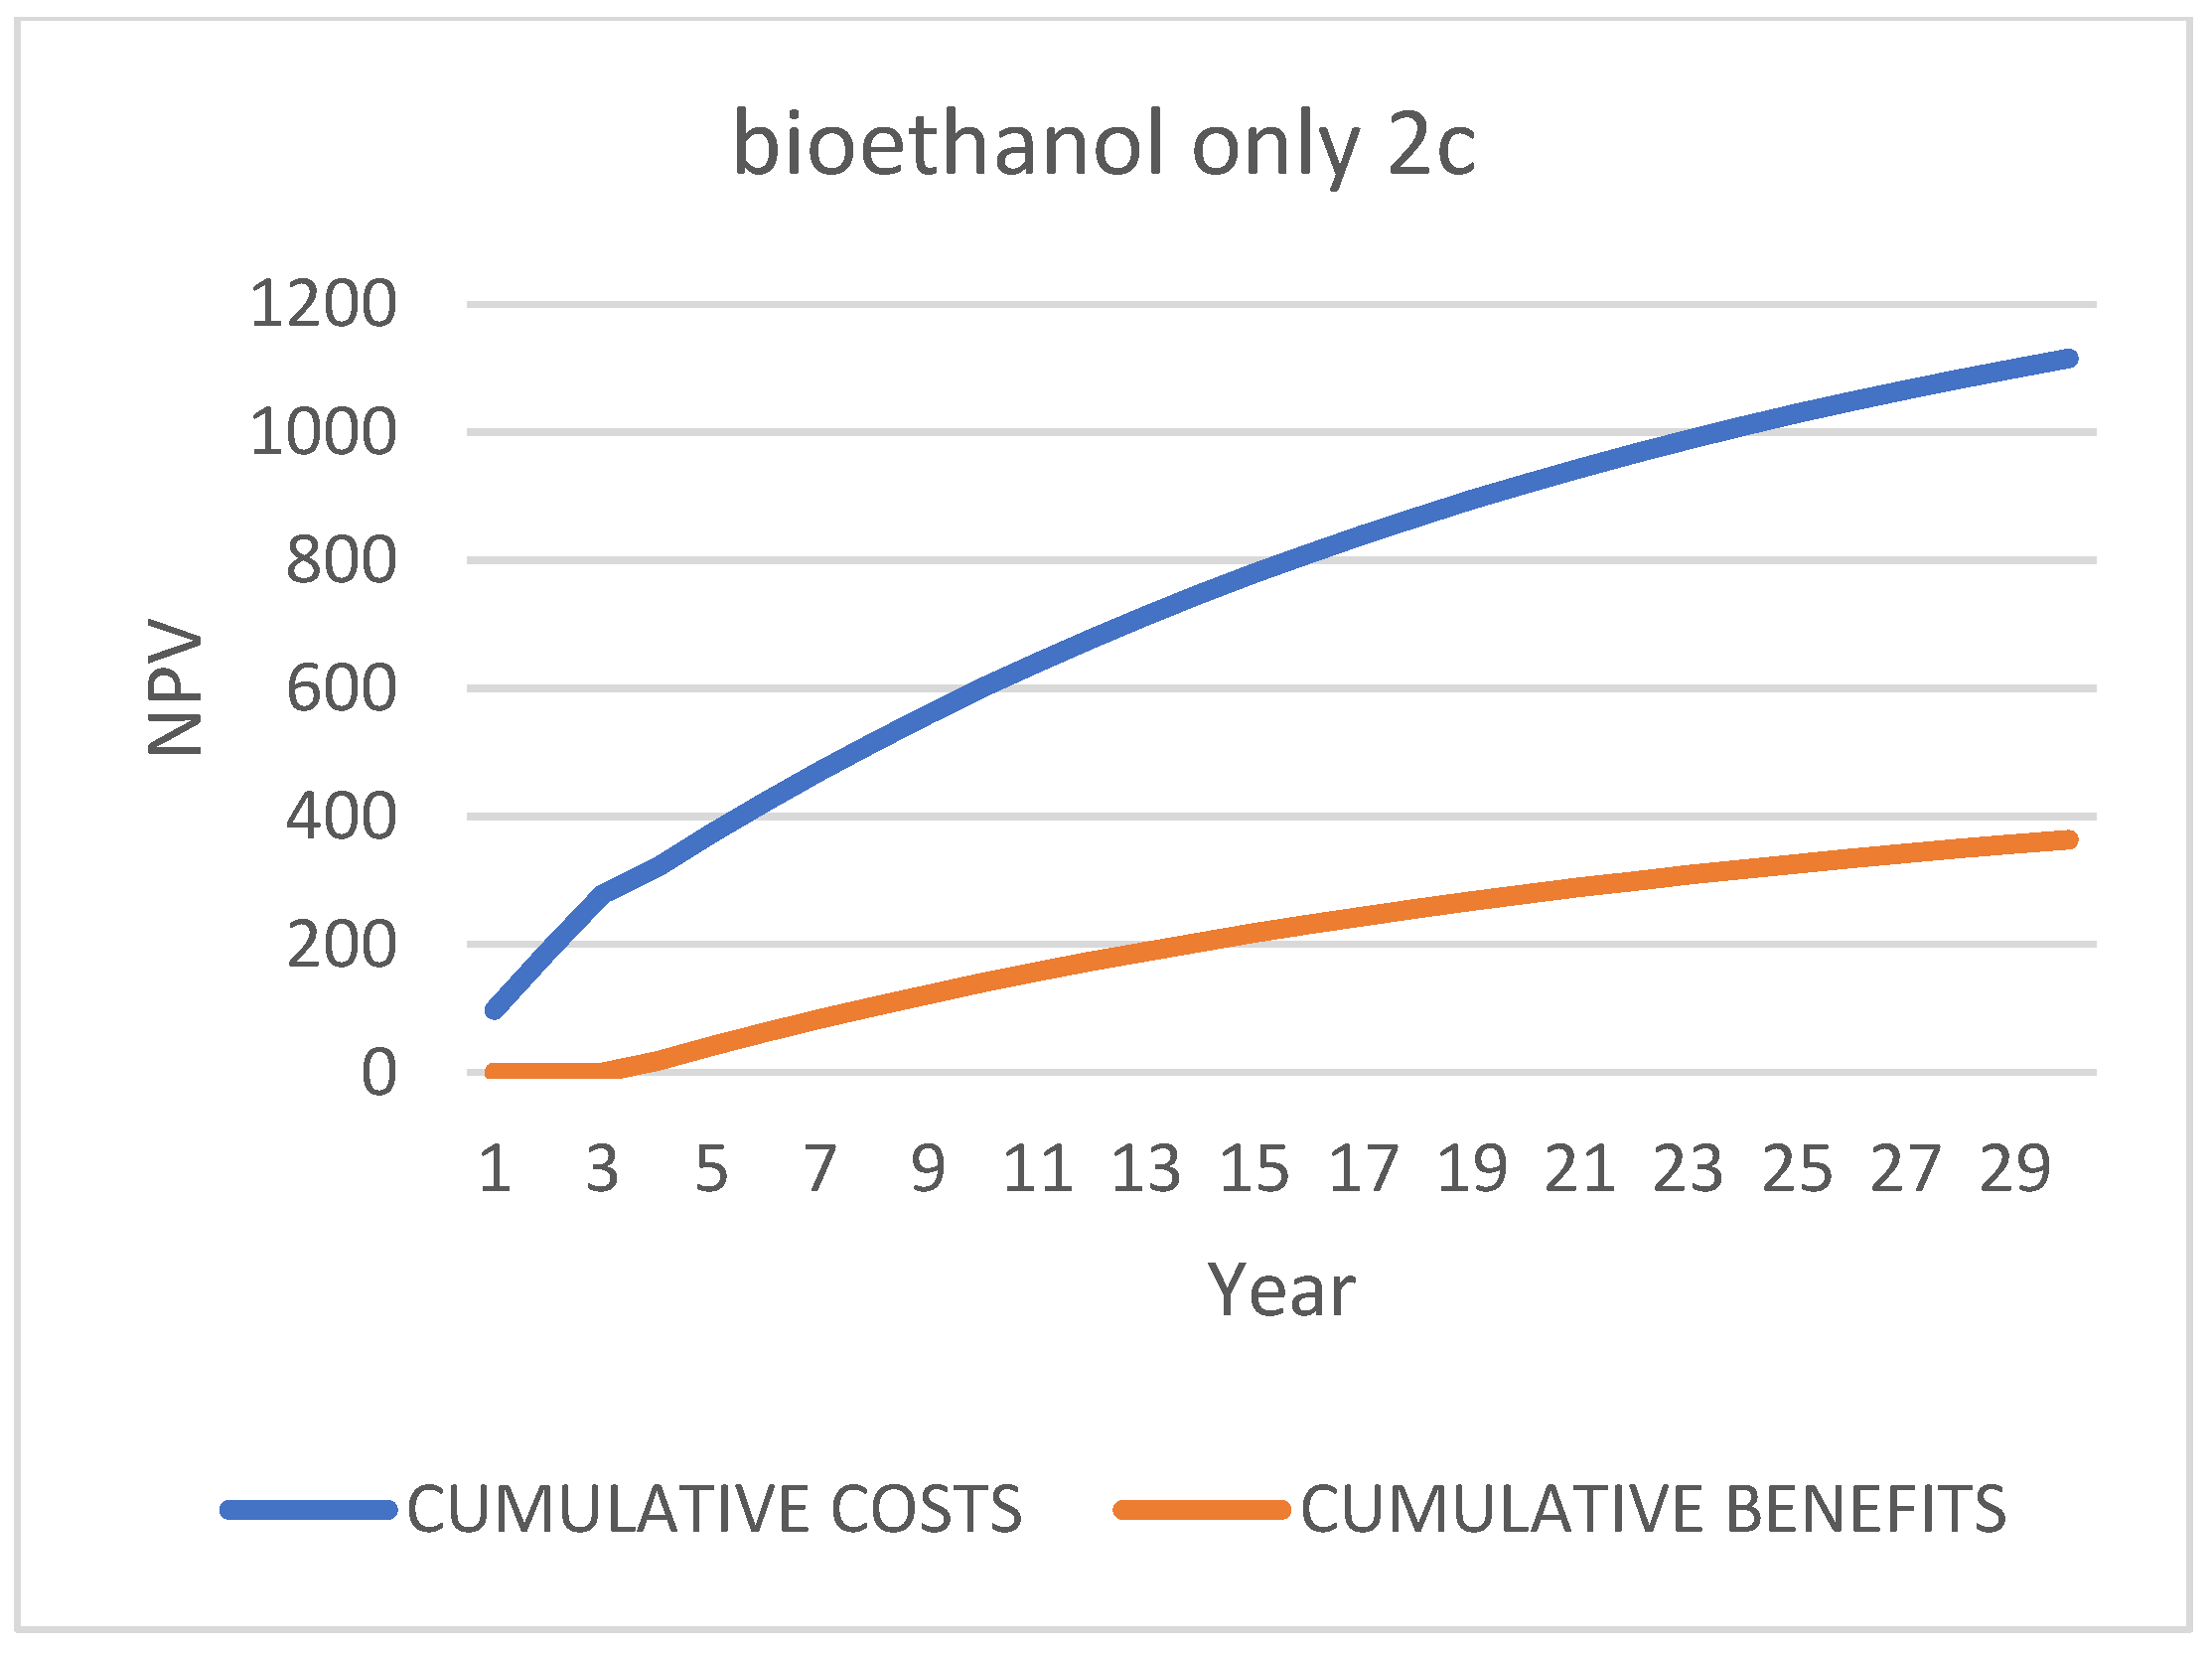
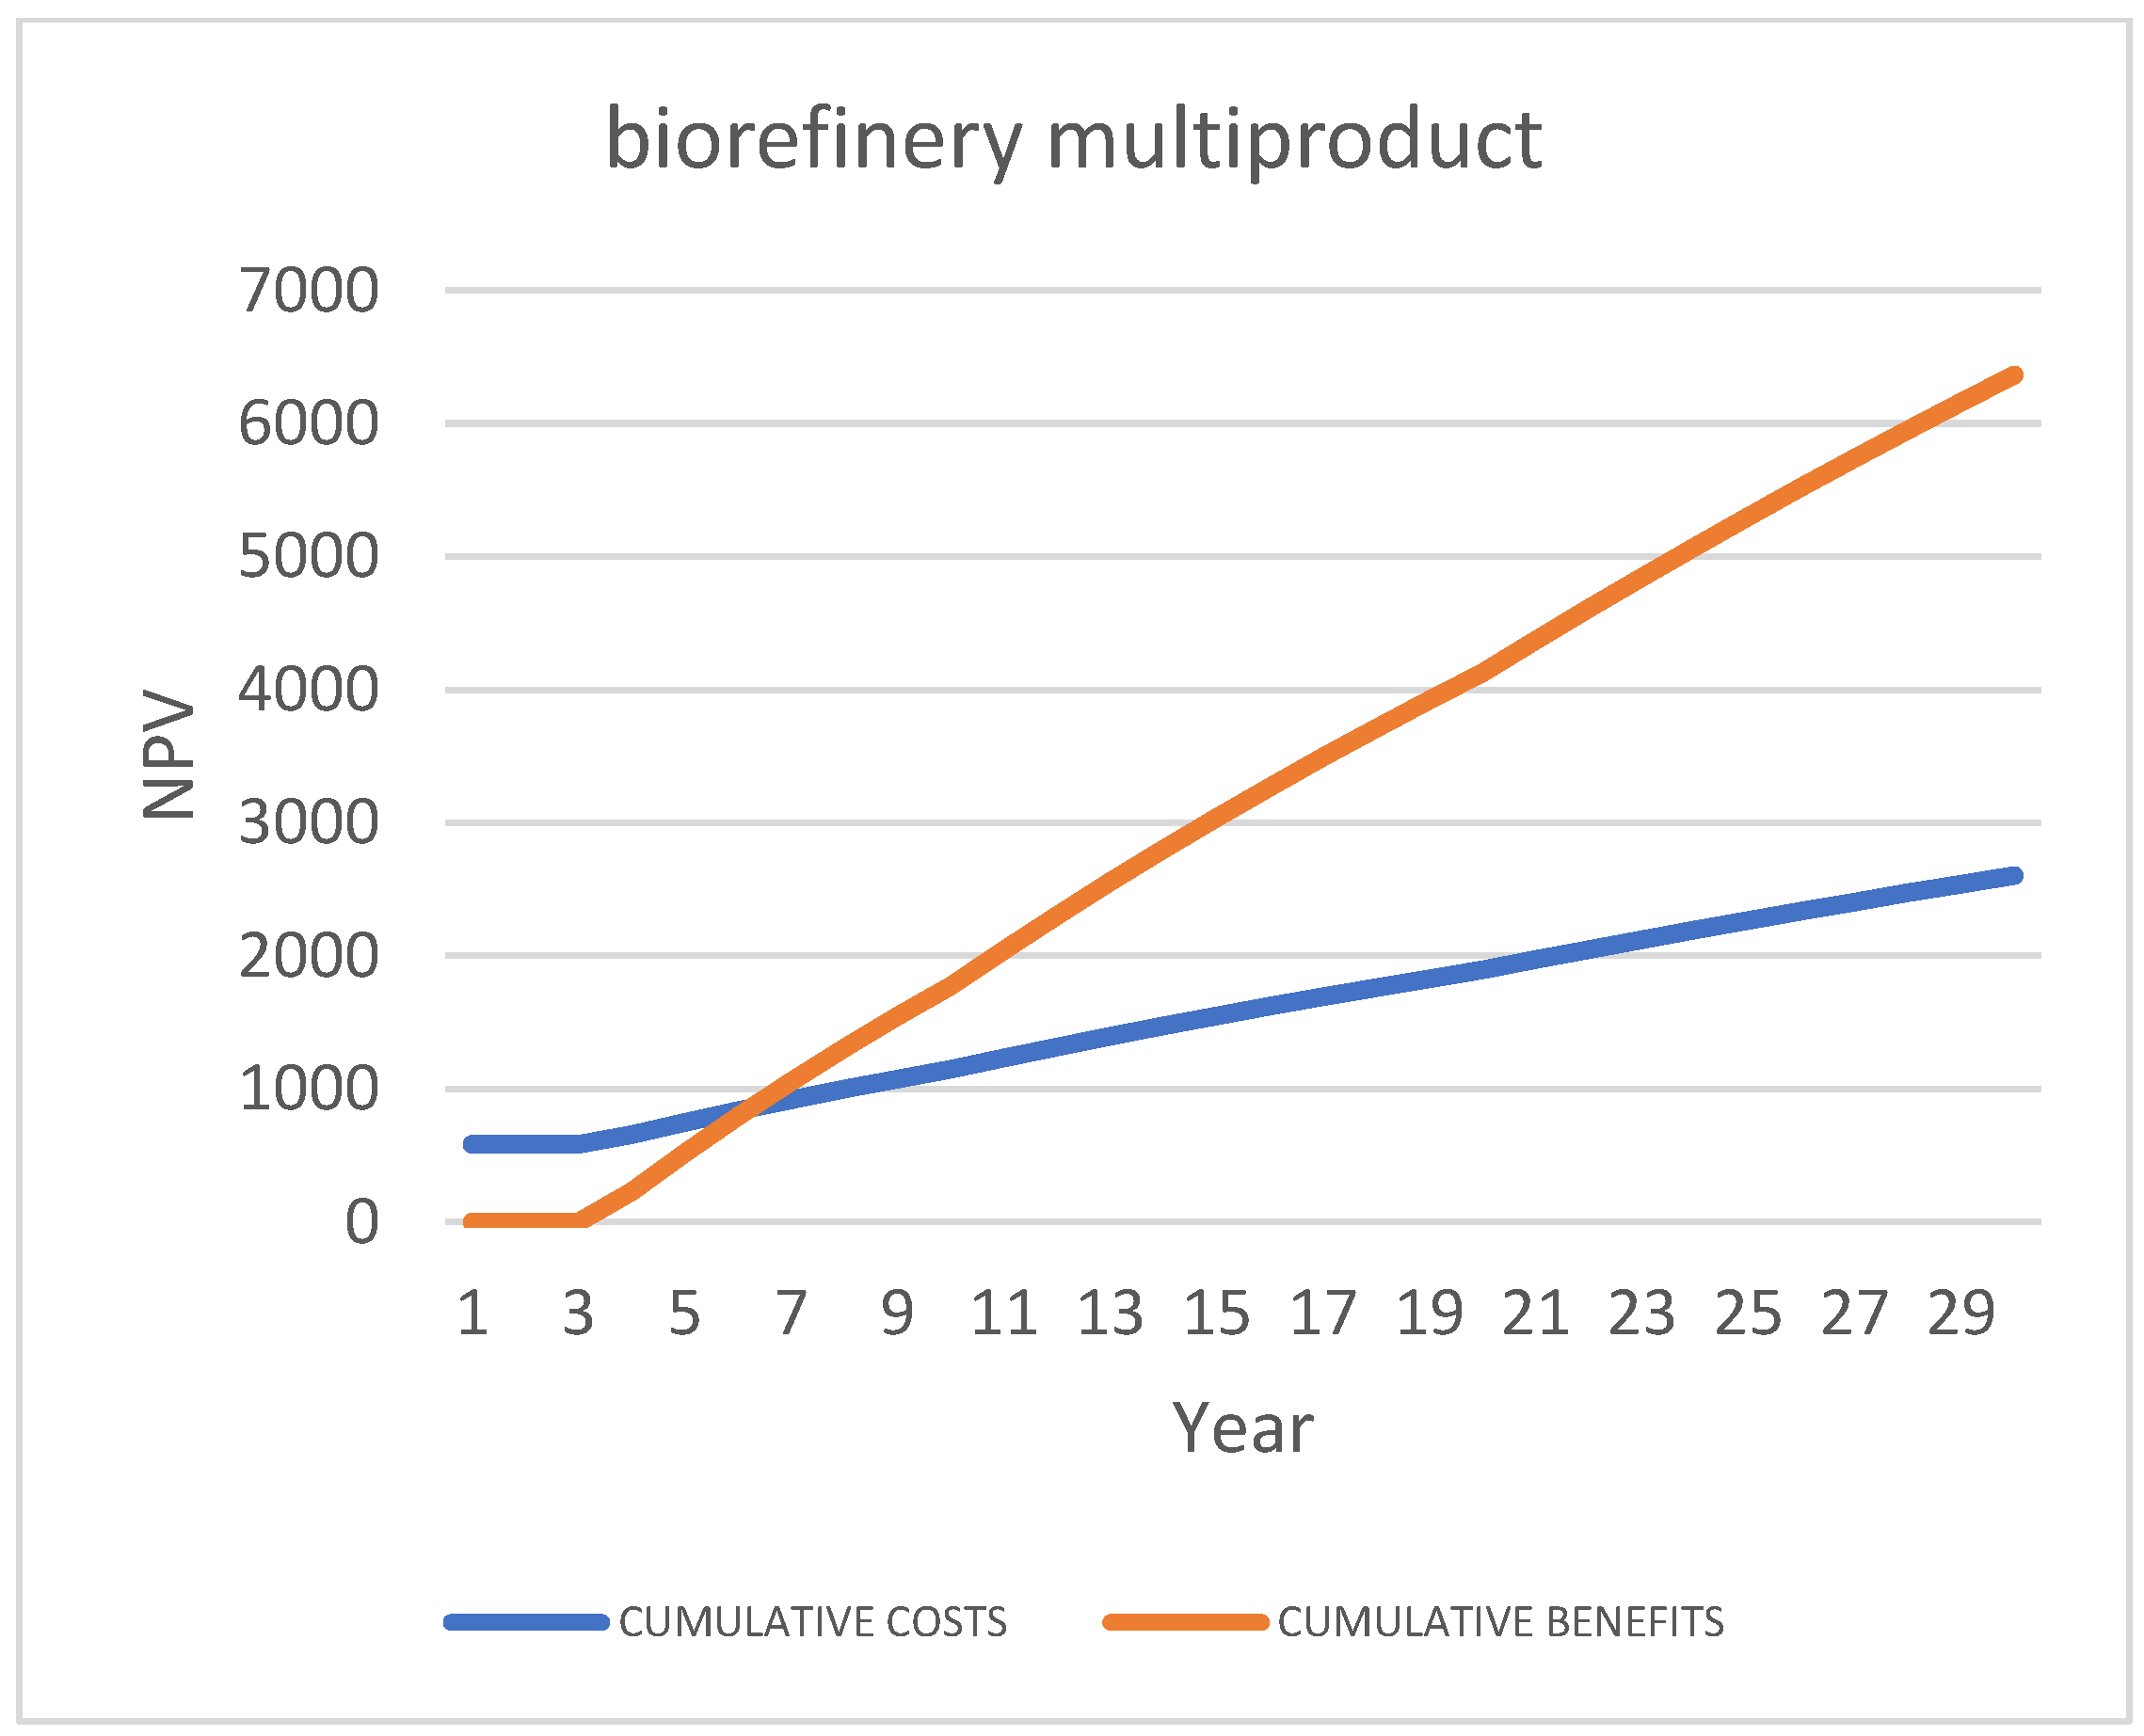
Therefore, according to the results of the CBA, over a fixed timeframe of thirty years, the best scenario (biofuel only) is supposed to return roughly 5.19 billion euros, while the second-best choice (biorefinery multiproduct) returns slightly less than 2.6 billion euros, around half of the first scenario, whereas the third most remunerative (bioproduct only) returns 1.6 billion, less than a third of the first scenario. These three best scenarios also have a breakeven point that falls within the short period of the fifth (Figure 6), the seventh (Figure 7), and the second year (Figure 8), respectively, which are also independent of the discount rate applied (the same year for all the discount rates). Other cases match the breakeven point in the nineteenth year for scenario 2b (biofuel + one bioproduct) (Figure 9), and none for scenario 2a (Figure 10) and scenario 2c (Figure 11) both bioethanol only; hence, highlighting the unprofitability of these latter alternatives, which fail to reach a positive balance. Hence, as previously introduced, the rational decision maker should opt for the first scenario, given the highest economic returns, faster breakeven, and lesser demolition costs; however, some limitations, such as biomass composition, pollution, social aspects, and industrial flexibility, can influence this choice.
Below, the cumulative costs vs. cumulative benefits Figures, with a 5% discount applied over thirty years, are reported; the match point of the two lines is the breakeven year.
From these figures, it can be noticed that the profitability is related to the bio-plant’s production purpose; in fact, the best outcome in terms of breakeven and income is the biofuels production plant followed by the biofuel and bioproducts one; therefore, various products to sell in different markets. In contrast, other scenarios achieve little to nothing due to narrow and limited product yield and are more sensitive toward market demand and acceptability. Eventually causing the failure and the impossibility of reaching breakeven and even repaying the initial investments. Indeed, many scenarios fail to reach profitability within 30 years, even with a lesser “punitive” discount rate, see Table 3.

5.3. Variable Discount Rate

Given the context’s complexity and the long term of this investment (thirty years), it could be more advantageous to study the NPV with a decreasing discount rate over time to match the need for increased sensitivity. In addition, the variable discount could intercept an initial distrust by the locals and the biomarket unreadiness, followed by gradual acceptance and market demand, hence, making a more flexible analysis.
This is achieved by dividing the future into three different sub-periods of ten years each, characterized by a decreasing discount rate; in detail, 5%, 3%, and 2% were chosen inspired by Weitzman (2001) [88]. Eventually, the output is 7.3 billion 2022 dollars for the “biofuel only” scenario and slightly less than 3.8 for the “biorefinery multiproduct” scenario, with a breakeven falling in the fifth and seventh year, respectively (Figure 12 and Figure 13), as with the previous setup.
Given that the ratio among these two alternatives is somewhat constant, as the first doubles the second, with both fixed (5%) and decreasing (5–3–2%) discount settings, a decreasing discount rate could be more suitable to intercept the increasing social comprehension, the increasing circular and sustainability trends of biofuels and bioproducts on the market, as well as the benefit consequent to the environmental relief because of this remediation act. Thus, this allows for stronger economic considerations, as well as the support of the foresight analysis based on social and environmental parameters.

6. Foresight Analysis

The second part of this study considers the key factors of pollution and social aspects for strengthening the best scenario in the CBA using SWOT foresight techniques, which is, after the next two sections, needed for context.

6.1. Chemical Pollution

In this section, the focus is set on the presence of pollution that threatens algal biomass exploitation. As a matter of fact, as described in previous sections, the usage of algal biomass is not a single and straightforward process, and various processes could co-exist with the purpose of extracting, isolating, transforming, and producing a single compound or family of compounds. Therefore, the presence of pollutants in the feedstock biomass can interfere with the performance of transformation and isolation processes, compromising the overall plant conversion efficiency. Pollutants, then, might also be present in the final product (e.g., co-extraction), causing extra costs for cleanup and purification, as in the by-products and wastes. A couple of examples: the overabundance of metals can force the biomass residues to the landfill rather than being used in cultivation, or the presence of pesticides can alter the extraction of organic bioactive molecules.
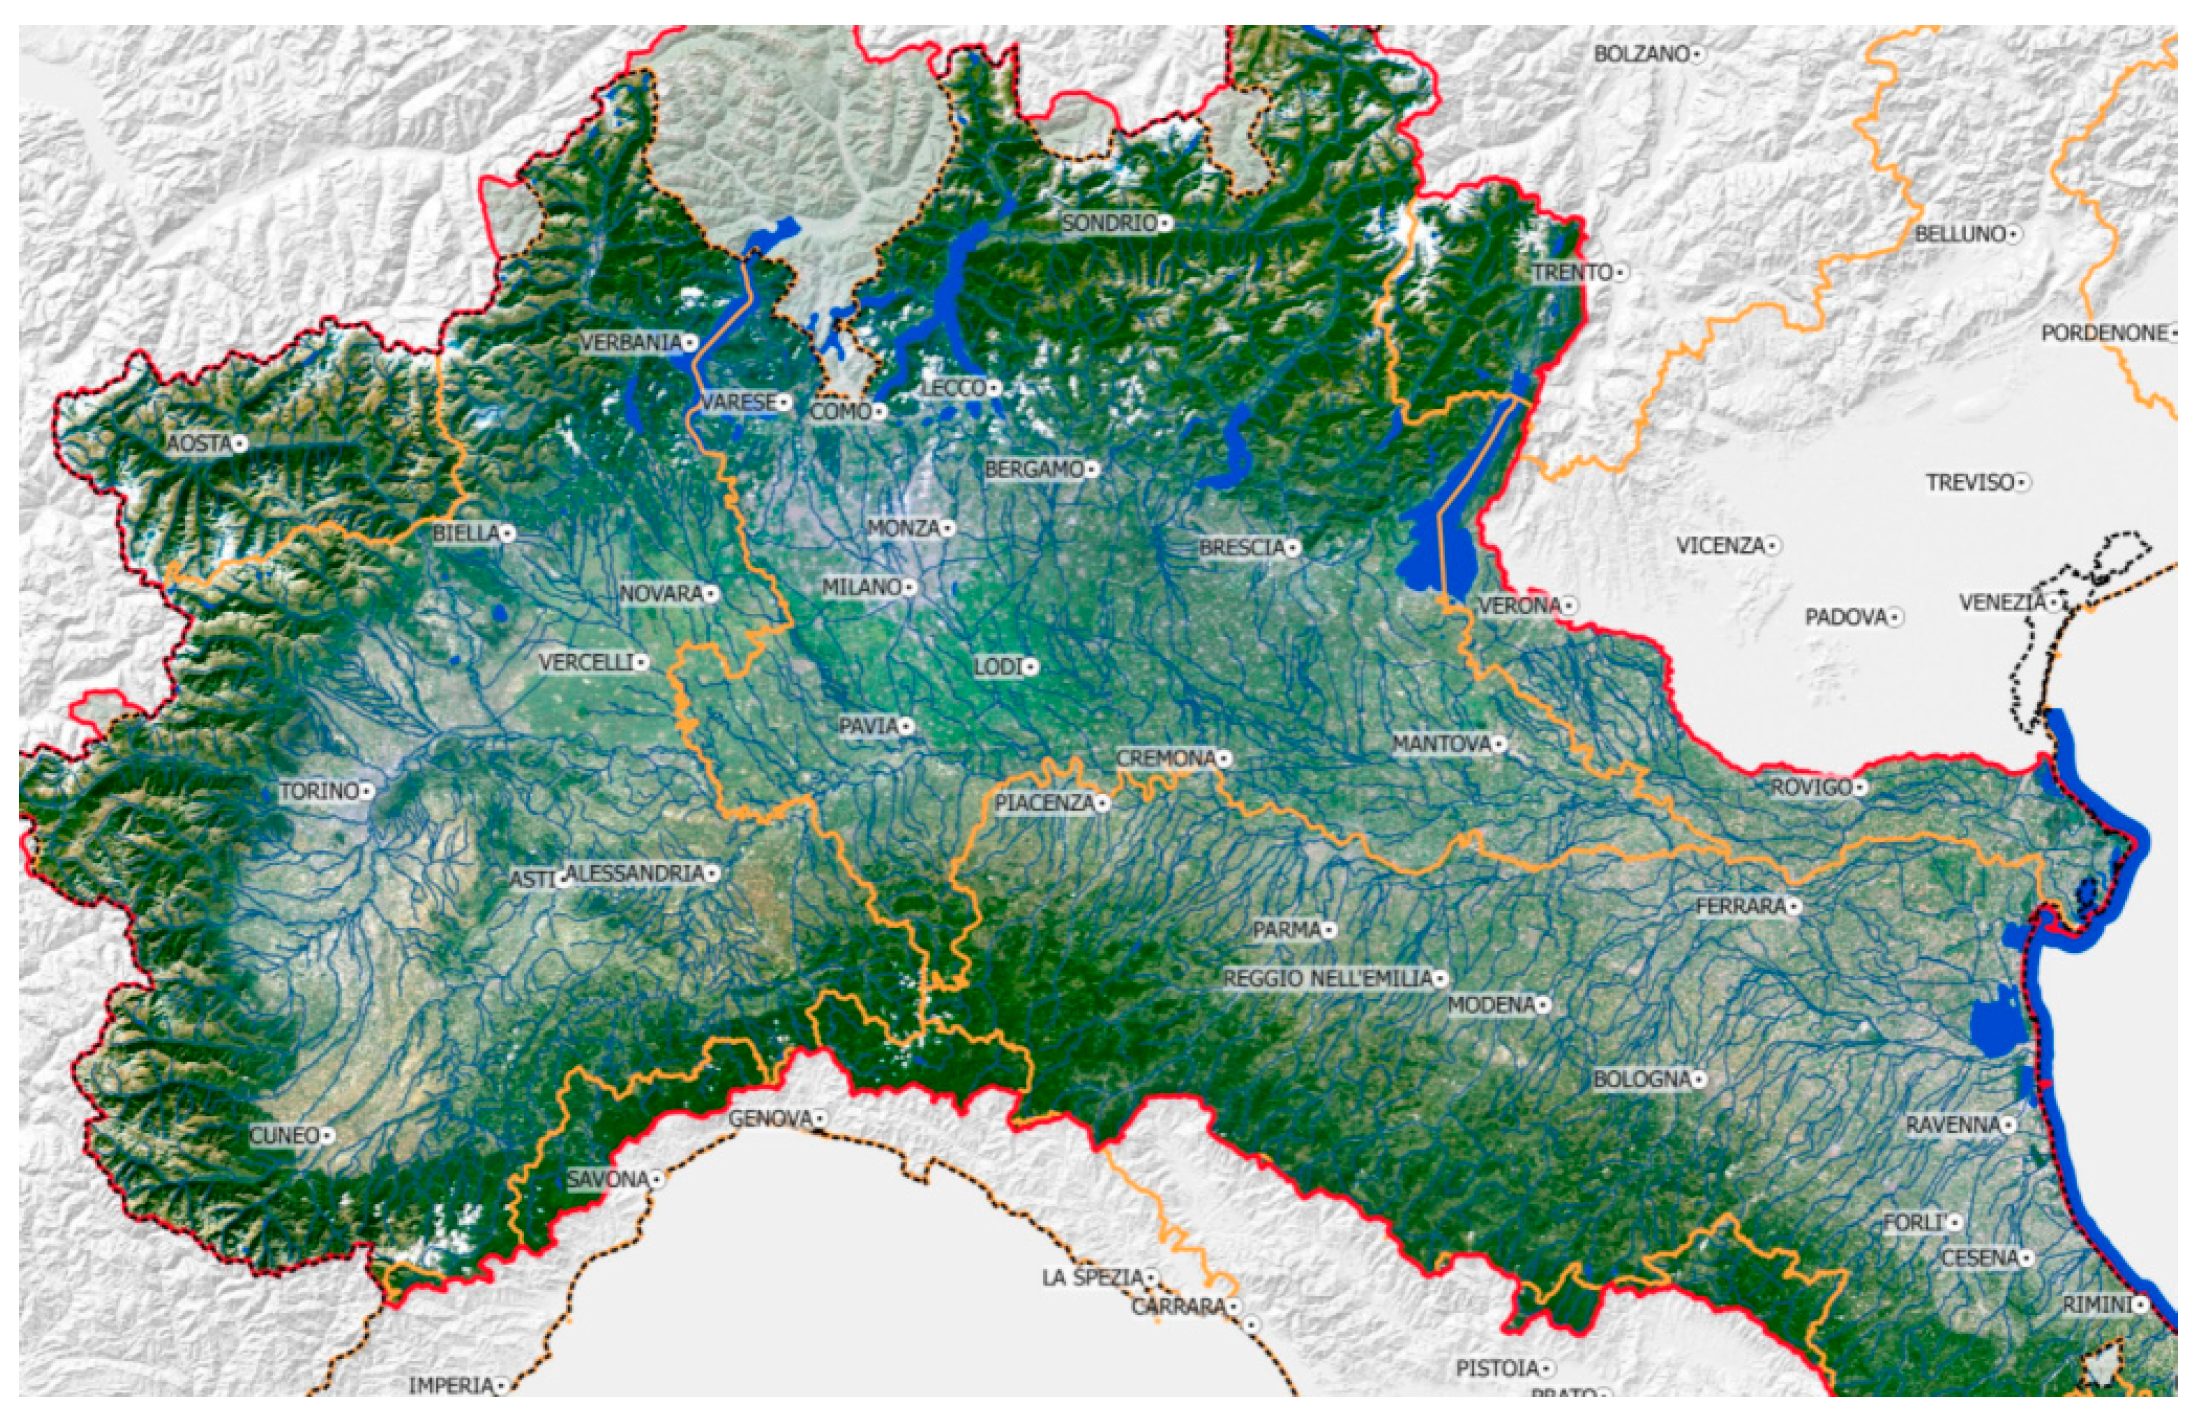
Regarding the concerns in this case study, the biomass from Goro’s lagoon may be affected by pollutants belonging to near shores, sea, and freshwater, where the latter involves the whole river’s hydrogeological basin. In detail, the Po river’s basin is very wide and covers almost the totality of northern Italy, the so-called “Pianura Padana”, or Padanian flatland. Moreover, this area (Figure 14) is greatly affected by an anthropic presence and activities, i.e., stress sources.
Thus, given the variety of anthropic presence and activities, it is not unusual to find a variety of macro- and microscopic pollutants classes in the forms of large solid trash fragments, sand, grit, and other fine solids that can be washed by stormwater and wind into the rivers. Other than microbiological hazards, nutrient and chemical pollution can imbalance ecosystems, which are from industrial facilities, households, wastewater treatment plants, and runoffs from farms and roads [89,90].
As mentioned in previous sections, these chemicals (mainly PBT class) can damage the environment immediately and catastrophically, or else can build threats slowly, accumulating in plants and animals’ tissues. Eventually, the fate of the inland-generated pollutants is to follow the freshwater’s flowing up to the outfall in the sea or ocean. Regarding the concerns of the Po River, among the major players of this insidious category, it is possible to find heavy metals, pesticides, polycyclic aromatic hydrocarbons, polychlorinated biphenyls, drugs, and their metabolites [16,91]. Given the variety of pollutants within the biomass, the biorefinery should be carefully evaluated to maximize the process cost/effectiveness and the fate of the residues.

6.2. Social Failure

This last section is based on a failed attempt to exploit algal biomass, where the failure came as a consequence of a single, poorly managed weakness, despite the number of “strong” beneficial points with plenty of opportunities, as reported in the SWOT resume table in the next section, leading to a complete failure: environmental, social, and economic.
To face the growing issue of algal blooms, in 2012–2013, Goro’s city administration opted for a different approach than the previously reported “Case Zero”. Therefore, a biogas plant was studied in collaboration with the company CCGL Group” and a group of biologists, as reported in the following newspaper articles of that period [92,93].
The hypothetical combinate plant should have used washed algae, along with other biomasses, to dilute the high content of phosphorus and nitrogen within algal masses as feedstock for anaerobic digestion for biogas production. Therefore, biogas is transformed in heat, i.e., hot water and electricity, to be introduced directly into the city’s grid, and the remaining digested material could be transformed into soil conditioner through the composting process. This project was mainly financed by the company itself (CCGL group) with European funds, as it should have become a reference case for further development of innovative technologies and methodologies, for example, the sea-based cultivation of biomass to meet the winter months’ needs for feedstock.
The plant should have been built directly on Goro’s lagoon and started to operate in 2014/2015, also lifting the management expenses from local administration, as seen previously in case zero, but unfortunately, something went wrong.
In fact, the biogas plant, once seen by the locals as a “savior” for the local economy, suddenly turned into a deadly threat to the ecosystem, in locals’ opinion. The main reason for this change in perspective is reported by word of mouth and appears to be for a political climb to power. However, in the grey literature, it is possible to find minimal information on how the story developed, from discontent to strong opposition committee.
In the article of Forti (2014) [94], the motivations and reasons to oppose the biogas plant are reported: while the many positive impacts are nullified, the possible and potential negative impacts and risks are over-magnified without much accuracy and or scientific bases, but mainly with a fear instiller approach, such as:
  • Suspicious sources of the other biomasses, with dilution purpose, and consequent release of unknown and deadly substances in the atmosphere,
  • Suspected structural fragilities and hypothetic plant lack of resilience toward natural disasters and rare phenomena,
  • Suspected enormous microbiological and biological damages in case of un-stabilized compost misuse,
  • Suspects regarding the “unknown” air emissions (usually air emitting plants are transparent and produce real-time data, with law limits, such as in this incinerator example near the case study’s area: [95]),
  • Personal, biased, uncheckable experiences, inconsistent and exacerbated facts, such as: “thirty noisy trucks each 12 min to and from the plant”.
However, the potential benefits of this bio-plant would have been several, for instance:
  • Solution to HABs issue,
  • Rise of new activities for bio products commercialization,
  • Openings for more workplaces,
  • Increased circularity of resources and carbon cycle with lesser “new fertilizer” bought.
  • Renewable production of energy and heat for local consumption.
Eventually, in this last article of Dall’Oca [96], it is reported that “citizens have won” against the “bad biogas plant”, confirming the complete change in perspective and the overall failure of the project as well as the people involved.
While economic data for an effective comparison in the CBA are not available, from these reports, it is possible to draw that the hidden social factors were a crucial weakness that should have been taken into consideration when trying to estimate the overall profitability, both environmental and economic, of the project.
In fact, major stressors for communities (i.e., threats for projects) are possibly connected to the fear of the unknown and, therefore, from the changes in the habits and contexts usually taken for granted. Thus, imposed changes in landscapes, boundaries, and surroundings may be seen and lived as war declarations. This phenomenon can find roots in the “Not In My BackYard” (NIMBY) syndrome [97,98,99,100], which refers to a particular condition where peoples and communities are willing to accept change and innovation only if that change does not directly impact their daily life by being “not in their backyard”.
The “Best Position” was rightfully economically evaluated to minimize or nullify the transportation expenditure, leaving only the biomass collection costs; however, it would have affected the landscape by placing the bio-industry directly upon the shores of the lagoon, which is the locals’ most precious good given the economic returns and wellbeing that it provides; possibly, this was the mistake that triggered fear in local stakeholders and the change in perspectives toward the beneficial role of the facility.
In general, whichever alternative is chosen, the social problems should be tackled by choosing the best position in agreeance with the local communities since the problems rise with the “where”, not the “what”. Thus, promoting a piercing campaign of effective communication regarding the mutual benefits for people’s wellbeing and their pockets, along with the positive outcomes of a functioning bioeconomy that generates incomes and creates jobs while relieving expenditure from administration, lowering environmental impacts, and improving ecosystem services quality.

6.3. SWOT Analyses

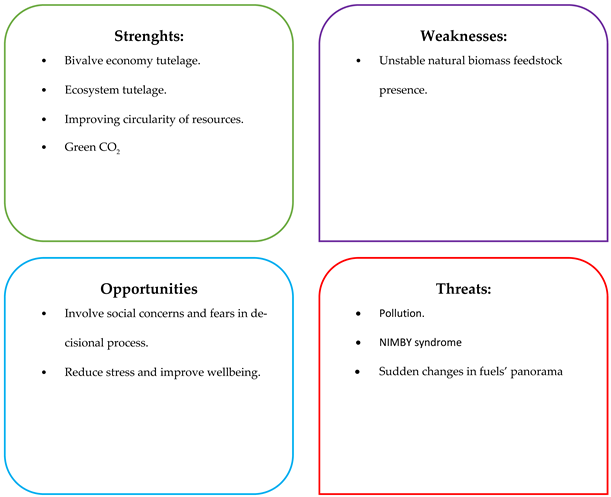
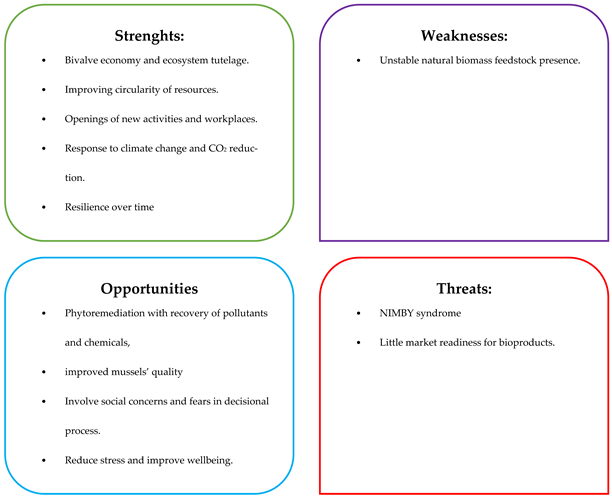
Below, the SWOT analyses are reported; the format chosen is the distribution of peculiarities in proper boxes; hence, three SWOT are conducted: a general one regarding the overall lagoon potentialities and two targeted upon the realization of scenarios 1 and 2d.

6.3.1. General SWOT Analysis for Goro’s Lagoon Case Study

Pollutants 04 00027 i001

6.3.2. Targeted SWOT Analysis for “Biofuel only” Scenario
Pollutants 04 00027 i002

6.3.3. Targeted SWOT Analysis for Biorefinery Multiproduct” Scenario
Pollutants 04 00027 i003

7. Discussion

The output of the CBA indicates the best alternative as the full biofuel approach (alternative 1), which involves a systemic conversion of fats, carbohydrates, and residues into biodiesel, bioethanol, biogas, and digestate; hence, the feedstock biomass should have a minimum fatty composition that allows for such processing. However, the sole production of biofuels, mainly biodiesel, can be a little resilient to changes, for example, the European policy proposal for the stop to internal combustion vehicles production fixed to 2035 [101], or unforeseen disturbances in environmental and climatic parameters that reflect on algae quality and quantity. All factors can represent tombstones for this phase 1 facility since there is still little understanding of the capacity of biofuel industries to respond to rapid, nonlinear, unpredictable changes and exogenous shocks, such as technological innovation, bio-markets availability, societal perspective, and environmental factors [102].
For these reasons, even if less remunerative, a biorefinery approach (alternative 2.d) should be considered because it allows for various long-term benefits, given the more strengths and opportunities, as the SWOT analysis suggests, such as the improved adaptation to the context and the waste algal biomass composition and availability, and to unforeseen and unknown factors. This alternative can also face more effectively the pollution issues discussed in the foresight analysis.
In fact, as described in previous sections, some classes of pollutants tend to be stored in algae because of the pollutants’ bioaccumulative behavior. Thus, it can represent a disabling and/or compromising effect on the biofuels’ quality and/or forcing the exhausted biomass to landfill rather than to agriculture because of the excessive concentration of pollutants in the digested residues.
Therefore, performing ex-ante qualitative and quantitative analyses on micropollutants within algal biomass to acknowledge and monitor the overall health and pollution status of the area could lead to the strategic development of a bio-plant that turns weaknesses and threats of polluted biomass into opportunities for further ecosystem quality improvements, and optimized biomasses exploitations. Generally, it is important to avoid wasting resources in processes that would yield polluted products due to the interference of pollutants that must be eliminated in further purification processes prior to the commercialization of the final (refined) product, adding costs and equivalent CO2 emissions. Heavy metals (such as lead) are a perfect example for this process given the natural affinity that seaweeds show toward them; hence, ideally projecting a bio-industry that produces biofuels and metals primarily as by-products [103].
Furthermore, the algal feedstock instability point in the weaknesses section can be faced with inland, onshore, and/or sea farms for algal biomass in order to keep biorefinery operating outside of seasonal bloom phenomena.
The hypothetical decision-making process, then, should be simplified by emphasizing the production of biofuels (Scenario 1) and the multiproduct biorefinery (Scenario 2d) as the most promising ways to face the stress sources that are threatening the lagoon, both with a fixed discount of 5% and a decreasing one (5–3–2%). At the same time, the possibilities to be avoided are highlighted (mainly the bioethanol-only productions). However, the second-best option has lower economic returns but shows other advantages in terms of flexibility over time and synergy with other technologies and activities, such as phytoremediation, which is crucial for improving aquaculture product quality. However, the best alternative to be chosen should be fitting to the pollution situation proper of the case study, then the third best option (Scenario 3), even if it is the least remunerative, should not be discarded a priori since, in case of certain contaminations, interfering with biofuels production, could still be a valid opportunity to exploit biomass.
Eventually, the totality of the benefits discussed until this point should be presented to the decision-makers and stakeholders, e.g., local and regional administrations, local people, fishermen, and aquaculture workers, to stimulate participation and increase acceptance toward the bio-plant while avoiding fears and resistance. Thus, it should be considered a more costly but socially acceptable “Best Position”, i.e., the furthest from social awareness and nearest to the operative area; to achieve a position with relatively low compromising of natural landscapes and lesser NIMBY Syndrome, without wasting too much in transportation costs and CO2 emitted. Furthermore, local administration can also participate by fostering science-based information and developing incentives to increase the social acceptance of the alternative chosen. Hopefully, this will pave the way for a sustainable and circular action with the cooperation of locals rather than opposition phenomena, as it has been for the failed case seen in the foresight section.
Unfortunately, the exiguous number of working biorefineries and articles in the literature was a major limitation to this work, hence limiting the confrontations for finding the best way to handle algal biomass to macroscopic and superficial differences. Hence, a future study should focus on biorefineries that are most compatible with remediation and phytoremediation techniques.

8. Conclusions

In this work, a cost–benefit analysis for the valorization of waste biomass to improve the circularity of resources and environmental tutelage has been proposed; with the addition of a foresight analysis to better fit in the social and environmental contexts of Goro’s lagoon, a highly valuable but endangered transitional water ecosystem that provides fruitful services, economic returns, and sustains local activities.
The goal is to promote an innovative holistic approach to obtain long-term sustainable ways for waste valorization, remediation, and the development of more competitive bio-products on the markets, with the collaboration of locals and respect for their wellbeing. Therefore, monitoring activities could play a major role as a KPI toward environmental health and as a base for ecosystem services quality improvement. The latter can also be achieved through stress reduction, i.e., the bioremediation of pollutants while recovering valuable chemicals and exploiting biomasses for biofuels and bioproducts. In addition, given the long lifespan of a bio-plant (thirty years) in these times of climate challenges and changes, the flexibility requirements could be a key-factor for the project’s success; hence, the best alternative may not be the most remunerative, as the CBA indicates, giving up two and half billions in order to gain a much better adaptability to the context and future uncertainties, as the foresight and SWOT analyses suggest. In these regards, the multiproduct biorefinery has the potential to be the most promising way to face the stressors acting upon the lagoon over its whole lifetime, meeting the breakeven in the first 8 years and producing net income for the years to come while the production of biofuels is a direct and simpler alternative, belonging to the high-risk high-reward paradigm, producing much more incomes on the chart, but may suffer from the passing of time, by means of market needs and policies.
Eventually, each of the alternatives has strengths and weaknesses; the key point is to foster a critical analysis while studying a strong communication pattern with stakeholders and decision-makers in order to pick the most reasonable but scientifically accurate choice for the common good, i.e., environmental, social, and economic.
However, given the historical reality of this location toward bio-plants, the decision-making process should involve locals in the project design itself to foster full participation and, therefore, achieve a sustainable way of circular tutelage.

Author Contributions

Conceptualization, A.B. and L.P.; methodology, A.P. and M.M.; formal analysis, A.B.; investigation, A.B.; data curation, A.B.; writing—original draft preparation, A.B.; writing—review and editing, A.B.; supervision, A.P., L.P. and M.M. All authors have read and agreed to the published version of the manuscript.

Funding

This research received no external funding.

Data Availability Statement

All data are collected from various articles, grey literature and freely given by local administration.

Conflicts of Interest

The authors declare no conflicts of interest.

Appendix A

Table A1. Publications related to algae as feed for biofuels based on Scopus.
Scopus Research by Year201220212022
Algae and biodiesel79441144226
Algae and bioethanol112765793
Algae and biogas11011121164
Algae and biohydrogen66375393
Algae and biobutanol97677
  • Additional References for algal biomass usage
Ulva exploitations: [45,61,104,105,106,107,108,109,110,111,112,113]
Gracilaria exploitations: [114,115,116,117,118]
further utilizations of algal biomass might have: [40,119,120,121].
  • Landfill Building Costs and Demolition Expenditure
It is to be noted that landfill and composter costs do not completely belong to the real situation of case zero since those structures are not built for algal biomass handling purposes only but are needed to “solve” the problem; that is also the reason why the running costs are not reported, while the capital and fixed costs, instead, are.
Table A2. Typical costs Range for a Landfill Construction €/Hectare.
LANDFILL, Typical Construction Costs
TaskMinimumMaximum
Clear and Grub3971190
Site Survey19833173
Excavation39,659130,875
Perimeter Berm39666345
Clay Liner12,69164,248
Geomembrane951813,881
Geocomposite13,08817,450
Granular Soil19,03625,382
Leachate System317340,452
QA/QC29,74439,659
TOTAL133,255306,962
Table A3. Typical costs Range for a Landfill Closure Care and Maintenance Costs €/Hectare.
LANDFILL, Closure Care and Maintenance Costs
TaskMinimumMaximum
Final grades survey11902380
Gas management layer951812,691
Compacted caly cap10,31120,226
Geomembrane cap71399122
Geocomposite13,08817,450
Cover and vegetative soil515610,311
Seed, much, fertilize397793
Gas management system11,50113,881
Run-off control system19832776
QA/QC29,74439,659
Total90,026129,289
Table A4. Typical costs Range for a Landfill Post-Closure Maintenance Costs €/Hectare.
LANDFILL, Post-Closure Maintenance Costs
TaskMinimumMaximum
Security and fencing35,69371,387
Final cap and cover35696742
Leachate mechanicals10,70814,277
Landfill gas mechanicals53546782
Wells/probes237,955356,933
Environmental monitoring53546841
Total25,38234,900
Data are from [122], and below, there are reported the demolition costs for industrial plants with ranges to better intercept the complexity, yielding a proper evaluation, or at least an idea, for the demolition costs per square meter.
Table A5. Costs Range guidelines for demolition of industrial sites with various complexities.
Demolition Costs for Industrial Plants
Industrial
PHASE IPHASE II
Removal of redundant servicesFixed: tot € per site35.40112.10112.10188.80
Site clearanceVariable: tot € per m217.7053.1053.1088.50
DemolitionsVariable: tot € per m237.7656.0556.0574.34
Site investigationFixed: tot € per site47.20177.00177.00306.80
FeesFixed: tot € per site224.20507.40507.40790.60

References

  1. Toth, G.; Szigeti, C. The historical ecological footprint: From over-population to over-consumption. Ecol. Indic. 2016, 60, 283–291. [Google Scholar] [CrossRef]
  2. Kassas, M. Desertification: A general review. J. Arid Environ. 1995, 30, 115–128. [Google Scholar] [CrossRef]
  3. Nelson, G.C.; Rosegrant, M.W.; Koo, J.; Robertson, R.D.; Sulser, T.; Zhu, T.; Ringler, C.; Msangi, S.; Palazzo, A.; Batka, M.; et al. Climate Change: Impact on Agriculture and Costs of Adaptation. 2009. Available online: https://books.google.it/books?hl=it&lr=&id=1Vpe0JvYTJYC&oi=fnd&pg=PR7&dq=climate+change+negative+impact&ots=Xns86aTvka&sig=mkwZExO60CZOzLvp5ivlMioWDSc#v=onepage&q=climate%20change%20negative%20impact&f=false (accessed on 2 February 2021).
  4. Tallis, H.; Kareiva, P. Essay Ecosystem Services. Curr. Biol. 2007, 15, R746–R748. Available online: https://www.perc.org/wp-content/uploads/2016/10/EcosystemServices_RDSimpson.pdf (accessed on 3 February 2021). [CrossRef] [PubMed]
  5. Rafoss, T. Sustainable Biomass Production from Oceans and the Potential for Circular Bioeconomy. In The Bioeconomy Approach; Taylor & Francis Group: Oxfordshire, UK, 2020; pp. 24–44. [Google Scholar] [CrossRef]
  6. Tičina, V. Marine Aquaculture Impacts on Marine Biota in Oligotrophic Environments of the Mediterranean Sea—A Review. Front. Mar. Sci. 2020, 7, 517704. [Google Scholar] [CrossRef]
  7. Maulu, S. Climate Change Effects on Aquaculture Production: Sustainability Implications, Mitigation, and Adaptations. Front. Sustain. Food Syst. 2021, 5, 609097. [Google Scholar] [CrossRef]
  8. Ben Chekroun, K.; Sánchez, E.; Baghour, M. The role of algae in bioremediation of organic pollutants. Int. Res. J. Public Environ. Health 2014, 1, 19–32. [Google Scholar]
  9. Zeraatkar, A.K. Potential use of algae for heavy metal bioremediation, a critical review. J. Environ. Manag. 2016, 181, 817–831. [Google Scholar] [CrossRef] [PubMed]
  10. Thirukumaran, R. Resource recovery from fish waste: Prospects and the usage of intensified extraction technologies. Chemosphere 2022, 299, 134361. [Google Scholar] [CrossRef] [PubMed]
  11. Poff, N.L.; Day, J.W. Aquatic Ecosystems & Global Climate Change—Potential Impacts on Inland Freshwater and Coastal Wetland Ecosystems in the United States Characterizing Contemporary Drivers of the Occurrence of Coldwater Fishes in the Western United States View Project. 2002. Available online: https://www.researchgate.net/publication/248528187 (accessed on 4 February 2021).
  12. Dórea, J.G. Persistent, bioaccumulative and toxic substances in fish: Human health considerations. Sci. Total Environ. 2008, 400, 93–114. [Google Scholar] [CrossRef]
  13. Suja, F.; Pramanik, B.K.; Zain, S.M. Contamination, bioaccumulation and toxic effects of perfluorinated chemicals (PFCs) in the water environment: A review paper. Water Sci. Technol. 2009, 60, 1533–1554. [Google Scholar] [CrossRef]
  14. Check, L.; Marteel-Parrish, A. The fate and behavior of persistent, bioaccumulative, and toxic (PBT) chemicals: Examining lead (Pb) as a PBT metal. Rev. Environ. Health 2013, 28, 85–96. [Google Scholar] [CrossRef] [PubMed]
  15. Booth, A.M.; Sutton, P.A.; Lewis, C.A.; Lewis, A.C.; Scarlett, A.; Chau, W.; Widdows, J.; Rowland, S.J. Unresolved complex mixtures of aromatic hydrocarbons: Thousands of overlooked persistent, bioaccumulative, and toxic contaminants in mussels. Environ. Sci. Technol. 2007, 41, 457–464. [Google Scholar] [CrossRef]
  16. Murray, T.M. PBT (Persistent, Bioaccumulative, and Toxic) Chemicals. In Encyclopedia of Toxicology, 3rd ed.; Elsevier: Amsterdam, The Netherlands, 2014; pp. 762–764. [Google Scholar] [CrossRef]
  17. Werner, W. Fertilizers, 6. Environmental Aspects. In Ullmann’s Encyclopedia of Industrial Chemistry; John Wiley & Sons: Hoboken, NJ, USA, 2009. [Google Scholar] [CrossRef]
  18. Zaldívar, J.-M.; Cardoso, A.C.; Viaroli, P.; Newton, A.; de Wit, R.; Ibañez, C.; Reizopoulou, S.; Somma, F.; Razinkovas, A.; Basset, A.; et al. Eutrophication in transitional waters: An overview. Transit. Waters Monogr. 2008, 1, 1–78. [Google Scholar]
  19. Joniver, C.F.H.; Photiades, A.; Moore, P.J.; Winters, A.L.; Woolmer, A.; Adams, J.M.M. The global problem of nuisance macroalgal blooms and pathways to its use in the circular economy. Algal Res. 2021, 58, 102407. [Google Scholar] [CrossRef]
  20. Chislock, M.F. Eutrofizzazione. Nat. Educ. Knowl. 2013, 4, 10. [Google Scholar]
  21. Al-Yamani, F.Y.; Polikarpov, I.; Saburova, M. Marine life mortalities and Harmful Algal Blooms in the Northern Arabian Gulf. Aquat. Ecosyst. Health Manag. 2020, 23, 196–209. [Google Scholar] [CrossRef]
  22. Xu, Y.; Zhang, T.; Zhou, J. Historical occurrence of algal blooms in the northern Beibu Gulf of China and implications for future trends. Front. Microbiol. 2019, 10, 451. [Google Scholar] [CrossRef]
  23. Filote, C.; Santos, S.C.R.; Popa, V.I.; Botelho, C.M.S.; Volf, I. Biorefinery of marine macroalgae into high-tech bioproducts: A review. Environ. Chem. Lett. 2021, 19, 969–1000. [Google Scholar] [CrossRef]
  24. Lewitus, A.J.; Horner, R.A.; Caron, D.A.; Garcia-Mendoza, E.; Hickey, B.M.; Hunter, M.; Huppert, D.D.; Kudela, R.M.; Langlois, G.W.; Largier, J.L.; et al. Harmful algal blooms along the North American west coast region: History, trends, causes, and impacts. Harmful Algae 2012, 19, 133–159. [Google Scholar] [CrossRef]
  25. Glibert, P.M.; Allen, J.I.; Artioli, Y.; Beusen, A.; Bouwman, L.; Harle, J.; Holmes, R.; Holt, J. Vulnerability of coastal ecosystems to changes in harmful algal bloom distribution in response to climate change: Projections based on model analysis. Glob. Change Biol. 2014, 20, 3845–3858. [Google Scholar] [CrossRef]
  26. Moore, S.K.; Mantua, N.J.; Salathé, E.P. Past trends and future scenarios for environmental conditions favoring the accumulation of paralytic shellfish toxins in Puget Sound shellfish. Harmful Algae 2011, 10, 521–529. [Google Scholar] [CrossRef]
  27. Townhill, B.L.; Tinker, J.; Jones, M.; Pitois, S.; Creach, V.; Simpson, S.D.; Dye, S.; Bear, E.; Pinnegar, J.K. Harmful algal blooms and climate change: Exploring future distribution changes. ICES J. Mar. Sci. 2018, 75, 1882–1893. [Google Scholar] [CrossRef]
  28. Facca, C. Ecological status assessment of transitional waters. Water 2020, 12, 3159. [Google Scholar] [CrossRef]
  29. United Nations. Transforming Our World: The 2030 Agenda for Sustainable Development | Department of Economic and Social Affairs. 2022. Available online: https://sdgs.un.org/2030agenda (accessed on 14 May 2021).
  30. Saeid, A.; Chojnacka, K. Algae Biomass as a Raw Material for Production of Algal Extracts; John Wiley & Sons: Hoboken, NJ, USA, 2015. [Google Scholar]
  31. Gupta, S.K.; Malik, A.; Bux, F. Algal Biofuels: Recent Advances and Future Prospects; Springer International Publishing: Cham, Switzerland, 2017. [Google Scholar] [CrossRef]
  32. Bruhn, A.; Dahl, J.; Nielsen, H.B.; Nikolaisen, L.; Rasmussen, M.B.; Markager, S.; Olesen, B.; Arias, C.; Jensen, P.D. Bioenergy potential of Ulva lactuca: Biomass yield, methane production and combustion. Bioresour. Technol. 2011, 102, 2595–2604. [Google Scholar] [CrossRef] [PubMed]
  33. van der Wal, H.; Sperber, B.L.H.M.; Houweling-Tan, B.; Bakker, R.R.C.; Brandenburg, W.; López-Contreras, A.M. Production of acetone, butanol, and ethanol from biomass of the green seaweed Ulva lactuca. Bioresour. Technol. 2013, 128, 431–437. [Google Scholar] [CrossRef]
  34. Sivaramakrishnan, R. Microalgal Biorefinery Concepts’ Developments for Biofuel and Bioproducts: Current Perspective and Bottlenecks. Int. J. Mol. Sci. 2022, 23, 2623. [Google Scholar] [CrossRef]
  35. Mussatto, S.I.; Bikaki, N. Technoeconomic Considerations for Biomass Fractionation in a Biorefinery Context. In Biomass Fractionation Technologies for a Lignocellulosic Feedstock Based Biorefinery; Elsevier: Amsterdam, The Netherlands, 2016; pp. 587–610. [Google Scholar] [CrossRef]
  36. Mominur Rahman, M.; Shajib Rahman, M.; Chandra Deb, B. Competitive Cost Advantage: An Application of Environmental Accounting and Management Approach with reference to Bangladesh. Cost Manag. 2021, 49, 47–59. [Google Scholar]
  37. Renaud, S.M.; Luong-Van, J.T. Seasonal variation in the chemical composition of tropical Australian marine macroalgae. J. Appl. Phycol. 2006, 18, 381–387. [Google Scholar] [CrossRef]
  38. Sutkowy, M.; Lenarczyk, J.; Kłosowski, G. Effect of culture medium on the growth of microscopic algae (Chlorophyceae) biomass showing biosorption potential: A case study Pseudopediastrum boryanum. Psychol. Res. 2018, 67, 112–119. [Google Scholar] [CrossRef]
  39. Pilatti, F.K.; Ramlov, F.; Schmidt, E.C.; Kreusch, M.; Pereira, D.T.; Costa, C.; de Oliveira, E.R.; Bauer, C.M.; Rocha, M.; Bouzon, Z.L.; et al. In vitro exposure of Ulva lactuca Linnaeus (Chlorophyta) to gasoline—Biochemical and morphological alterations. Chemosphere 2016, 156, 428–437. [Google Scholar] [CrossRef]
  40. Henriques, B.; Teixeira, A.; Figueira, P.; Reis, A.T.; Almeida, J.; Vale, C.; Pereira, E. Simultaneous removal of trace elements from contaminated waters by living Ulva lactuca. Sci. Total Environ. 2019, 652, 880–888. [Google Scholar] [CrossRef] [PubMed]
  41. Mahmood, Q.; Mirza, N.; Shaheen, S. Phytoremediation using algae and macrophytes: I. In Phytoremediation: Management of Environmental Contaminants; Springer International Publishing: Cham, Switzerland, 2015; Volume 2, pp. 265–289. [Google Scholar] [CrossRef]
  42. Chekroun, B.; Ben Chekroun, K.; Baghour, M. The role of algae in phytoremediation of heavy metals: A review. J. Mater. Environ. Sci. 2013, 4, 873–880. [Google Scholar]
  43. Nanda, S.; Rana, R.; Sarangi, P.K.; Dalai, A.K.; Kozinski, J.A. A broad introduction to first-, second-, and third-generation biofuels. In Recent Advancements in Biofuels and Bioenergy Utilization; Springer: Singapore, 2018; pp. 1–25. [Google Scholar] [CrossRef]
  44. Linares-Pastén, J.A.; Andersson, M.; Karlsson, E.N. Thermostable Glycoside Hydrolases in Biorefinery Technologies. Curr. Biotechnol. 2014, 3, 26–44. Available online: https://www.borregaard.com (accessed on 28 November 2020). [CrossRef]
  45. Suganya, T.; Varman, M.; Masjuki, H.H.; Renganathan, S. Macroalgae and microalgae as a potential source for commercial applications along with biofuels production: A biorefinery approach. Renew. Sustain. Energy Rev. 2016, 55, 909–941. [Google Scholar] [CrossRef]
  46. Stevens, C.V.; Clark, J.H.; Deswarte, F. Introduction to Chemicals from Biomass Wiley Series in Renewable Resources Series Editor Titles in the Series Renewables-Based Technology-Sustainability Assessment Handbook of Natural Colorants Surfactants from Renewable Resources Industrial Application of Natural Fibres-Structure, Properties and Technical Applications. In Aqueous Pretreatment of Plant Biomass for Biological and Chemical Conversion to Fuels and Chemicals; John Wiley & Sons: Hoboken, NJ, USA, 2015. [Google Scholar]
  47. Ahmad Ansari, F.; Nasr, M.; Guldhe, A.; Gupta, S.K.; Rawat, I.; Bux, F. Techno-economic feasibility of algal aquaculture via fish and biodiesel production pathways: A commercial-scale application. Sci. Total Environ. 2020, 704, 135259. [Google Scholar] [CrossRef] [PubMed]
  48. Ingle, K.; Vitkin, E.; Robin, A.; Yakhini, Z.; Mishori, D.; Golberg, A. Macroalgae Biorefinery from Kappaphycus alvarezii: Conversion Modeling and Performance Prediction for India and Philippines as Examples. Bioenergy Res. 2018, 11, 22–32. [Google Scholar] [CrossRef]
  49. Greene, J.M.; Gulden, J.; Wood, G.; Huesemann, M.; Quinn, J.C. Techno-economic analysis and global warming potential of a novel offshore macroalgae biorefinery. Algal Res. 2020, 51, 102032. [Google Scholar] [CrossRef]
  50. Zhang, X.; Thomsen, M. Techno-economic and environmental assessment of novel biorefinery designs for sequential extraction of high-value biomolecules from brown macroalgae Laminaria digitata, Fucus vesiculosus, and Saccharina latissima. Algal Res. 2021, 60, 102499. [Google Scholar] [CrossRef]
  51. Dickson, R.; Brigljevic, B.; Lim, H.; Liu, J. Maximizing the sustainability of a macroalgae biorefinery: A superstructure optimization of a volatile fatty acid platform. Green Chem. 2020, 22, 4174–4186. [Google Scholar] [CrossRef]
  52. Konda, N.V.S.N.M.; Singh, S.; Simmons, B.A.; Klein-Marcuschamer, D. An Investigation on the Economic Feasibility of Macroalgae as a Potential Feedstock for Biorefineries. Bioenergy Res. 2015, 8, 1046–1056. [Google Scholar] [CrossRef]
  53. Paoletti. Site Description (Sacca di Goro). 2008. Available online: https://www3.diism.unisi.it/~paoletti/teaching/ModGestSistAmb/download/Descrizione_SaccaDiGoro.pdf (accessed on 12 December 2020).
  54. National Order of Biologists. Sacca di Goro, la ‘Fabbrica’ delle Vongole: Un Paradiso da Preservare—Ordine Nazionale dei Biologi. 2018. Available online: https://iris.unife.it/bitstream/11392/2514210/2/tesi_digital_nofirme_AndreaBaldi.pdf (accessed on 15 December 2020).
  55. Nasa. Italy. 2022. Available online: https://visibleearth.nasa.gov/images/65788/italy (accessed on 17 December 2020).
  56. Parco del Delta del Po. Available online: http://www.parcodeltapo.it/it/index.php (accessed on 17 December 2020).
  57. Angonese, A.G. 2007. Available online: https://www3.diism.unisi.it/~paoletti/teaching/ModGestSistAmb/download/Monitoraggio_SaccaDiGoro.pdf (accessed on 17 December 2020).
  58. Lenzi, M.; Birardi, F. Confronto della Flora Marina Presente in Alcuni Ambienti di Transizione Italiani; Related Papers Flora and Veget a ion of the Italian Transitional Water Sysems the Lagoon of Orbetello; Academia: Florence, Italy, 2006. [Google Scholar]
  59. Andrea, P. L’alga Invade Ancora la Sacca di Goro La Nuova Ferrara. 2015. Available online: https://www.lanuovaferrara.it/ferrara/cronaca/2015/09/11/news/l-alga-invade-ancora-la-sacca-di-goro-1.12074080 (accessed on 20 December 2020).
  60. Dominguez, H.; Loret, E.P. Ulva lactuca, A Source of Troubles and Potential Riches. Mar. Drugs 2019, 17, 357. [Google Scholar] [CrossRef] [PubMed]
  61. Suganya, T.; Nagendra Gandhi, N.; Renganathan, S. Production of algal biodiesel from marine macroalgae Enteromorpha compressa by two step process: Optimization and kinetic study. Bioresour. Technol. 2013, 128, 392–400. [Google Scholar] [CrossRef] [PubMed]
  62. Pramanick, B.; Brahmachari, K.; Ghosh, A.; Zodape, S.T. Effect of Seaweed Saps Derived from Two Marine Algae Kappaphycus and Gracilaria on Growth and Yield Improvement of Blackgram. Indian J. Geo-Mar. Sci. 2016, 45, 789–794. [Google Scholar]
  63. Yildiz, G.; Vatan, Ö.; Çelikler, S.; Dere, Ş. Determination of the phenolic compounds and antioxidative capacity in red algae Gracilaria bursa-pastoris. Int. J. Food Prop. 2011, 14, 496–502. [Google Scholar] [CrossRef]
  64. Kumar, S.; Gupta, R.; Kumar, G.; Sahoo, D.; Kuhad, R.C. Bioethanol production from Gracilaria verrucosa, a red alga, in a biorefinery approach. Bioresour. Technol. 2013, 135, 150–156. [Google Scholar] [CrossRef]
  65. Hani Norziah, M.; Yen Ching, C. Nutritional Composition of Edible Seaweed Gracilaria Changgi. 1998. Available online: https://www.elsevier.com/locate/foodchem (accessed on 20 May 2021).
  66. Boardman, A.; Greenberg, D.; Vining, A.; Weimer, D. Cost-Benefit Analysis: Concepts and Practice. 1998. Available online: https://www.jstor.org/stable/30024403?casa_token=xVty-uS9nP4AAAAA%3A2eJdicVfv3Tm2BFHuM61UL2cA57tjkqaBuxGcgaF8cvSgsXI-HL7r4r9o0nHyyymw4Et3OypE9alZDxjuVrkNXn3ojmJlEDrMSOoou07LoIQxTJWpPw#metadata_info_tab_contents (accessed on 20 May 2021).
  67. Pearce, D.; Atkinson, G.; Mourato, S. Cost-Benefit Analysis and the Environment: Recent Developments; OECD: Paris, France, 2006; pp. 15–27. [Google Scholar]
  68. Hanley, N.; Barbier, E. Pricing Nature: Cost-Benefit Analysis and Environmental Policy; Edward Elgar: Cheltenham, UK, 2009. [Google Scholar]
  69. Prest, A.R.; Turvey, R. Cost-Benefit Analysis: A Survey. In Surveys of Economic Theory; Springer: Cham, Switzerland, 1966; pp. 155–207. [Google Scholar] [CrossRef]
  70. Perman. Natural Resource and Environmental Economics, 4th ed. 2003. Available online: https://www.pearson.com/uk/educators/higher-education-educators/program/Perman-Natural-Resource-and-Environmental-Economics-4th-Edition/PGM848461.html (accessed on 20 May 2021).
  71. Cariola, M.; Rolfo, S. Evolution in the rationales of foresight in Europe. Futures 2004, 36, 1063–1075. [Google Scholar] [CrossRef]
  72. Martin, B.R.; Johnston, R. Technology foresight for wiring up the national innovation system: Experiences in Britain, Australia, and New Zealand. Technol. Forecast. Soc. Change 1999, 60, 37–54. [Google Scholar] [CrossRef]
  73. Martin, B.R. Foresight in Science and Technology. Technol. Anal. Strateg. Manag. 1995, 7, 139–168. [Google Scholar] [CrossRef]
  74. Popper, R. Foresight Methodology. In Handbook of Technology Foresight: Concepts and Practice; Georghiou, L., Cassingena, H.J., Keenan, M., Miles, I., Popper, R., Eds.; Edward Elgar: Cheltenham, UK, 2008; pp. 44–88, 428. [Google Scholar]
  75. Georghiou, L. The UK technology foresight programme. Futures 1996, 28, 359–377. [Google Scholar] [CrossRef]
  76. Rialland, A.; Wold, K.E. Future Studies, Foresight and Scenarios as Basis for Better Strategic Decisions; Norwegian University of Science and Technology: Trondheim, Norway, 2009. [Google Scholar]
  77. Jain, A.; Ewurum, N. SWOT Analysis in Thirukkural: Comparative Analysis with Humphrey SWOT Matrix Related papers Foreign Direct Investment in Nigeria’s Commercial Real Estate Market: A SWOT Analysis Swot Analysis of Food-Equipment Importance through Processing and Use Of Refrigered Flour. IOSR J. 2015, 17, 17–20. [Google Scholar]
  78. Bison, G.O. Organizzazione Produttori Vongola di Goro|Edizioni Pubblicità Italia Srl. 2012. Available online: https://pubblicitaitalia.com/it/pesce/prodotti/il-pesce/2012/2/11664 (accessed on 30 May 2021).
  79. ANSA. Siccità: Delta Po; a Pesca di Alghe Contro Asfissia Vongole—Emilia-Romagna—ANSA.it. 2022. Available online: https://www.ansa.it/emiliaromagna/notizie/2022/07/17/siccita-delta-po-a-pesca-di-alghe-contro-asfissia-vongole_426128c0-c09d-4993-8e3e-c64c47490e1a.html (accessed on 10 June 2021).
  80. Mario, B. Ferrara, un Mare di Alghe Invade la Laguna: A Rischio gli Allevamenti di Vongole—Cronaca. 2022. Available online: https://www.ilrestodelcarlino.it/ferrara/cronaca/alghe-vongole-1.7818006 (accessed on 15 June 2021).
  81. Duffy, D.P. Landfill Economics: Getting Down to Business—Part 2|MSW Management. 2016. Available online: https://www.mswmanagement.com/landfills/article/13022732/landfill-economics-getting-down-to-business-part-2 (accessed on 1 July 2021).
  82. Nardelli, A.E.; Chiozzini, V.G.; Braga, E.S.; Chow, F. Integrated multi-trophic farming system between the green seaweed Ulva lactuca, mussel, and fish: A production and bioremediation solution. J. Appl. Phycol. 2019, 31, 847–856. [Google Scholar] [CrossRef]
  83. Coker, C. Composting Business Management: Capital Cost of Composting Facility Construction|BioCycle. 2020. Available online: https://www.biocycle.net/composting-business-management-capital-cost-composting-facility-construction/ (accessed on 3 July 2021).
  84. Troell, M.; Rönnbäck, P.; Halling, C.; Kautsky, N.; Buschmann, A. Ecological engineering in aquaculture: Use of seaweeds for removing nutrients from intensive mariculture. In Proceedings of the Sixteenth International Seaweed Symposium, Cebu City, Philippines, 12–17 April 1998; pp. 603–611. [Google Scholar] [CrossRef]
  85. Liu, Y.; Cao, L.; Cheung, W.W.L.; Sumaila, U.R. Global estimates of suitable areas for marine algae farming. Environ. Res. Lett. 2023, 18, 064028. [Google Scholar] [CrossRef]
  86. Nazemi, F.; Karimi, K.; Denayer, J.F.M.; Shafiei, M. Techno-economic aspects of different process approaches based on brown macroalgae feedstock: A step toward commercialization of seaweed-based biorefineries. Algal Res. 2021, 58, 102366. [Google Scholar] [CrossRef]
  87. Davis, R.; Kinchin, C.; Markham, J.; Tan, E.; Laurens, L.; Sexton, D.; Knorr, D.; Schoen, P.; Lukas, J. Process Design and Economics for the Conversion of Algal Biomass to Biofuels: Algal Biomass Fractionation to Lipid- and Carbohydrate-Derived Fuel Products. 2013. Available online: https://www.nrel.gov/publications (accessed on 5 July 2021).
  88. Weitzman, M.L. Gamma discounting. Am. Econ. Rev. 2001, 91, 260–271. [Google Scholar] [CrossRef]
  89. Grizzetti, B.; Pistocchi, A.; Liquete, C.; Udias, A.; Bouraoui, F.; van de Bund, W. Human pressures and ecological status of European rivers. Sci. Rep. 2017, 7, 205. [Google Scholar]
  90. Chaudhary, M.; Mishra, S.; Kumar, A. Estimation of water pollution and probability of health risk due to imbalanced nutrients in River Ganga, India. Int. J. River Basin Manag. 2017, 15, 53–60. [Google Scholar] [CrossRef]
  91. Rastogi, T.; Mahmoud, W.M.M.; Kümmerer, K. Human and veterinary drugs in the environment. In Encyclopedia of the Anthropocene; Elsevier: Amsterdam, The Netherlands, 2017; Volume 1–5, pp. 263–268. [Google Scholar]
  92. Messina. Nel Ferrarese un Impianto a Biogas Alimentato ad Alghe—Corriere.it. 2013. Available online: https://www.corriere.it/ambiente/13_agosto_14/biogas-alghe-ferrara-goro_4581adb4-0420-11e3-b7de-a2b03b792de4.shtml (accessed on 2 September 2021).
  93. Valentini. A Ferrara il Primo Impianto a Biogas Alimentato con Alghe—ItaliaOggi.it. 2013. Available online: https://www.italiaoggi.it/archivio/a-ferrara-il-primo-impianto-a-biogas-alimentato-con-alghe-1838628 (accessed on 2 September 2021).
  94. Forti. La Centrale a Biogas di Goro fa Paura, si Profila una Marcia Indietro—Ferraraitalia.it—Quotidiano Glocal Indipendente. 2014. Available online: https://www.ferraraitalia.it/probabile-marcia-indietro-sulla-costruzione-della-centrale-biogas-di-goro-evidente-la-pericolosita-per-salute-e-ambiente-7977.html (accessed on 3 February 2022).
  95. HERAmbiente. Termovalorizzatore di Ferrara—HERAmbiente. 2022. Available online: https://ha.gruppohera.it/impianti/termovalorizzatori/ferrara (accessed on 1 April 2022).
  96. Dall’Oca. Biogas, a Goro Vincono i Cittadini. Stop Delle Istituzioni, la Centrale non si Farà—Il Fatto Quotidiano. 2014. Available online: https://www.ilfattoquotidiano.it/2014/04/12/biogas-a-goro-vincono-i-cittadini-dietrofront-delle-istituzioni-la-centrale-non-si-fara/948877/ (accessed on 1 March 2022).
  97. Margulies, P. Building Communities of Virtue: Political Theory, Land Use Policy, and the ‘Not in my Backyard’. Syracuse L. Rev. 1992, 43, 945. [Google Scholar]
  98. Wexler, M.N. A Sociological Framing of the Nimby (not-in-my-backyard) Syndrome. Int. Rev. Mod. Sociol. 1996, 26, 91–110. Available online: https://about.jstor.org/terms (accessed on 18 March 2022).
  99. Rasmussen, T.H. Not in My Backyard: The Politics of Siting Prisons, Landfills, and Incinerators. State Local Gov. Rev. 1992, 24, 128–134. Available online: https://www.jstor.org/stable/4355046 (accessed on 15 March 2022).
  100. Xu, M.; Lin, B. Exploring the “not in my backyard” effect in the construction of waste incineration power plants—Based on a survey in metropolises of China. Environ. Impact Assess. Rev. 2020, 82, 106377. [Google Scholar] [CrossRef]
  101. ANSA. Stop alla Vendita di Auto a Benzina e Diesel dal 2035—Attualità—ANSA.it. 2022. Available online: https://www.ansa.it/canale_motori/notizie/attualita/2022/06/08/stop-alla-vendita-di-auto-benzina-diesel-gpl-dal-2035-via-libera-dal-parlamento-europeo_32037239-8d4a-4a3c-98e9-0c933fb7e168.html (accessed on 20 March 2022).
  102. Mu, D.; Seager, T.P.; Rao, P.S.C.; Park, J.; Zhao, F. A resilience perspective on biofuel production. Integr. Environ. Assess. Manag. 2011, 7, 348–359. [Google Scholar] [CrossRef] [PubMed]
  103. Cheng, S.Y.; Show, P.L.; Lau, B.F.; Chang, J.S.; Ling, T.C. New Prospects for Modified Algae in Heavy Metal Adsorption. Trends Biotechnol. 2019, 37, 1255–1268. [Google Scholar] [CrossRef]
  104. Cruz-Suárez, L.E.; León, A.; Peña-Rodríguez, A.; Rodríguez-Peña, G.; Moll, B.; Ricque-Marie, D. Shrimp/Ulva co-culture: A sustainable alternative to diminish the need for artificial feed and improve shrimp quality. Aquaculture 2010, 301, 64–68. [Google Scholar] [CrossRef]
  105. Kanno, K.; Fujita, Y.; Honda, S.; Takahashi, S.; Kato, S. Urethane foam of sulfated polysaccharide ulvan derived from green-tide-forming chlorophyta: Synthesis and application in the removal of heavy metal ions from aqueous solutions. Polym. J. 2014, 46, 813–818. [Google Scholar] [CrossRef]
  106. Khoo, C.G.; Dasan, Y.K.; Lam, M.K.; Lee, K.T. Algae biorefinery: Review on a broad spectrum of downstream processes and products. Bioresour. Technol. 2019, 292, 121964. [Google Scholar] [CrossRef]
  107. Koçer, A.T.; Özçimen, D. Investigation of the biogas production potential from algal wastes. Waste Manag. Res. 2018, 36, 1100–1105. [Google Scholar] [CrossRef]
  108. Van Tran, T.T.; Truong, H.B.; Tran, N.H.V.; Quach, T.M.T.; Nguyen, T.N.; Bui, M.L.; Yuguchi, Y.; Thanh, T.T.T. Structure, conformation in aqueous solution and antimicrobial activity of ulvan extracted from green seaweed Ulva reticulata. Nat. Prod. Res. 2018, 32, 2291–2296. [Google Scholar] [CrossRef]
  109. el Harchi, M.; Fakihi Kachkach, F.Z.; el Mtili, N. Optimization of thermal acid hydrolysis for bioethanol production from Ulva rigida with yeast Pachysolen tannophilus. S. Afr. J. Bot. 2018, 115, 161–169. [Google Scholar] [CrossRef]
  110. Suganya, T.; Renganathan, S. Optimization and kinetic studies on algal oil extraction from marine macroalgae Ulva lactuca. Bioresour. Technol. 2012, 107, 319–326. [Google Scholar] [CrossRef]
  111. Yaich, H.; Amira, A.B.; Abbes, F.; Bouaziz, M.; Besbes, S.; Richel, A.; Blecker, C.; Attia, H.; Garna, H. Effect of extraction procedures on structural, thermal and antioxidant properties of ulvan from Ulva lactuca collected in Monastir coast. Int. J. Biol. Macromol. 2017, 105, 1430–1439. [Google Scholar] [CrossRef]
  112. Park, J.I.; Lee, J.; Sim, S.J.; Lee, J.H. Production of hydrogen from marine macro-algae biomass using anaerobic sewage sludge microflora. Biotechnol. Bioprocess. Eng. 2009, 14, 307–315. [Google Scholar] [CrossRef]
  113. Mhatre, A.; Gore, S.; Mhatre, A.; Trivedi, N.; Sharma, M.; Pandit, R.; Anil, A.; Lali, A. Effect of multiple product extractions on bio-methane potential of marine macrophytic green alga Ulva lactuca. Renew. Energy 2019, 132, 742–751. [Google Scholar] [CrossRef]
  114. Marinho-Soriano, E.; Bourret, E. Effects of season on the yield and quality of agar from Gracilaria species (Gracilariaceae, Rhodophyta). Bioresour. Technol. 2003, 90, 329–333. [Google Scholar] [CrossRef]
  115. Meinita, M.D.N.; Marhaeni, B.; Oktaviani, D.F.; Jeong, G.T.; Hong, Y.K. Comparison of bioethanol production from cultivated versus wild Gracilaria verrucosa and Gracilaria gigas. J. Appl. Phycol. 2018, 30, 143–147. [Google Scholar] [CrossRef]
  116. Francavilla, M.; Franchi, M.; Monteleone, M.; Caroppo, C. The red seaweed Gracilaria gracilis as a multi products source. Mar. Drugs 2013, 11, 3754–3776. [Google Scholar] [CrossRef]
  117. Guimarães, M.; Viana, A.G.; Duarte, M.E.R.; Ascêncio, S.D.; Plastino, E.M.; Noseda, M.D. Low-molecular-mass carbohydrates and soluble polysaccharides of green and red morphs of Gracilaria domingensis (Gracilariales, Rhodophyta). Bot. Mar. 2007, 50, 314–317. [Google Scholar] [CrossRef]
  118. Habig, C.; Debusk, T.A.; Ryther, J.H. The Effect of Nitrogen Content on Methane Production by the Marine Algae Gracilaria tikvahiae and Ulva sp. Biomass 1984, 4, 239–251. [Google Scholar] [CrossRef]
  119. Luo, H.; Wang, Q.; Liu, Z.; Wang, S.; Long, A.; Yang, Y. Potential bioremediation effects of seaweed Gracilaria lemaneiformis on heavy metals in coastal sediment from a typical mariculture zone. Chemosphere 2020, 245, 125636. [Google Scholar] [CrossRef]
  120. Raja, R.; Hemaiswarya, S.; Arunkumar, K.; Carvalho, I.S. Antioxidant activity and lipid profile of three seaweeds of Faro, Portugal. Rev. Bras. Bot. 2016, 39, 9–17. [Google Scholar] [CrossRef]
  121. Kartik, A.; Akhil, D.; Lakshmi, D.; Gopinath, K.P.; Arun, J.; Sivaramakrishnan, R.; Pugazhendhi, A. A critical review on production of biopolymers from algae biomass and their applications. Bioresour. Technol. 2021, 329, 124868. [Google Scholar] [CrossRef]
  122. Homes & Communities Agency. Guidance on Dereliction, Demolition and Remediation Costs; Homes and Communities Agency: London, UK, 2015. [Google Scholar]
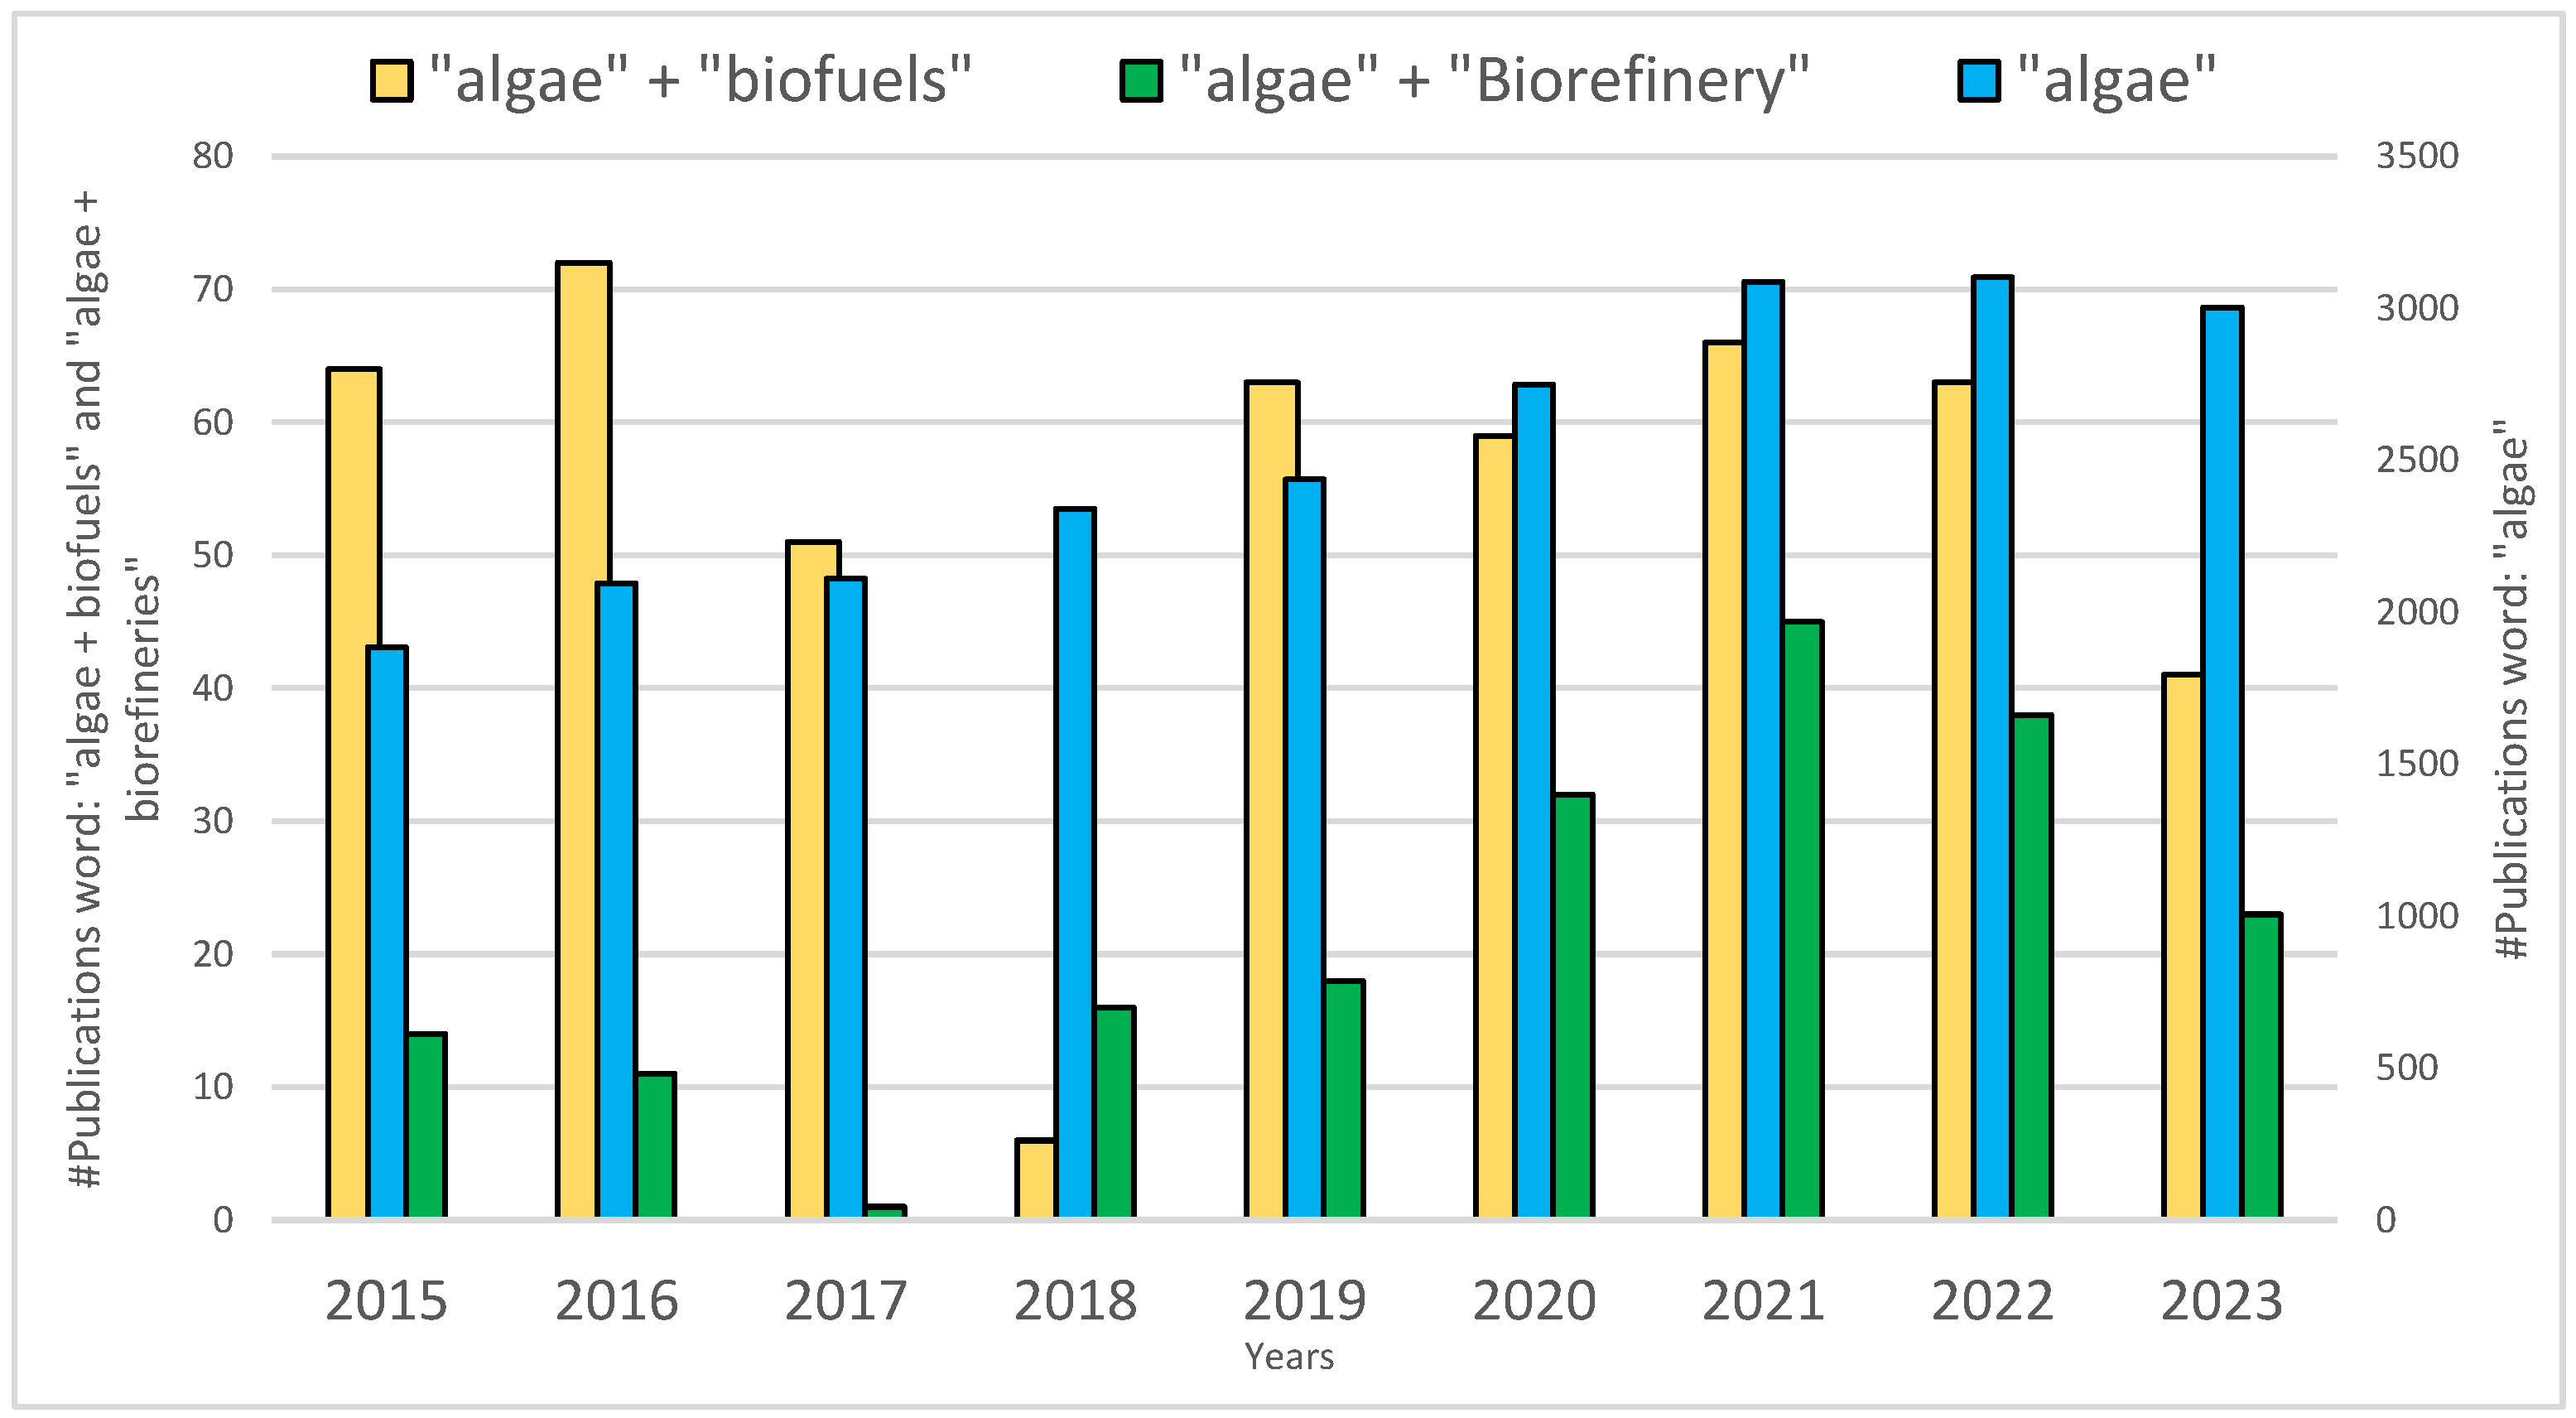
Figure 1. Publications related to algae and biorefineries based on Web of Science in 2024.
Pollutants 04 00027 g001
Figure 2. Satellite view of northern Italy and the northern Adriatic Sea, the lagoon is situated in the yellow circle [55].
Pollutants 04 00027 g002
Figure 3. Images of the Po delta from Google Maps the lagoon is situated in the yellow circle (A1,A2).
Pollutants 04 00027 g003
Figure 4. Satellite reconstruction of a severe bloom happening in 2005; (left): 26 May, (right): 31 May. It took only five days to almost completely cover the lagoon [57].
Pollutants 04 00027 g004
Figure 5. Routes from Goro to Ostellato; Google Maps.
Pollutants 04 00027 g005
Figure 6. The cumulative costs vs. cumulative benefits with the breakeven point for Scenario 1. A 5% discount rate over a period of 30 years.
Pollutants 04 00027 g006
Figure 7. The cumulative costs vs. cumulative benefits with the breakeven point for Scenario 2d. A 5% discount rate over a period of 30 years.
Pollutants 04 00027 g007
Figure 8. The cumulative costs vs. cumulative benefits with the breakeven point for Scenario 3. A 5% discount rate over a period of 30 years.
Pollutants 04 00027 g008
Figure 9. The cumulative costs vs. cumulative benefits with the breakeven point for Scenario 2b. A 5% discount rate over a period of 30 years.
Pollutants 04 00027 g009
Figure 10. The cumulative costs vs. cumulative benefits with the breakeven point for Scenario 2a. A 5% discount rate over a period of 30 years.
Pollutants 04 00027 g010
Figure 11. The cumulative costs vs. cumulative benefits with the breakeven point for Scenario 2c. A 5% discount rate over a period of 30 years.
Pollutants 04 00027 g011
Figure 12. The cumulative costs vs. cumulative benefits with the breakeven point for Scenario 1. A decreasing discount rate over a period of 30 years.
Pollutants 04 00027 g012
Figure 13. The cumulative costs vs. cumulative benefits with the breakeven point for Scenario 2d. A decreasing discount rate over a period of 30 years.
Pollutants 04 00027 g013
Figure 14. Po river’s hydrogeological basin (blue). In yellow are the regional limits, and in red are the competence limits.
Pollutants 04 00027 g014
Table 1. Algal biomass in Goro’s lagoon clean-up, disposal, and maintenance costs are reported from 2016 up to 2021. These data, from the CO.SA.GO. cooperative, were kindly provided by the administration of Goro’s town—ref: M. Zappaterra.
Case 1: Do-Nothing (Status Quo): Bio-Stabilized for Landfill
Year201620172018201920202021
Biomass (tonn)91295.4419.7471.940120
Maintenance cost€32,150.00€14,280.00€19,600.00€15,600.00€0€36,750.00
Sea-Transport Cost€40,162.50€17,325.00€0€12,800.00€1800.00€10,800.00
Land-Transport Cost€14,350.00€1684.00€2800.00€1400.00€0€2100.00
Disposal Cost (HERA)€5000.00€5000.00€5000.00€1798.50€0€3003.50
Total Expenditure Costs€91,662.50€38,289.00€27,400.00€31,598.50€1800.00€52,653.50
Table 3. Cost–Benefit Analysis; Net Present Value (Equation (1)) for the Scenarios with various discount rates.
Discount RateNPV
(Million Euros)
Biofuel only0.50%10,572.75
1.00%9707.21
3.00%7012.87
5%5192.06
10%2676.16
Biofuel + bioproduct 2.a0.50%63.89
1.00%25.57
3.00%−91.87
5%−168.65
10%−266.46
Biofuel + bioproduct 2.b0.50%1118.20
1.00%977.99
3.00%532.37
5%223.15
10%−211.01
Multiproduct biorefinery 2.c0.50%−1240.05
1.00%−1164.32
3.00%−927.37
5%−765.58
10%−536.55
Multiproduct biorefinery 2.d0.50%5605.41
1.00%5114.74
3.00%3589.83
5%2562.79
10%1154.43
Bioproducts only0.50%3103.44
1.00%2873.61
3.00%2155.87
5%1667.65
10%983.20
Disclaimer/Publisher’s Note: The statements, opinions and data contained in all publications are solely those of the individual author(s) and contributor(s) and not of MDPI and/or the editor(s). MDPI and/or the editor(s) disclaim responsibility for any injury to people or property resulting from any ideas, methods, instructions or products referred to in the content.