
Natural Disasters’ Impact on Water Quality and Public Health: A Case Study of the Cyclonic Season (2019–2023)

 , , , , , and
Abstract
1. Introduction
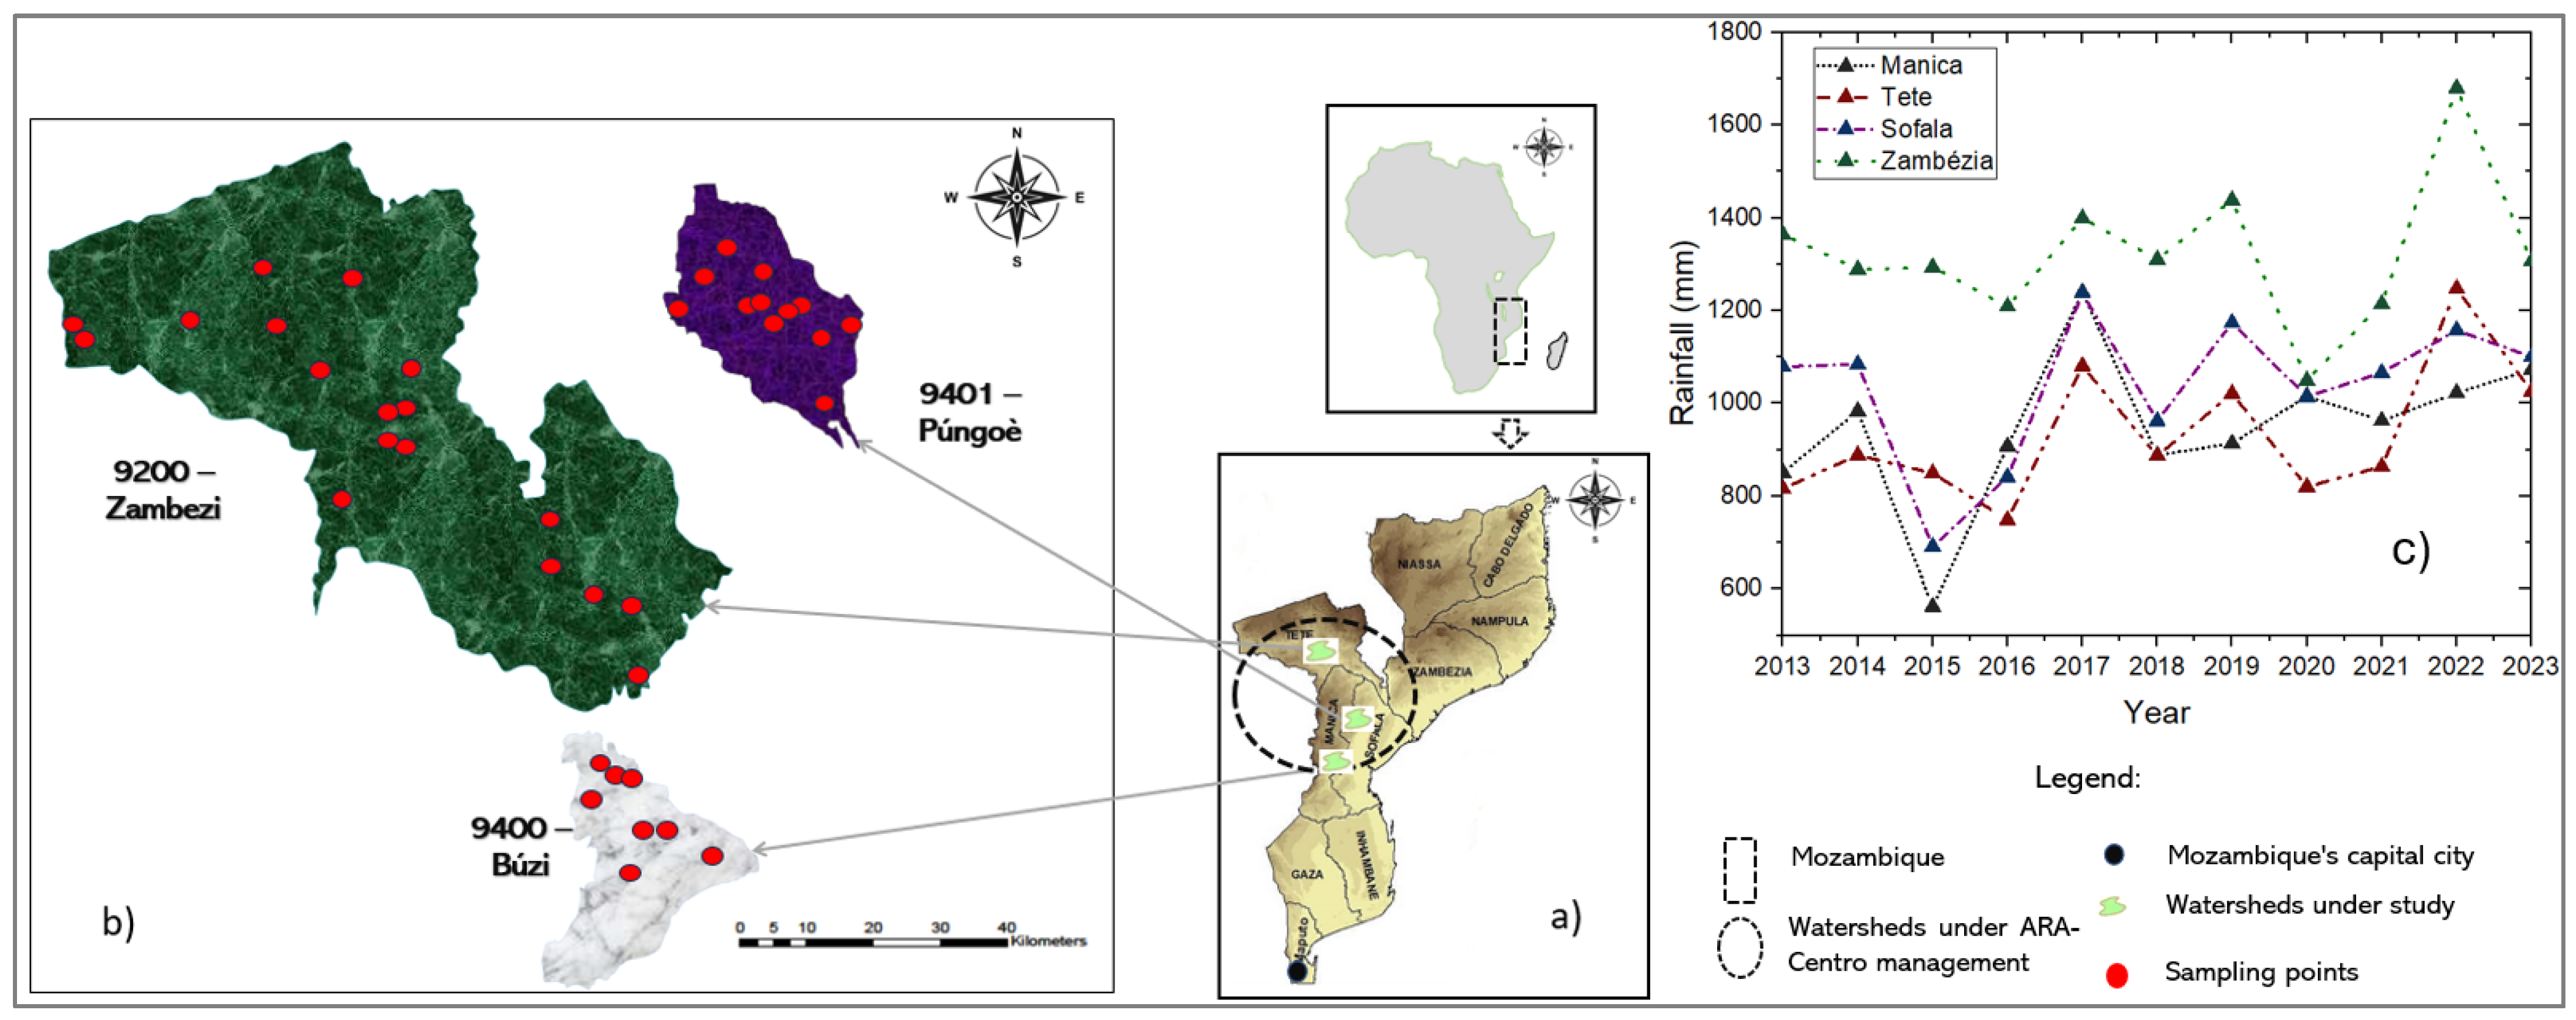
2. Study Area
3. Materials and Methods
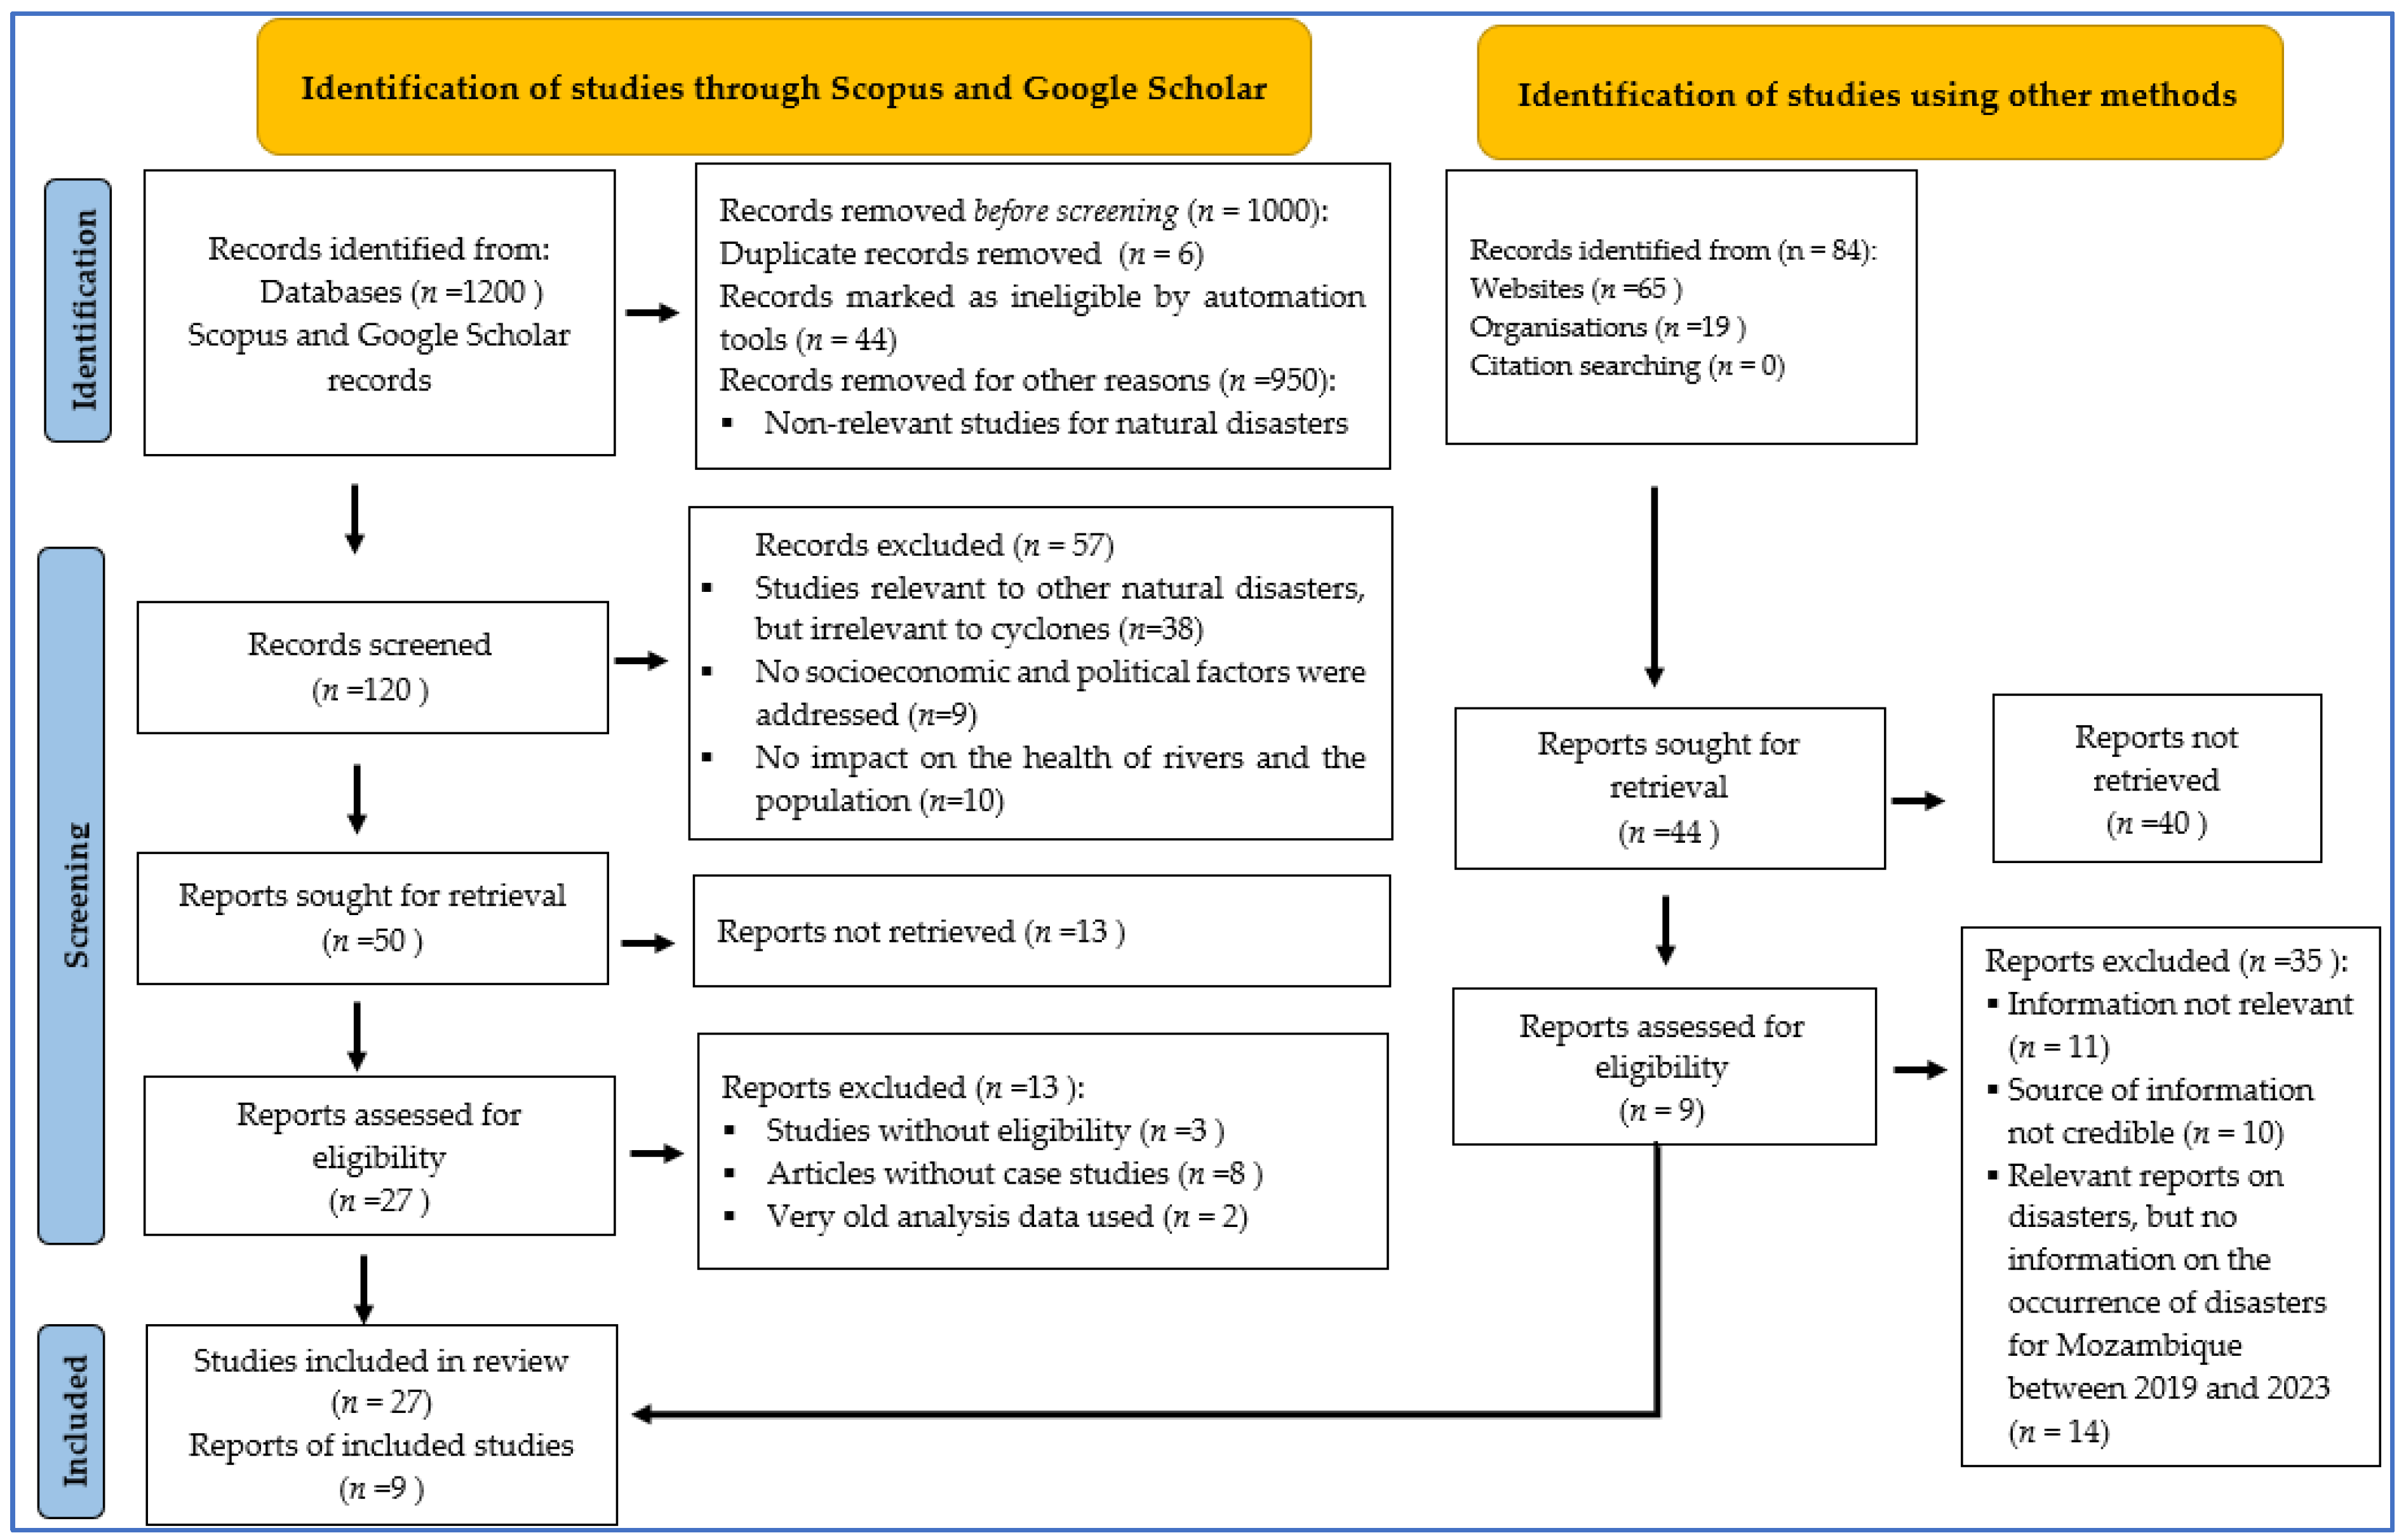
3.1. Systematic Review
3.2. Data Collection
3.2.1. Satellite Data
3.2.2. Water Quality Data
3.2.3. Population Health Data
3.3. Methods of Analysis
3.3.1. Analysing Flooded Areas
3.3.2. Statistical Analysis
4. Results and Discussion
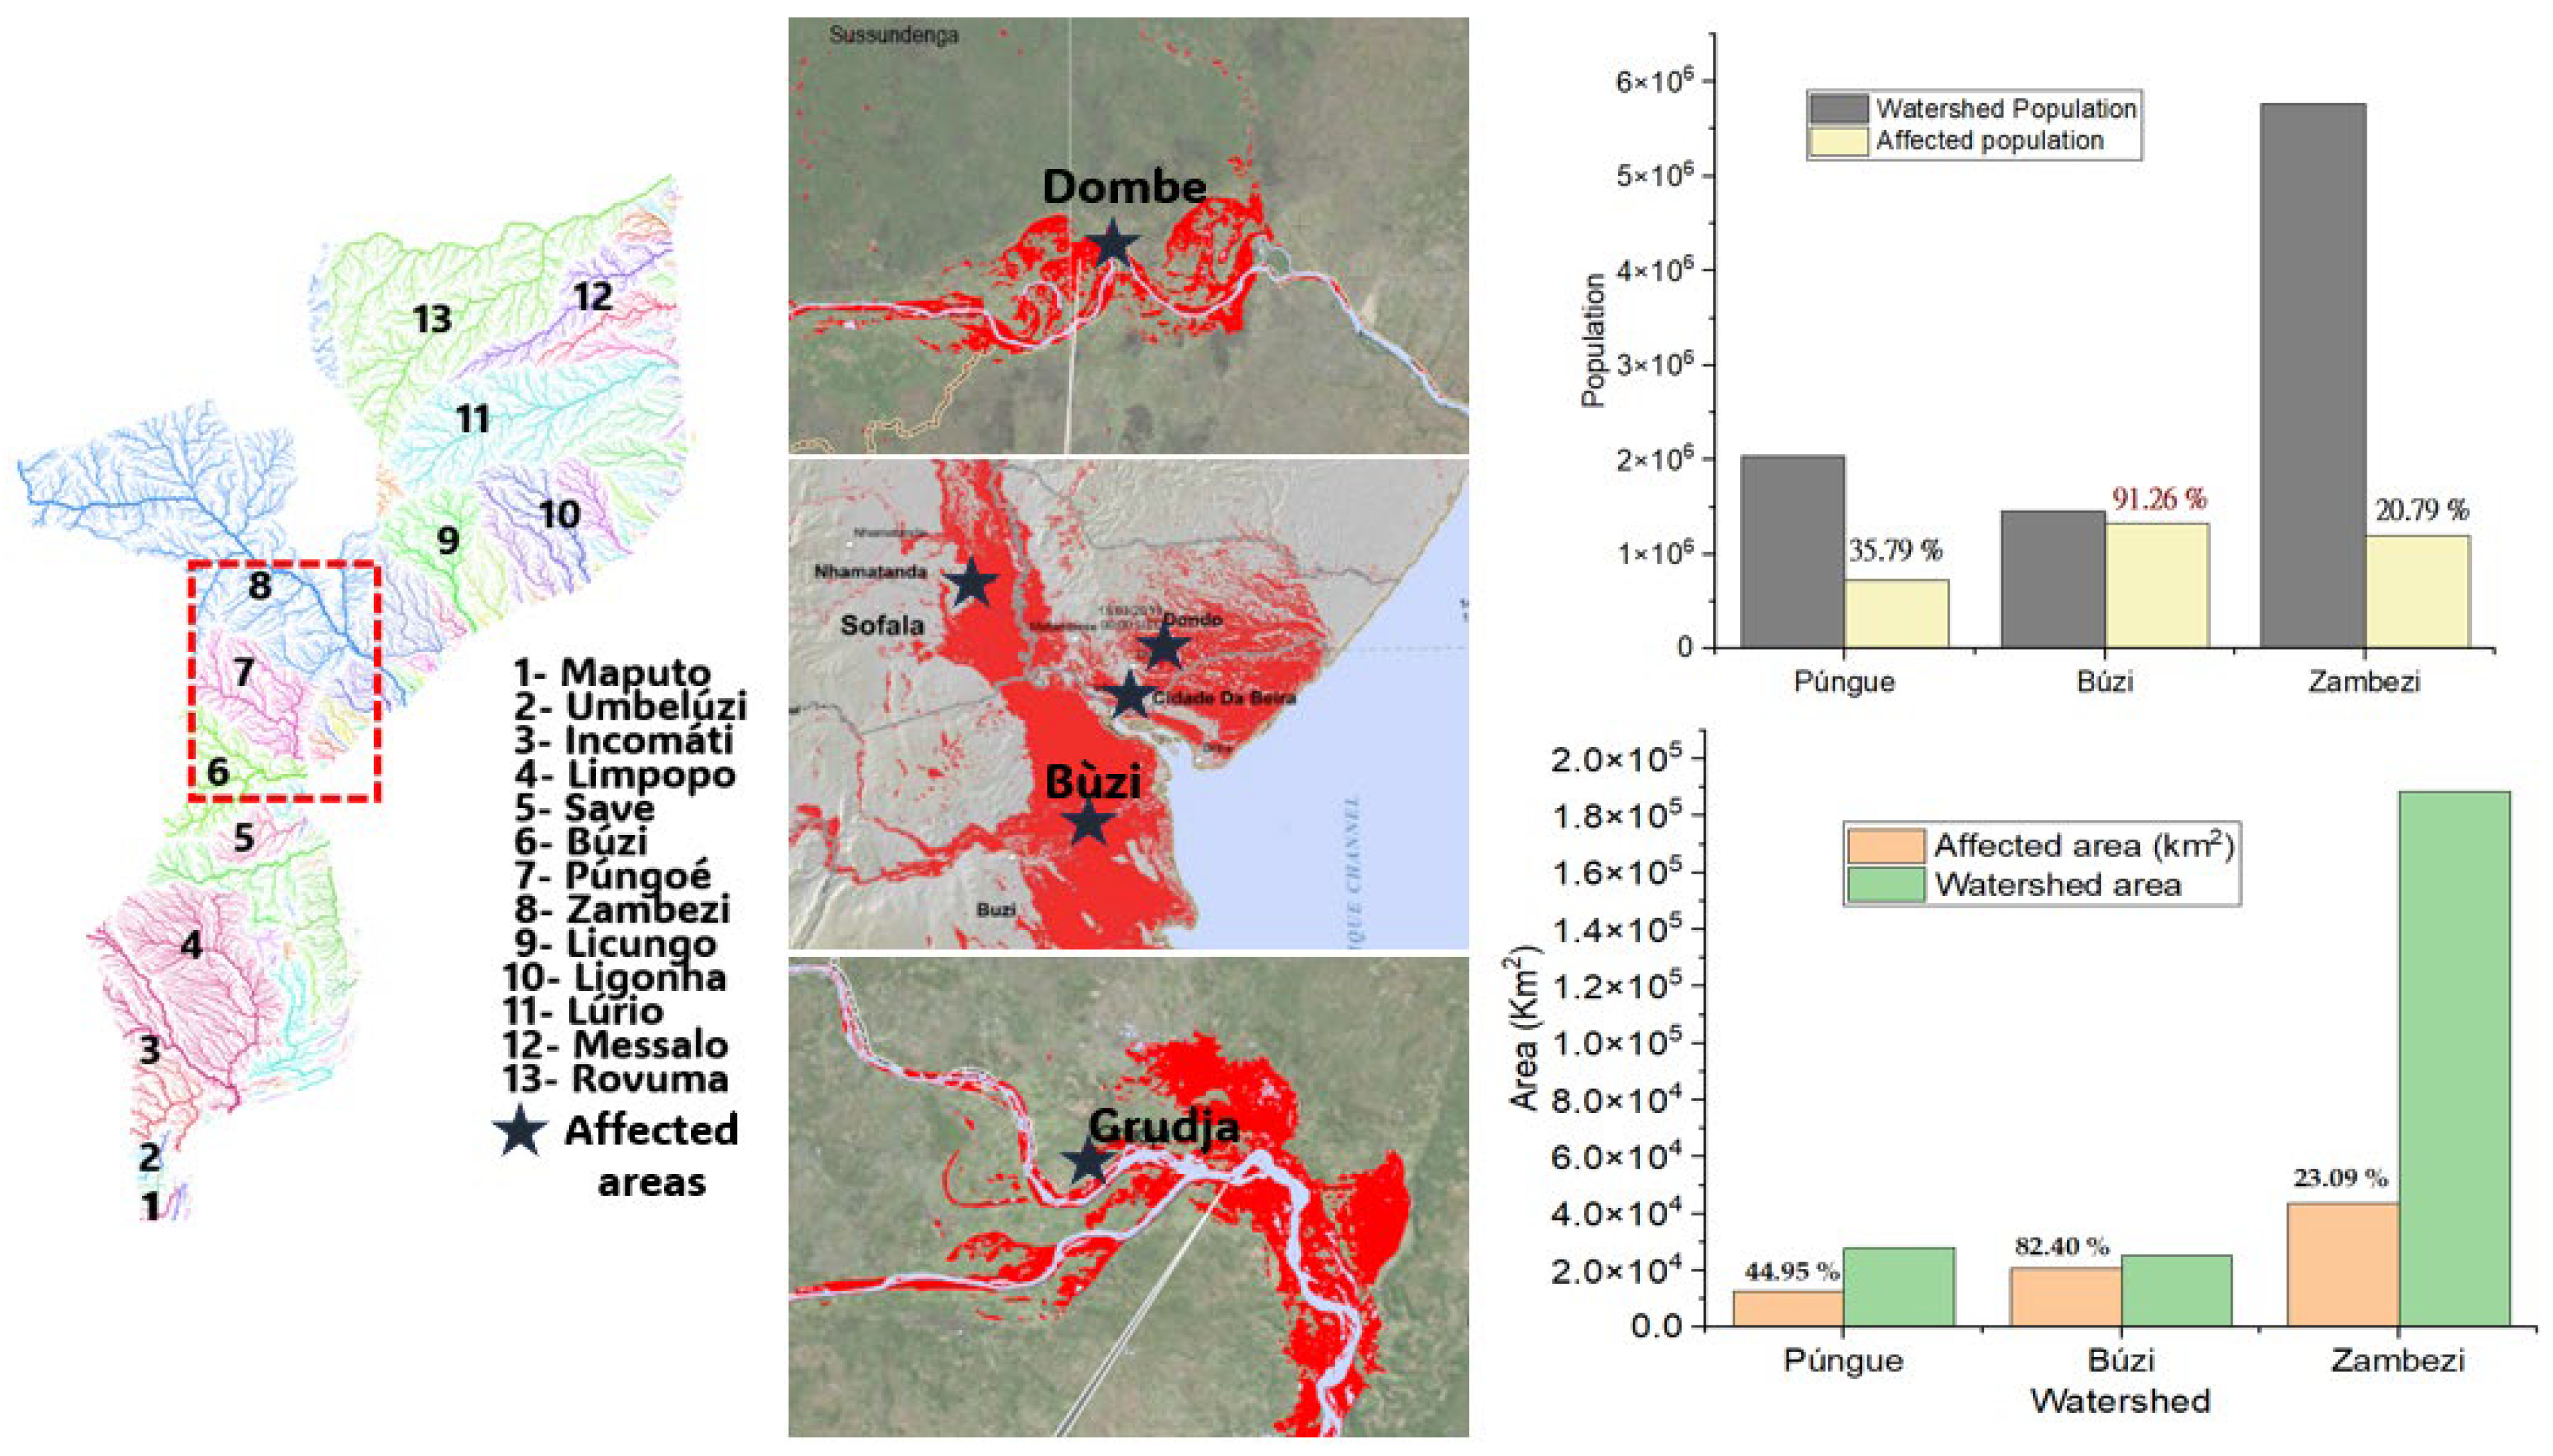
4.1. Impacts of Natural Disasters (Cyclones)

| Cyclone | Saffir-Simpson Scale (Category) | Wind Speed (Km/h) | Diameter (Km) | Air Pressure (mbar) | Affected Population (hab) | Killed People | Destroyed Infrastructures | Affected River Basins | Occurrence Date | Affected Provinces |
|---|---|---|---|---|---|---|---|---|---|---|
| Freddy | 3–5 | 183–256 | 556 | 957 | 1,300,000 | 165 | 236,000 | Licungo and Zambeze | 2 March 2023 | Zambézia, Tete and Inhambane |
| Gombe | 3 | 183 | 630 | 954 | 736,015 | 63 | 78,635 | Monapo, Ligonha, Zambeze and Rovuma | 8 March 2023 | Nampula, Niassa and Tete |
| Ana | tempestade tropical | 93 | 148 | 993 | 120,000 | 18 | 23,400 | Monapo, Ligonha and Zambeze | 23 January 2022 | Nampula and Tete |
| Guambe | 2 | 161 | 1185 | 957 | 36,135 | 2 | 78,635 | Licungo, Púngoé and Lipompo | 11 February 2021 | Gaza, Inhambane and Sofala |
| Eloise | tempestade tropical | 157 | 1259 | 965 | 469,831 | 11 | 17,000 | Púngoé, Zambeze and Lipompo | 11 January 2021 | Zambézia, Sofala and Gaza |
| Chalane | 1 | 124 | 982 | 975 | 73,254 | 11 | 25,365 | Licungo, Púngoé; Zambeze and Búzi | 4 January 2021 | Zambézia, Sofala and Manica |
| Kenneth | 4 | 226 | 148 | 934 | 289,987 | 45 | 240,000 | Rovuma and Messalo | 21 April 2021 | Cabo Delgado |
| Idai | 4 | 213 | 185 | 940 | 1,514,662 | 603 | 223,947 | Licungo, Púngoé, Zambeze, Búzi, Ligonha, Melúli and Monapo | 4 March 2019 | Zambézia, Nampula, Niassa, Sofala and Manica |
4.2. Flooded Areas Analysis
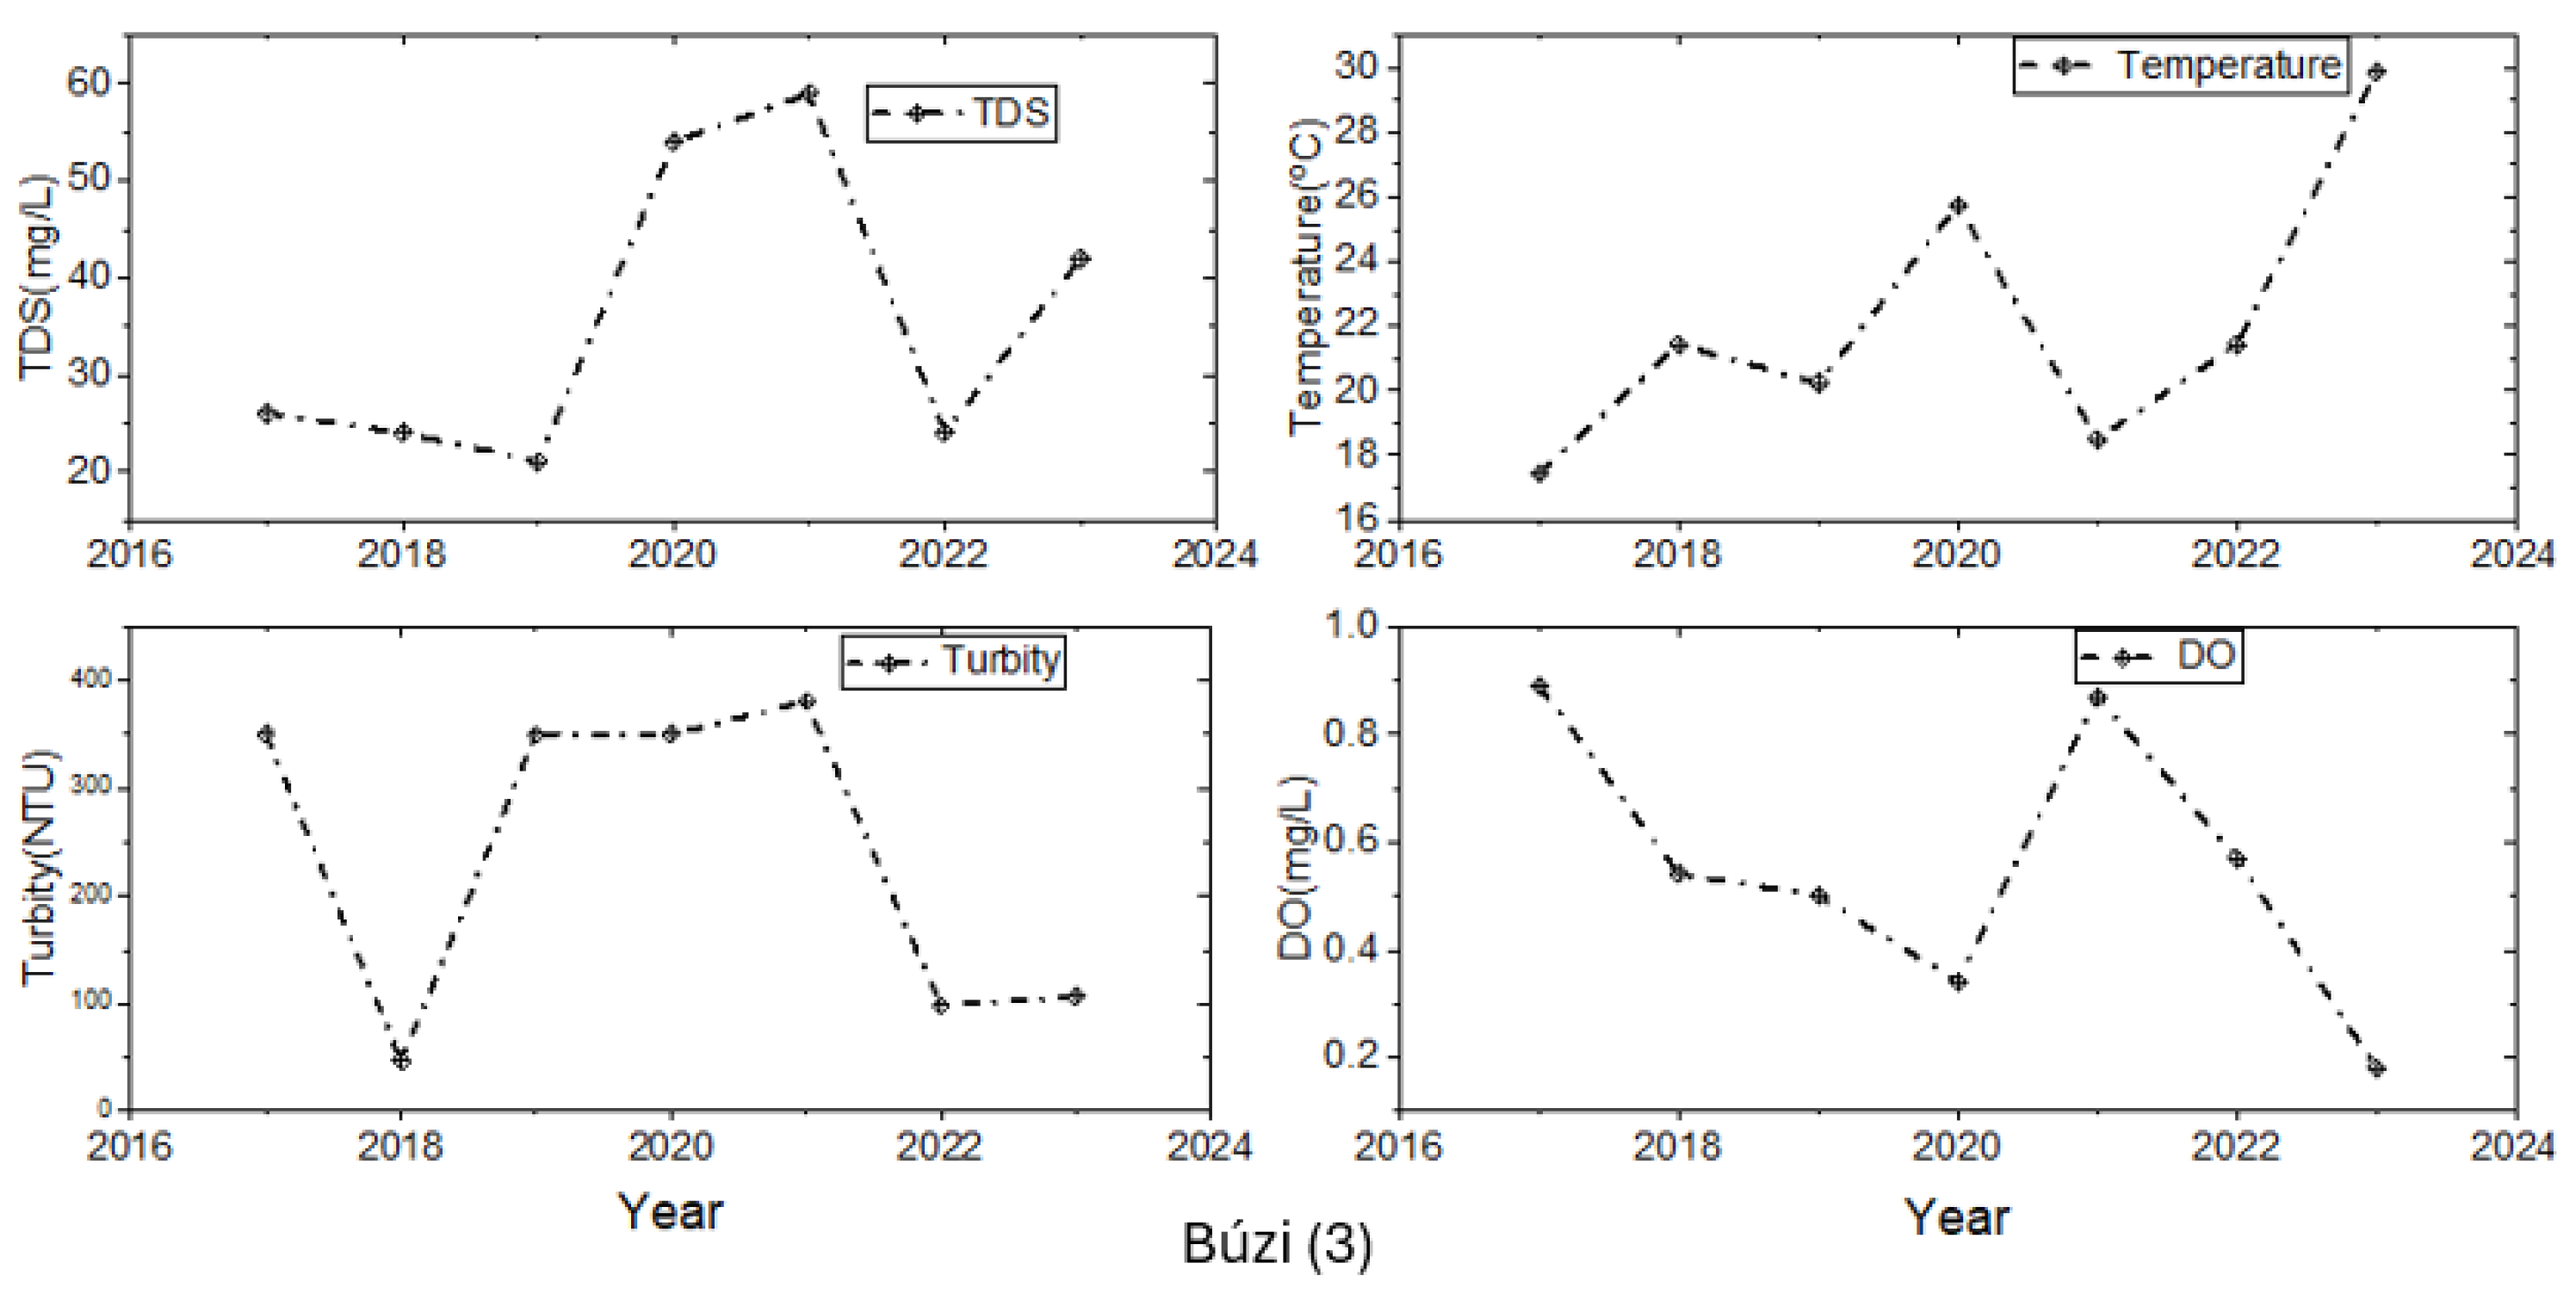
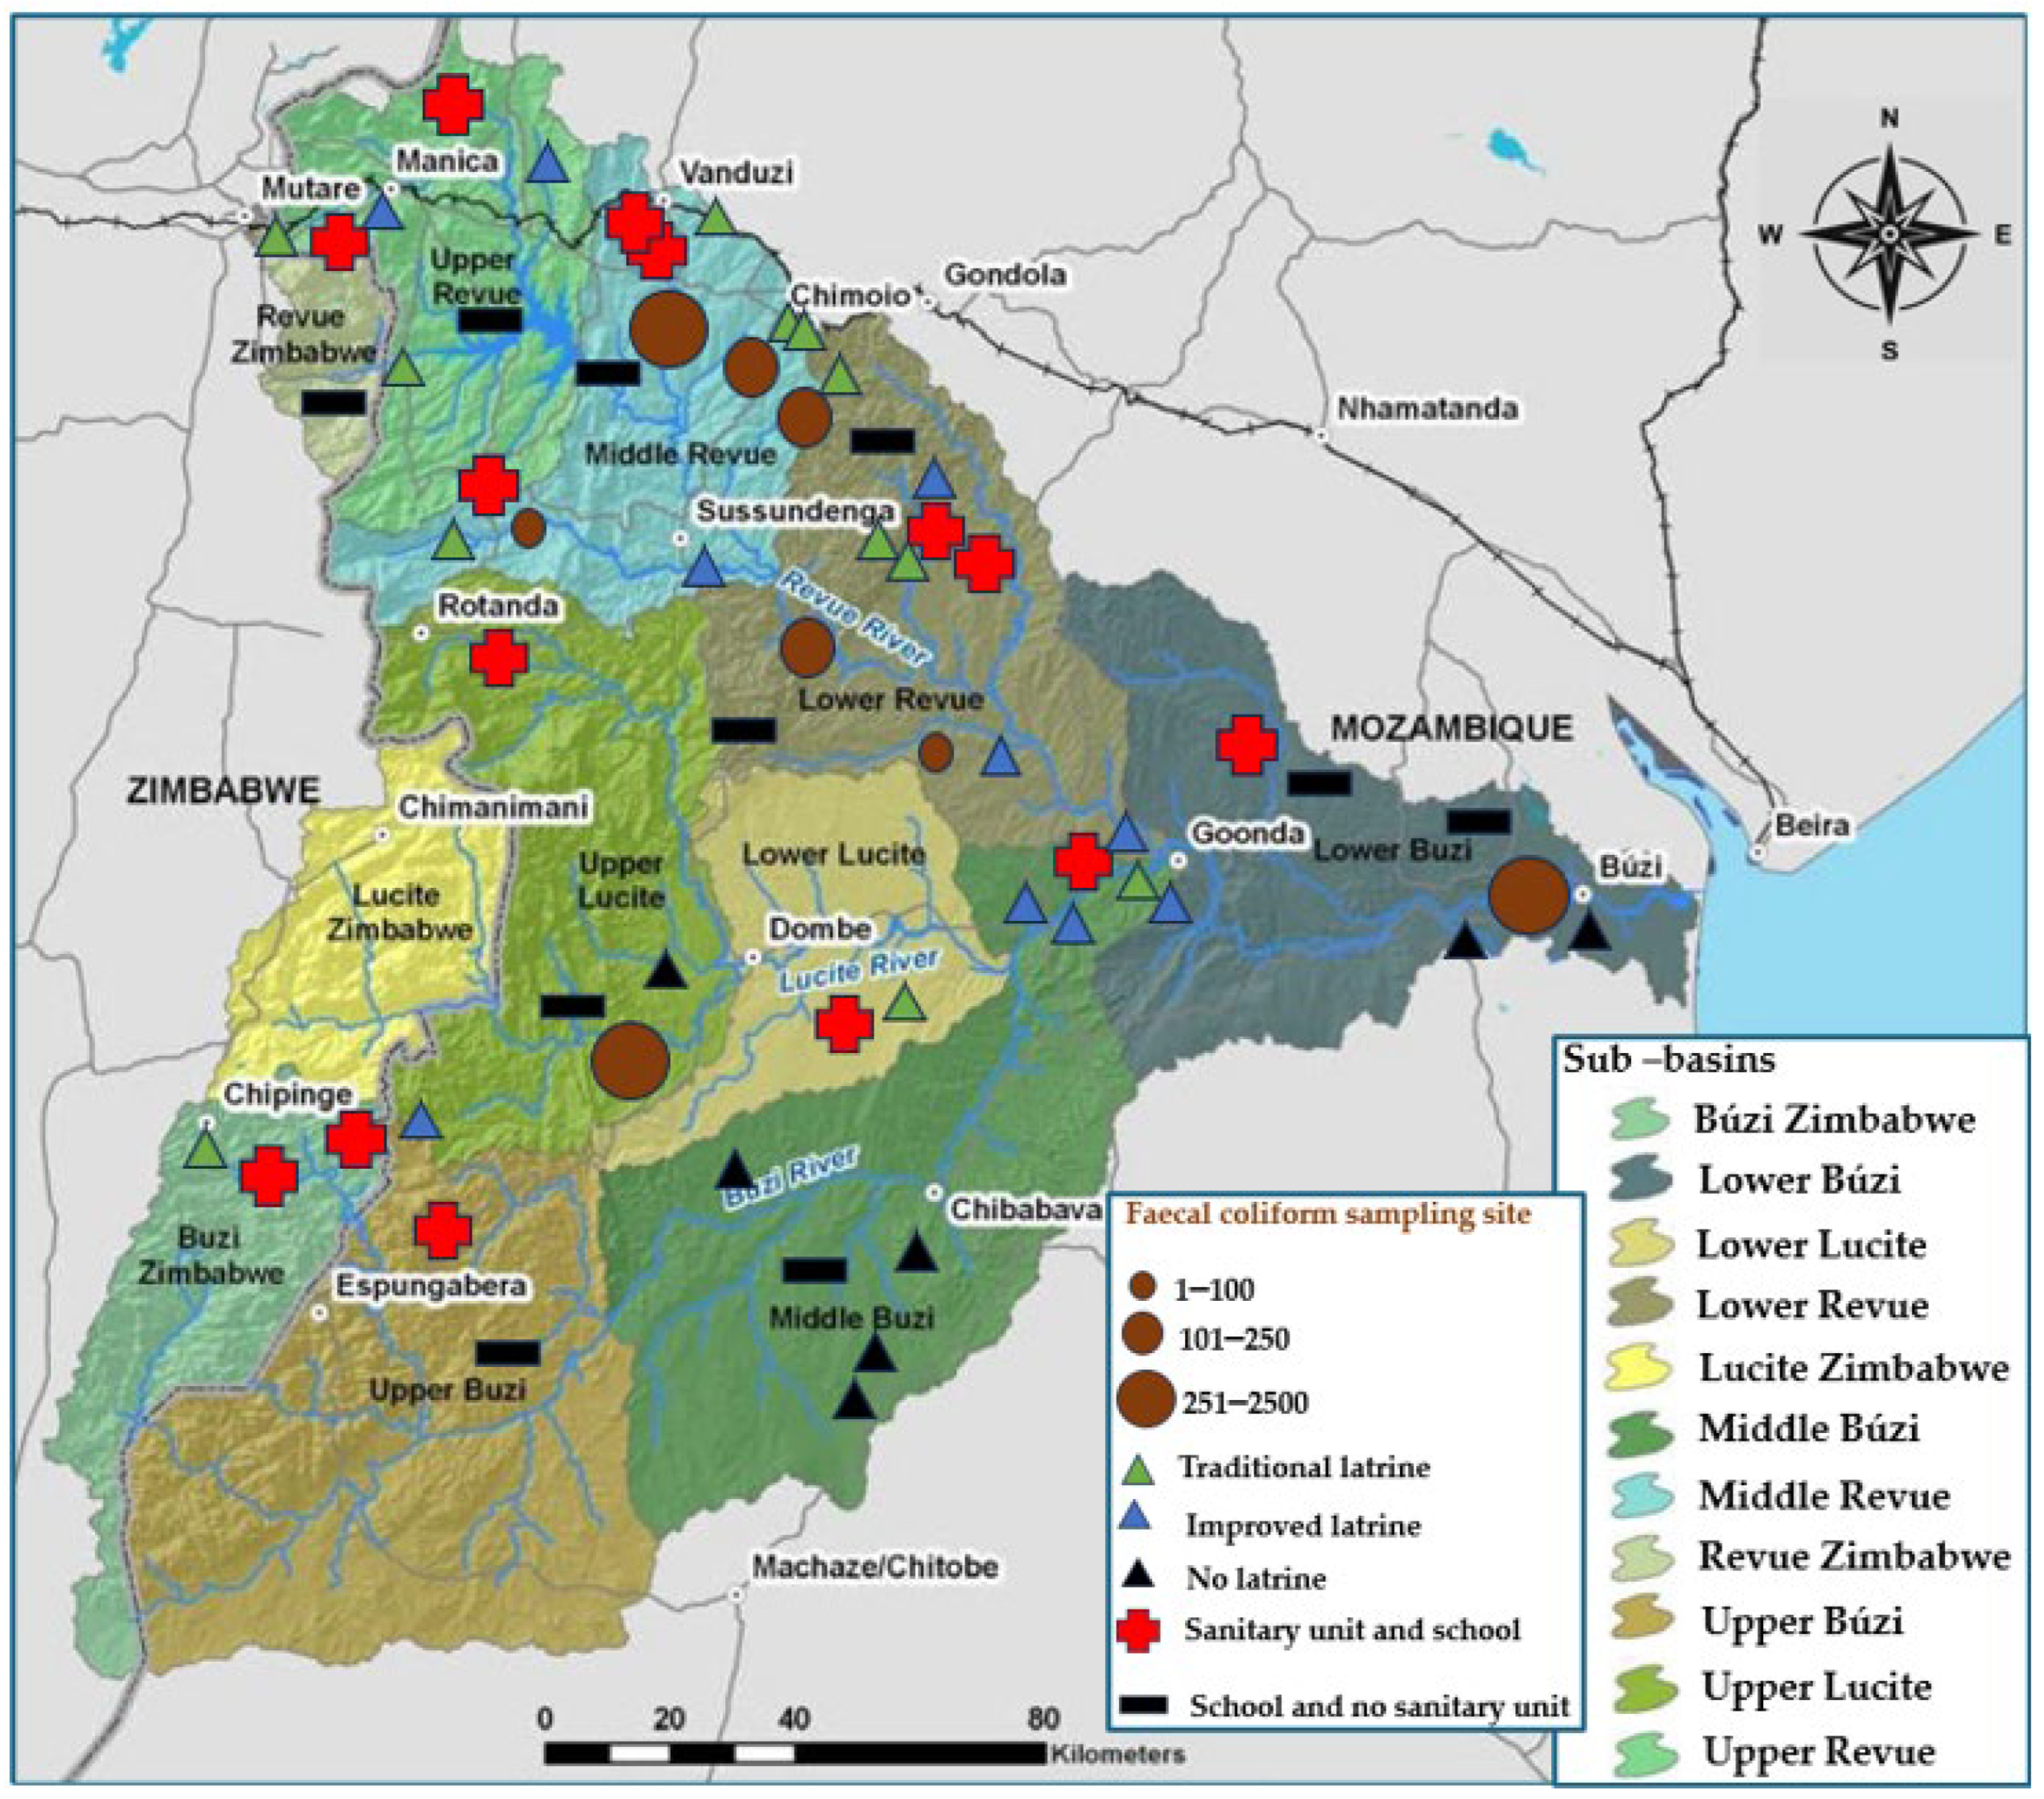
4.3. Water Quality Analysis
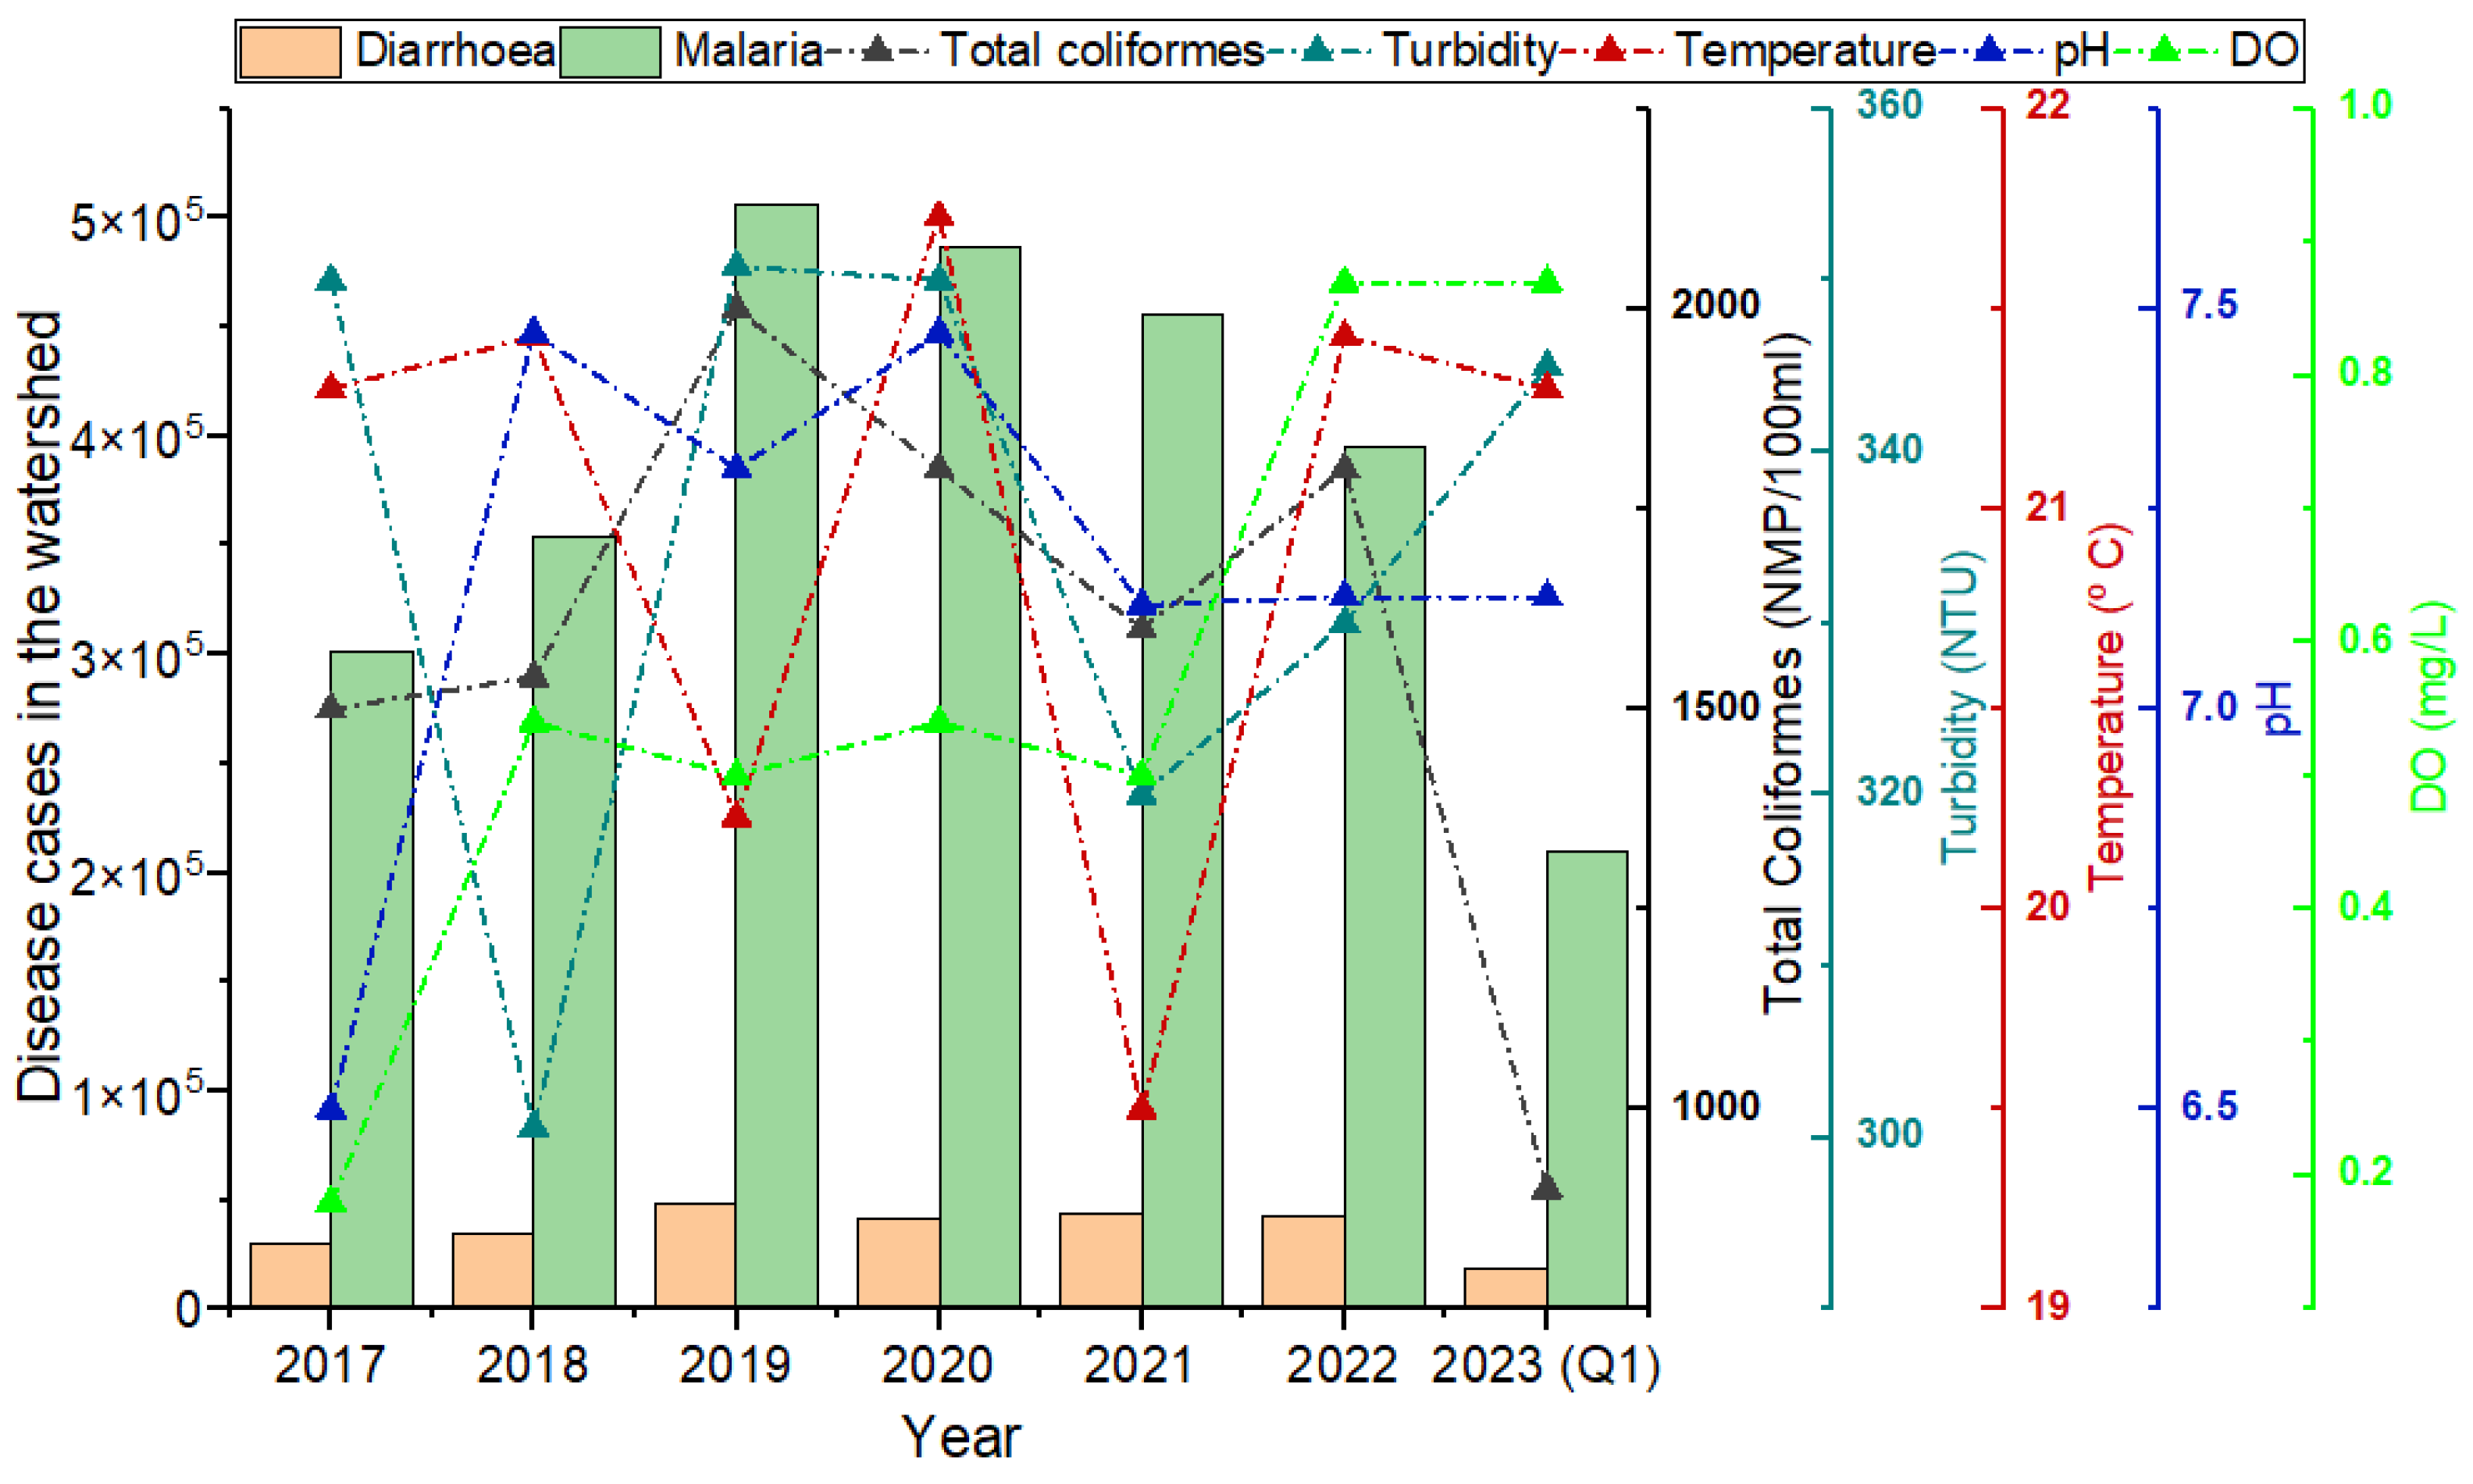
4.4. Waterborne Diseases and Basins’ Affected Population
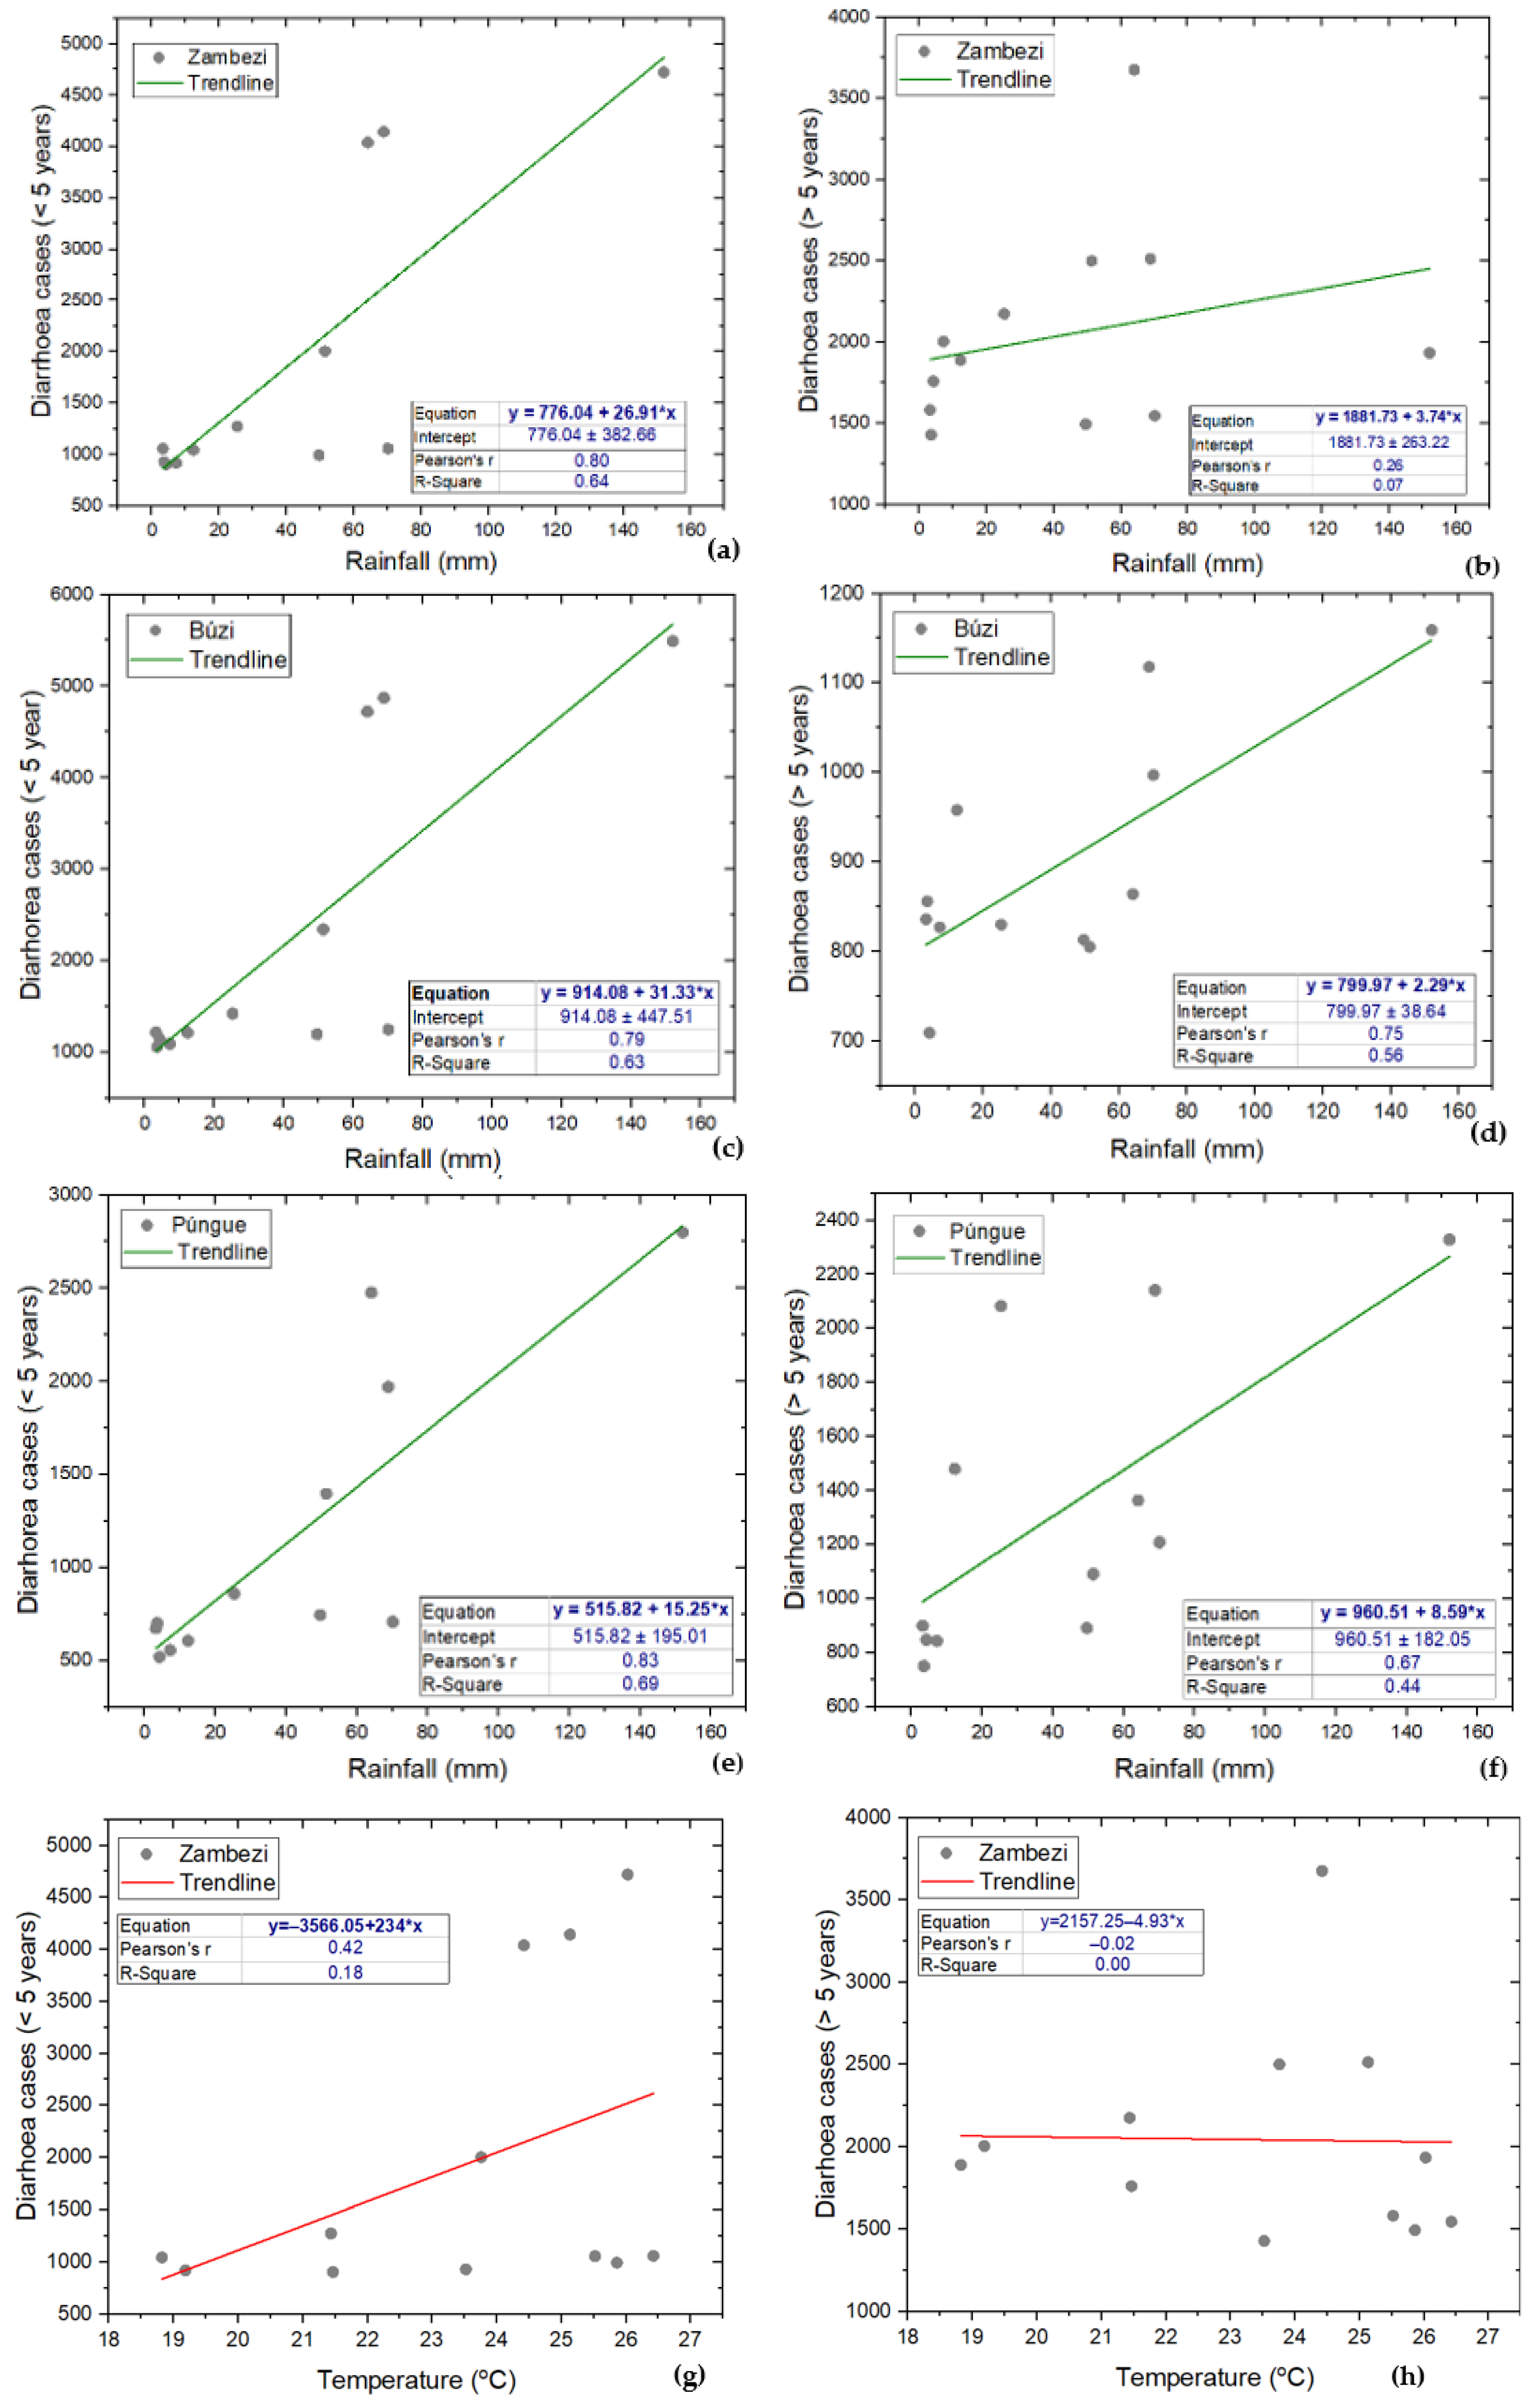
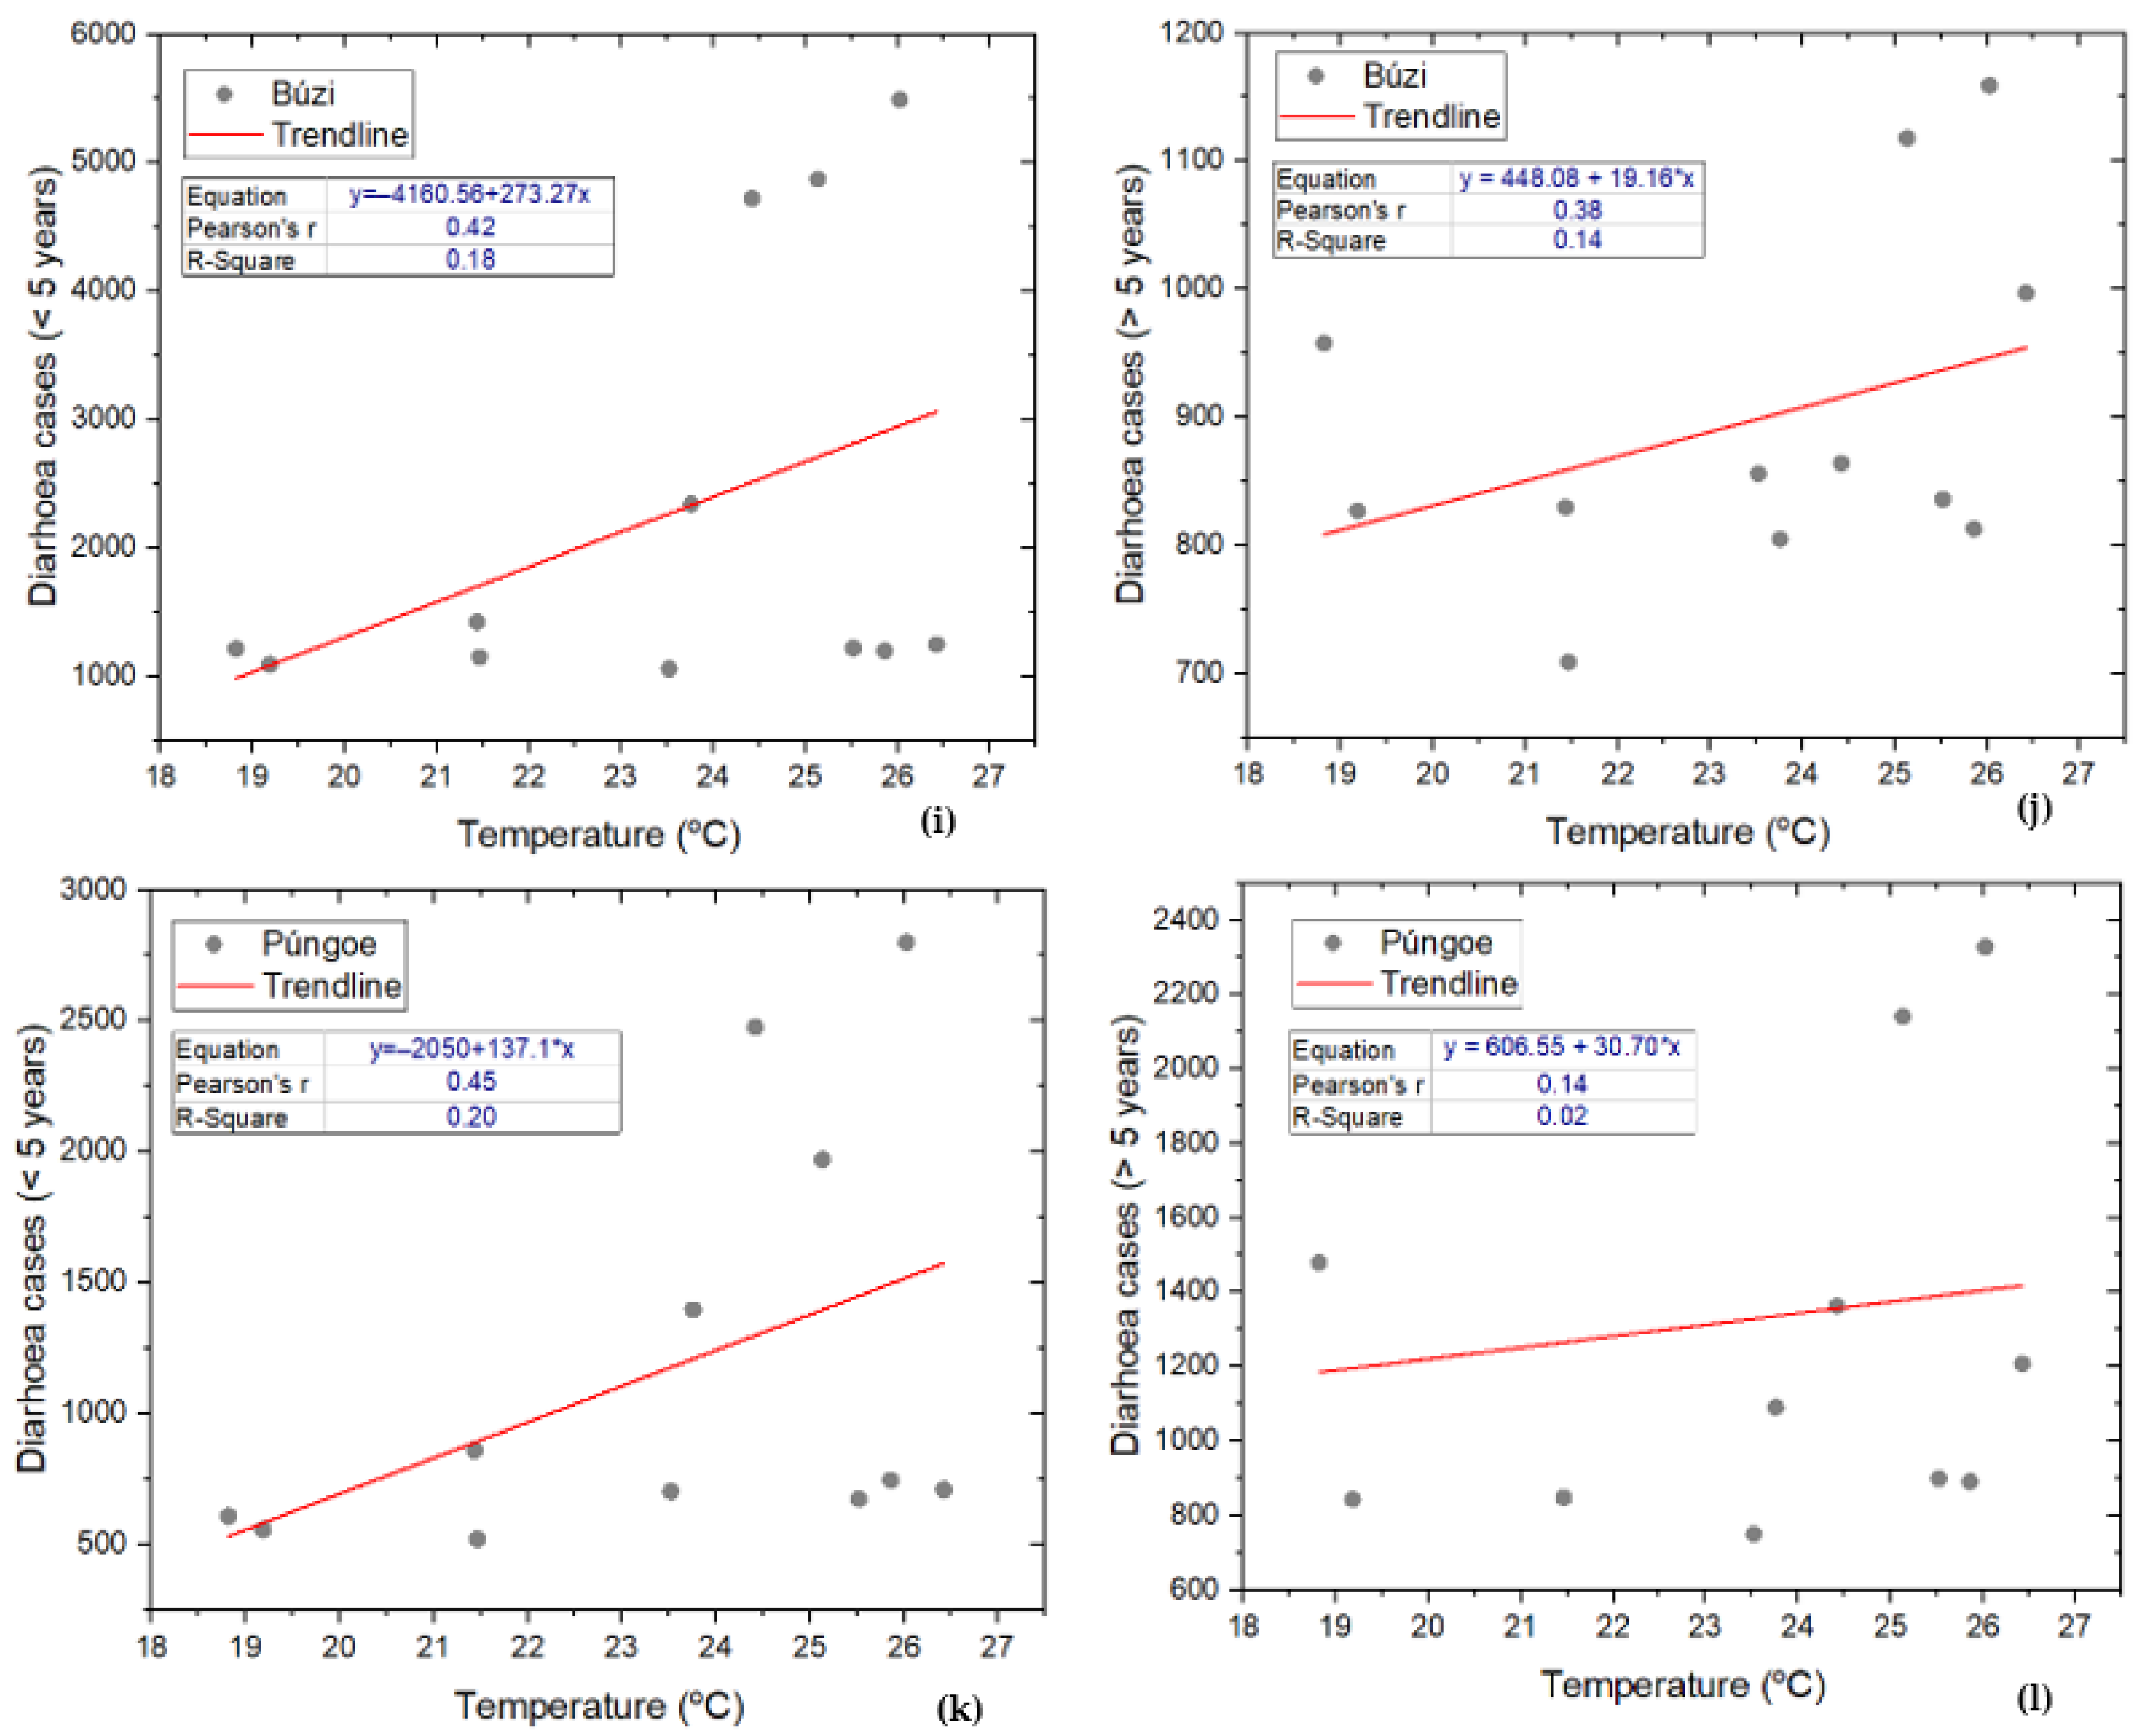
4.5. Correlation between Climate Parameters and Waterborne Diseases
4.6. Water, Sanitation and Hygiene (WASH) and Waterborne Disease Incidence
5. Conclusions
- i.
- The distribution of water pollution sources associated with natural disasters is heterogeneous, including agricultural practices, livestock farming, industry and open-air faecal farming. There are no monitoring data on land use and utilisation in the regions affected by cyclones, making it difficult to map polluting sources;
- ii.
- The current water quality standards are geared towards human consumption and several parameters are not monitored, ignoring the environmental and ecological significance of surface water versus influence on human health. In the future, standards will need to be further updated to guide water quality monitoring and management interventions in river basins in a more meaningful way;
- iii.
- There is complexity in obtaining complete water quality data for the three basins. Despite having 327 measuring stations (192 pluviometric, 115 hydrometric and 20 evaporimetric), only 38 are fully functional, which sometimes limits the monitoring of water quality parameters such as faecal coliforms, COD, BOD5 and DO, among others, due to the lack of reagents.
- ▪
- A sufficiently large distance (better than 50 m) between latrines/bathrooms outside homes and water wells, to reduce the likelihood of faecal–oral pathogens entering water wells, the main source of drinking water in peri-urban areas;
- ▪
- Innovative actions such as the construction of rainwater retention basins and detention reservoirs along the sub-basins, as ways of storing rainwater and wastewater from heavy rainfall and domestic sewage, respectively. These actions could reduce the concentrations of faecal coliforms and other types of microbial contamination downstream after an episode of heavy rain due to cyclones;
- ▪
- Mozambican legislation has made the ARAs responsible for the local implementation of Integrated Water Resources Management at the river basin level. This decentralisation must be accompanied by the necessary funds and technical resources to improve the monitoring and management processes of the three basins at the regional level.
Author Contributions
Funding
Data Availability Statement
Conflicts of Interest
References
- Da Silva, A.C.P.; Pinto, R.W.P.; de Freitas, M.M. Avaliação de políticas públicas relacionadas aos desastres naturais no Brasil, entre 1990–2014 Políticas públicas revisadas relacionadas a desastres naturais no Brasil entre 1990–2014. Rev. Ambiecia 2016, 12, 885–900. [Google Scholar] [CrossRef]
- UN Office for Disaster Risk Reduction (UNDRR). O Deslocamento por Desastres:como Reduzir o Risco, Abordar os Impactos e Reforçar a Resiliência. Available online: https://www.undrr.org/sites/default/files/2023-03/WiA_report_11_1_23_Portuguese-Web-final.pdf (accessed on 15 January 2024).
- Herold, S.; Michael, C.; Sawada. A Review of Geospatial Information Technology for Natural Disaster Management in Developing Countries. Int. J. Appl. Geospat. Res. 2012, 3, 24–62. [Google Scholar] [CrossRef]
- GoM, 2018 Governo de Moçambique (GoM). Plano Anual de Contingência 2019, 2018. Available online: https://sheltercluster.s3.eu-central-1.amazonaws.com/public/docs/pc_2019_aprovado_pelo_conselho_de_ministros_2018.11.20.pdf (accessed on 12 January 2024).
- Instituto Nacional de Gestão e Redução do Risco de Desastres (INGD). Relatório de Emergência da época Chuvosa e Ciclonica 2022–2023. Available online: https://www.ingd.gov.mz/ (accessed on 15 January 2024).
- Lee, J.; Perera, D.; Glickman, T.; Taking, L. Water-related disasters and their health impacts: A global review. Prog. Disaster Sci. 2020, 8, 100123. [Google Scholar] [CrossRef]
- Mugabe, V.A.; Gudo, E.S.; Inlamea, O.F.; Kitron, U. Natural disasters, population displacement and health emergencies: Multiple public health threats in Mozambique. BMJ Glob. Health 2021, 6, e006778. [Google Scholar] [CrossRef] [PubMed]
- Jung, Y.-J.; Kim, H.; Namkoong, S. Impact of Climate Change on Waterborne Diseases: Directions towards Sustainability. Water 2023, 15, 1298. [Google Scholar] [CrossRef]
- Braks, M.; Giglio, G.; Tomassone, L.; Sprong, H.; Leslie, T. Making vector-borne disease surveillance work: New opportunities from the SDG perspectives. Front. Vet. Sci. 2019, 6, 232. [Google Scholar] [CrossRef]
- UNICEF. Ciclone Idai e Kenneth. 2019. Available online: https://www.unicef.org/mozambique/ciclone-idai-e-kenneth (accessed on 15 January 2024).
- Instituto Nacional de Gestão e Redução do Risco de Desastres (INGD). Relatório de Emergência da época Chuvosa e Ciclónica 2021–2022, 2022. Available online: https://www.ingd.gov.mz/ (accessed on 15 January 2024).
- Instituto Nacional de Estatística (INE). Population in 2023. 2024. Available online: https://www.ine.gov.mz/en/ (accessed on 10 January 2024).
- Cambaza, E.; Mongo, E.; Anapakala, E.; Nhambire, R.; Singo, J.; Machava, E. Outbreak of Cholera Due to Cyclone Kenneth in Northern Mozambique, 2019. Int. J. Environ. Res. Public Health 2019, 16, 2925. [Google Scholar] [CrossRef] [PubMed]
- Miguel, M. Uamusse, Kamshat Tussupova, Kenneth M Persson. Climate Change Effects on Hydropower in Mozambique. Appl. Sci. 2020, 10, 4842. [Google Scholar] [CrossRef]
- Baptista, J.A. Disturbing ‘Development’: The Water Supply Conflict in Canhane, Mozambique. J. South. Afr. Stud. 2010, 36, 169–188. [Google Scholar] [CrossRef]
- OCHA. Mozambique: How does Armed Conflict in Cabo Delgado Affect Access to Basic Services like Water, Sanitation and Health? 2023. Available online: https://reliefweb.int/report/mozambique/mozambique-how-does-armed-conflict-cabo-delgado-affect-access-basic-services-water-sanitation-and-health (accessed on 31 January 2024).
- SWP (Sustenable Water Partneship). Water Resources Profile Series. 2024. Available online: https://winrock.org/wp-content/uploads/2021/08/Mozambique_Country_Profile-Final.pdf (accessed on 31 January 2024).
- Instituto Nacional de Gestão e Redução do Risco de Desastres (INGD). Relatório de Emergência da época Chuvosa e Ciclónica 2019–2020, 2020. Available online: https://www.ingd.gov.mz/ (accessed on 15 January 2024).
- ZAMCOM (Zambezi Watercourse Commission). Annual Reports. 2024. Available online: https://zambezicommission.org/ (accessed on 31 January 2024).
- Da Maia, R.; Nhambiu, B.; Cuna, J.; Amid, U.; Vilanculos, A.; Machele, J. Mozambique Country-Specific Risk and Vulnerability Profile Report. 2019. Available online: https://www.riskreductionafrica.org/assets/files/Mozambique%20Risk%20Profile%20Report_compressed_1pdf.io.pdf (accessed on 10 January 2024).
- Regional Water Administrations (ARA-Centro). Estrada Nacional Nº7, Cidade de Tete, Mozambique, 2024. Available online: https://aracentroip.gov.mz/ (accessed on 15 January 2024).
- CCKP. Climate Data. Available online: https://climateknowledgeportal.worldbank.org/download-data (accessed on 10 January 2024).
- PRISMA. 2020. Available online: http://www.prisma-statement.org/ (accessed on 12 November 2023).
- United States Geological Survey (USGS). Available online: https://earthexplorer.usgs.gov/ (accessed on 11 November 2023).
- APHA. Standard Methods for the Examination of Water and Wastewater, 23rd ed.; American Public Health Association: Washington, DC, USA, 2017. [Google Scholar]
- Instituto Nacional de Gestão e Redução do Risco de Desastres (INGD). Database on Cyclone Cccurrence (2019–2023) in Mozambique, 2024. Available online: https://www.ingd.gov.mz/ (accessed on 15 January 2024).
- Instituto Nacional de Saúde (INS). Database on Water-Borne and Vector-Borne Diseases in the Centre Region (2017–2023). Mozambique, 2024. Available online: https://ins.gov.mz/ (accessed on 15 January 2024).
- World Health Organization (WHO). Guidelines for Drinking-Water Quality, 4th ed.; Incorporating The 1st Addendum; WHO: Geneva, Switzerland, 2017; ISBN 978-92-4-154995-0.
- Hui, L. Wind Forecasting in Railway Engineering; Elsevier: Changsha, China, 2021; ISBN 13-9780-128-237-069. [Google Scholar]
- Teng, T.-P.; Chen, W.-J. Using Pearson correlation coefficient as a performance indicator in the compensation algorithm of asynchronous temperature-humidity sensor pair. Case Stud. Therm. Eng. 2024, 53, 103924. [Google Scholar] [CrossRef]
- Chilaule, S.M.; Mabica, A.P. Alterações Climáticas e o Nexo Agua Energia Alimentos: Avaliação do impacto de desastres naturais na prática agrícola e segurança alimentar em Moçambique. Revista Munyo. Sci. J. Math. Nat. Appl. Sci. 2023, 2, 84–90. [Google Scholar]
- Petricola, S.; Reinmuth, M.; Lautenbach, S.; Hatfield, C.; Zipf, A. Assessing road criticality and loss of healthcare accessibility during floods: The case of Cyclone Idai, Mozambique 2019. Int. J. Health Geogr. 2022, 21, 14. [Google Scholar] [CrossRef] [PubMed]
- National Hurricane Center and Central Pacific Hurricane Center (NHC). Saffir-Simpson Hurricane Wind Scale. 2024. Available online: https://www.nhc.noaa.gov/aboutsshws.php (accessed on 11 January 2024).
- Instituto Nacional de Gestão e Redução do Risco de Desastres (INGD). Relatório de Emergência da época Chuvosa e Ciclonica 2019–2020, 2021. Available online: https://www.ingd.gov.mz/ (accessed on 15 January 2024).
- Institute for International Law of Peace and Armed Conflict (IFHV). World Risk Report. 2023. Available online: https://www.ifhv.de/publications/world-risk-report (accessed on 31 January 2024).
- Rafa, N.; Jubayer, A.; Uddin, S.M.N. Impact of cyclone amphan on the water, sanitation, hygiene, and health (wash2) facilities of coastal bangladesh. J. Water Sanit. Hyg. Dev. 2021, 11, 304–313. [Google Scholar] [CrossRef]
- Parker, C.L.; Lynch, A.H.; Spera, S.A.; Spangler, K.R. The Relationship between Tropical Cyclone Activity, Nutrient Loading, and Algal Blooms over the Great Barrier Reef. Biogeosci. Discuss. 2017, 2017, 1–35. [Google Scholar] [CrossRef]
- Mosley, L.M.; Sharp, D.S.; Singh, S. Effects of a tropical cyclone on the drinking-water quality of a remote pacific island. Disasters 2004, 28, 405–417. [Google Scholar] [CrossRef] [PubMed]
- Direção Nacional de Águas (DNA). Annual Report. 2012. Maputo, Mozambique. Available online: https://dnaas.gov.mz/ (accessed on 15 January 2024).
- Instituto Nacional de Estatística (INE). Census 2017. Available online: https://www.ine.gov.mz/en/web/guest/censo-2017 (accessed on 31 January 2024).
- Meschede, M.S.C. Implicações Para a Saúde de Escolares a Partir Consumo de Água e Material Particulado Atmosférico Inalado em Escolas de Santarém e Mojuí dos Campos. Ph.D. Thesis, Universidade Federal do Oeste do Pará, Pará, Amazônia, 2018. [Google Scholar]
- Zanchetta, G.S.B. Avaliação Do Grau de Poluíção Do Dolo, águas, Plantas e Resíduos Sólidos Do Lixão Linha Rincão Do Engenho de Lagoa Vermelha, RS, 2007. Available online: http://tede.upf.br/jspui/handle/tede/218 (accessed on 15 January 2024).
- Chilundo, M.; Kelderman, P.; O′Keeffe, J.H. Design of a water quality monitoring network for the Limpopo River Basin in Mozambique. Phys. Chem. Earth Parts A/B/C 2008, 33, 655–665. [Google Scholar] [CrossRef]
- Chen, J.; Li, W.; Qiao, P.; Li, Y.; Zheng, K.; Wang, Y.; Dong, X.; Wang, S.; Tan, L.; Chu, F.; et al. Characterizing ammonia emissions from water bodies using dynamic floating chambers. Sci. Total Environ. 2021, 796, 148978. [Google Scholar] [CrossRef] [PubMed]
- Camargo, J.A.; Alonso, A. Ecological and toxicological effects of inorganic nitrogen pollution in aquatic ecosystems: A global assessment. Environ. Int. 2006, 32, 831–849. [Google Scholar] [CrossRef] [PubMed]
- Jurgilevich, A.; Käyhkö, J.; Räsänen, A.; Pörsti, S.; Lagström, H.; Käyhkö, J.; Juhola, S. Factors influencing vulnerability to climate change-related health impacts in cities—A conceptual framework. Environ. Intern. 2023, 173, 107837. [Google Scholar] [CrossRef] [PubMed]
- Seidel, L.; Broman, E.; Turner, S.; Ståhle, M.; Dopson, M. Interplay between eutrophication and climate warming on bacterial communities in coastal sediments differs depending on water depth and oxygen history. Sci. Rep. 2021, 11, 23384. [Google Scholar] [CrossRef]
- Levy, K.; Woster, A.P.; Goldstein, R.S.; Carlton, E.J. Untangling the Impacts of Climate Change on Waterborne Diseases: A Systematic Review of Relationships between Diarrheal Diseases and Temperature, Rainfall, Flooding, and Drought. Environ. Sci. Technol. 2016, 50, 4905–4922. [Google Scholar] [CrossRef]
- Zhang, P.; Chen, L.; Yan, T.; Liu, J.; Shen, Z. Sources of nitrate-nitrogen in urban runoff over and during rainfall events with different grades. Sci. Total Environ. 2022, 808, 152069. [Google Scholar] [CrossRef] [PubMed]
- Yu, J.; Yang, L.; Ho, H.C.; Huang, C. Climate Change Impacts on Diarrheal Disease, From Epidemiological Association Research to Social Vulnerability Exploration; Oxford Research Encyclopedias; Global Public Health: London, UK, 2021. [Google Scholar] [CrossRef]
- Sistema de Informação Nacional de Água e Saneamento (SINAS)/Direcção Nacional de Abastecimento de Água e Saneamento. Available online: https://www.sinasmz.com/lizmap/lizmap/www/index.php/view/ (accessed on 18 November 2023).
- Manini, E.; Baldrighi, E.; Ricci, F.; Grilli, F.; Giovannelli, D.; Intoccia, M.; Casabianca, S.; Capellacci, S.; Marinchel, N.; Penna, P.; et al. Assessment of Spatio-Temporal Variability of Faecal Pollution along Coastal Waters during and after Rainfall Events. Water 2022, 14, 502. [Google Scholar] [CrossRef]

| Input Data | Source | Format | Spatial Resolution |
|---|---|---|---|
| Satellite image | GeoEye-1; Worldview-2; Landsat 7 ETM+ and Landsat 8 OLI | Raster | 46 cm |
| 30 m | |||
| Area of interest (Population and administrative) | https://www.worldpop.org; https://gadm.org/ (Last access: 15 January 2024) | Vector | - |
| Watershed | Watershed Population (Inhabitants) | Number of Injuries | Direct Death | Source of Drinking Water | Diarrhoea Cases | Diarrhoea Deaths | Malaria Cases | Malaria Deaths | Cholera Cases | Cholera Deaths | Attack Rate, per 100,000 for 3 Diseases | Case Fatality Rate for 3 Diseases (%) |
|---|---|---|---|---|---|---|---|---|---|---|---|---|
| Búzi | 1,455,779.10 | 701 | 213 | Surface water (rivers), and groundwater | 17,253 | 27 | 101,981 | 38 | 14,750 | 16 | 1185.1; 7005.3 and 1013.2 | 0.16; 0.04 and 0.11 |
| Zambezi | 5,765,244.15 | 633 | 235 | Surface water (rivers and lakes), tap water and groundwater | 21,500 | 22 | 250,705 | 52 | 16,574 | 17 | 372.9; 4348.6 and 287.5 | 0.1; 0.02 and 0.10 |
| Púngue | 2,042,730.00 | 307 | 55 | Surface water (rivers), and groundwater | 14,856 | 15 | 98,745 | 25 | 11,307 | 9 | 727.3; 4,834.0 and 553.5 | 0.10; 0.03 and 0.08 |
| River Code | Temperature (°C) | pH | EC (μS/cm) | DO (mg/L) | TDS (mg/L) | Turbidity (NTU) | Total Coliforms (NMP/100 mL) |
|---|---|---|---|---|---|---|---|
| B1 | 17.4 | 14.0 | 52.0 | 0.9 | 26 | 350.2 | 150 |
| B2 | 21.4 | 5.5 | 48.0 | 0.5 | 24 | 46.6 | 1500 |
| B3 | 20.2 | 9.2 | 42.0 | 0.1 | 21 | 350.4 | 1500 |
| B4 | 25.7 | 5.5 | 108.0 | 0.2 | 54 | 350.1 | 2100 |
| B5 | 18.5 | 7.1 | 117.0 | 0.5 | 59 | 380.8 | 1600 |
| B6 | 21.4 | 7.1 | 48.0 | 0.5 | 24 | 98.3 | 90 |
| B7 | 18.5 | 7.1 | 117.0 | 0.5 | 59 | 105.7 | 1050 |
| B8 | 29.9 | 5.5 | 84.0 | 0.5 | 42 | 41.5 | 250 |
| P1 | 30.7 | 8.07 | 231.8 | 9.8 | 105.2 | 15.1 | - |
| P2 | 28.6 | 8.64 | 639.8 | 12.1 | 102.3 | 102.2 | - |
| P3 | 26.4 | 8.44 | 490.1 | 12.1 | 100.2 | 4 | - |
| P4 | 28.1 | 8.41 | 148.5 | 12.1 | 41.2 | 11.3 | - |
| P5 | 27.1 | 8.25 | 132.1 | 9.8 | 42.1 | 6.8 | - |
| P6 | 30.7 | 8.1 | 231.8 | 9.8 | 105.2 | 15.1 | - |
| P7 | 30.1 | 8.17 | 464.9 | 9.8 | 189.2 | 5 | - |
| P8 | 26.6 | 8.23 | 492.3 | 9.8 | 201.2 | 11.3 | - |
| P9 | 26.8 | 8.16 | 123.3 | 9.8 | 78.1 | 980 | - |
| P10 | 24.2 | 7.42 | 131.4 | 7.1 | 42.1 | 13.1 | - |
| P11 | 22.5 | 7.45 | 136.02 | 9.8 | 43.1 | 13.2 | - |
| P12 | 26.5 | 8.19 | 131.1 | 9.8 | 62.1 | >1000 | - |
| Z1 | 29.5 | 7.06 | 137 | 9.5 | 89 | 1874 | - |
| Z2 | 27.9 | 6.44 | 220.5 | 7.1 | 89 | 0.03 | - |
| Z3 | 28.2 | 6.6 | 135 | 6.9 | 84 | 106.1 | - |
| Z4 | 29.6 | 6.87 | 94 | 6.7 | 61 | 394 | - |
| Z5 | 29.2 | 6.48 | 145 | 6.35 | 93 | 1965 | - |
| Z6 | 27.9 | 7.09 | 116 | 7.4 | 75 | 84.5 | - |
| Z7 | 28.3 | 6.91 | 197 | 6.9 | 97 | 1201 | - |
| Z8 | 28.2 | 6.38 | 305.9 | 6.95 | 110 | 300 | - |
| Z9 | 28.4 | 6.89 | 123 | 6.8 | 77 | 71.5 | - |
| Z10 | 27.8 | 6.75 | 145 | 7.44 | 94 | 87.5 | - |
| Z11 | 27.9 | 6.42 | 132 | 7.46 | 162 | 76.3 | - |
| Z12 | 30.5 | 5.74 | 250 | 5.6 | 150 | 82 | - |
| Z13 | 29.9 | 7.88 | 224 | 6.8 | 144 | 98 | - |
| Z14 | 25.3 | 5.81 | 145 | 9.36 | 97 | 105 | - |
| Z15 | 24.6 | 6.08 | 140 | 10.39 | 96 | 42 | - |
| Z16 | 26.3 | 5.74 | 150 | 8.47 | 97 | 24.3 | - |
| Z17 | 28.7 | 6.56 | 147 | 6.46 | 86 | 64.1 | - |
| Z18 | 27.6 | 8.29 | 447 | 7.66 | 287 | 500 | - |
| 2019/ Month | Diarhoea Cases (<5 Years) | Diarhoea Cases (>5 Years) | ||||
| Zambezi | Búzi | Púngue | Zambezi | Búzi | Púngue | |
| January | 8585 | 8511 | 4338 | 2996 | 1796 | 3608 |
| February | 9171 | 7073 | 2859 | 3649 | 1623 | 3108 |
| March | 12801 | 6210 | 3256 | 4836 | 1137 | 1793 |
| April | 5109 | 3260 | 1944 | 3481 | 1121 | 1519 |
| May | 2577 | 2124 | 1284 | 3250 | 1241 | 3112 |
| June | 2300 | 1764 | 881 | 2746 | 1393 | 2152 |
| Jully | 1127 | 1561 | 795 | 2870 | 1184 | 1207 |
| August | 860 | 1553 | 702 | 2380 | 959 | 1147 |
| September | 705 | 1398 | 927 | 1889 | 1131 | 991 |
| October | 990 | 1615 | 891 | 2098 | 1109 | 1192 |
| November | 1282 | 1558 | 969 | 1946 | 1059 | 1161 |
| December | 2389 | 1638 | 928 | 1898 | 1309 | 1585 |
| 2022/ Month | Diarhoea Cases (<5 Years) | Diarhoea Cases (>5 Years) | ||||
| Zambezi | Búzi | Púngue | Zambezi | Búzi | Púngue | |
| January | 4721 | 5491 | 2799 | 1933 | 1159 | 2328 |
| February | 4144 | 4872 | 1969 | 2513 | 1118 | 2141 |
| March | 4040 | 4720 | 2475 | 3676 | 864 | 1363 |
| April | 2005 | 2341 | 1396 | 2500 | 805 | 1091 |
| May | 1275 | 1421 | 859 | 2174 | 830 | 2082 |
| June | 1045 | 1213 | 606 | 1888 | 958 | 1480 |
| Jully | 919 | 1090 | 555 | 2004 | 827 | 843 |
| August | 905 | 1148 | 519 | 1759 | 709 | 848 |
| September | 930 | 1058 | 701 | 1429 | 856 | 750 |
| October | 1057 | 1218 | 672 | 1582 | 836 | 899 |
| November | 994 | 1196 | 744 | 1933 | 813 | 891 |
| December | 1059 | 1248 | 707 | 2513 | 997 | 1208 |
Disclaimer/Publisher’s Note: The statements, opinions and data contained in all publications are solely those of the individual author(s) and contributor(s) and not of MDPI and/or the editor(s). MDPI and/or the editor(s) disclaim responsibility for any injury to people or property resulting from any ideas, methods, instructions or products referred to in the content. |
© 2024 by the authors. Licensee MDPI, Basel, Switzerland. This article is an open access article distributed under the terms and conditions of the Creative Commons Attribution (CC BY) license (https://creativecommons.org/licenses/by/4.0/).
Share and Cite
Chilaule, S.M.; Macuacua, X.V.; Mabica, A.P.; Miranda, N.A.; Pereira, H.d.S.; Gudo, E.S.; Marrufo, T.; García-López, S.; Lopes, M. Natural Disasters’ Impact on Water Quality and Public Health: A Case Study of the Cyclonic Season (2019–2023). Pollutants 2024, 4, 212-230. https://doi.org/10.3390/pollutants4020014
Chilaule SM, Macuacua XV, Mabica AP, Miranda NA, Pereira HdS, Gudo ES, Marrufo T, García-López S, Lopes M. Natural Disasters’ Impact on Water Quality and Public Health: A Case Study of the Cyclonic Season (2019–2023). Pollutants. 2024; 4(2):212-230. https://doi.org/10.3390/pollutants4020014
Chicago/Turabian StyleChilaule, Sérgio Mateus, Xadreque Vitorino Macuacua, Alfredo Pedro Mabica, Nelson Alexandre Miranda, Henrique dos Santos Pereira, Eduardo Samo Gudo, Tatiana Marrufo, Santiago García-López, and Myriam Lopes. 2024. "Natural Disasters’ Impact on Water Quality and Public Health: A Case Study of the Cyclonic Season (2019–2023)" Pollutants 4, no. 2: 212-230. https://doi.org/10.3390/pollutants4020014
APA StyleChilaule, S. M., Macuacua, X. V., Mabica, A. P., Miranda, N. A., Pereira, H. d. S., Gudo, E. S., Marrufo, T., García-López, S., & Lopes, M. (2024). Natural Disasters’ Impact on Water Quality and Public Health: A Case Study of the Cyclonic Season (2019–2023). Pollutants, 4(2), 212-230. https://doi.org/10.3390/pollutants4020014