Article

Mercury in Temperate Forest Soils and Suspended Sediments in the Connecticut River, Merrimack River, and Thames River Watersheds, USA

by
Justin B. Richardson
1,2,*,
Ivan C. Mischenko
1 and
Mark J. Butler
1
1
Department of Geoscience, University of Massachusetts Amherst, Amherst, MA 01002, USA
2
School of Earth and Sustainability, University of Massachusetts Amherst, Amherst, MA 01002, USA
*
Author to whom correspondence should be addressed.
Pollutants 2022, 2(2), 252-268; https://doi.org/10.3390/pollutants2020017
Submission received: 28 December 2021 / Revised: 1 February 2022 / Accepted: 7 February 2022 / Published: 8 June 2022

Abstract

:
Quantifying the sequestration in forest soils and watershed transport of Hg is key to reducing exposure of aquatic food chains to the toxic pollutant. We explored if forest soils, proximity in human developments, or watershed characteristics could shed light on sediment driven Hg transport in the Connecticut River, Merrimack River, and Thames River watersheds, in the northeastern USA. We sampled 48 upland forest soils and 32 riparian forest soils and collected bottled and trapped suspended sediments from April 2020 to November 2020 across the three watersheds. Forest soil Hg concentrations were greater in riparian forest soils (median = 153 ng g−1) than in upland forest soils (median = 71 ng g−1) across all three watersheds and developed sites near urbanization had higher Hg concentrations in the Merrimack River watershed (median = 407 ± 119 ng g−1). The Connecticut River had the highest suspended sediment Hg export rate but when normalized by total area of the watershed, the Merrimack River had 0.19 kg km−2 month−1 while the Connecticut River had 0.13 kg km−2 month−1 and 0.04 km−2 for the Thames River. Our findings suggest that riparian forest soils sequester while suspended sediments transport historical Hg pollution within the Merrimack River Watershed.

1. Introduction

Mercury (Hg) is a global pollutant of concern due to its wide-scale emissions from artisanal gold and silver mining, Hg mining, industrial manufacturing processes, and combustion of coal [1]. Unlike most metals, the global biogeochemical cycle of Hg has an important atmospheric component, due to the gaseous nature of Hg0 and other volatile Hg species [2]. These gaseous and particulate forms of Hg can travel and be deposited globally. Although ingestion of Hg from drinking water or inhalation are potential issues in areas with highly elevated Hg concentrations, the paramount concern is the ingestion of Hg from fish [3]. Methylated forms of Hg can bioaccumulate in fish and subsequently transfer to piscivorous animals and humans. Terrestrial systems play an integral role in the Hg global biogeochemical cycle, by sequestering Hg and preventing transport to aquatic ecosystems.
Mobility and transport of Hg from soils in terrestrial systems has several implications for Hg bioaccumulation in freshwater and marine ecosystems. Upland soils and riparian soils sequester modern point source industrial pollution, modern non-point source domestic, and historical pollution from mills, tanneries, and forges [1,4,5,6]. Mercury can be mobilized from soils as dissolved phases or under erosional events can suspend on dissolved organic carbon (DOC) or colloids [7,8]. Once Hg is mobilized to aquatic ecosystems, Hg can become methylated by sulfur-reducing bacteria and be taken up by freshwater and marine organisms [9,10,11,12]. Mercury can be transported as dissolved species (including complexed to fine colloids) or attached to suspended particles [13]. Suspended sediment transport is particularly important for Hg export to rivers, lakes, and coastal areas [13], where they can negatively impact recreational and commercial fishing [14,15]. Discerning the mechanisms for Hg transport within watersheds is an additional step toward reducing Hg transport to freshwater and marine ecosystems. The bays and estuaries of Long Island Sound and Massachusetts have economically and culturally important fisheries that provide regional economies millions of dollars in revenue from bivalves, decapods, and fish [16].
Upland soils serve essential roles in retention and transport of Hg from due to their soil organic matter (SOM), Fe oxides, and sorption to fine clay-sized particles. The mountainous terrain is mantled with thin glacial till-derived soils [17,18] and fewer wetlands, which generates relatively shorter transport paths from soils to surface waters. Riparian soils can also serve and important role for retention of Hg under typical oxic conditions with adsorption to SOM or reduction and precipitation of HgS complexes. The young soils of the forested floodplains and stream banks of New England are formed by both natural deposition during large storm events [19] and also by human alterations to streams from dams [20]. In addition, riparian soils can store Hg deposited during high flow events in which sediments are deposited beyond the stream channel, on the floodplain. Riparian soils can also have higher Hg storage due to finer materials within fluvial and glaciofluvial deposits and in organic rich soils of wetlands [21,22]. The storage of Hg in riparian soils is important as mobilized Hg on sediments can contribute significantly to marine Hg budgets. For example, Balcom et al., [14] determined that the Connecticut River was 59% of the total Hg inputs to Long Island Sound.
The overarching objective of this study was to evaluate the sequestration of Hg in upland and riparian soils and compare the sequestration with the transport of dissolved and particulate-bound Hg. Here, we study three watersheds of New England, USA to examine the exports and relate their transport to Hg abundance in upland and riparian soils, and current and historic land-use. The first hypothesis was that upland and riparian soils away from human developments and Hg sources would have less accumulation of Hg. In the second hypothesis, it was expected that upper reaches of watersheds would have less Hg transport due to lower dissolved and suspended Hg. This information can be used to help evaluate the role of soil processes, geologic processes, land-use, and human pollution on the linkage between soil and watershed exports of trace elements.

2. Materials and Methods
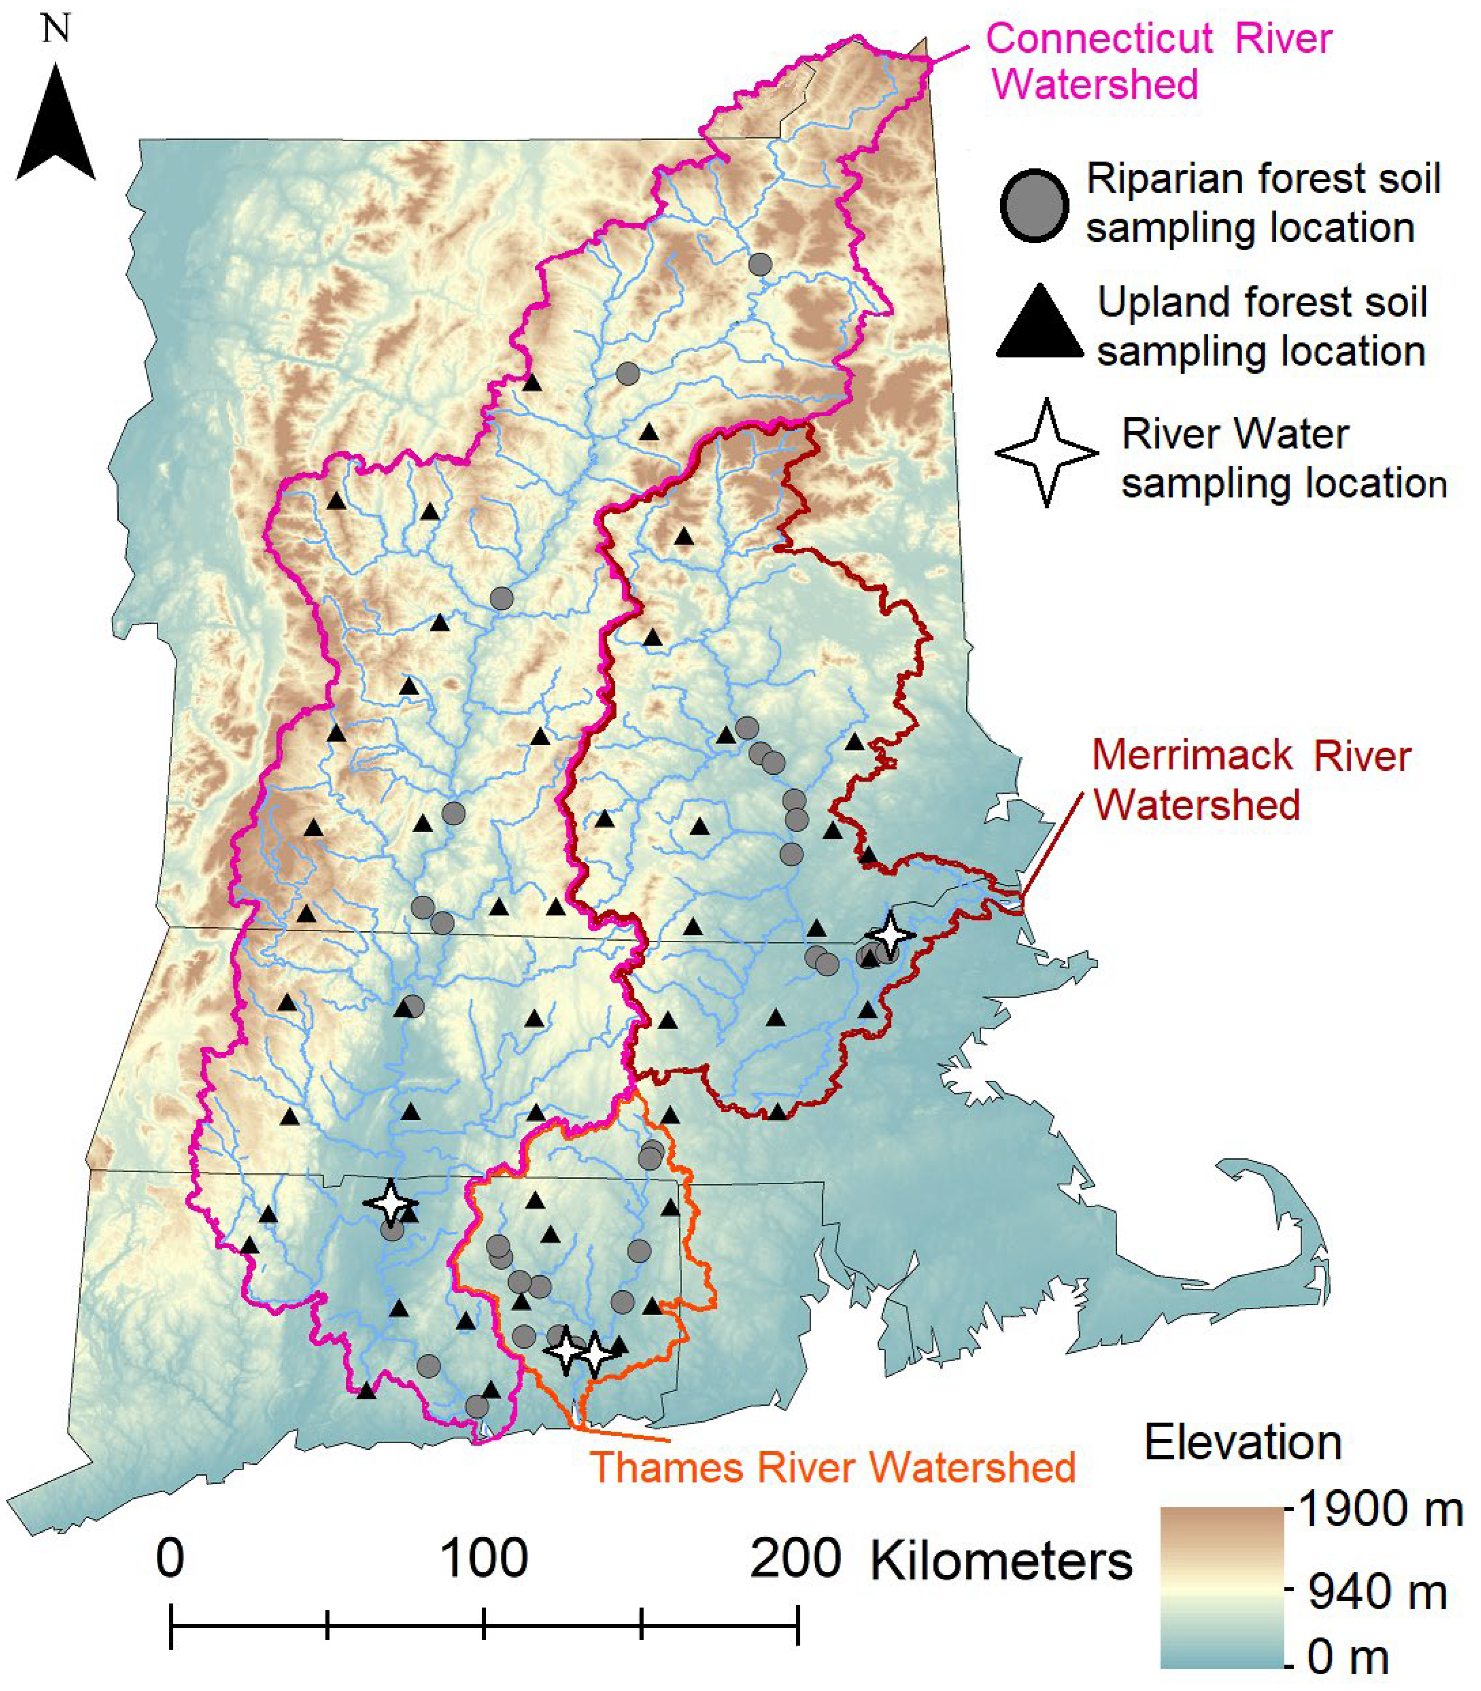
2.1. Watersheds

This study focused on three large watersheds of central and southern New England: the Connecticut River Watershed, the Merrimack River Watershed, and the Thames River Watershed, which are shown in Figure 1. Using the Köppen climate classification, the climate of New England is primarily a humid continental, with mild summers and precipitation throughout the year (Dfb) in the central area, and hot summers and precipitation throughout the year in the in the southern, coastal areas.
The Connecticut River Watershed is the largest watershed in New England and drains 29,200 km2, ranging steep mountain landforms in northern Vermont and New Hampshire, the Berkshire mountains to the west, and the White Mountains to the east which transitions to rolling hills in the states of Massachusetts and Connecticut. Mean annual precipitation exceeds > 2000 mm yr−1 in the mountains of Vermont and New Hampshire, and decreases to 1000 to 1200 mm yr−1 in the Connecticut River valley of western Massachusetts and central Connecticut. There is a mean annual temperature in the mountains of 5.2 °C, which increases to 10.8 °C towards the coast in the river valley. Cities within the Connecticut River watershed include Springfield MA and Hartford CT, with >500,000 individuals in their metropolitan areas. There are over 65 major dams on the mainstem and tributaries of the Connecticut River. Ecosystems transition from coniferous and deciduous forests (see Table 1) in the montane uplands to agricultural lands in the valley floors [23].
The Merrimack River Watershed drains 12,975 km2 of central New England, ranging steep mountains in New Hampshire which transitions to rolling hill piedmont in Massachusetts and New Hampshire border. Mean annual precipitation exceeds > 2000 mm yr−1 in the mountains of New Hampshire and decreases to 1000 to 1200 mm yr−1 in the peneplain of eastern Massachusetts. Mean annual temperature in the mountains of 5.2 °C which increases to 9.7 °C in the peneplain towards the New Hampshire–Massachusetts border. Cities within the Merrimack River watershed include Manchester NH, Nashua, NH, and Lowell MA with populations > 100,000 individuals. There are 37 dams on the mainstem, tributaries, and lakes of the Merrimack River. Ecosystems are predominantly northern hardwoods with coniferous forests in the mountains regions and limited agricultural lands in the southern areas (Table 1).
The Thames River watershed has a total area of 3817 km2, which is much smaller than the other two watersheds, and predominantly drains eastern Connecticut, from southern Massachusetts to the coast. Mean annual precipitation ranges between 1000 to 1200 mm yr−1 and the mean annual temperature is 10.7 °C. Since the Thames River is tidally influenced, we focused on the three main branches of the Thames River: Yantic, Shetucket, and Quinebaug Rivers. The Yantic River drains a largely undeveloped area of rolling hills with some agricultural pasture and croplands. The Shetucket and Quinebaug also drains forested rolling hills (see Table 1) and valleys with smaller cities including Willimantic CT and Norwich CT with <50,000 individuals. The Shetucket River has four hydroelectric dams, while the Quinebaug has nine hydroelectric dams.

2.2. General Geology and Soils

The bedrock lithology of central-southern New England is complex but can be succinctly described as highly deformed Precambrian to Paleozoic metamorphic rocks including gneiss, schist, and marble with crystalline Paleozoic granite. Surface deposits are controlled by the recent glacial history of the Pleistocene with many glacial lakes and outwash deposits in topographic lows. Upland areas are characterized by subglacial and supraglacial till, ranging from several meters thick to outcrop exposures on steep slopes and in mountainous terrains.
Upland soils in the summit and shoulder positions are typically shallow (<3 m) glacial till. Soils in mountains and sloped areas are young and rocky Inceptisols and Spodosols. Inceptisols are dominant in areas that have been previously converted to agricultural lands while developed Spodosols can be found in back slope and shoulder positions of the Connecticut and Merrimack watersheds. Spodosols are uncommon in the Thames River Watershed due to the extensive agricultural conversion to pasture lands or deforestation in the 1800s and 1900s. Downslope, riparian areas of the Connecticut River, particularly within the Glacial Lake Hitchcock deposits, are very well drained but concave swales from upland to lowland positions can be poorly drained soils due to dense, fragipans from subglacial till [17]. Inceptisols dominate the floodplains and stream banks of New England rivers due to natural deposition of sand and silts from large storm events [19] and also changes in sediment erosion and deposition from human dams in the rivers and streams [20].

2.3. Site Characterization, Soil Sampling, and Soil Processing

Upland forest sites were chosen in the Connecticut River Watershed (n = 26), Merrimack River Watershed (n = 15), and Thames River Watershed (n = 7). Upland sites needed to be >10 m from any road or agricultural areas and could not show any sign of prolonged water saturation, such as wetland vegetation, redoximorphic features, or gleying. Vegetation at upland forest sites were forested, with predominantly northern hardwoods sugar maple (Acer saccharum), red maple (Acer rubrum), American beech (Fagus grandifolia), birch (Betula spp.), hickory (carya spp.), white ash (Fraxinus americana), tulip poplar (Liriodendron tulipifera), red oak (Quercus rubra) with minor eastern hemlock (Tsuga Canadensis), white pine (Pinus strobus), and red spruce (Picea rubens).
Riparian forest sites were chosen along the mainstem of the Connecticut River Watershed (n = 10) and Merrimack River Watershed (n = 11) and along the Yantic (n = 3), Shetucket, and Quinebaug (n = 8) tributaries of the Thames River Watershed (n = 11). Riparian forest sites needed to be >10 m from any road or agricultural areas, were typically located on the stream bank, and frequently had redoximorphic features or gleying. Vegetation at riparian forest sites were red maple (Acer rubrum), silver maple (Acer saccharinum), eastern Cottonwood (Populus angustifolia), white pine (Pinus strobus), swamp white oak (Quercus bicolor), European white elm (Ulmus laevis), and pin cherry (Prunus pensylvanica).
To compare the effect of urbanization, upland forest and riparian forest sites were categorized as located in either a rural or developed area based up on their proximity to low to high development based upon the 2016 National Land Cover Database [24]. To accomplish this, a 2 km radius of the 2016 NLCD land-use data around each site were collected. The amount of urban area classified as developed low-intensity, developed medium-intensity, and developed high-intensity was calculated. Forest sites with >5% of their 2 km radius area was classified as an urban area, the site was classified as developed [25].
At each forest site, soils were sampled by hand auguring with a one-piece auger and depths were checked with a graduate pole. The forest floor layer was removed and only mineral soil samples were collected. Master soil horizons were typically: A and E horizons from 0 to ~25 cm, B horizons ~25 to ~35 cm, C horizons ~35 to 50+ cm. Since riparian forest soils were developed from outwash and well-sorted fluvial deposits, depth intervals were 20 cm and riparian forest soils were sampled down to 100 cm depth. Upland forest soils were developed from rocky glacial till and could only be consistently sampled by 10 cm depth intervals down to 50 cm before large rocks prevented sampling any further. All soil samples were air-dried in greenhouses at ~40 °C. Soil samples were then weighed and sieved to ≤2 mm and then re-weighed.

2.4. River Water and Suspended Sediment Sampling

River water sampling for the Connecticut, Merrimack, and Thames watersheds was designed to capture seasonal variability but was not intensive enough to capture individual storm events. For ‘bottle’ river water collection in the field, 1 L acid-washed high-density polyethylene bottles were rinsed then re-filled using a pole sampler at a depth of approximately 50 cm at least 2 m away from the riverbank. Bottles were acid-washed with 10% trace metal-grade HNO3 and rinsed with river water sample prior collection. Water sampling followed USGS sampling protocols [26]. Water samples were transported in an insulated container to the University of Massachusetts. Suspended sediments from the water were removed from samples via vacuum filtration using <0.45 µm cellulose membrane filters (e.g., [27]), frozen at −40 °C, freeze-dried to remove moisture, and stored in a dark box at 4 °C. ‘Bottle suspended sediment’ was used to estimate the mass of suspended sediment per liter of river water.
Suspended sediment traps were deployed at the river water sampling locations to gather an integrated signal of the physical and chemical properties of suspended sediments in the Connecticut, Merrimack, and Thames Rivers. Suspended sediment traps were created following designs and descriptions from Kayvantash et al. [28] and Patault et al. [29]. The sediment traps consist of two 1-L polyethylene bottles, perforated at 5 cm from the top with two opposite holes (diameter 5 cm). A fin below one of the holes was added to the original design to ensure the trap inlet continually faced upstream. The samples are qualitative suspended solids transported within the river water, and were deposited within the trap due to a decrease in velocity and turbulent forces. Further details about the development of this trap can be found in Kayvantash et al. [28]. Each suspended sediment trap was suspended in the riverbank from a rope suspended on a tree branch or 3 m wood beam with a 2.3 kg steel ballast attached to the bottom. Suspended sediment traps were deployed approximately 2.5 m from the stream bank in the main river channel and at approximately 1 m deep. Suspended sediments were collected between 2 to 4 weeks, with more collections during the spring thaw event. The suspended sediments were frozen at −40 °C, freeze dried to remove moisture, and stored in dark box at 4 °C. Suspended sediments were analyzed for chemical properties, particularly Hg concentration and %OM through loss-on ignition (LOI), both described in the following section.

2.5. Soil, Suspended Sediment, and Water Elemental Analyses

Loss-on-ignition (LOI) was used to measure %organic matter (%OM) in soils and suspended sediments from the sediment traps. In brief, %OM was measured by combusting a 1.000 ± 0.010 g oven-dried subsample at 550 °C for 8 hrs in quartz glass crucibles. Every 20 samples included one blank and duplicate and LOI relative CV was <2% between duplicates.
Total Hg concentrations for soil and suspended sediment samples were quantified using a Direct Mercury Analyzer-80 (Milestone Inc.). For the Hg measurement, 100 ± 10 mg of finely ground and homogenized subsamples were weighed into steel boats and ashed at 650 °C, trapping Hg on gold amalgam. For QA/QC, every 15 samples included a duplicate, a preparation blank and two standard reference materials (SRM): NIST San Joaquin Soil 2709a and NIST New York/New Jersey sediment 1944 (National Institute of Standards and Technology, Gaithersburg, MD). Preparation blanks of 100 mg of silicate powder were below detection limits (<0.05 ng/g), and duplicate variations were within 5%. SRM Hg measurements were within 10% of their certified values, with recovery rates for SRM NIST 2709a were 91–103%.
Dissolved Hg was attempted using two methods. First, a 50 mL filtered river water sample was acidified to pH 2 with trace metal grade nitric acid. The sample was analyzed with an Agilent 7700x Inductively Coupled Plasma Mass Spectrometer under helium mode (Agilent Technology, Santa Clara, CA, USA). The limit of quantification was 0.05 µg L−1 but all river water samples were below this concentration. To increase Hg concentrations, we utilized an exchange resin AG1-X4) to scavenge and adsorb Hg from 250 mL of river water, derived from laboratory methods by Chen et al. [30]. In brief, AG1-X4 resin was conditioned with 20 mL of 4 M trace metal grade HNO3 and then conditioned with 10 mL 0.1 M HCl and 1 g was added to 250 mL of acidified river water. The resin was then filtered from the water sample after 24 h of chelation and analyzed Direct Mercury Analyzer. Unfortunately, the resulting resin Hg concentrations were below the limit of quantification (<0.1 ng in 250 mL of river water). These low dissolved Hg concentrations agree with previous studies that found dissolved Hg concentrations in the Connecticut and other New England rivers to be <0.005 µg L−1.
Soils and suspended sediments digested for major elements (Al, Ca, K, Fe, Si). In brief, a 100 ± 10 mg of finely ground and homogenized subsamples were weighed into 50 mL centrifuge tubes and digested with 5 mL of 9:1 reverse aqua regia (HNO3:HCl) at 70 °C for 45 min for a modified closed vessel hot plate digestion EPA method 3050B. The digest was diluted to 50 mL and further diluted to 10 mL at a ratio of 1 mL digest to 2 mL of deionized water. For QA/QC, every 15 samples included a duplicate, a preparation blank and two standard reference materials (SRM)s: NIST San Joaquin Soil 2709a and NIST New York/New Jersey sediment 1944. The dilutions were analyzed using an Agilent 5110 Inductively Coupled Plasma-Optical Emission Spectrometer (Agilent Technologies, Santa Clara, CA, USA). Recoveries for pseudo-total digests of NIST 1944 and 2709a for Al, Ca, K, Fe, Mn, and Si were 71–93% of their certified values. The low recover rates were due to the incomplete digestion of silicate minerals. The metal concentration coefficient of variation between intra-sample duplicates was <5% and metal concentrations in the preparation blank samples were <0.2% of their analyte concentrations.

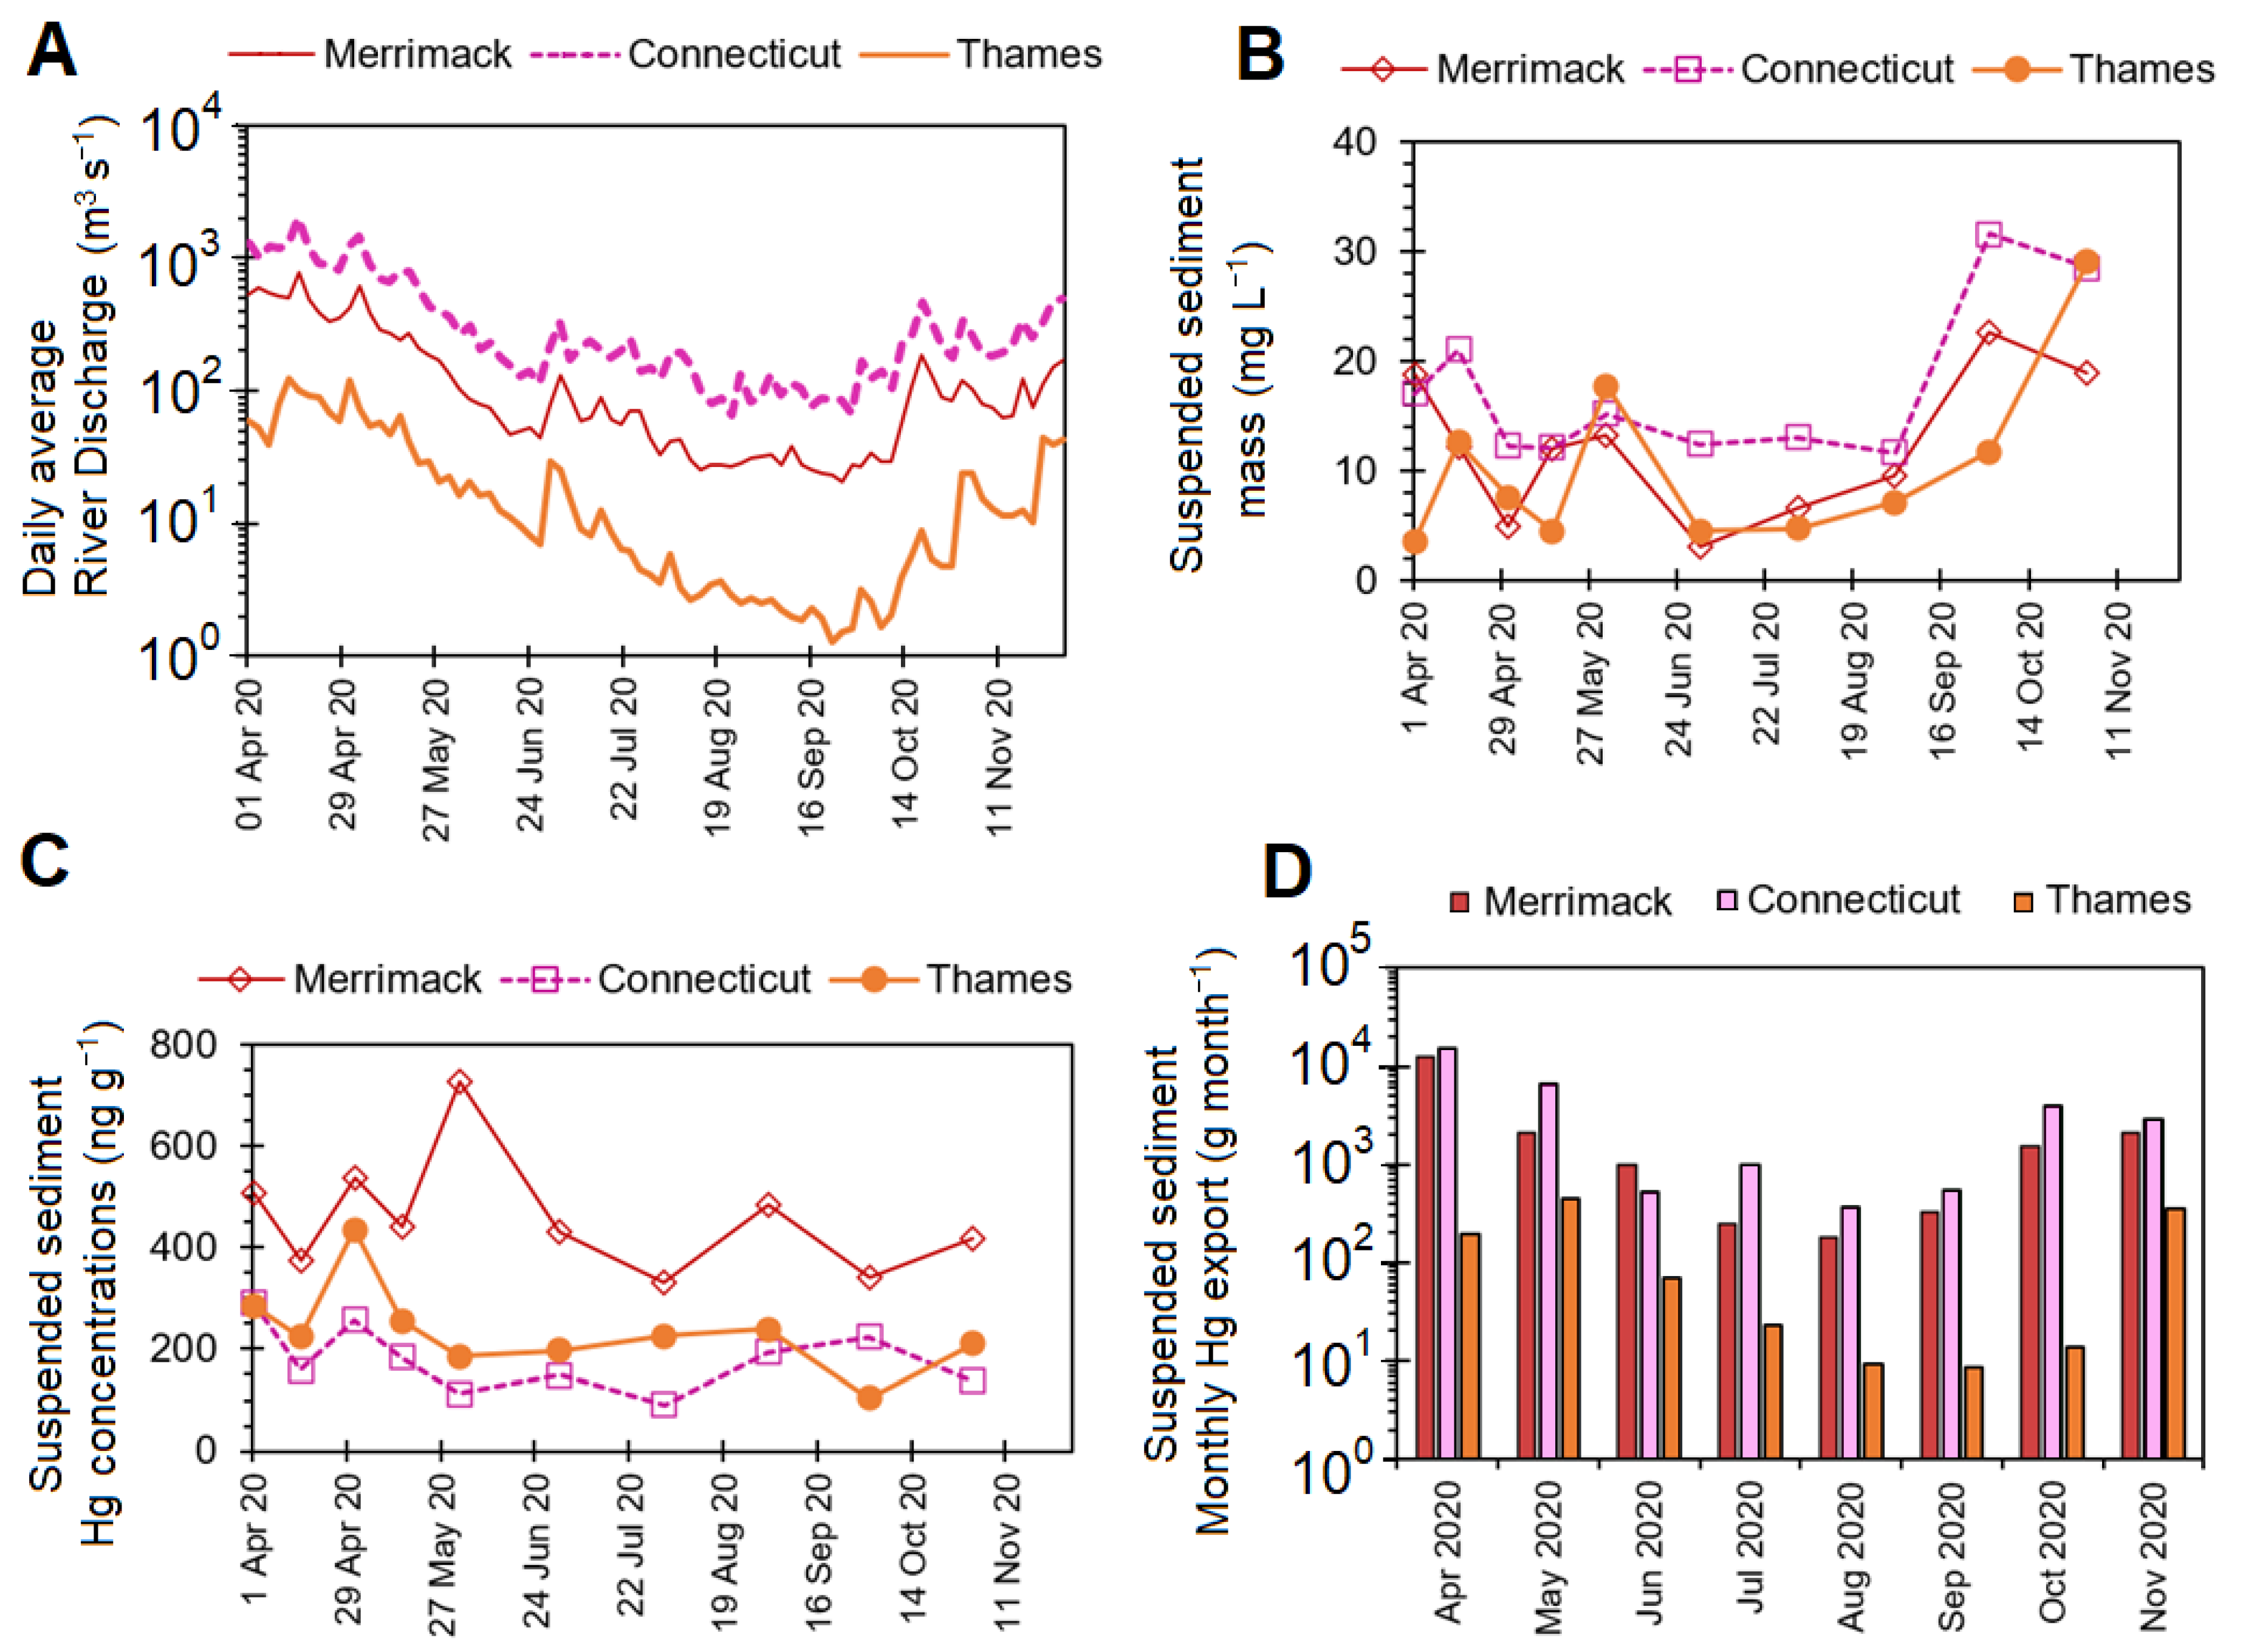
2.6. Suspended Sediment Hg Export Estimation

To estimate watershed Hg export, total discharge was determined from the monthly summed discharge amounts through the sampling period obtained from the USGS for the Connecticut River at the USGS Station 1193050, Merrimack River at USGS station 110000, and for the Thames River at the Quinebaug station 1127000, Shetucket station 11230695, Yantic station 1127500. Average suspended sediment masses from the 1-L bottles were used to estimate the monthly suspended sediment discharge amounts. Next, we used Hg concentrations from the trapped suspended sediments, as they are a better qualitative estimate of the integrated Hg concentrations due to their multi-week collection and deployment. These methods make several key assumptions that must be noted. First, the suspended sediment amounts are likely underestimates as storms events and other stochastic large influxes are not captured. Further, we collected water within <4 m of the edge of the river, which means that larger sediment transported in the center of the stream channel are not captured. Lastly, the due to low sample mass we must rely on the trapped Hg sediments as opposed to the suspended sediments in the 1-L bottles for suspended sediment Hg concentrations. Despite these limitations, these methods provide an empirically grounded approximation of suspended sediment and their Hg concentration.

2.7. Statistical Analyses

Descriptive statistics were calculated in Matlab (Mathworks, Natick, MA, USA). Average values are presented in text and in figures ± 1 standard error. Since data were limited, nonparametric statistics, such as the Kruskal–Wallis for comparisons among three or more watersheds with post hoc Wilcoxon Signed Rank test and comparisons between specific watersheds was with the Wilcoxon Signed Rank test, were used to compare soil and suspended sediment Hg concentrations among watersheds. To examine relationships among soil elements, %SOM (%soil organic matter g/g), extractable Fe, and Hg, data were tested for normality, logarithmically transformed when necessary, and compared with Pearson Linear Regressions or Exponential regressions. Slope, intercept, coefficients of determination, and p-values are provided for the regression models.

3. Results and Discussion

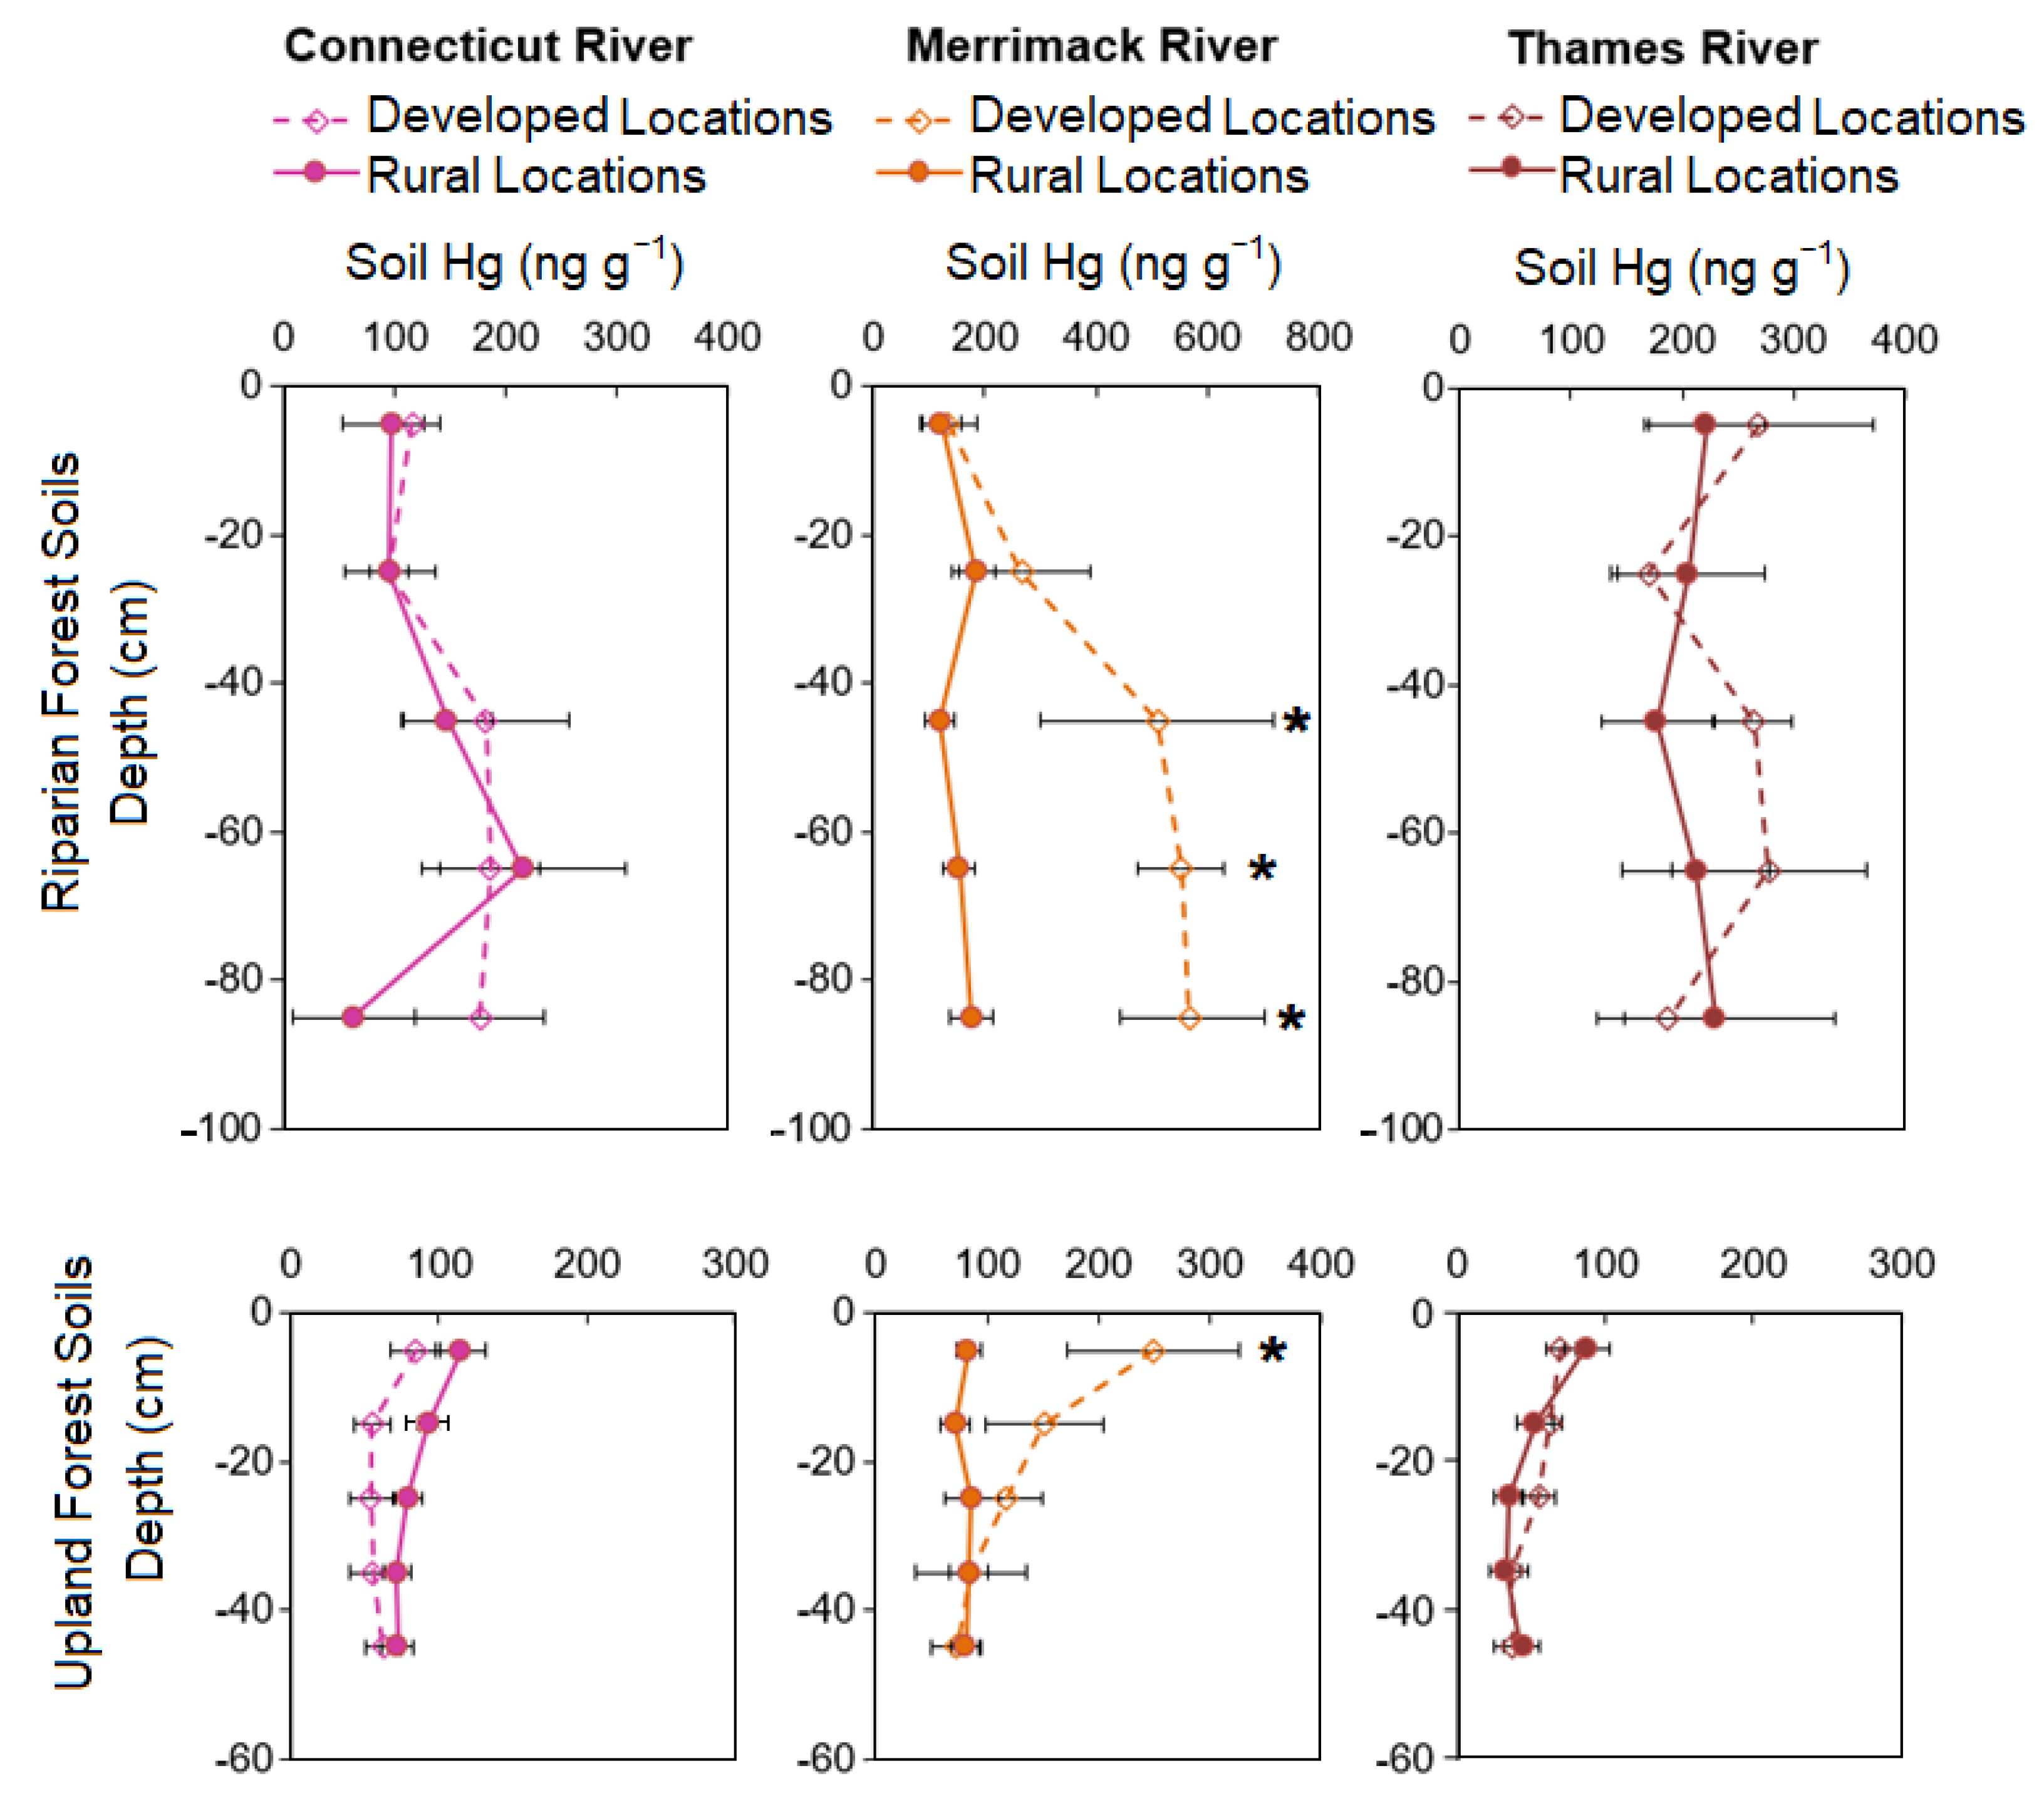
3.1. Upland and Riparian Forest Soil Hg among the Watersheds

In our first set of hypotheses, we investigated if there are significant differences in accumulation of Hg in upland and riparian forest soils. Across the 48 upland forest sites and all depths, the overall mean and median Hg concentration were 83 ng g−1 and 71 ng g−1, respectively, with a Q1 of 43 ng g−1 and Q3 of 94 ng g−1. Considering each of the three watersheds, there were no significant differences in upland forest soil Hg concentrations across depths among the three watersheds. Mean upland forest soil Hg concentrations in the Connecticut River watershed were 74 ± 7 ng g−1, Merrimack River watershed were 113 ± 46 ng g−1, and Thames River watershed were 51 ± 11 ng g−1. When considering the 32 riparian forest soils across all depths, their Hg concentrations were significantly higher than the upland forest soils (p < 0.05). The overall mean and median Hg concentration in riparian forest soils were 209 ng g−1 and 153 ng g−1, respectively, with a Q1 of 95 ng g−1 and Q3 of 266 ng g−1. Since the soil parent material across the three watersheds is a heterogeneous mix of glacial-till, glaciofluvial deposits, and other post-glacial deposits [17,20], there were no expectations for elevated bedrock-induced Hg sources. Instead, Hg in the upland forest soils of the northeastern US were controlled by atmospheric deposition [31,32], particularly proximity to historical and urban sources [33].
Considering each of the three watersheds, there were significant differences in overall riparian forest soil Hg concentrations. Mean riparian forest soil Hg concentrations in the Connecticut River watershed were (137 ± 29 ng g−1) was significantly lower than in the Merrimack River watershed (268 ± 90 ng g−1) and in the Thames River watershed (216 ± 45 ng g−1). The significantly higher riparian forest soil Hg concentrations of the Merrimack watershed reflect the greater historical river pollution of the Merrimack River. Largemouth Bass (Micropterus salmoides) and Yellow perch (Perca flavescens) sampled from ponds throughout the Merrimack River watershed between 1990 to 2011 had wet weight tissue Hg concentrations ranging from 0.13 up to 1.63 mg kg−1, and were not recommended for consumption by sensitive human groups: children and pregnant women [15]. Historical Hg pollution in the Merrimack River and Thames River are believed to be sourced from textile mills, tanneries, and mining facilities in the 1700s to 1900s and more recent pollution of untreated sewage, industrial wastes continued until passage of the Clean Water Act [14,34,35]. Mercury pollution from the rivers have been deposited to riparian forest soil stream banks and floodplains during storm events [36], enriching their Hg concentrations higher than in upland forest soils.
Our forest soil Hg concentrations were either similar or elevated compared to other temperate forest regions globally. As prime examples, elevated Hg concentrations in mineral soils of temperate forests across the Czech Republic (10 to 400 ng g−1) [37], in central Poland (1 to 322 ng g−1) [38], northeastern China (80 to 730 ng g−1) [39], and southwestern China (120 to 260 ng g−1) [40]. The sequestration of Hg in temperate forest soils across North America, China, and Europe appear to be comparable, despite 2x to 5x atmospheric deposition rates of Hg in China. Riparian forest soil Hg concentrations in the Merrimack River Watershed far exceeded upland forest soil Hg concentrations in our study and are elevated above concentrations of other point source contaminated temperate riparian soils. For example, riparian soils contaminated with Hg from point source pollution by the Guizhou organic chemical plant in Guiyang City, China only attained Hg concentrations of 109 to 371 ng g−1 [41]. However, an extensive point source Hg pollution from a DuPont textile manufacturing plant in Waynesboro, VA, USA caused the 30 to 70,000 ng g−1 in riparian forest soils [42].

3.2. Upland and Riparian Forest Soil Hg between Rural and Developed Locations

In our second set of hypotheses, we investigated if the accumulation of Hg in upland and riparian forest soils varied between rural and developed areas (Figure 2). For upland forest soils in the Connecticut River watershed, Hg concentrations were significantly different between rural (86 ± 10 ng g−1) and developed locations (62 ± 12 ng g−1) (p < 0.01). For the Merrimack River watershed, upland forest soil Hg concentrations were significantly different between rural (81 ± 11 ng g−1) and developed locations (136 ± 48 ng g−1) (p < 0.01). For the Thames River watershed, Hg concentrations were not significantly different between rural forest soils (53 ± 6 ng g−1) and developed forest soils (50 ± 9 ng g−1) (p = 0.32). Furthermore, upland forest soil Hg concentrations in the Merrimack River watershed developed areas and rural areas were significantly greater than their respective counterparts in the Connecticut River Watershed and Thames River Watershed. Our results for the Connecticut River Watershed suggest that the undisturbed forest soils in rural areas have been able to accumulate and retain higher Hg concentrations than more developed and disturbed soils, particularly forests cleared in the 1800s, abandoned in the late 1800s, and reforested during the early 1900s [43,44]. Conversely, in the Merrimack River watershed, upland forest soils closer in proximity to Hg emitters in developed areas had higher Hg concentrations. These results imply that proximity to point sources may play the dominant larger role in Hg accumulation and retention in upland forest soils than disturbance of surface horizons by human activities. Since the Thames River Watershed is much smaller than the other two watersheds, thus these space-driven differences may not be possible within that watershed.
For riparian forest soils in the Connecticut River watershed, Hg concentrations were not significantly different between rural forest soils (124 ± 24 ng g−1) and developed forest soils (151 ± 33 ng g−1) (p = 0.09). Similarly, the Hg concentrations in riparian forests soils in the Thames River watershed were not significantly different between rural (234 ± 40 ng g−1) and developed locations (209 ± 46 ng g−1) (p = 0.41). For the Merrimack River watershed, riparian forest soil Hg concentrations were significantly higher in developed forest soils (407 ± 119 ng g−1) than in rural forest soils (157 ± 22 ng g−1) (p < 0.01). Furthermore, riparian forest soil Hg concentrations in Merrimack River watershed developed areas and rural areas were significantly greater than their respective counterparts in the Connecticut River Watershed and Thames River Watershed. These results further highlight that both the riparian and upland forest soils of the Merrimack River have elevated forest soil Hg concentrations. Moreover, they support our previously discussed mechanisms of historical Hg pollution from former industrial activities and untreated wastes and sewage in the Merrimack River driving the elevated forest soil Hg concentrations [14,34,35]. Lastly, the Merrimack River has a greater percentage of urban and developed areas than the other two watersheds (Table 1), making it more susceptible to Hg pollution from municipal, commercial, and industrial sources.
When considering upland and riparian forest soil Hg profiles (Figure 3), we observed some significant differences which varied with depth. The upland and riparian forest soil Hg concentration profiles for the Connecticut River watershed and Thames River watershed did not show significant differences with depth for rural and developed locations. The riparian forest soil Hg concentrations in the Merrimack River watershed increased significantly with depth from 135 ± 50 ng g−1 up to 568 ± 191 ng g−1 for developed locations (p < 0.01), but not for rural locations (p = 0.12). Conversely, the riparian forest soil Hg concentrations in the Merrimack River watershed decreased with depth from 250 ± 77 ng g−1 up to 73 ± 22 ng g−1 for developed locations (p < 0.01) but not for rural locations (p = 0.18). Decreasing Hg concentrations with depths in upland forest soils demonstrate sequestration of atmospheric deposition, which has been observed in upland forests across the region [4,32]. However, riparian forest soils had increasing Hg concentrations with depth. This is an important difference between the two types of forest soils and imply that new sediment has been deposited on top of the Hg pollution in the riparian areas. It is difficult to elucidate whether the Hg accumulated while the sediment was submerged from former mill dams or accumulated while aerial from sporadic sediment depositional events from large storms [45]. For example, in Dow et al., [46], Hg/SOM ratio generally increased with depth in riparian soils developed from submerged sediments deposited between 1900 and 1980 in South River of Massachusetts, a tributary of the Connecticut River. Dow et al., [46] concluded that sediments had collected Hg while submerged, which was later inherited by the soils formed from the sediments after dam removal. In either case, our results suggest that the Hg in riparian forest soils of the Merrimack River are not recent atmospheric deposition and have been buried by newer sediments.
We investigated the role of %SOM and extractable, non-silicate Fe as a proxy for crystalline and amorphous Fe oxyhydroxides in Hg sequestration in upland and riparian forest soils across the three watersheds. Mercury concentrations were correlated with %SOM but not with Fe concentrations in riparian forest soils (Figure 4). Similarly, Hg concentrations were correlated with %SOM but not with Fe concentrations in upland forest soils (Figure 4). These results highlight the consistently observed control of organic matter influencing the accumulation and retention of Hg in soil [4,7,31,32]. However, these soils did not have a strong relationship between Hg and Fe concentrations, suggesting that other processes, such as extent of soil development and type of Fe (i.e., reduced Fe forms) affected the detection of Fe oxyhydroxide accumulation of Hg. Furthermore, the soils studied were often young, Entisols and Inceptisols and have not undergone extensive pedogenesis to develop Fe oxyhyroxides that promote Hg sequestration [32,47].

3.3. Suspended Sediment Hg Concentrations

In our third hypothesis, we investigated if the export of Hg via suspended sediments differed among the three watersheds. Bottled suspended sediments were used to estimate the mass of suspended sediments, but were too little mass to conduct and replicate chemical analyses. Across the three watersheds and river water sampling collection dates, the overall mean and median suspended sediment in 1-L water samples were 13 mg L−1 and 12 mg L−1, respectively, with a Q1 of 7 mg L−1 and Q3 of 18 mg L−1. Bottle suspended sediment in the Merrimack River (12 ± 2 mg L−1) was not significantly lower than in the Connecticut River (17 ± 3 mg L−1) (p = 0.09), but the Thames River watershed (10 ± 2 mg L−1) was significantly lower than the Connecticut River (p < 0.01). We hypothesize the steeper headwater terrain, higher discharge rates, and eroding glaciofluvial deposits of the Connecticut River and Merrimack River contributed to the higher suspended sediment loads compared with the Thames River [19,36,45,48].
Across the three watersheds and suspended sediment trap collections (Figure 5), the overall mean and median Hg concentration were 292 ng g−1 and 247 ng g−1, respectively, with a Q1 of 185 ng g−1 and Q3 of 421 ng g−1. Suspended sediment Hg concentrations in the Merrimack River watershed (460 ± 35 ng g−1) was significantly higher than in the Connecticut River watershed (180 ± 20 ng g−1) (p < 0.01) and the Thames River watershed (236 ± 26 ng g−1) (p < 0.01). The higher suspended sediment Hg concentrations in the Merrimack River are likely historical industrial and urban pollution, similar to the riparian soils described previously.
Using USGS monthly discharge totals and suspended sediment masses from the 1-L bottles we estimated the median monthly suspended sediment discharge amounts for the three watersheds, which were: 16.9 Gg month−1 for the Connecticut River, 5.1 Gg month−1 for the Merrimack River, and 0.5 Gg month−1 for the Thames River. Next, we used Hg concentrations from the trapped suspended sediments as integrated estimate of suspended sediment Hg concentrations, which we expected to be more representative due to their multi-week collection and deployment. We estimated the median suspended sediment Hg export to be 3.89 kg month−1 for the Connecticut River, 2.48 kg month−1 for the Merrimack River, and 0.14 kg month−1 for the Thames River. Our results highlight that the Connecticut River, which had the largest watershed area, was the larger exporter of Hg via suspended sediments of the three watersheds studied here. We hypothesize that the 3x larger discharge of suspended sediment from the Connecticut River was the primary factor driving the greater Hg export rate per month than the Merrimack River. Our suspended sediment estimate of Hg finding generally agrees with Balcom et al. [14]), in which half of the 8.19 kg month−1 Hg export occurred as suspended particulates for the Connecticut River. However, our study did not quantify dissolved Hg concentrations, which as quantified by Balcom et al. [14], represented approximately half of the river Hg export.
If we scale the Hg export rate to the total area of the watershed, the relative export rates increase for the Merrimack River and decrease for the Connecticut River. Suspended sediment Hg export rates normalized to area change to 0.13 kg km−2 month−1 for the Connecticut River, 0.19 kg km−2 month−1 for the Merrimack River, and 0.04 km−2 for the Thames River (Figure 5). When considered on an area-normalized basis, the Merrimack River was the largest Hg exporter per unit area. This finding agrees with the higher suspended sediment Hg concentrations and higher Hg concentrations in the riparian forest soils of the Merrimack River than in the Connecticut River and Thames River. This highlights the extensive history of Hg pollution in the Merrimack River [49] rather than the increasing Hg atmospheric deposition from global industrialization (see [1]). The Merrimack River has been identified as a biological hotspot for biotic Hg accumulation in fish, such as yellow perch and loons [15,50]. The Hg could have been sourced from the higher atmospheric deposition of Hg from combustion of fuels and waste [15,50] or from direct Hg pollution to the Merrimack River from its higher urbanization and industrial land-use history into the early 1600s [34,35,46]. The Thames River was much smaller than the Connecticut and Merrimack Rivers, and normalization by watershed area still showed the lowest normalized Hg export rates per km−2. We hypothesize that the Thames had the lowest normalized Hg export rates km−2 due to low suspended sediments due to the many dams on the main branches of the Yantic, Quinebaug, and Shetucket Rivers.
Our monthly river Hg export estimates has some key limitations to note. First, we utilized traps to collect an integrated Hg concentration signal in suspended sediments. One important drawback from this approach was the preferential accumulation of lighter, organic rich sediments while mineral dominated sediments moving along the bottom of the stream channel appear to be under-sampled. Furthermore, the 2020 year was a drier hydrologic year compared with the 30-year average. This could have led to less Hg transport and export in the three rivers from decreased water, lower suspended sediment from less erosion or stream power, or movement of atmospherically deposited Hg from riparian soils to streams. However, our sediment masses in 1-L river water samples and sediment export masses were comparable to those reported by Balcom et al. [14]. Lastly, without dissolved Hg concentrations, we are missing an essential piece to quantify total river Hg exports by the Connecticut, Merrimack, and Thames Rivers. As shown in Balcom et al. [14], even though Hg concentrations were <0.005 µg L−1, when scaled to the volume of water traversing the watersheds, it can result in kilograms of Hg per month.
Considering the suspended sediment across the three watersheds, Hg concentrations were correlated with the organic matter content of the sediments and also the Fe concentrations. These correlations demonstrate the sediment transport of Hg is aided by the complexation by amorphous to crystalline Fe, as well as organic matter (Figure 6). These relationships have been identified before such as in Rhoton and Bennett [51], who observed coefficients of determination R2 values >0.44 for organic carbon and Fe oxides in river sediment cores in the Yalobusha River of Mississippi, USA. Thus, the transport of suspended sediment Hg is tied to the movement of adsorbents across the three watersheds.

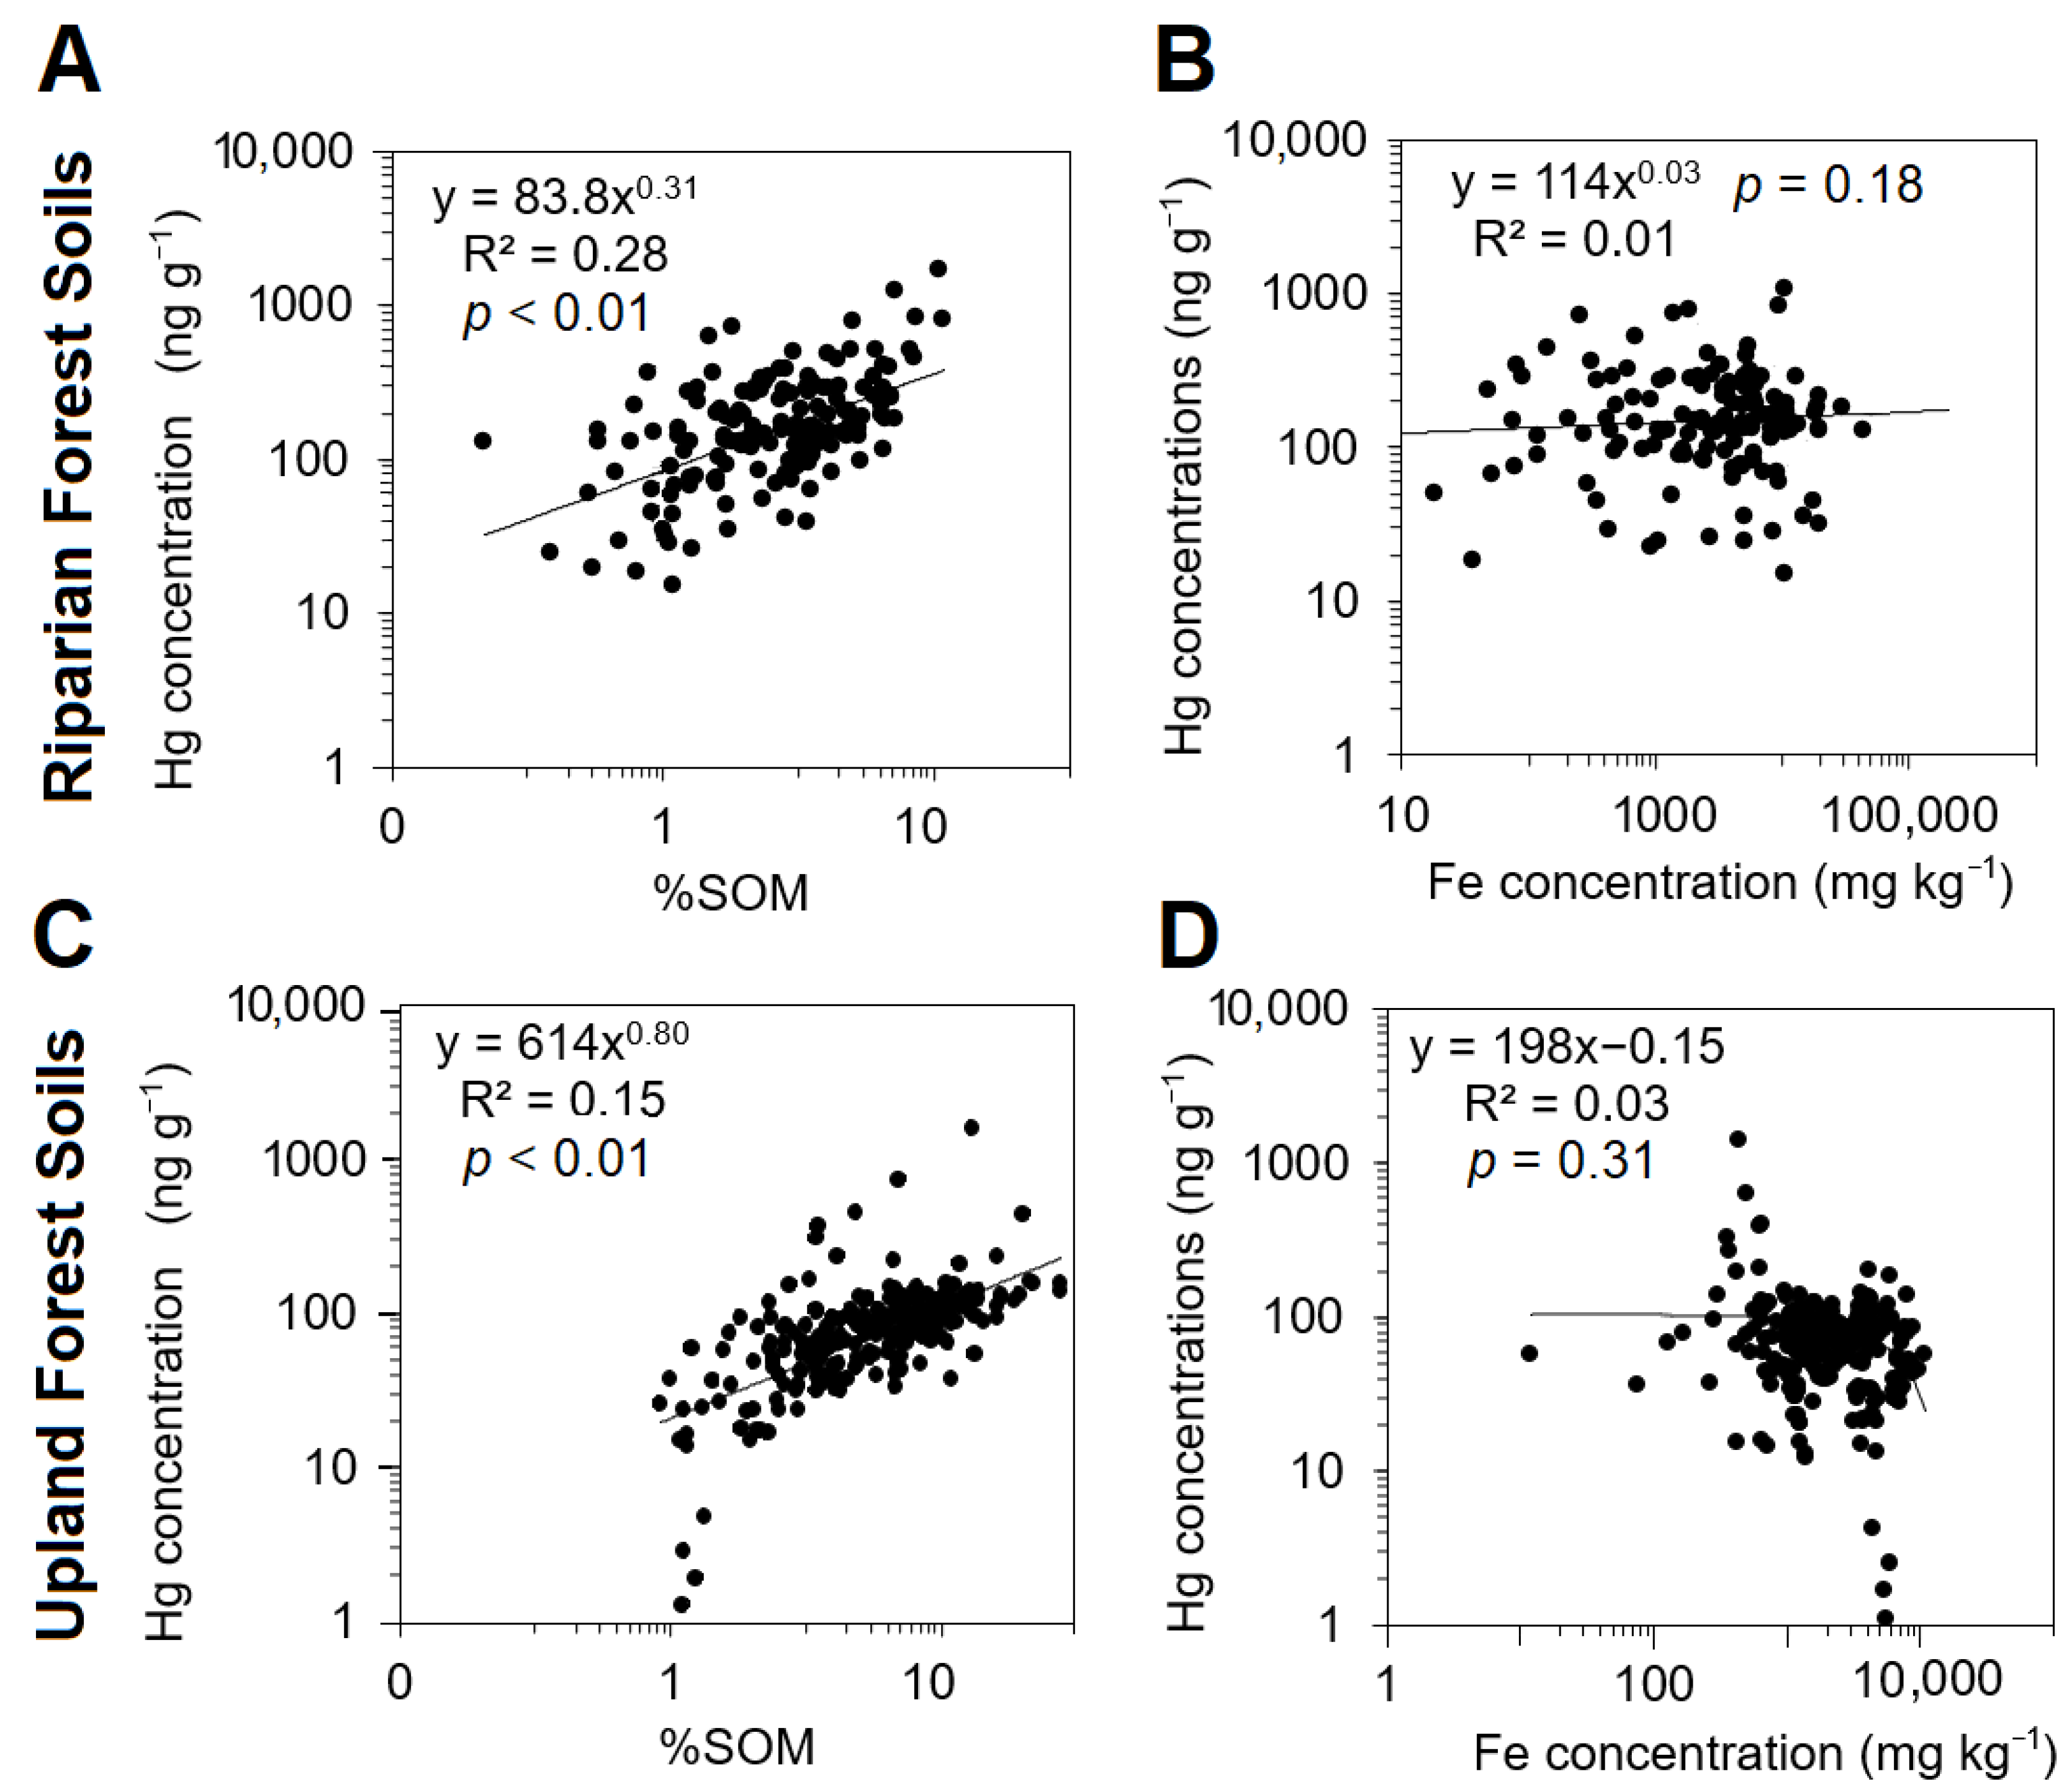
3.4. Linkages between Upland and Riparian Soils with Suspended Sediments

Although direct transport of Hg from upland and riparian forest soils were not measured or studied, some conclusions at the watershed scale can be inferred. Riparian forest soil Hg concentrations and suspended sediment Hg transport appear to be closely linked, particularly for the Merrimack River Watershed. In the Merrimack River Watershed, Hg appears be sourced from historical industrial and urban pollution, which is in part sequestered in riparian forest soils during depositional events and being transported by suspended sediments under erosion. This agrees with other point source Hg pollution dynamics, such as in the study by Pizzuto [52]. In their study, suspended sediments carrying Hg from a point source pollutant emission into the South River of central Virginia USA, have been deposited onto floodplains during high flow events. Moreover, subsequent erosion events of streambanks lead to further downstream enrichment of Hg in suspended sediments [52]. Linkages between upland forest soils and suspended sediments is less clear. Our study showed that upland forest soils can sequester Hg when in proximity to point source emissions. From our data, it is difficult to discern if these correspond with higher Hg concentrations in suspended sediments due to the also enriched riparian soil Hg concentrations. It is well-documented that upland forest soils and store Hg, which driven by organic matter dynamics and illustrated in many previous studies [4,31,32,37,47], and further evidence is needed to determine if their stability and if surface erosion can be an important transport mechanism. Due to the development of thick organic horizons (4 to 15 cm deep), surface erosion and transport of upland forest soil Hg is unlikely except in areas in which geomorphology allows for exposure and mobilization of the mineral soil.

4. Conclusions and Implications

The results from our study highlight differences in the sequestration of Hg in forest soils and the transport of Hg via suspended sediments across the Connecticut River, Merrimack River, and Thames River watersheds. Forest soil Hg concentrations were greater in riparian forest soils than in upland forest soils across all three watersheds and developed sites near urbanization had higher Hg concentrations only in the Merrimack River watershed. The sequestration of Hg in riparian soils was likely the result of historical industrial and urban pollution sequestered in sediments deposited during storm events.
Furthermore, our results highlight distinct differences in suspended sediment export of Hg. The Connecticut River had higher median suspended sediment masses in water samples, but the Merrimack River had higher Hg concentrations in trapped suspended sediments. Due its much larger size, suspended sediment Hg export rates for the Connecticut river was 3.89 kg month−1 compared to 2.48 kg month−1 for the Merrimack River, and 0.14 kg month−1 for the Thames River. This agrees with the general understanding of larger watersheds carrying more sediments. However, when suspended sediment Hg median export rates were scaled by total area of the watershed, the Merrimack River had 0.19 kg km−2 month−1, while the Connecticut River had 0.13 kg km−2 month−1, and 0.04 kg km−2 month−1 for the Thames River. We hypothesize that the higher Hg export rate for the Merrimack River was controlled by remobilization of historical Hg pollution. The fact that most of the Hg was buried beneath 40+ cm of current soil and modern erosion, as opposed to subsurface colloidal transport, appears to be important for remobilization of sequestered Hg from riparian forest soils. Further studies of the complex nature of suspended sediment sourcing and temporal scales for remobilization and transport of Hg within the watersheds is warranted, especially during storm events.

Author Contributions

Conceptualization, J.B.R.; methodology, J.B.R., I.C.M., M.J.B.; analysis, J.B.R.; writing—original draft preparation, J.B.R.; writing—review and editing, J.B.R., I.C.M., M.J.B. All authors have read and agreed to the published version of the manuscript.

Funding

This research was funded by University of Massachusetts Amherst, College of Natural Science grant number 11-01 to J.B.R.

Data Availability Statement

All data used in analyses are available in Figures and Tables of the study.

Acknowledgments

We thank the contributions by University of Massachusetts Amherst undergraduate researchers Bryan Dole and Stephanie Thrasher for aiding in sample processing.

Conflicts of Interest

The authors declare no conflict of interest the funders had no role in the design of the study; in the collection, analyses, or interpretation of data; in the writing of the manuscript, or in the decision to publish the results.

References

  1. Streets, D.G.; Horowitz, H.M.; Lu, Z.; Levin, L.; Thackray, C.P.; Sunderland, E.M. Global and regional trends in mercury emissions and concentrations, 2010–2015. Atmos. Environ. 2019, 201, 417–427. [Google Scholar] [CrossRef]
  2. Song, S.; Selin, N.E.; Soerensen, A.L.; Angot, H.; Artz, R.; Brooks, S.; Brunke, E.G.; Conley, G.; Dommergue, A.; Ebinghaus, R.; et al. Top-down constraints on atmospheric mercury emissions and implications for global biogeochemical cycling. Atmos. Chem. Phys. 2015, 15, 7103–7125. [Google Scholar] [CrossRef] [Green Version]
  3. Raihan, S.M.; Moniruzzaman, M.; Park, Y.; Lee, S.; Bai, S.C. Evaluation of dietary organic and inorganic mercury threshold levels on induced mercury toxicity in a marine fish model. Animals 2020, 10, 405. [Google Scholar] [CrossRef] [Green Version]
  4. Richardson, J.B.; Friedland, A.J.; Engerbretson, T.R.; Kaste, J.M.; Jackson, B.P. Spatial and vertical distribution of mercury in upland forest soils across the northeastern United States. Environ. Pollut. 2013, 182, 127–134. [Google Scholar] [CrossRef] [Green Version]
  5. Zhang, Y.R.; Wang, R.Q.; Xue, T.; Ge, X.L.; Liu, J. Effects of soil properties and flooding on the mobility and transformation of mercury in a temperate Riparian wetland. Soil Sediment Contam. Int. J. 2015, 24, 191–205. [Google Scholar] [CrossRef]
  6. Richardson, J.B.; Moore, L. A tale of three cities: Mercury in urban deciduous foliage and soils across land-uses in Poughkeepsie NY, Hartford CT, and Springfield MA USA. Sci. Total Environ. 2020, 715, 136869. [Google Scholar] [CrossRef]
  7. Demers, J.D.; Yavitt, J.B.; Driscoll, C.T.; Montesdeoca, M.R. Legacy mercury and stoichiometry with C, N, and S in soil, pore water, and stream water across the upland-wetland interface: The influence of hydrogeologic setting. J. Geophys. Res. Biogeosci. 2013, 118, 825–841. [Google Scholar] [CrossRef]
  8. Baptista-Salazar, C.; Richard, J.H.; Horf, M.; Rejc, M.; Gosar, M.; Biester, H. Grain-size dependence of mercury speciation in river suspended matter, sediments and soils in a mercury mining area at varying hydrological conditions. Appl. Geochem. 2017, 81, 132–142. [Google Scholar] [CrossRef]
  9. Ravera, O.; Cenci, R.; Beone, G.M.; Dantas, M.; Lodigiani, P. Trace element concentrations in freshwater mussels and macrophytes as related to those in their environment. J. Limnol. 2003, 62, 61–70. [Google Scholar] [CrossRef] [Green Version]
  10. Regnell, O.; Watras, C.J. Microbial mercury methylation in aquatic environments: A critical review of published field and laboratory studies. Environ. Sci. Technol. 2018, 53, 4–19. [Google Scholar] [CrossRef]
  11. Jović, M.D.; Stanković, S. Determination of marine pollution by comparative analysis of metal pollution indices. Arch. Biol. Sci. 2014, 66, 1205–1215. [Google Scholar] [CrossRef] [Green Version]
  12. He, M.; Tian, L.; Braaten, H.F.V.; Wu, Q.; Luo, J.; Cai, L.M.; Meng, J.H.; Lin, Y. Mercury–organic matter interactions in soils and sediments: Angel or devil? Bull. Environ. Contam. Toxicol. 2019, 102, 621–627. [Google Scholar] [CrossRef] [PubMed]
  13. Liu, M.; Zhang, Q.; Maavara, T.; Liu, S.; Wang, X.; Raymond, P.A. Rivers as the largest source of mercury to coastal oceans worldwide. Nat. Geosci. 2021, 14, 672–677. [Google Scholar] [CrossRef]
  14. Balcom, P.H.; Fitzgerald, W.F.; Vandal, G.M.; Lamborg, C.H.; Rolfhus, K.R.; Langer, C.S.; Hammerschmidt, C.R. Mercury sources and cycling in the Connecticut River and Long Island Sound. Mar. Chem. 2004, 90, 53–74. [Google Scholar] [CrossRef]
  15. Blake, T. Methylmercury Exposure through Fish Ingestion and Trends in Human Health Risk in the Merrimack River Watershed. Master’s Thesis, Tufts University, Boston, MA, USA, August 2017. [Google Scholar]
  16. Connecticut Department of Energy and Environmental Protection [CT DEEP]. Long Island Sound Blue Plant. 2019. Available online: https://portal.ct.gov/DEEP/Coastal-Resources/LIS-Blue-Plan/Blue-Plan-Basic-Background (accessed on 1 October 2020).
  17. Lindbo, D.L.; Veneman, P.L.M. Morphological and physical properties of selected fragipan soils in Massachusetts. Soil Sci. Soc. Am. J. 1993, 57, 429–436. [Google Scholar] [CrossRef]
  18. Richardson, J.B. Comparing Trace Elements (As, Cu, Ni, Pb, and Zn) in Soils and Surface Waters among Montane, Upland Watersheds and Lowland, Urban Watersheds in New England, USA. Water 2021, 13, 59. [Google Scholar] [CrossRef]
  19. Yellen, B.; Woodruff, J.D.; Kratz, L.N.; Mabee, S.B.; Morrison, J.; Martini, A.M. Source, conveyance and fate of suspended sediments following Hurricane Irene. New England, USA. Geomorphology 2014, 226, 124–134. [Google Scholar] [CrossRef]
  20. Johnson, K.M.; Snyder, N.P.; Castle, S.; Hopkins, A.J.; Waltner, M.; Merritts, D.J.; Walter, R.C. Legacy sediment storage in New England river valleys: Anthropogenic processes in a postglacial landscape. Geomorphology 2019, 327, 417–437. [Google Scholar] [CrossRef]
  21. Metzler, K.J.; Tiner, R.W. Wetlands of Connecticut. State Geological and Natural History Survey of Connecticut; Department of Environmental Protection: Hartford, CT, USA, 1992. [Google Scholar]
  22. Lindbo, D.L.; Brigham-Grette, J.; Veneman, P.L. Depositional and Post-Depositional Features in the Late Illinoian and Late Wisconsinan Tills of Massachusetts. Whole Regolith Pedol. 1994, 34, 75–95. [Google Scholar]
  23. Friesz, P.J. Geohydrology of Stratified Drift and Streamflow in the Deerfield River Basin, Northwestern Massachusetts; US Department of the Interior, US Geological Survey: Marlborough, MA, USA, 1996; Volume 96. [Google Scholar]
  24. Wickham, J.; Stehman, S.V.; Sorenson, D.G.; Gass, L.; Dewitz, J.A. Thematic accuracy assessment of the NLCD 2016 land cover for the conterminous United States. Remote Sens. Environ. 2021, 257, 112357. [Google Scholar] [CrossRef]
  25. Mackowiak, T.J.; Mischenko, I.C.; Butler, M.J.; Richardson, J.B. Trace metals and metalloids in peri-urban soil and foliage across geologic materials, ecosystems, and development intensities in Southern California. J. Soils Sediments 2021, 21, 1713–1729. [Google Scholar] [CrossRef]
  26. U.S. Geological Survey (USGS). Collection of Water Samples (ver. 2.0): U.S. Geological Survey Techniques of Water-Resources Investigations, Book 9, Chap. A4. September 2006. Available online: http://pubs.water.usgs.gov/twri9A4/ (accessed on 15 January 2017).
  27. Kasper, D.; Amaral, J.H.F.; Forsberg, B.R. The effect of filter type and porosity on total suspended sediment determinations. Anal. Methods 2018, 10, 5532–5539. [Google Scholar] [CrossRef]
  28. Kayvantash, D.; Cojan, I.; Kissel, C.; Franke, C. Magnetic fingerprint of the sediment load in a meander bend section of the Seine River (France). Geomorphology 2017, 286, 14–26. [Google Scholar] [CrossRef]
  29. Patault, E.; Alary, C.; Franke, C.; Abriak, N.E. Quantification of tributaries contributions using a confluence-based sediment fingerprinting approach in the Canche river watershed (France). Sci. Total Environ. 2019, 668, 457–469. [Google Scholar] [CrossRef]
  30. Chen, J.; Hintelmann, H.; Dimock, B. Chromatographic pre-concentration of Hg from dilute aqueous solutions for isotopic measurement by MC-ICP-MS. J. Anal. At. Spectrom. 2010, 25, 1402–1409. [Google Scholar] [CrossRef]
  31. Yu, X.; Driscoll, C.T.; Warby, R.A.; Montesdeoca, M.; Johnson, C.E. Soil mercury and its response to atmospheric mercury deposition across the northeastern United States. Ecol. Appl. 2014, 24, 812–822. [Google Scholar] [CrossRef] [Green Version]
  32. Richardson, J.B.; Friedland, A.J. Mercury in coniferous and deciduous upland forests in northern New England, USA: Implications of climate change. Biogeosciences 2015, 12, 6737–6749. [Google Scholar] [CrossRef] [Green Version]
  33. Fitzgerald, W.F.; Engstrom, D.R.; Hammerschmidt, C.R.; Lamborg, C.H.; Balcom, P.H.; Lima-Braun, A.L.; Bothner, M.H.; Reddy, C.M. Global and local sources of mercury deposition in coastal New England reconstructed from a multiproxy, high-resolution, estuarine sediment record. Environ. Sci. Technol. 2018, 52, 7614–7620. [Google Scholar] [CrossRef]
  34. Studer, M.M. The Chemistry and Geochemistry of Selected Metals in the Merrimack River of New England and Regulatory Considerations of Water Quality. Ph.D. Dissertation, University of Massachusetts-Boston, Boston, MA, USA, September 1995. [Google Scholar]
  35. Nelson, L.A. Mercury in the Thames estuary. Environ. Technol. 1981, 2, 225–232. [Google Scholar] [CrossRef]
  36. Andersen, J.J. Mobilization of Mercury-Contaminated Sediment in a Regulated River, Androscoggin River, Nrthern New Hampshire. Master’s Thesis, Dartmouth College, Hanover, NH, USA, 19 August 2013. [Google Scholar]
  37. Navrátil, T.; Shanley, J.; Rohovec, J.; Hojdová, M.; Penížek, V.; Buchtová, J. Distribution and pools of mercury in Czech forest soils. Water Air Soil Pollut. 2014, 225, 1–17. [Google Scholar] [CrossRef]
  38. Gruba, P.; Socha, J.; Pietrzykowski, M.; Pasichnyk, D. Tree species affects the concentration of total mercury (Hg) in forest soils: Evidence from a forest soil inventory in Poland. Sci. Total Environ. 2019, 647, 141–148. [Google Scholar] [CrossRef] [PubMed]
  39. Xing, D.H.; Liang, C.H.; Wang, S.F.; Jia, Y.F. Concentration and speciation distribution of mercury in forest soils on northern slope of Changbai Mountain. Chin. J. Ecol. 2011, 30, 106–111. [Google Scholar]
  40. Fu, X.; Feng, X.; Zhu, W.; Rothenberg, S.; Yao, H.; Zhang, H. Elevated atmospheric deposition and dynamics of mercury in a remote upland forest of southwestern China. Environ. Pollut. 2010, 158, 2324–2333. [Google Scholar] [CrossRef]
  41. Li, Q.; Tang, L.; Qiu, G.; Liu, C. Total mercury and methylmercury in the soil and vegetation of a riparian zone along a mercury-impacted reservoir. Sci. Total Environ. 2020, 738, 139794. [Google Scholar] [CrossRef]
  42. Washburn, S.J.; Blum, J.D.; Kurz, A.Y.; Pizzuto, J.E. Spatial and temporal variation in the isotopic composition of mercury in the South River, VA. Chem. Geol. 2018, 494, 96–108. [Google Scholar] [CrossRef]
  43. Gamby, R.L.; Hammerschmidt, C.R.; Costello, D.M.; Lamborg, C.H.; Runkle, J.R. Deforestation and cultivation mobilize mercury from topsoil. Sci. Total Environ. 2015, 532, 467–473. [Google Scholar] [CrossRef]
  44. Richardson, J.B.; Petrenko, C.L.; Friedland, A.J. Organic horizon and mineral soil mercury along three clear-cut forest chronosequences across the northeastern USA. Environ. Sci. Pollut. Res. 2017, 24, 27994–28005. [Google Scholar] [CrossRef]
  45. Gartner, J.D.; Magilligan, F.J.; Renshaw, C.E. Predicting the type, location and magnitude of geomorphic responses to dam removal: Role of hydrologic and geomorphic constraints. Geomorphology 2015, 251, 20–30. [Google Scholar] [CrossRef]
  46. Dow, S.; Snyder, N.P.; Ouimet, W.B.; Martini, A.M.; Yellen, B.; Woodruff, J.D.; Newton, R.M.; Merritts, D.J.; Walter, R.C. Estimating the timescale of fluvial response to anthropogenic disturbance using two generations of dams on the South River, Massachusetts, USA. Earth Surf. Process. Landf. 2020, 45, 2380–2393. [Google Scholar] [CrossRef]
  47. Guédron, S.; Amouroux, D.; Tessier, E.; Grimaldi, C.; Barre, J.; Berail, S.; Perrot, V.; Grimaldi, M. Mercury isotopic fractionation during pedogenesis in a tropical forest soil catena (French Guiana): Deciphering the impact of historical gold mining. Environ. Sci. Technol. 2018, 52, 11573–11582. [Google Scholar] [CrossRef]
  48. Hoffmann, T.O.; Baulig, Y.; Fischer, H.; Blöthe, J. Scale breaks of suspended sediment rating in large rivers in Germany induced by organic matter. Earth Surf. Dyn. 2020, 8, 661–678. [Google Scholar] [CrossRef]
  49. Wang, T.; Obrist, D. Inorganic and methylated mercury dynamics in estuarine water of a salt marsh estuary in Massachusetts, USA. Environ. Pollut. 2021, 294, 118657. [Google Scholar] [CrossRef] [PubMed]
  50. Evers, D.C.; Han, Y.J.; Driscoll, C.T.; Kamman, N.C.; Goodale, M.W.; Lambert, K.F.; Holsen, T.M.; Chen, C.Y.; Clair, T.A.; Butler, T. Biological mercury hotspots in the northeastern United States and southeastern Canada. BioScience 2007, 57, 29–43. [Google Scholar] [CrossRef]
  51. Rhoton, F.E.; Bennett, S.J. Soil and sediment properties affecting the accumulation of mercury in a flood control reservoir. Catena 2009, 79, 39–48. [Google Scholar] [CrossRef]
  52. Pizzuto, J.E. Long-term storage and transport length scale of fine sediment: Analysis of a mercury release into a river. Geophys. Res. Lett. 2014, 41, 5875–5882. [Google Scholar] [CrossRef]
Figure 1. Map of elevation (m.a.s.l), watershed boundaries (Connecticut River, Merrimack River, and Thames River), forest soil sampling locations in black triangles and grey circles, and river water sampling locations in white four-point stars. Suspended sediment traps were deployed at the water sampling locations.
Pollutants 02 00017 g001
Figure 2. Median soil Hg concentrations in upland and riparian forest soils with National Land Cover Database 2016 data [24] displayed. Low Hg concentrations (20 to 100 ng g−1) approximately follow most commonly observed concentrations, moderate Hg concentrations (100 to 300 ng g−1) reflect moderate enrichment such as higher than normal atmospheric deposition rates, and elevated Hg concentrations (>300 ng g−1) are levels associated with point source pollution.
Pollutants 02 00017 g002
Figure 3. Soil Hg concentration profiles in upland forest and riparian forest soils across the Connecticut, Merrimack, and Thames River watersheds. (*) indicates a significant difference between rural and developed forest soil Hg concentrations (p < 0.05).
Pollutants 02 00017 g003
Figure 4. Comparison of soil properties with Hg concentration across the three watersheds. (A) Linear regression of %SOM and Hg concentrations in riparian soils, which were significant (p < 0.01). (B) Linear regression of Fe concentrations with Hg concentrations, which were not significant. (C) Linear regression of %SOM and Hg concentrations in upland soils, which were significant (p < 0.01). (D) Exponential regression of Fe concentrations with Hg concentrations, which was not significant (Linear regression was not significant either p > 0.10).
Pollutants 02 00017 g004
Figure 5. Discharge of water, sediment, and Hg from the three watersheds. (A) Mean daily river flow rates for the Merrimack (USGS station 110000), Connecticut River (USGS Station 1193050), and Thames River (Quinebaug station 1127000, Shetucket station 11230695, Yantic station 1127500) from United States Geological Survey data at waterdata.usgs.gov. (B) shows bottle suspended sediment masses (>0.45 µm) in the 1-L water samples collected. (C) displays Hg concentrations of trapped suspended sediments (>0.45 µm). (D) shows monthly Hg exports across the three watersheds based upon total monthly river water discharge amounts, bottle suspended sediment masses, and trapped suspended sediment Hg concentrations.
Pollutants 02 00017 g005
Figure 6. Relationship between Hg concentrations with their respective %OM and Fe concentrations in Suspended sediments. (A) shows a significant correlation between %OM and Hg concentrations and (B) shows a significant correlation between Fe concentrations and Hg concentrations in suspended sediments.
Pollutants 02 00017 g006
Table 1. Watershed area, urban area, forest area, and wetland area for the Connecticut, Merrimack, and Thames Rivers according to National Land Cover Database [24] land-use data. Urban areas include open space, low, medium, and high intensity development.
WatershedWatershed AreaUrban AreaForested AreaWetland Area
km2km2%km2%km2%
Connecticut29,20028131021,5627417216
Merrimack12,97521421782436410768
Thames3817433112512661212
Publisher’s Note: MDPI stays neutral with regard to jurisdictional claims in published maps and institutional affiliations.

