
Indoor CO2 and Thermal Conditions in Twenty Scottish Primary School Classrooms with Different Ventilation Systems during the COVID-19 Pandemic


Abstract
:1. Introduction
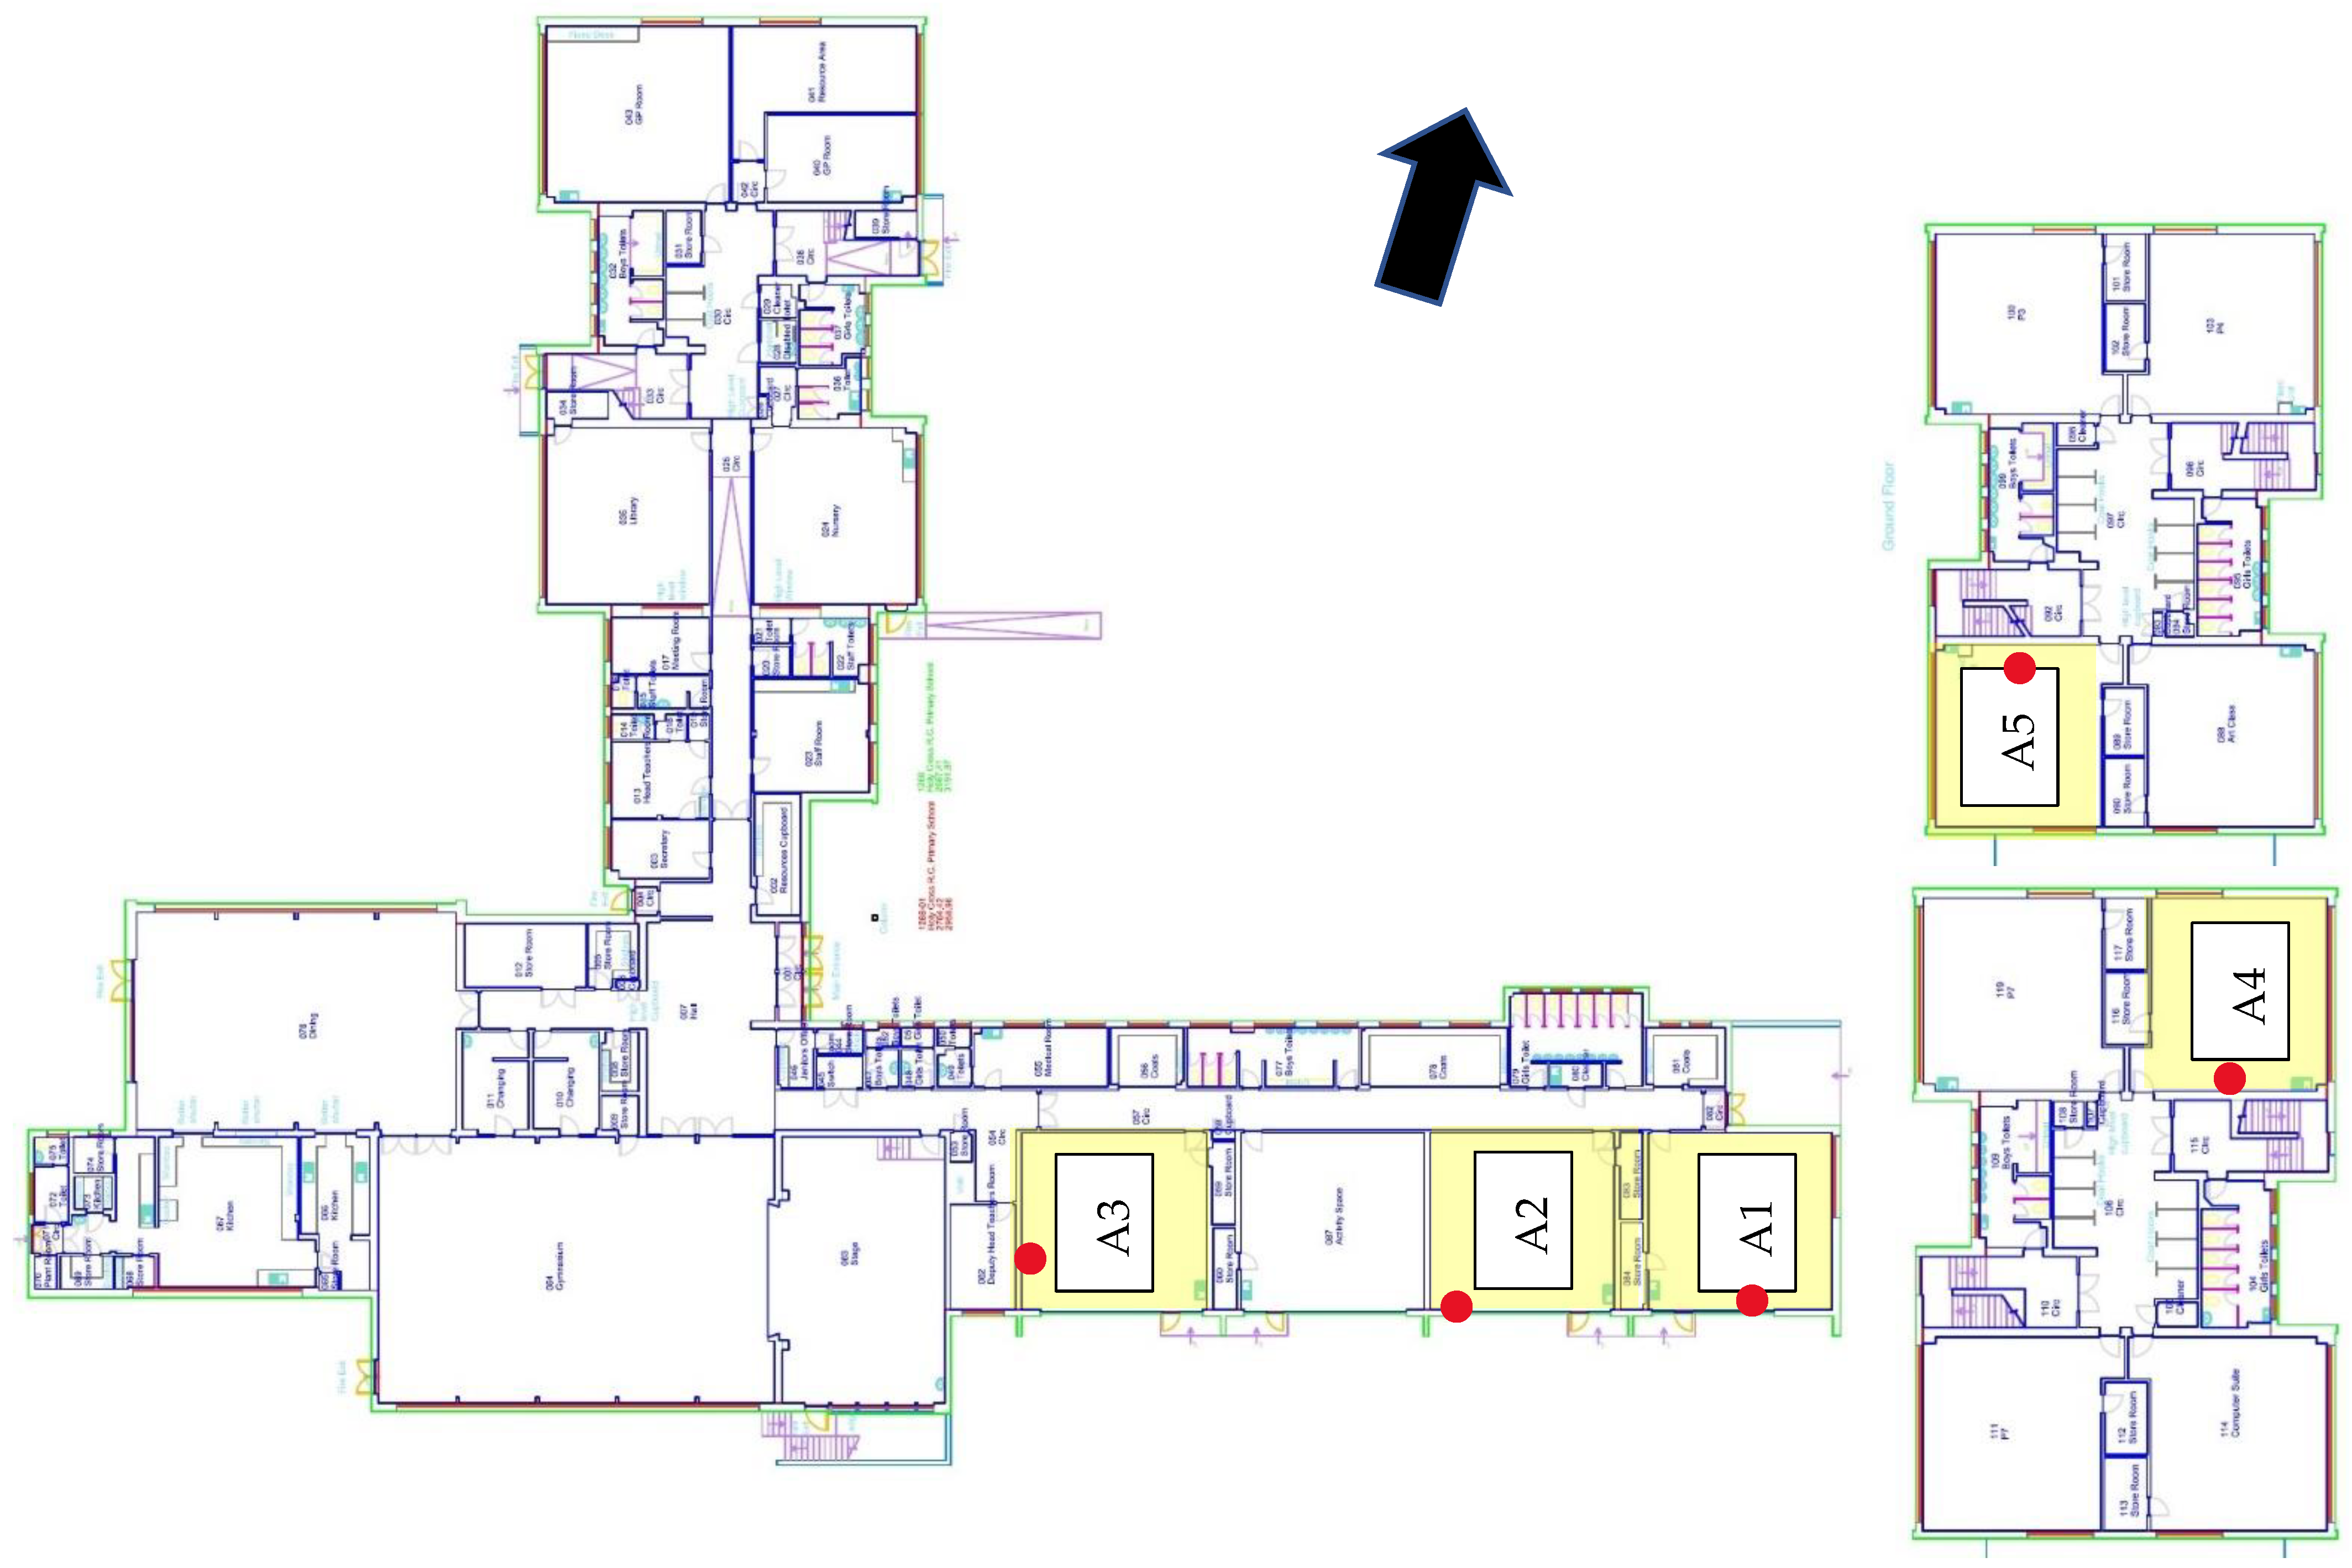
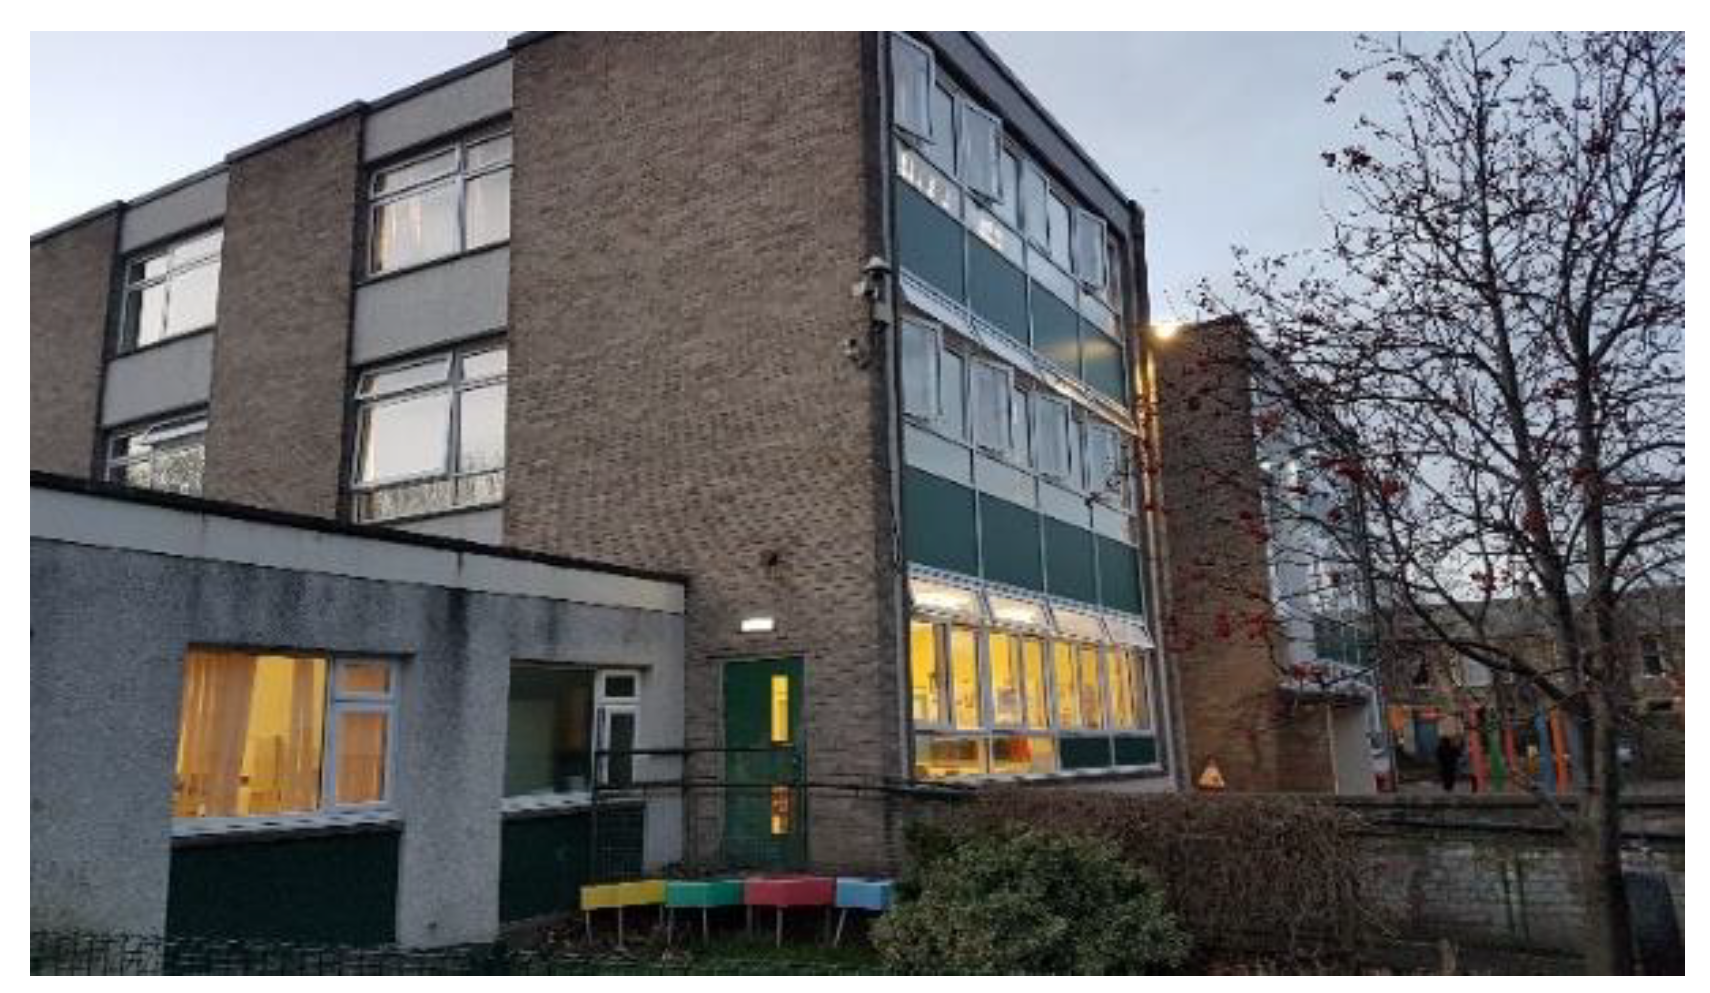
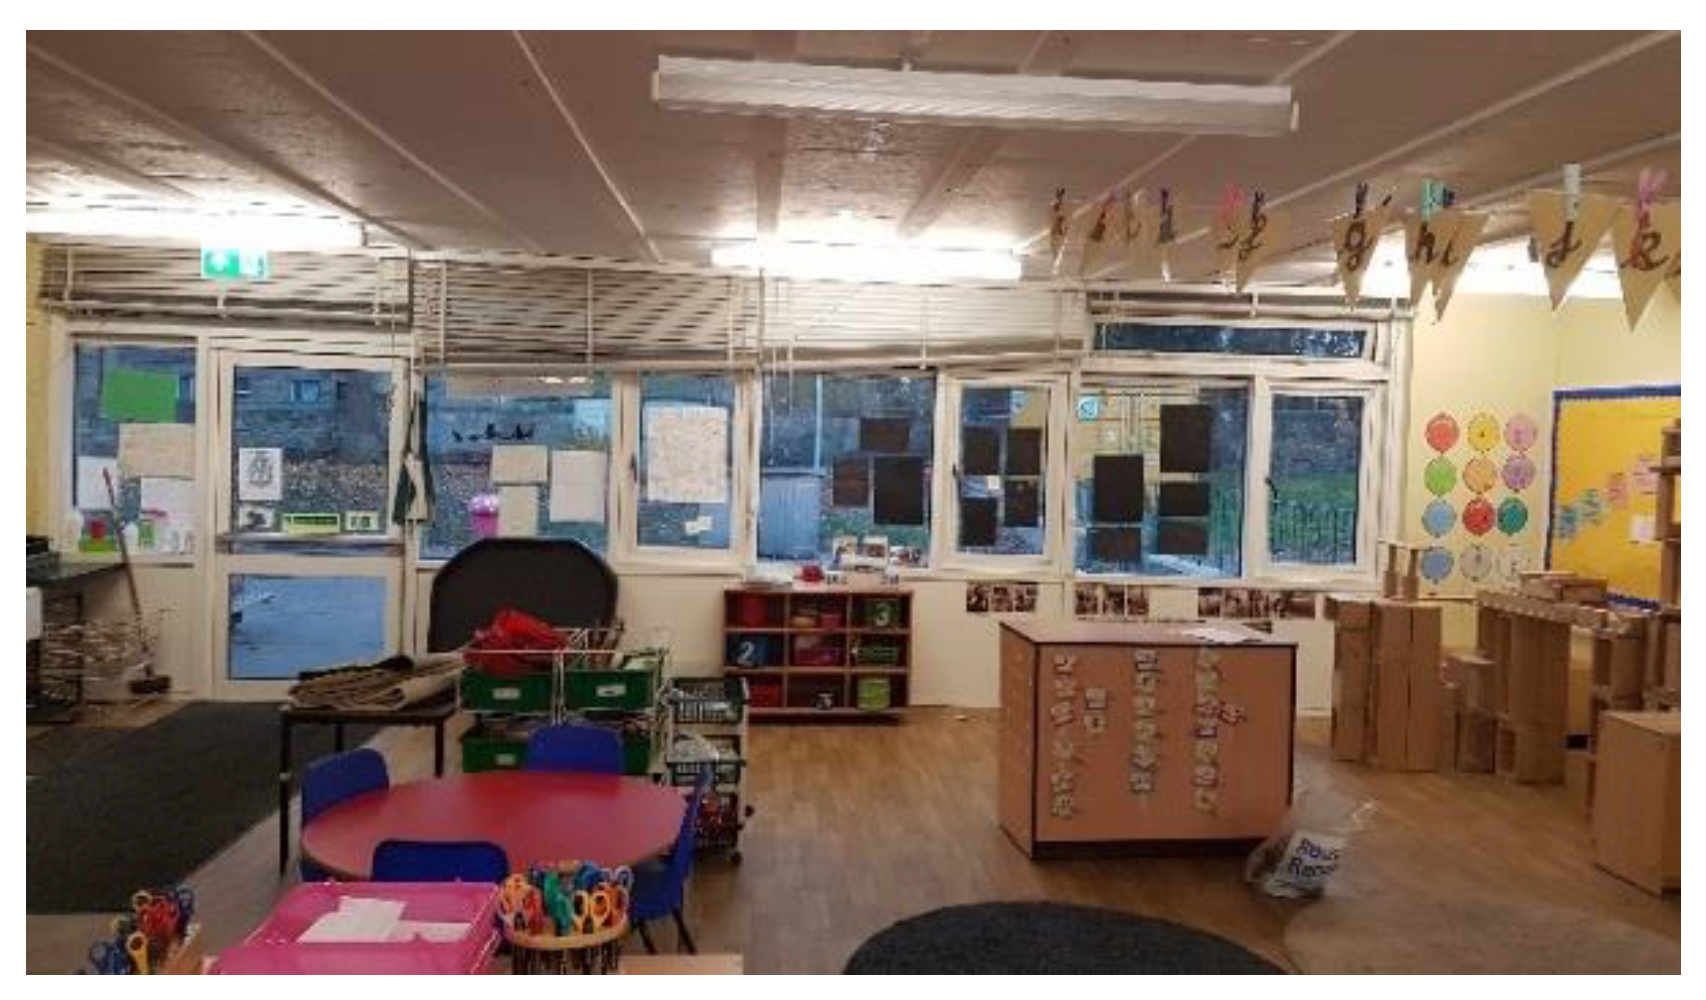
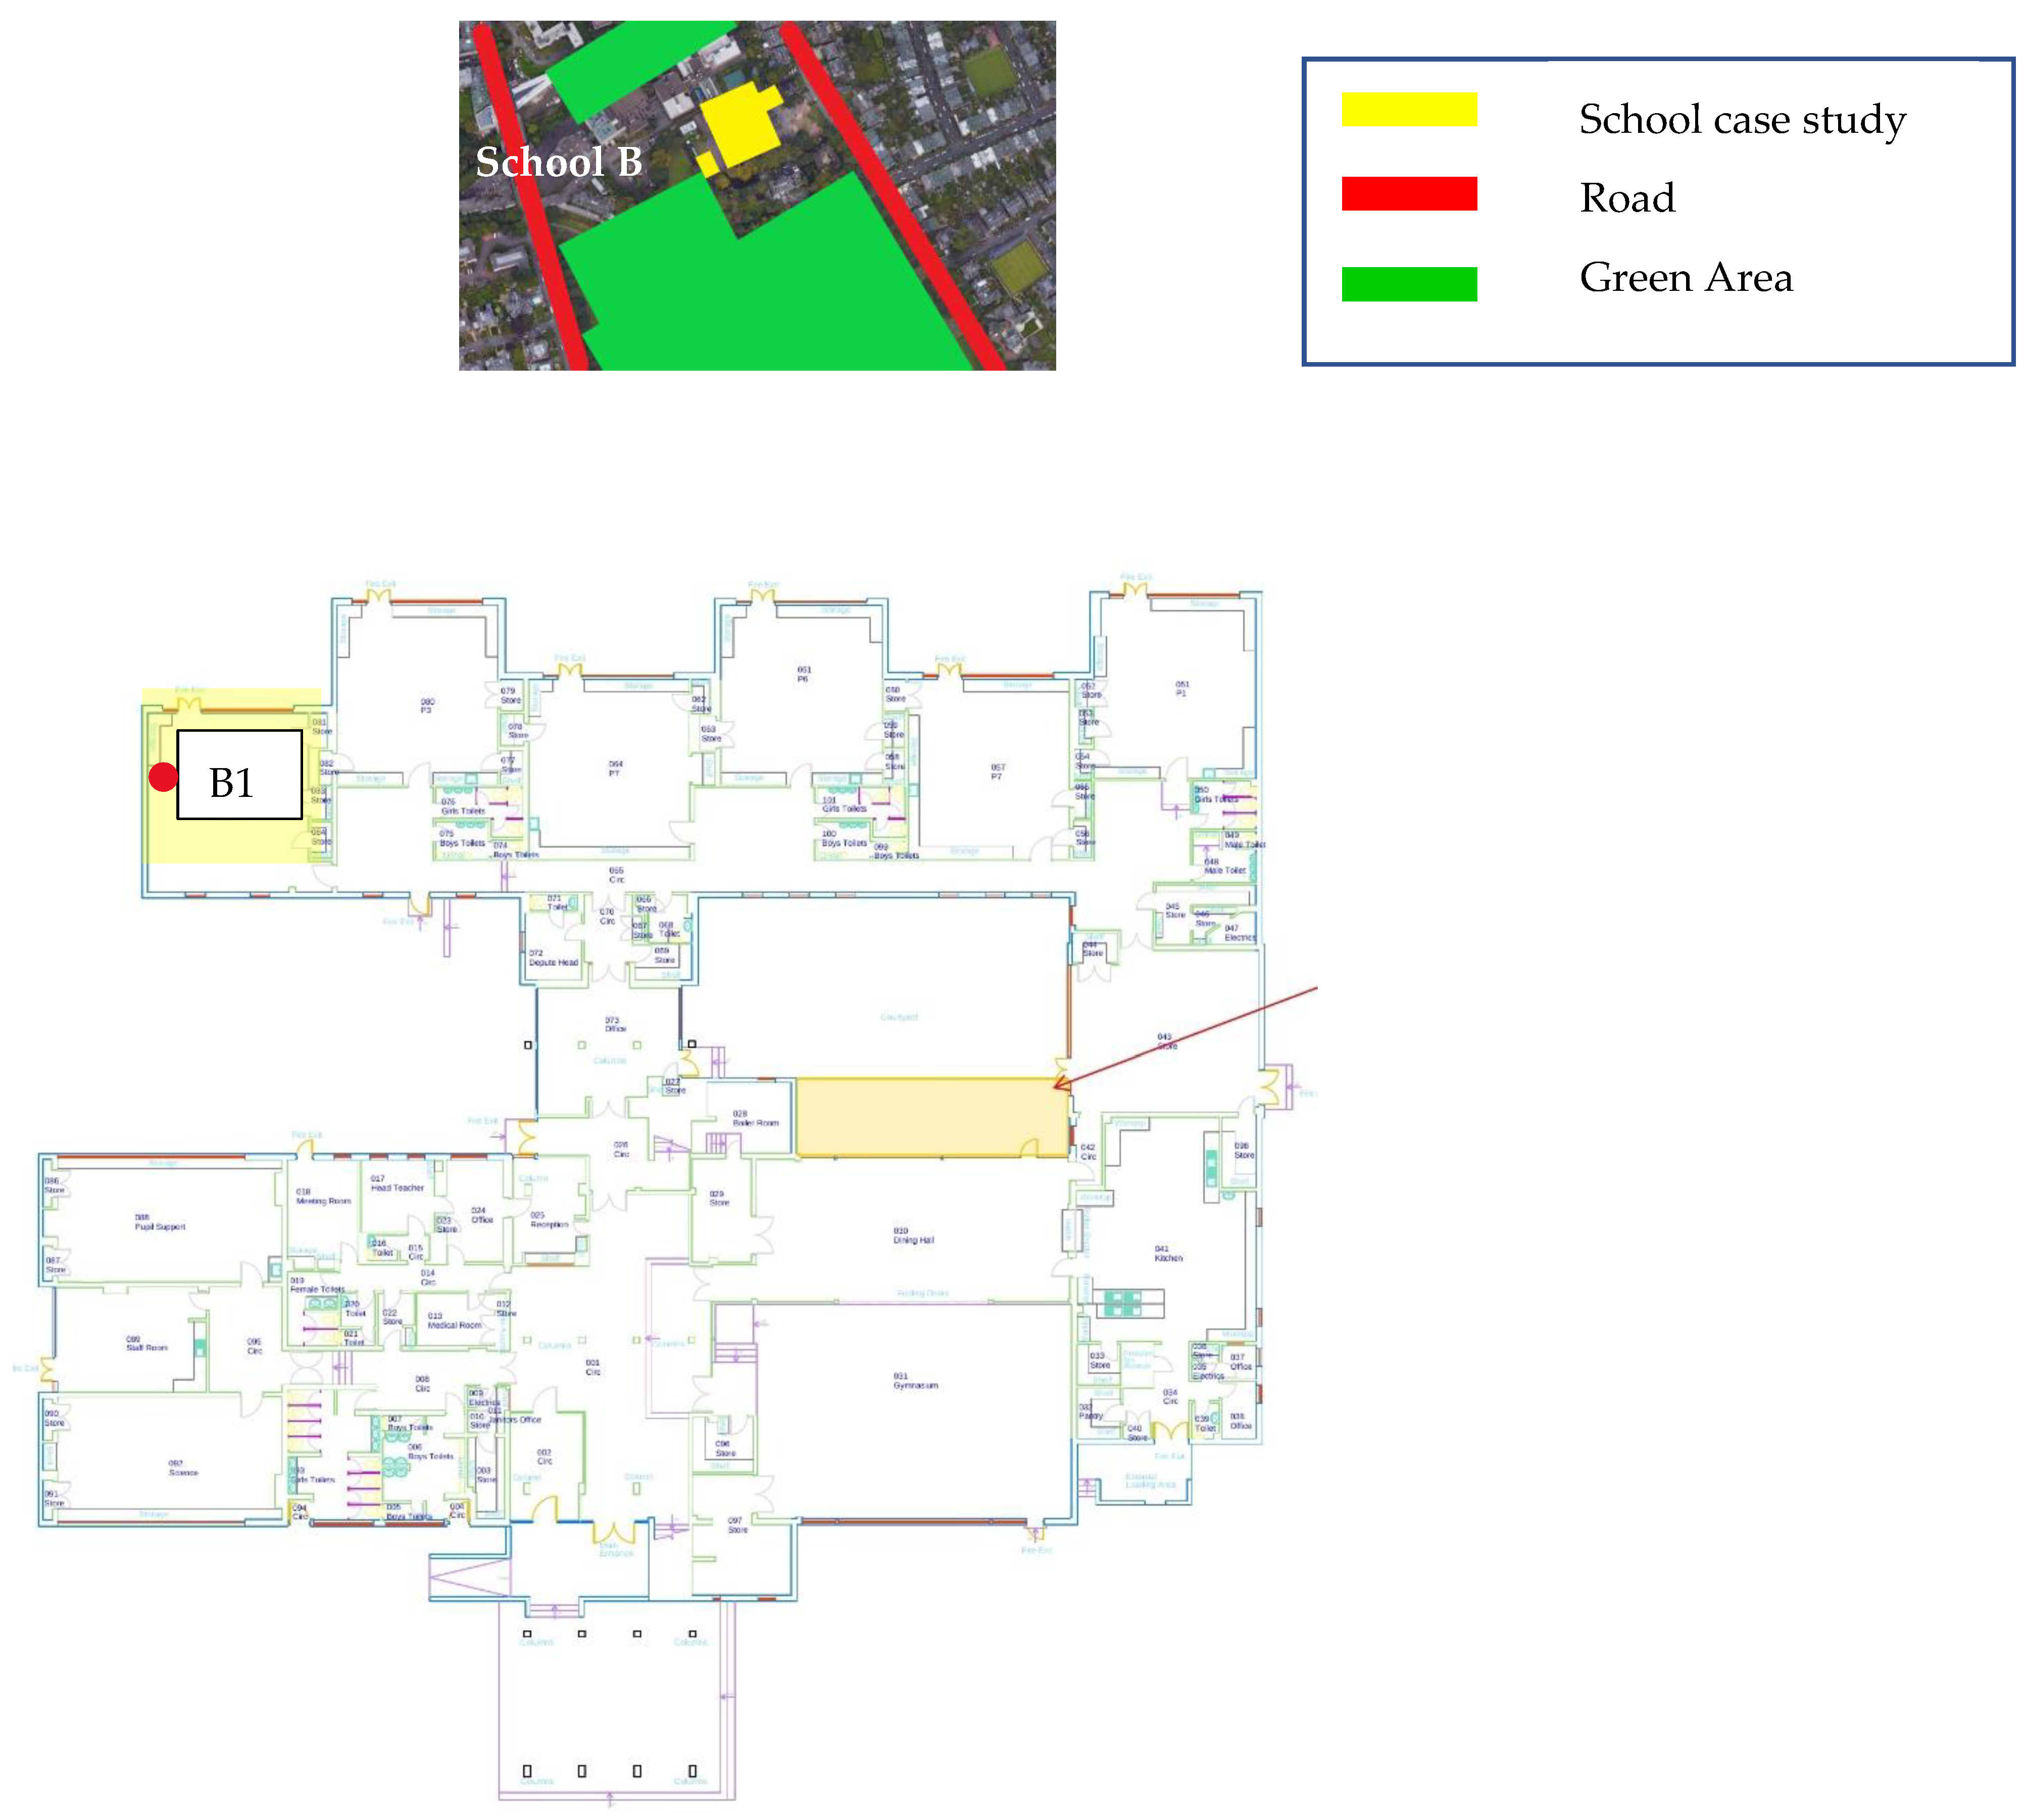
2. Materials and Methods
3. Results
3.1. Link between Outdoor and Indoor Climate (Temperature and RH)
3.2. Indoor Climate (Temperature and RH)
3.2.1. Indoor Temperature
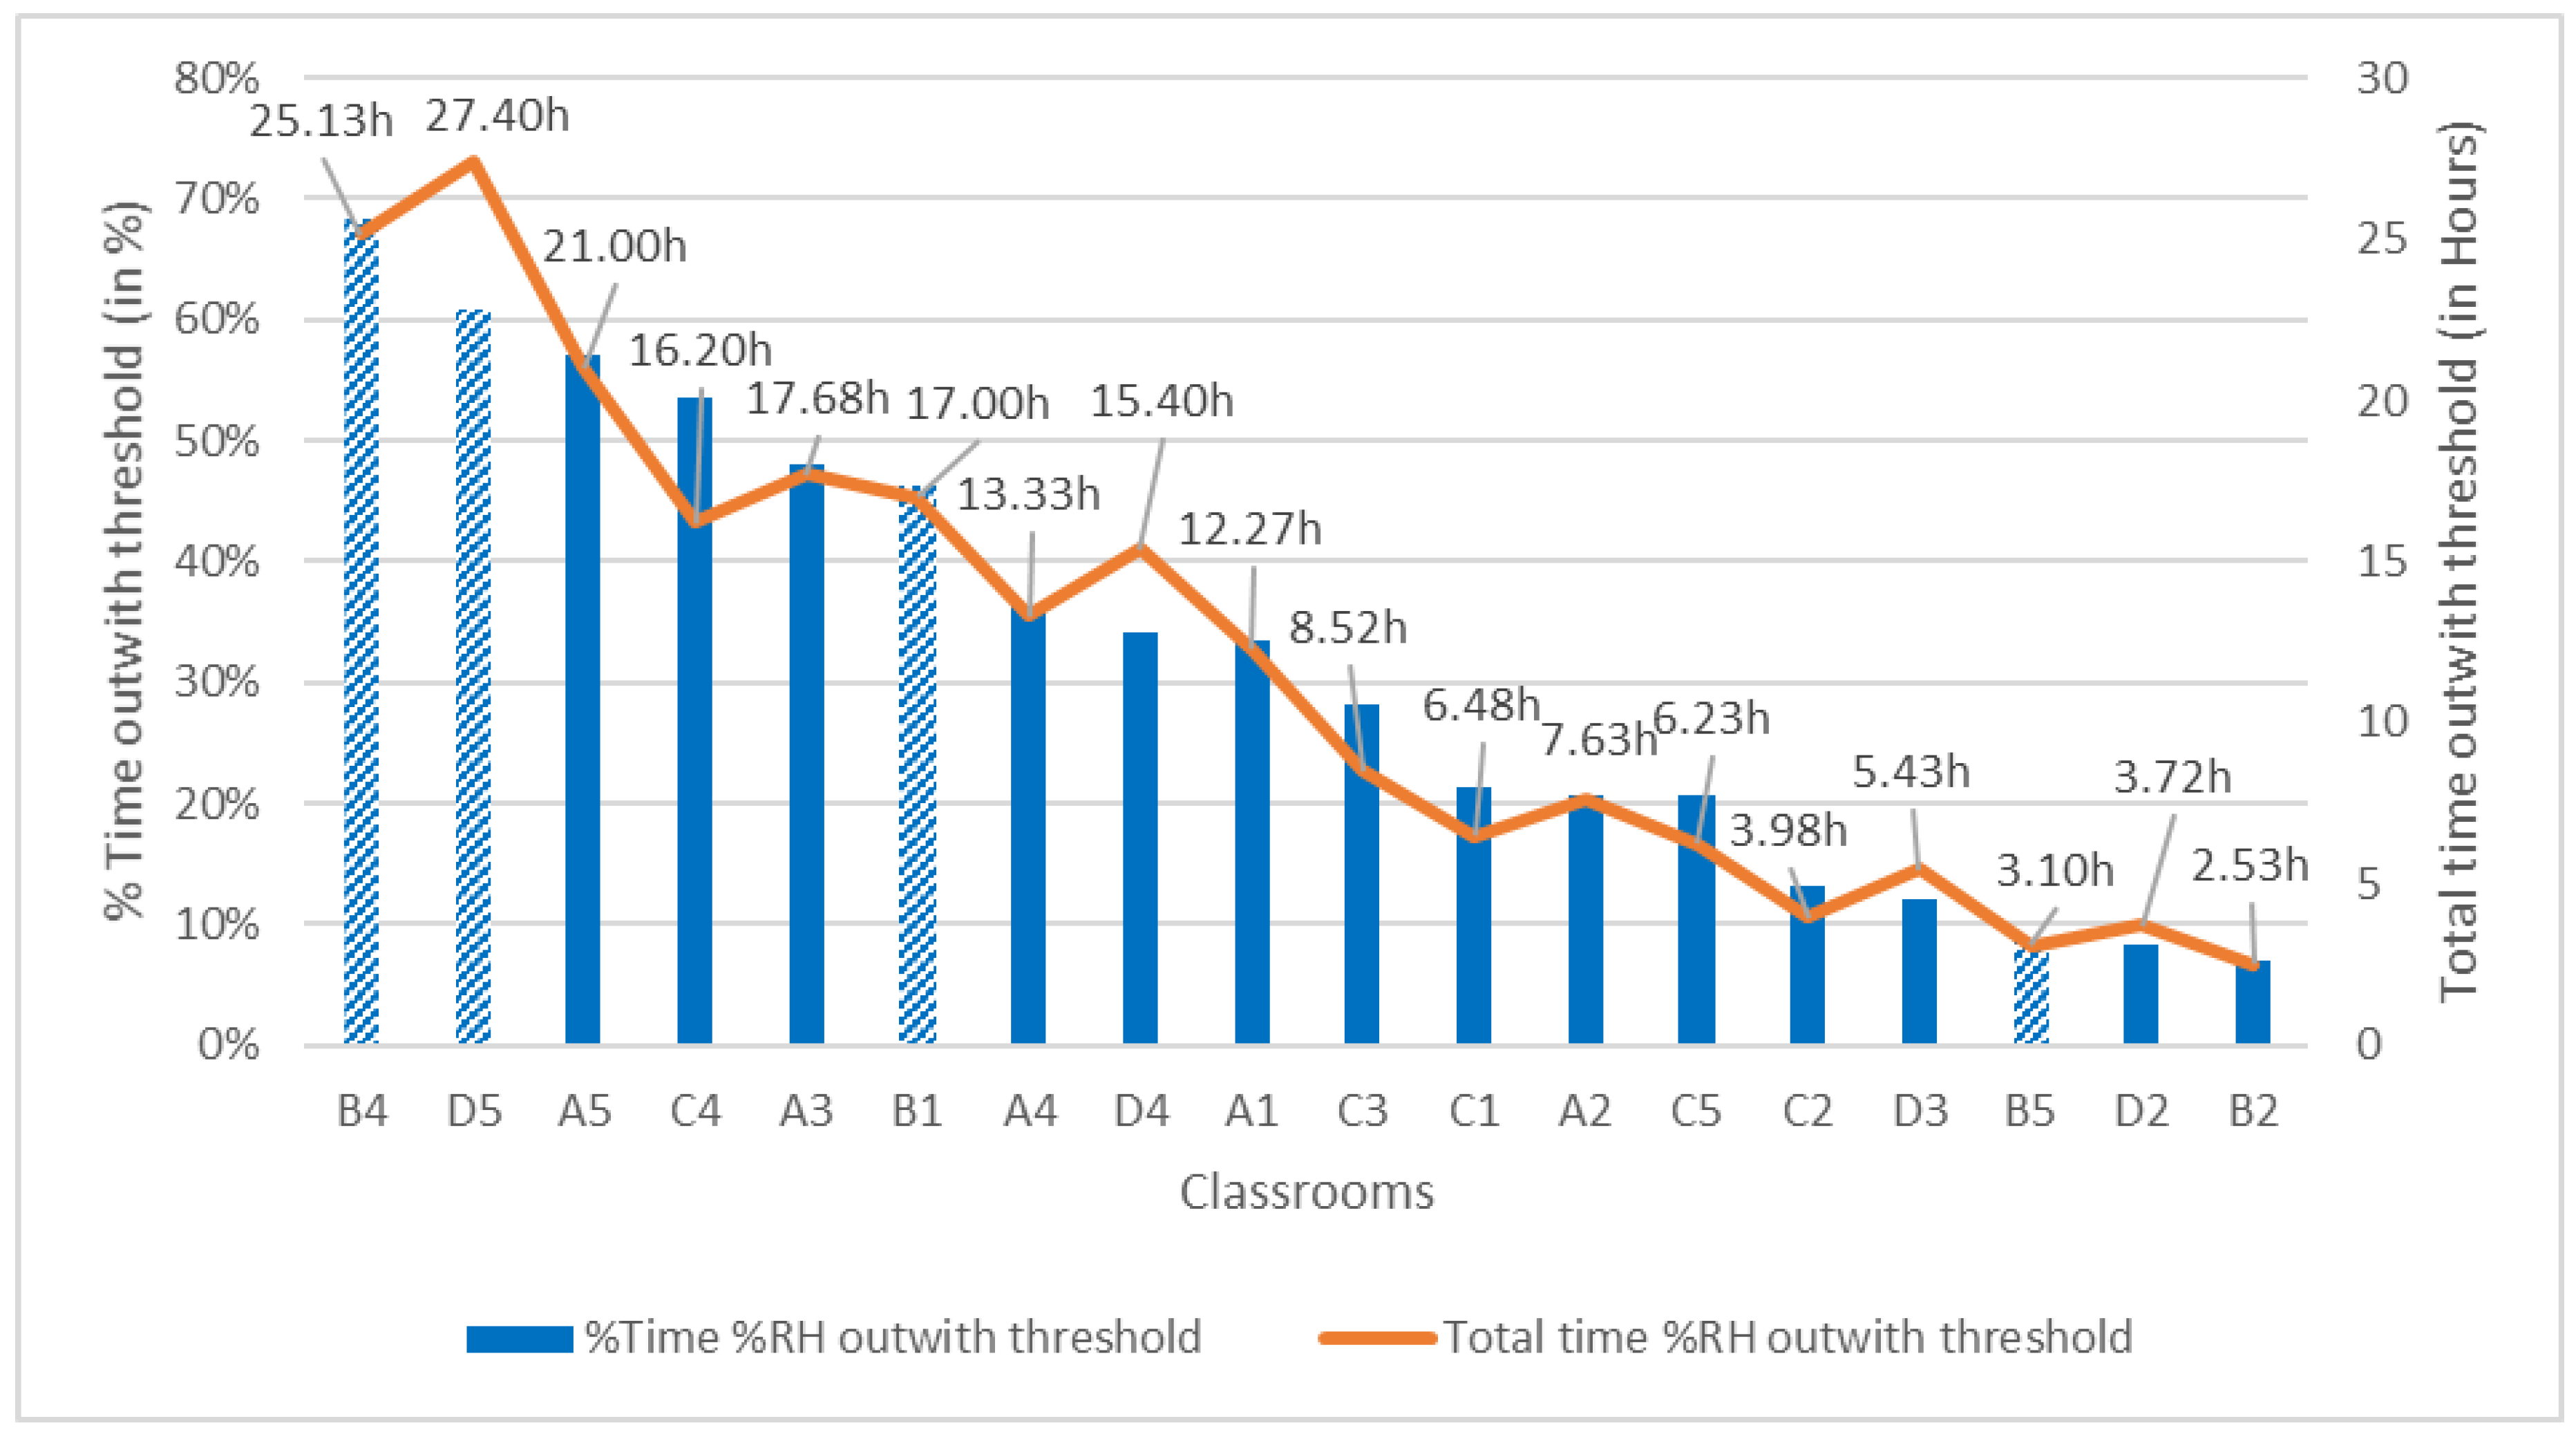
3.2.2. Indoor RH
3.3. CO2 Concentration and Ventilation Rates
3.3.1. Carbon Dioxide Concentration
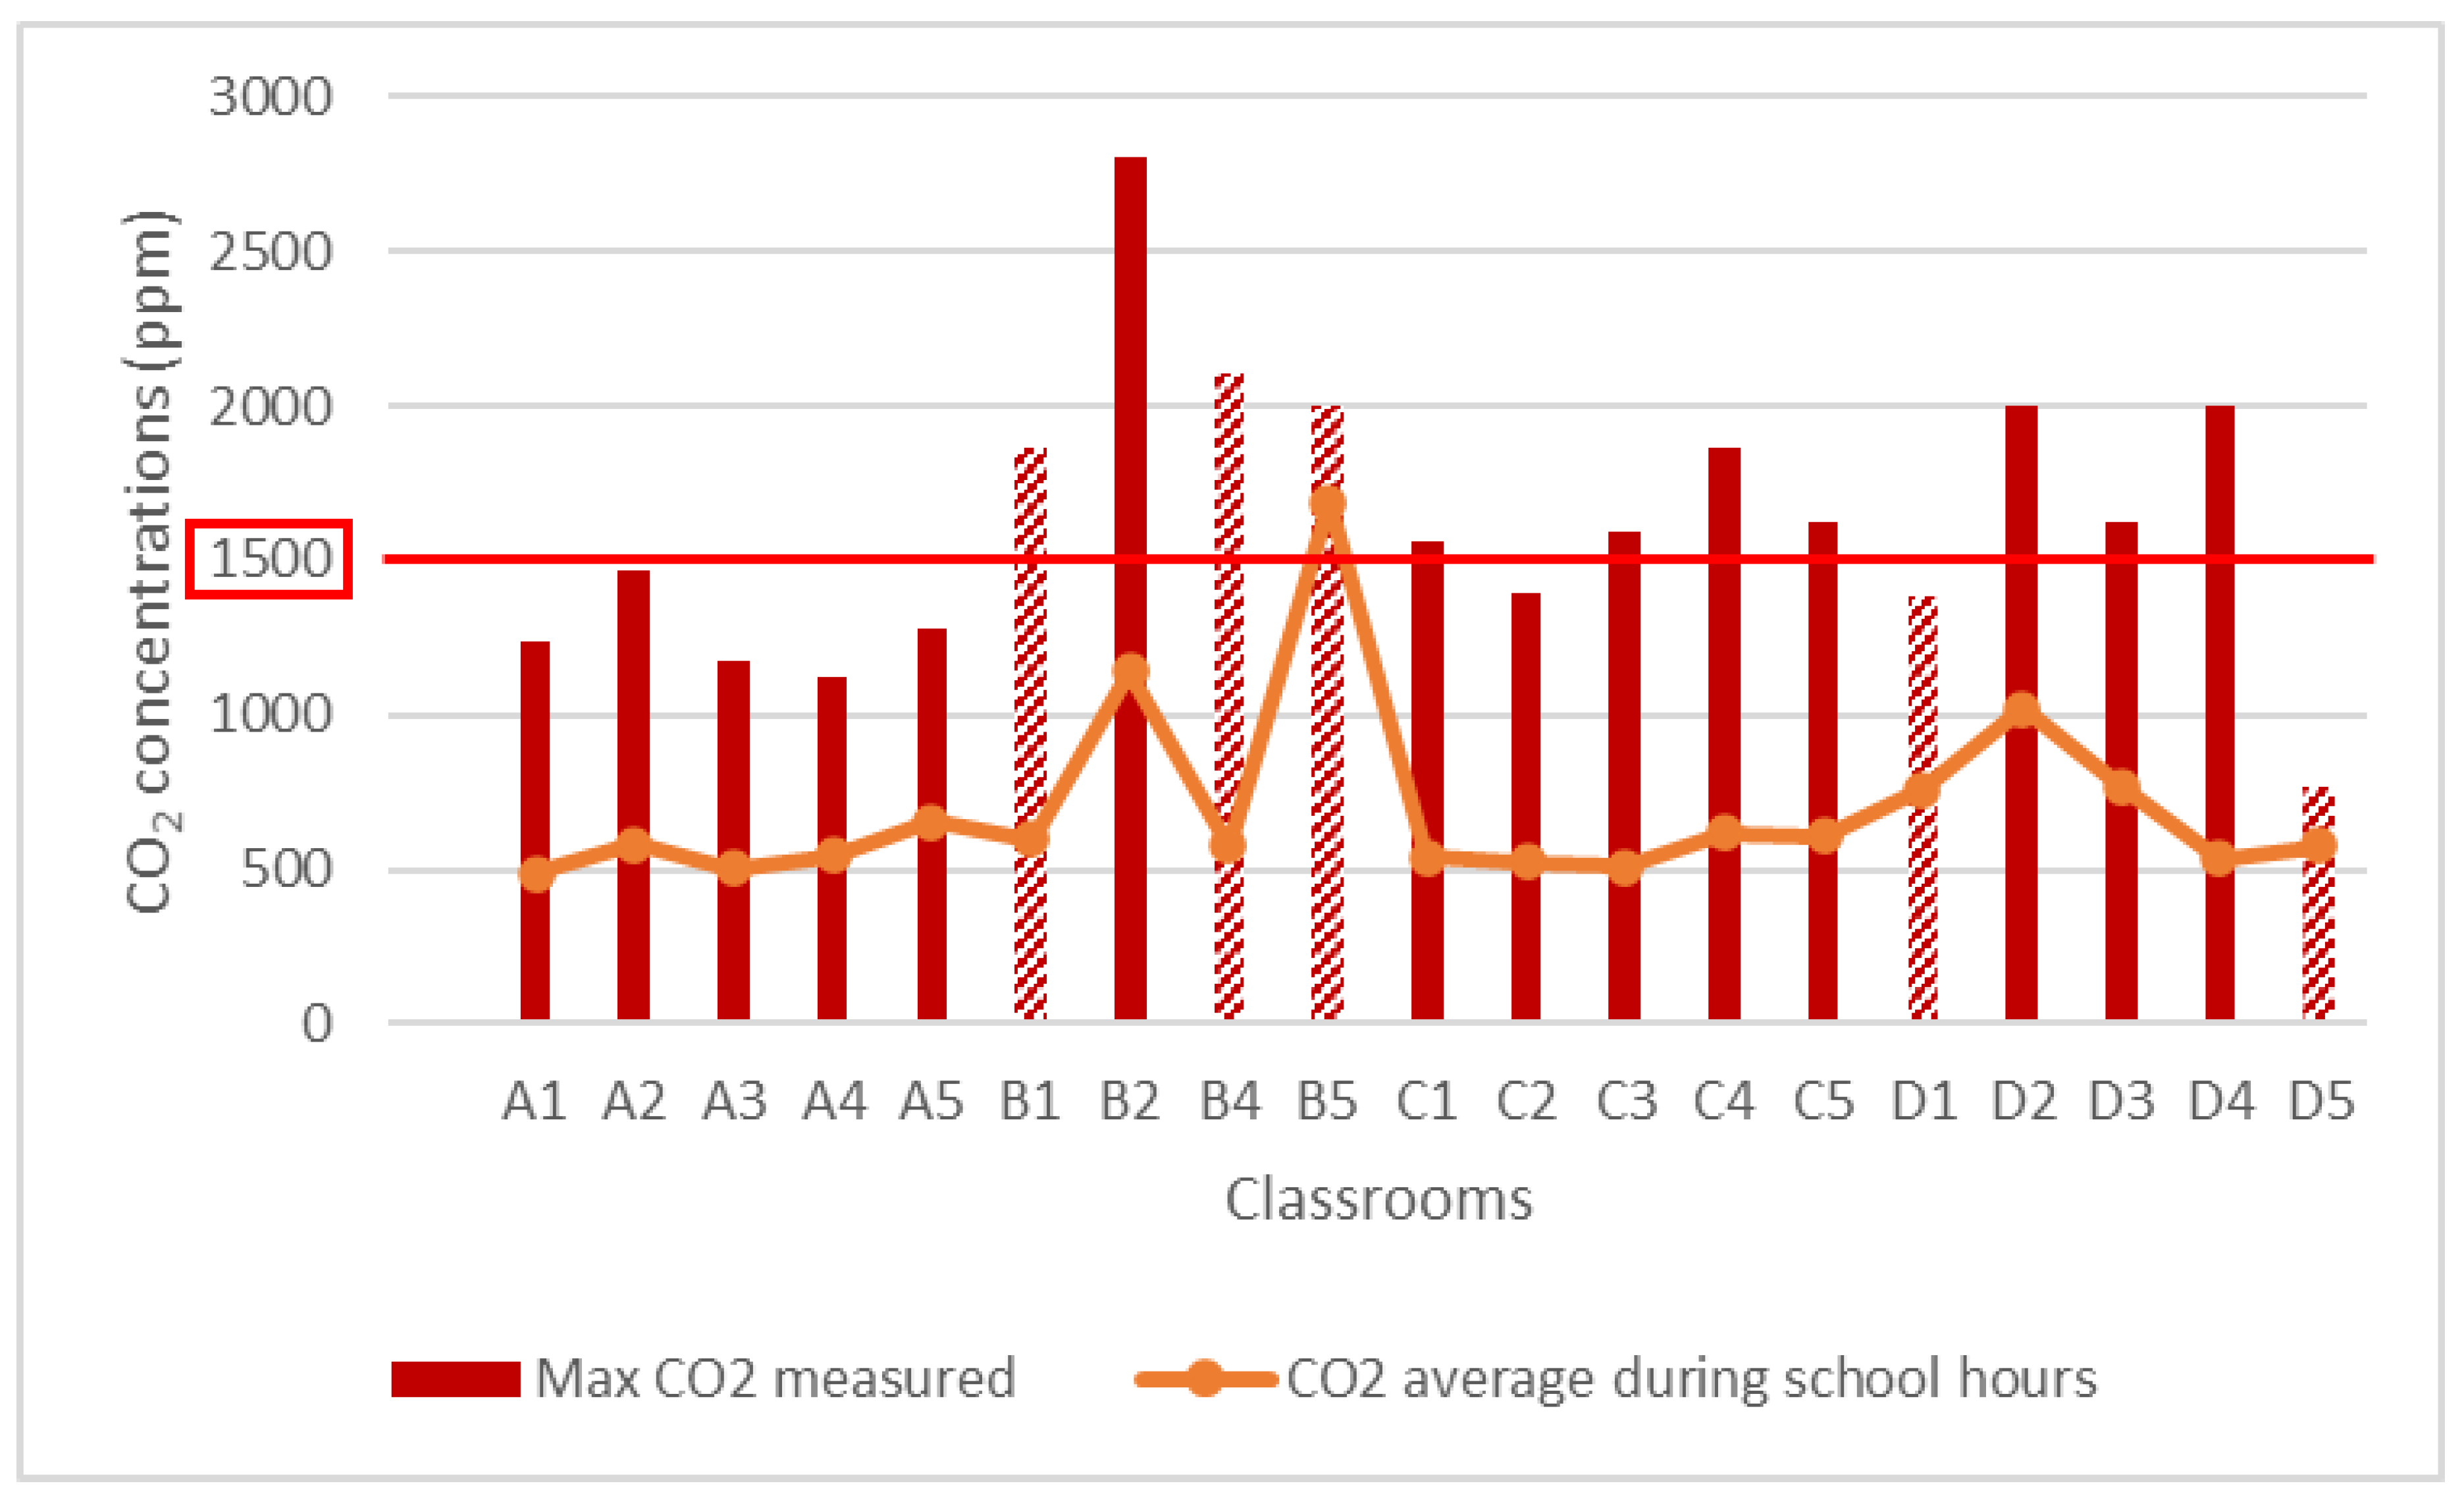
Maximum CO2 Levels and % of Time above Threshold
- –
- All the rooms at school B were between 1863 and 2810 ppm;
- –
- Almost all the classrooms at school C (except room C2) were from 1560 to 1862 ppm;
- –
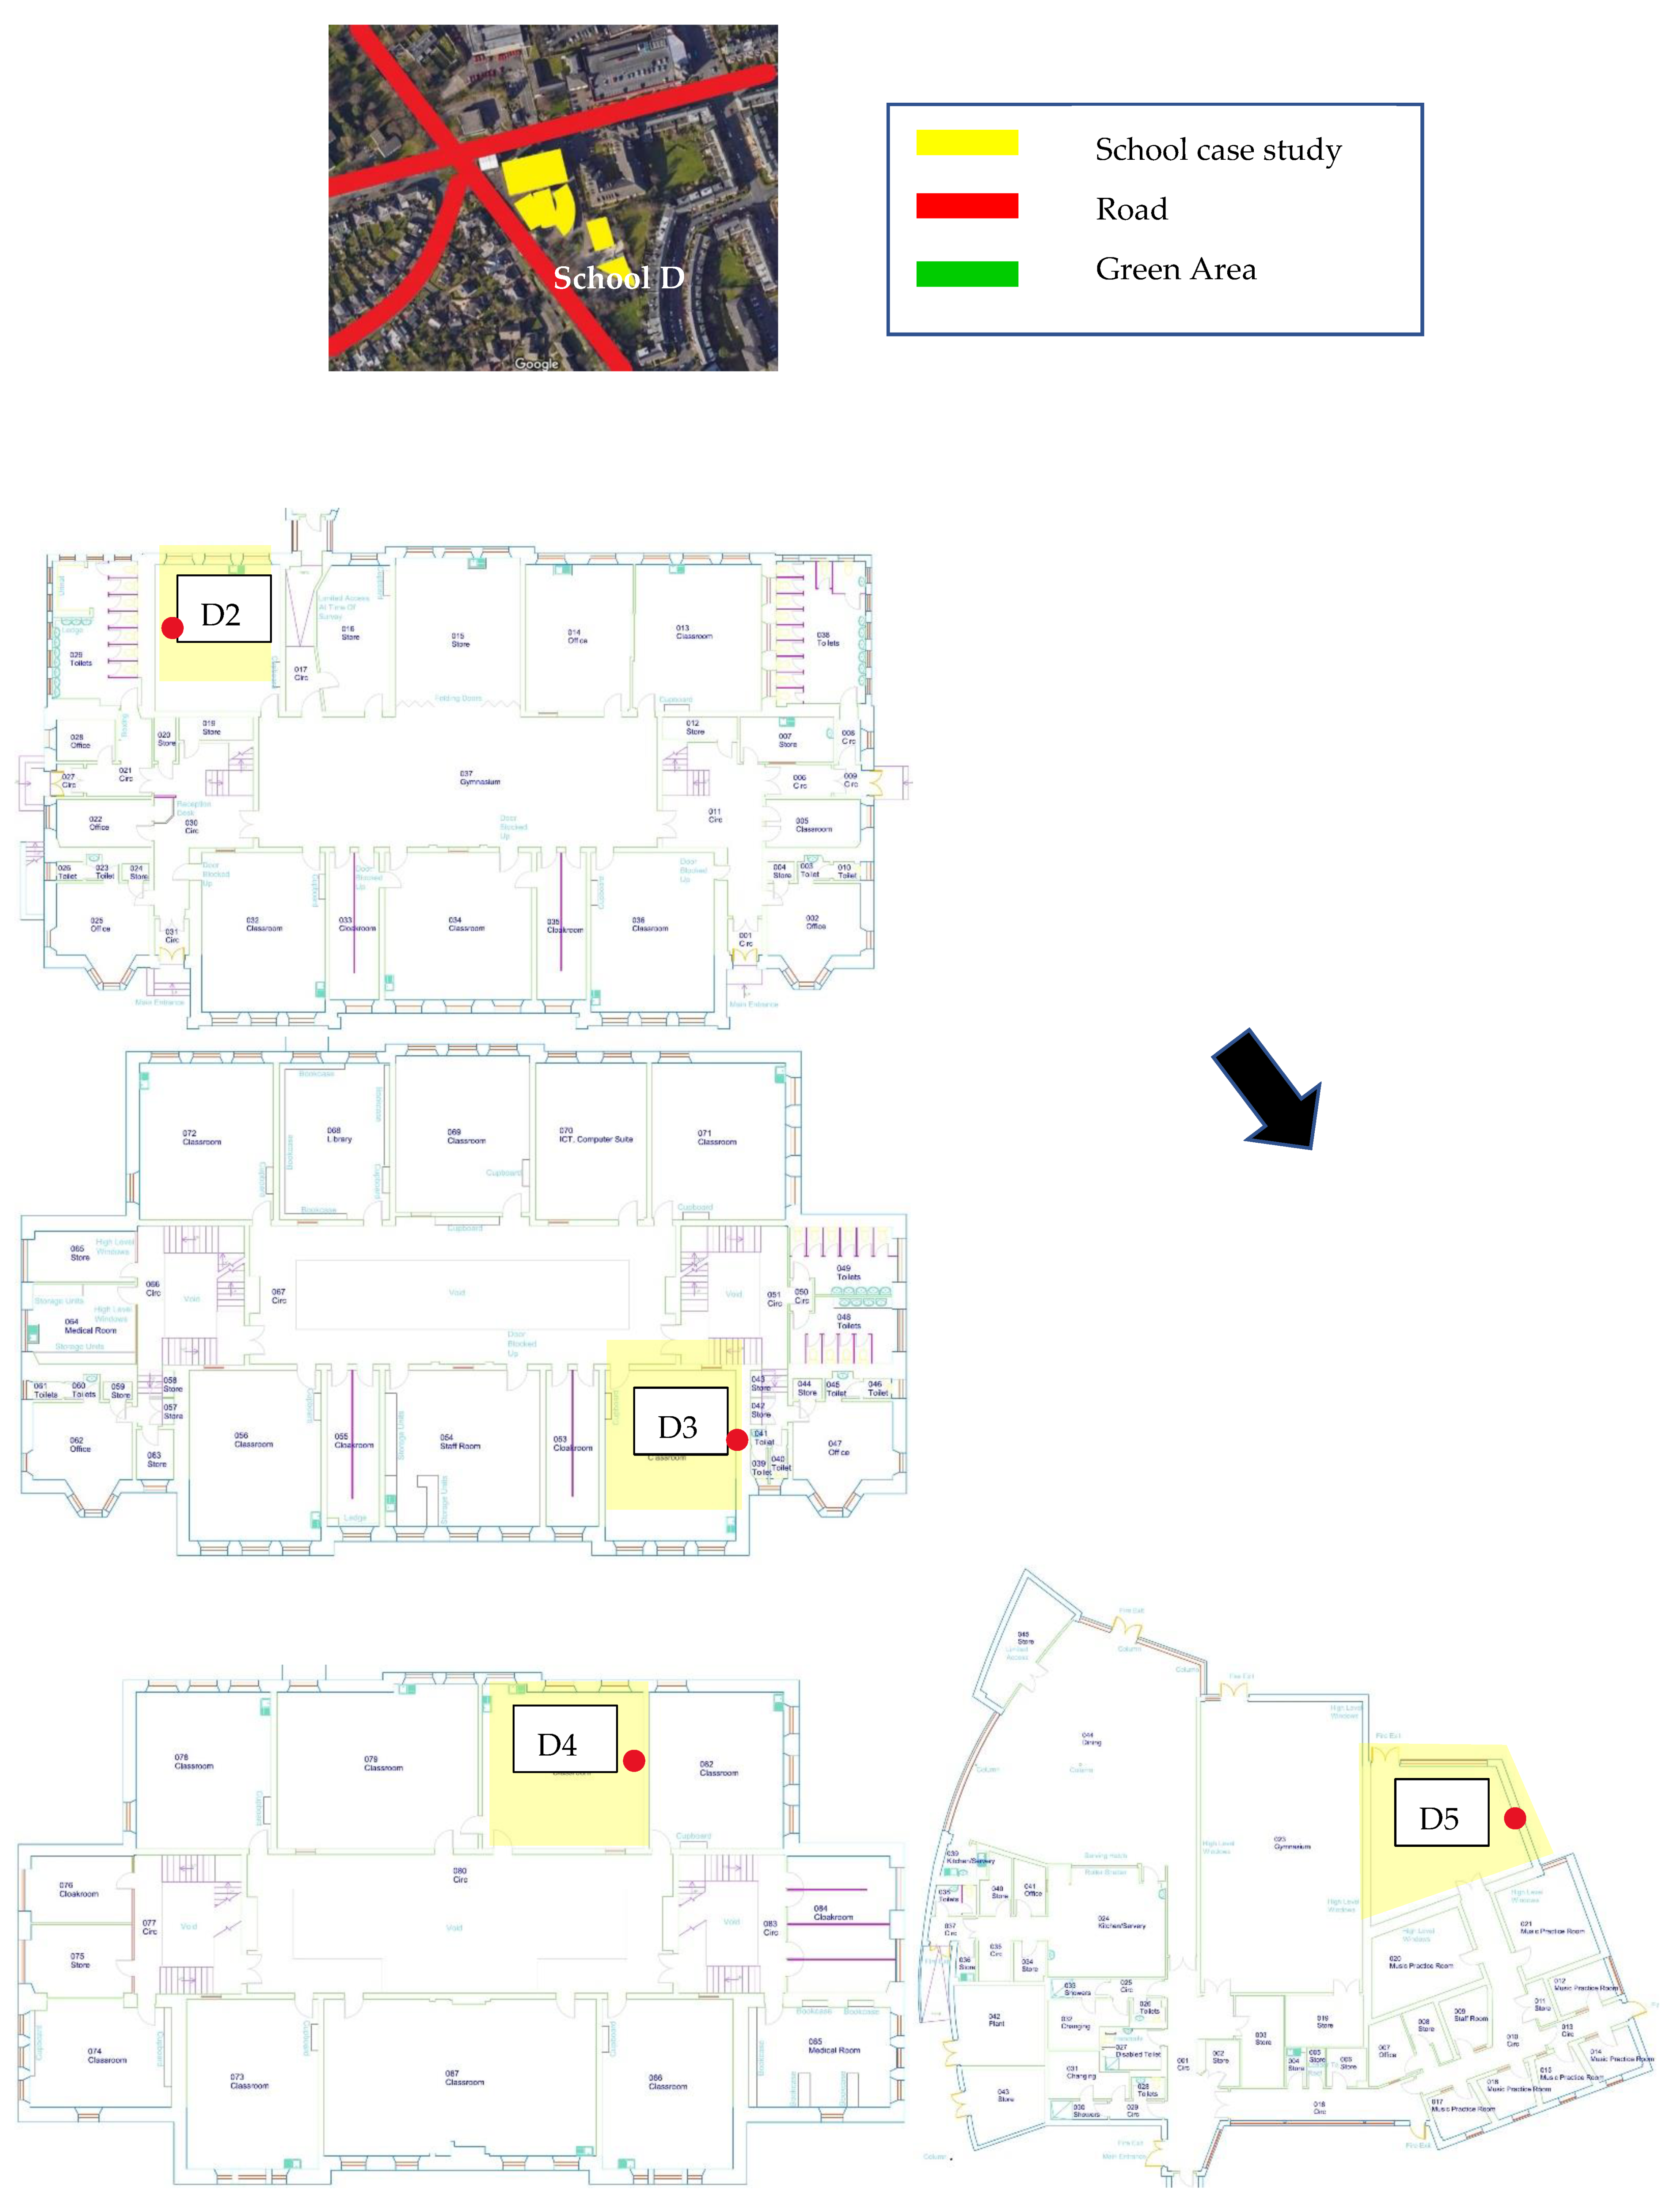
- At school D, classrooms D2 (2001 ppm), D3 (1620 ppm) and D4 (1999 ppm) exceeded threshold values.
- –
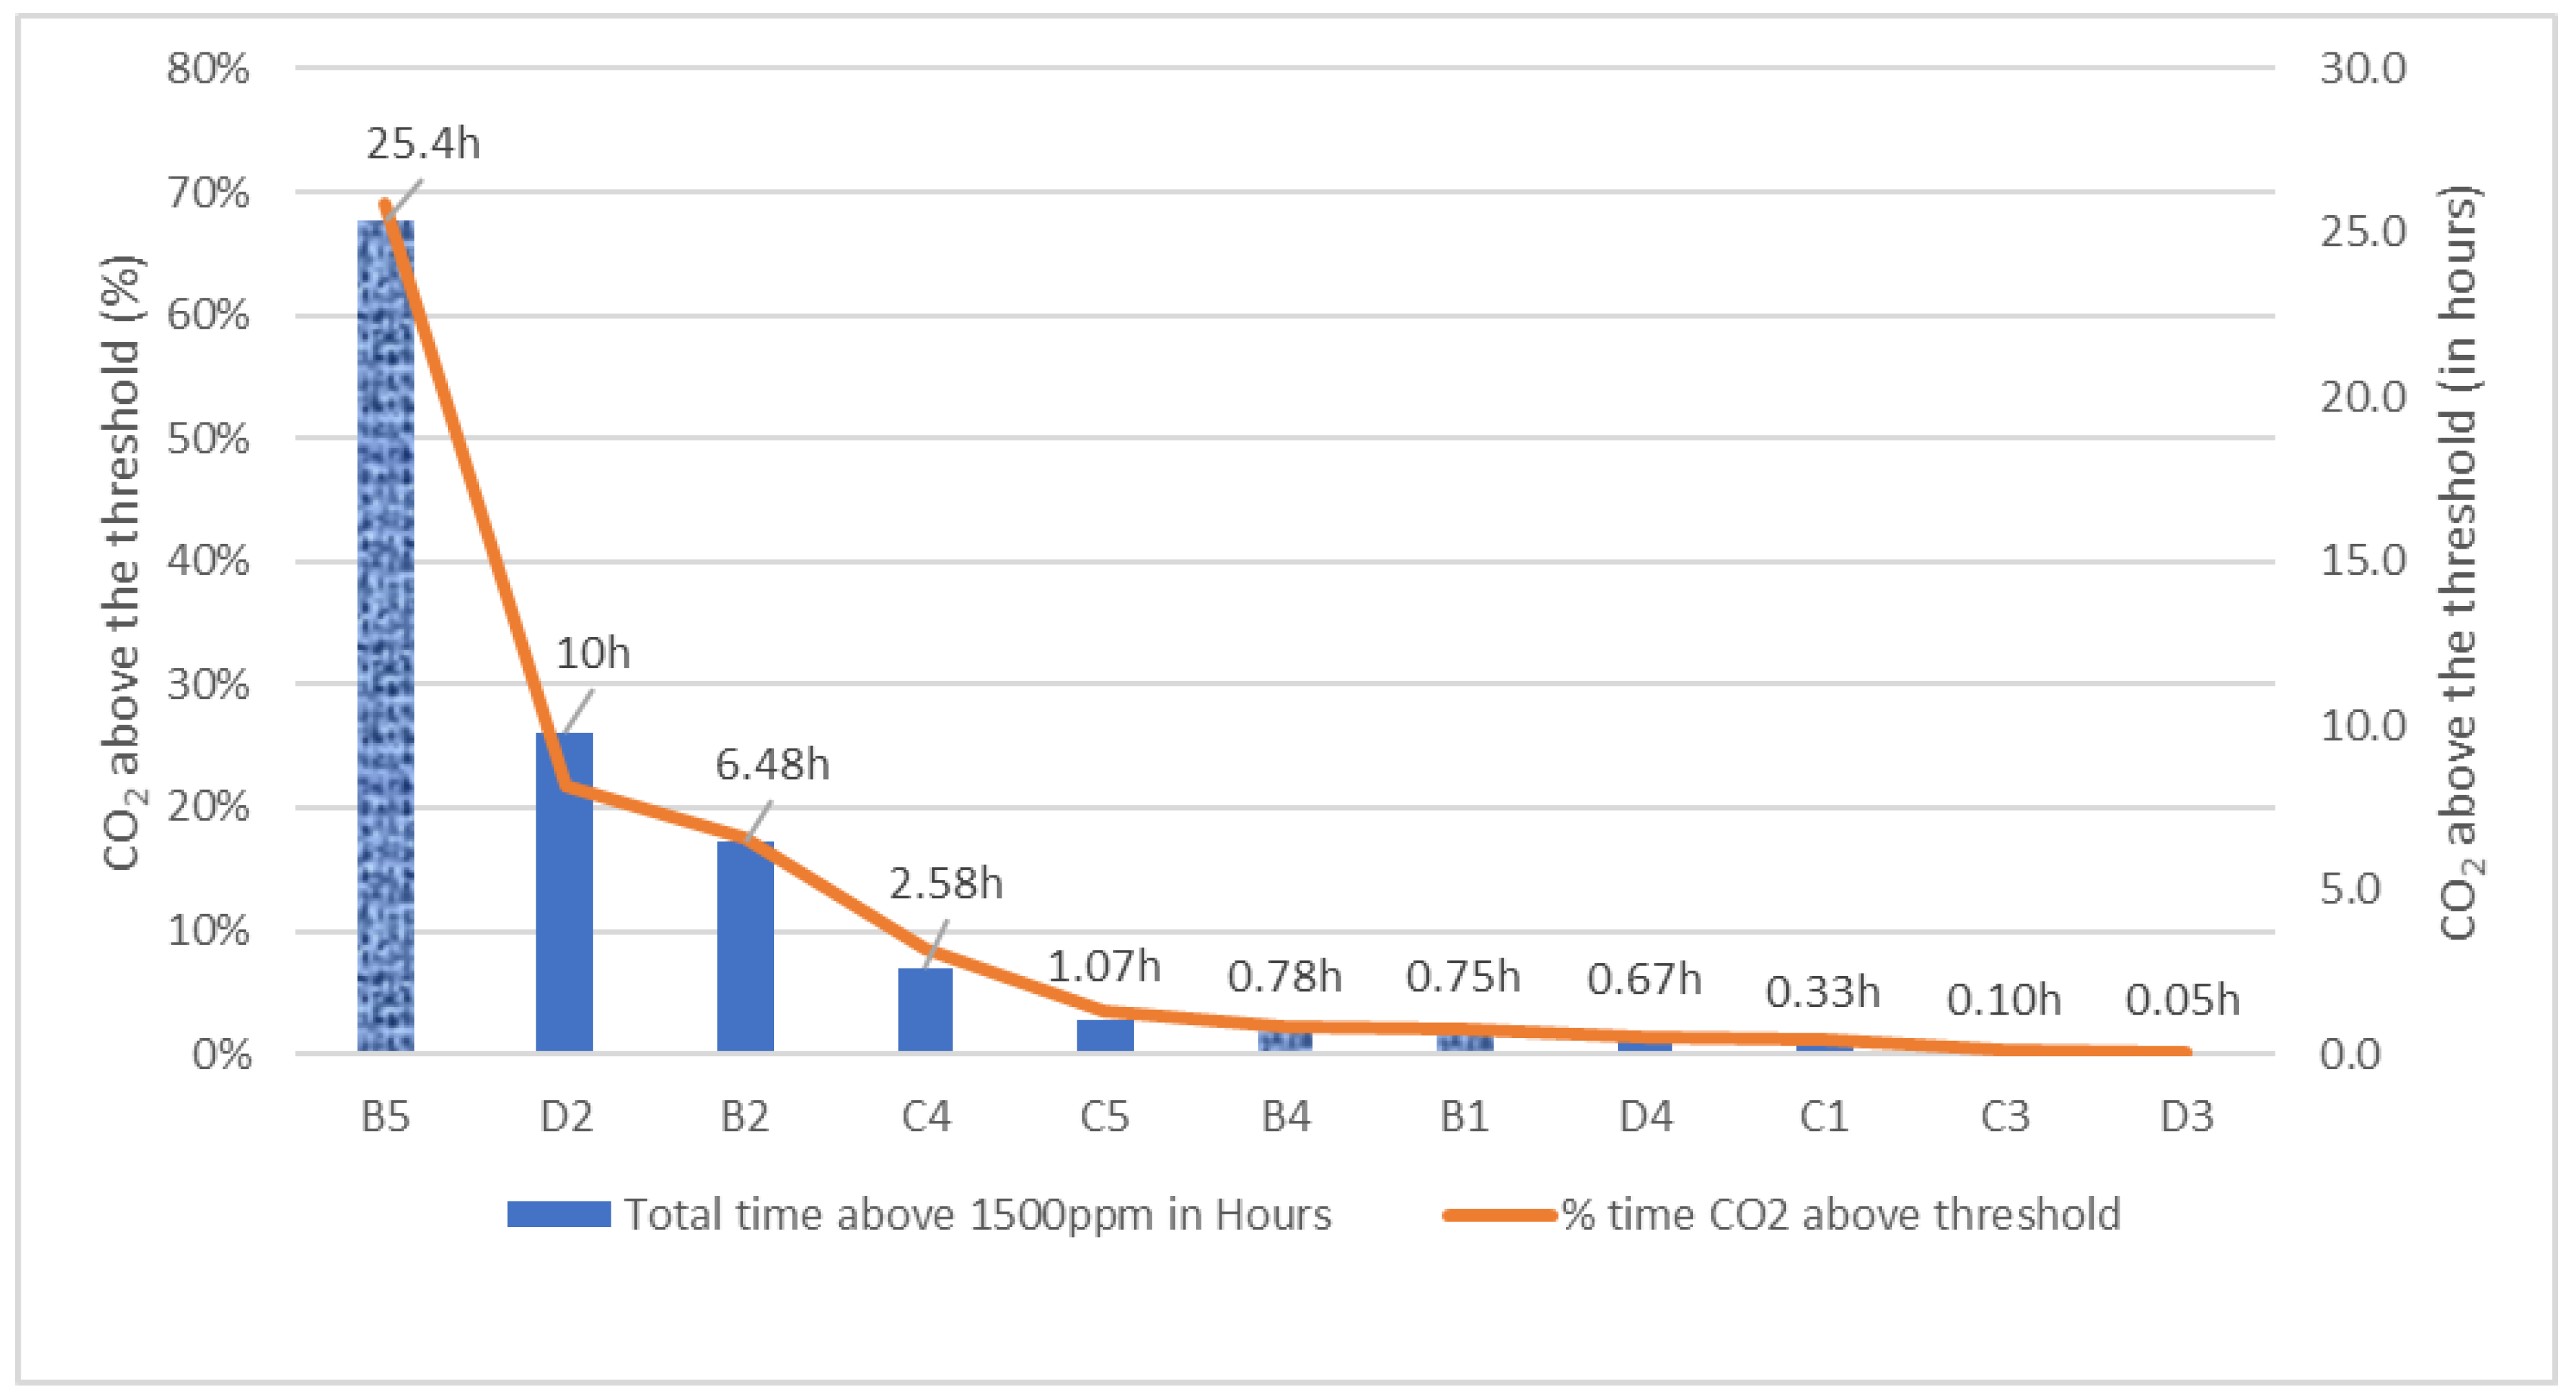
- School B: rooms B1 (2% above 1500 ppm), B2 (18% of the time above 1500 ppm), B4 (2% of the time above 1500 ppm) and B5 (69% of the time above 1500 ppm);
- –
- School C in rooms C1 (1%), C4 (9% of the time above 1500 ppm) and C5 (4%);
- –
- School D in room D2 (22% of the time above 1500 ppm).
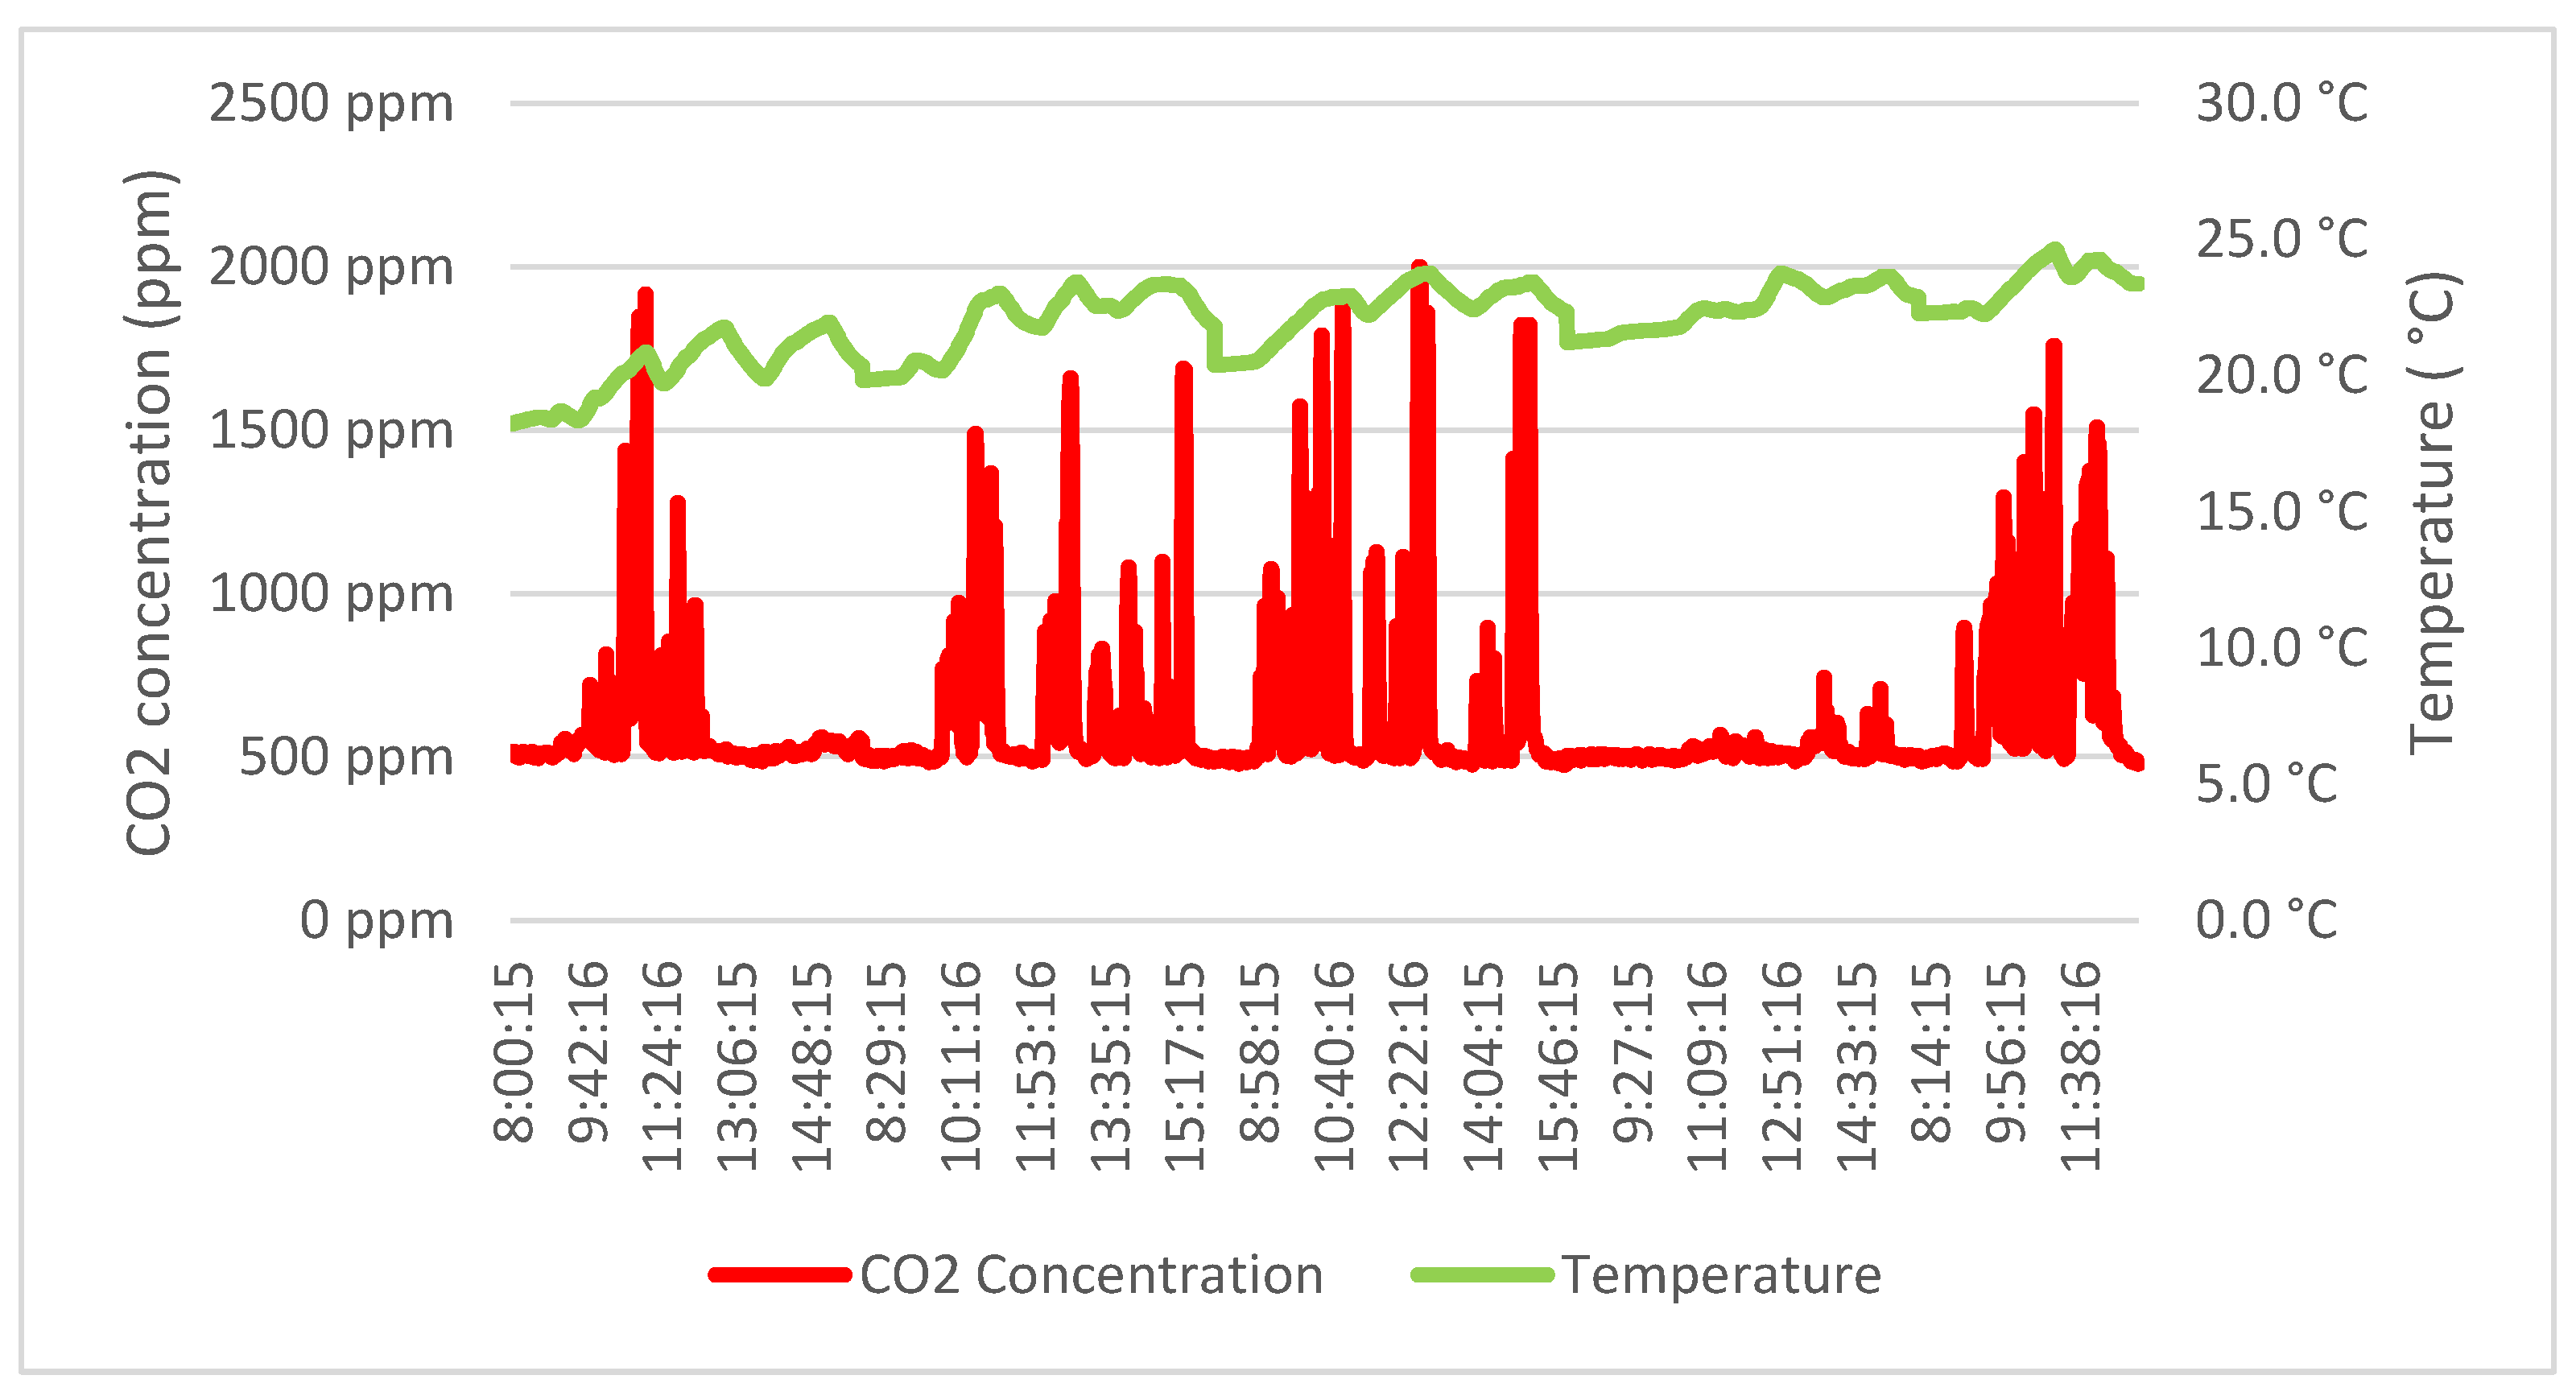
Analysis of the CO2 Concentration for B5
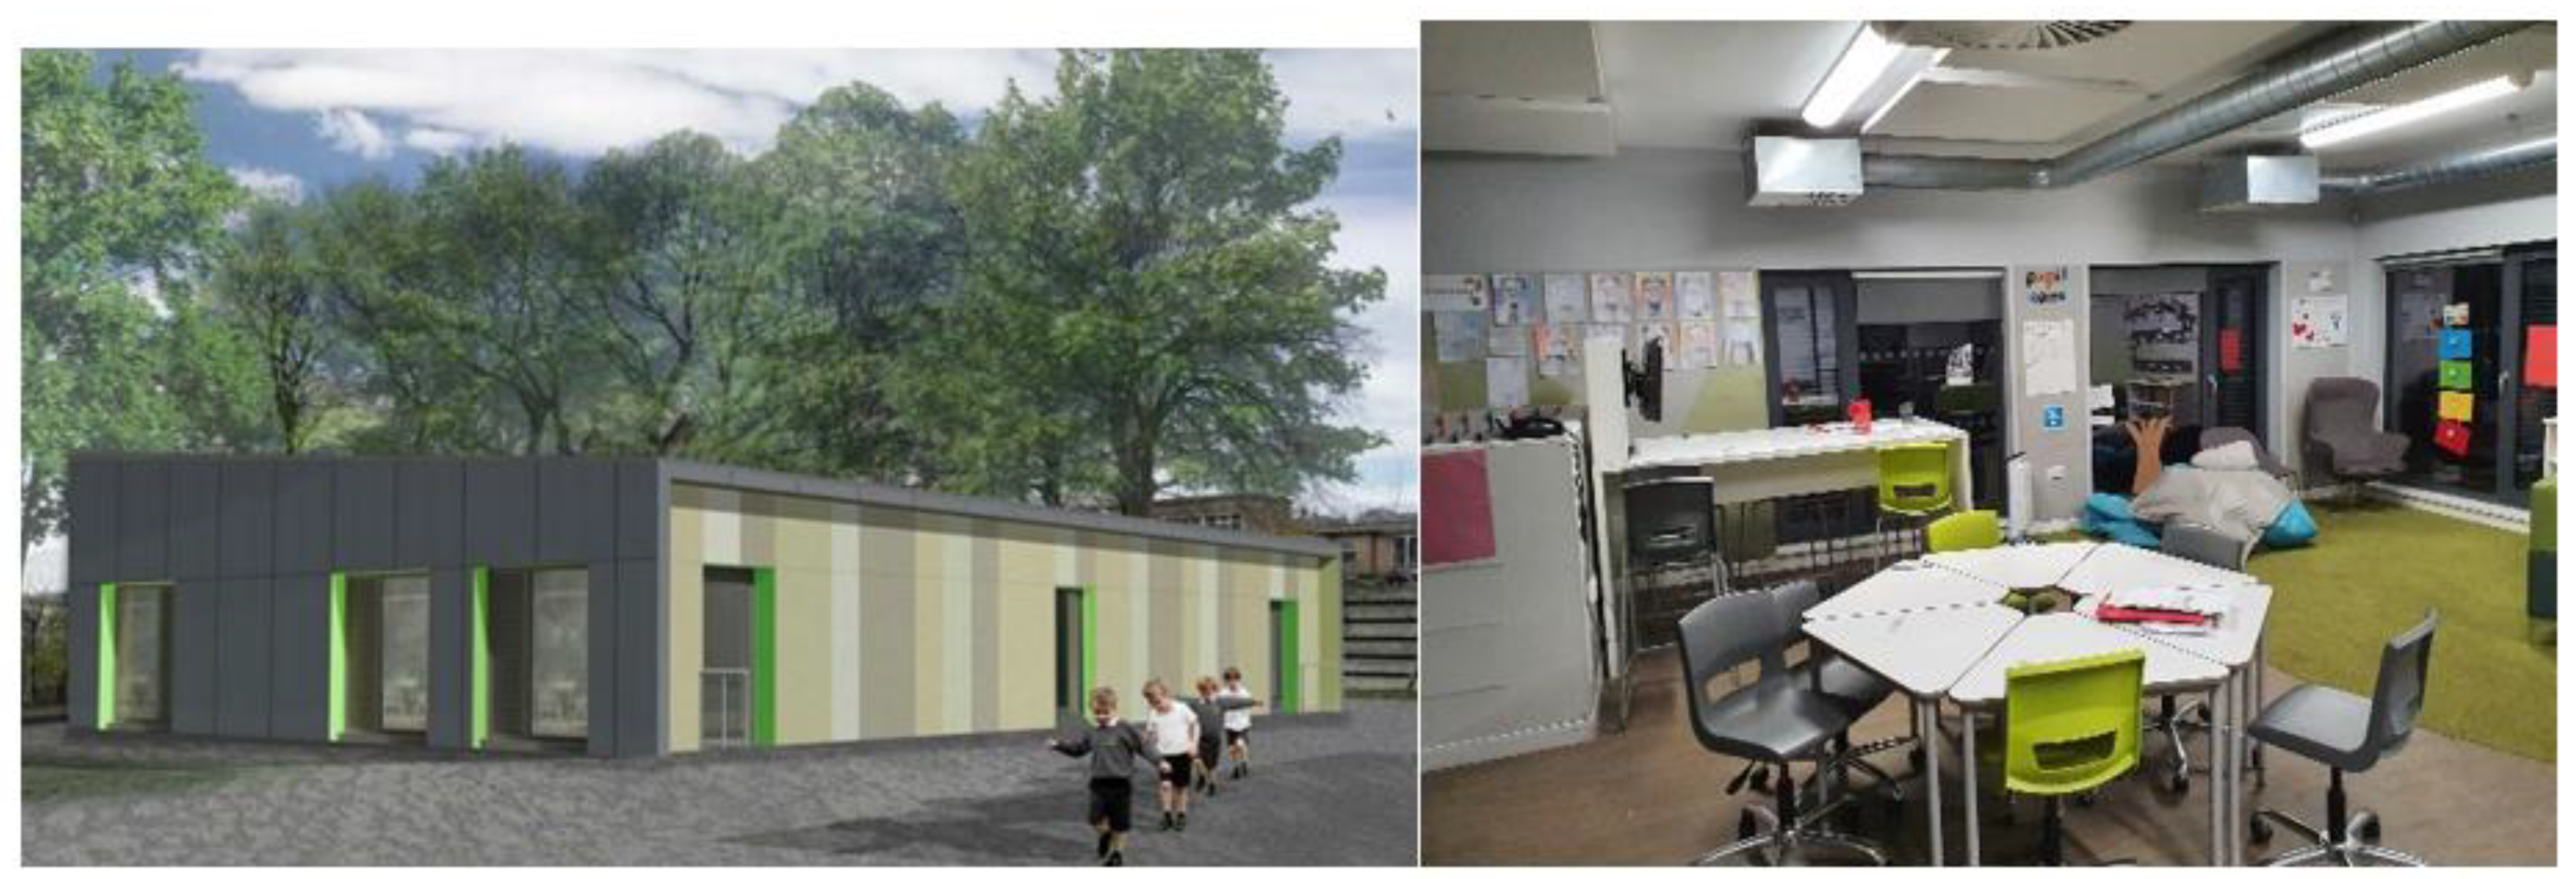
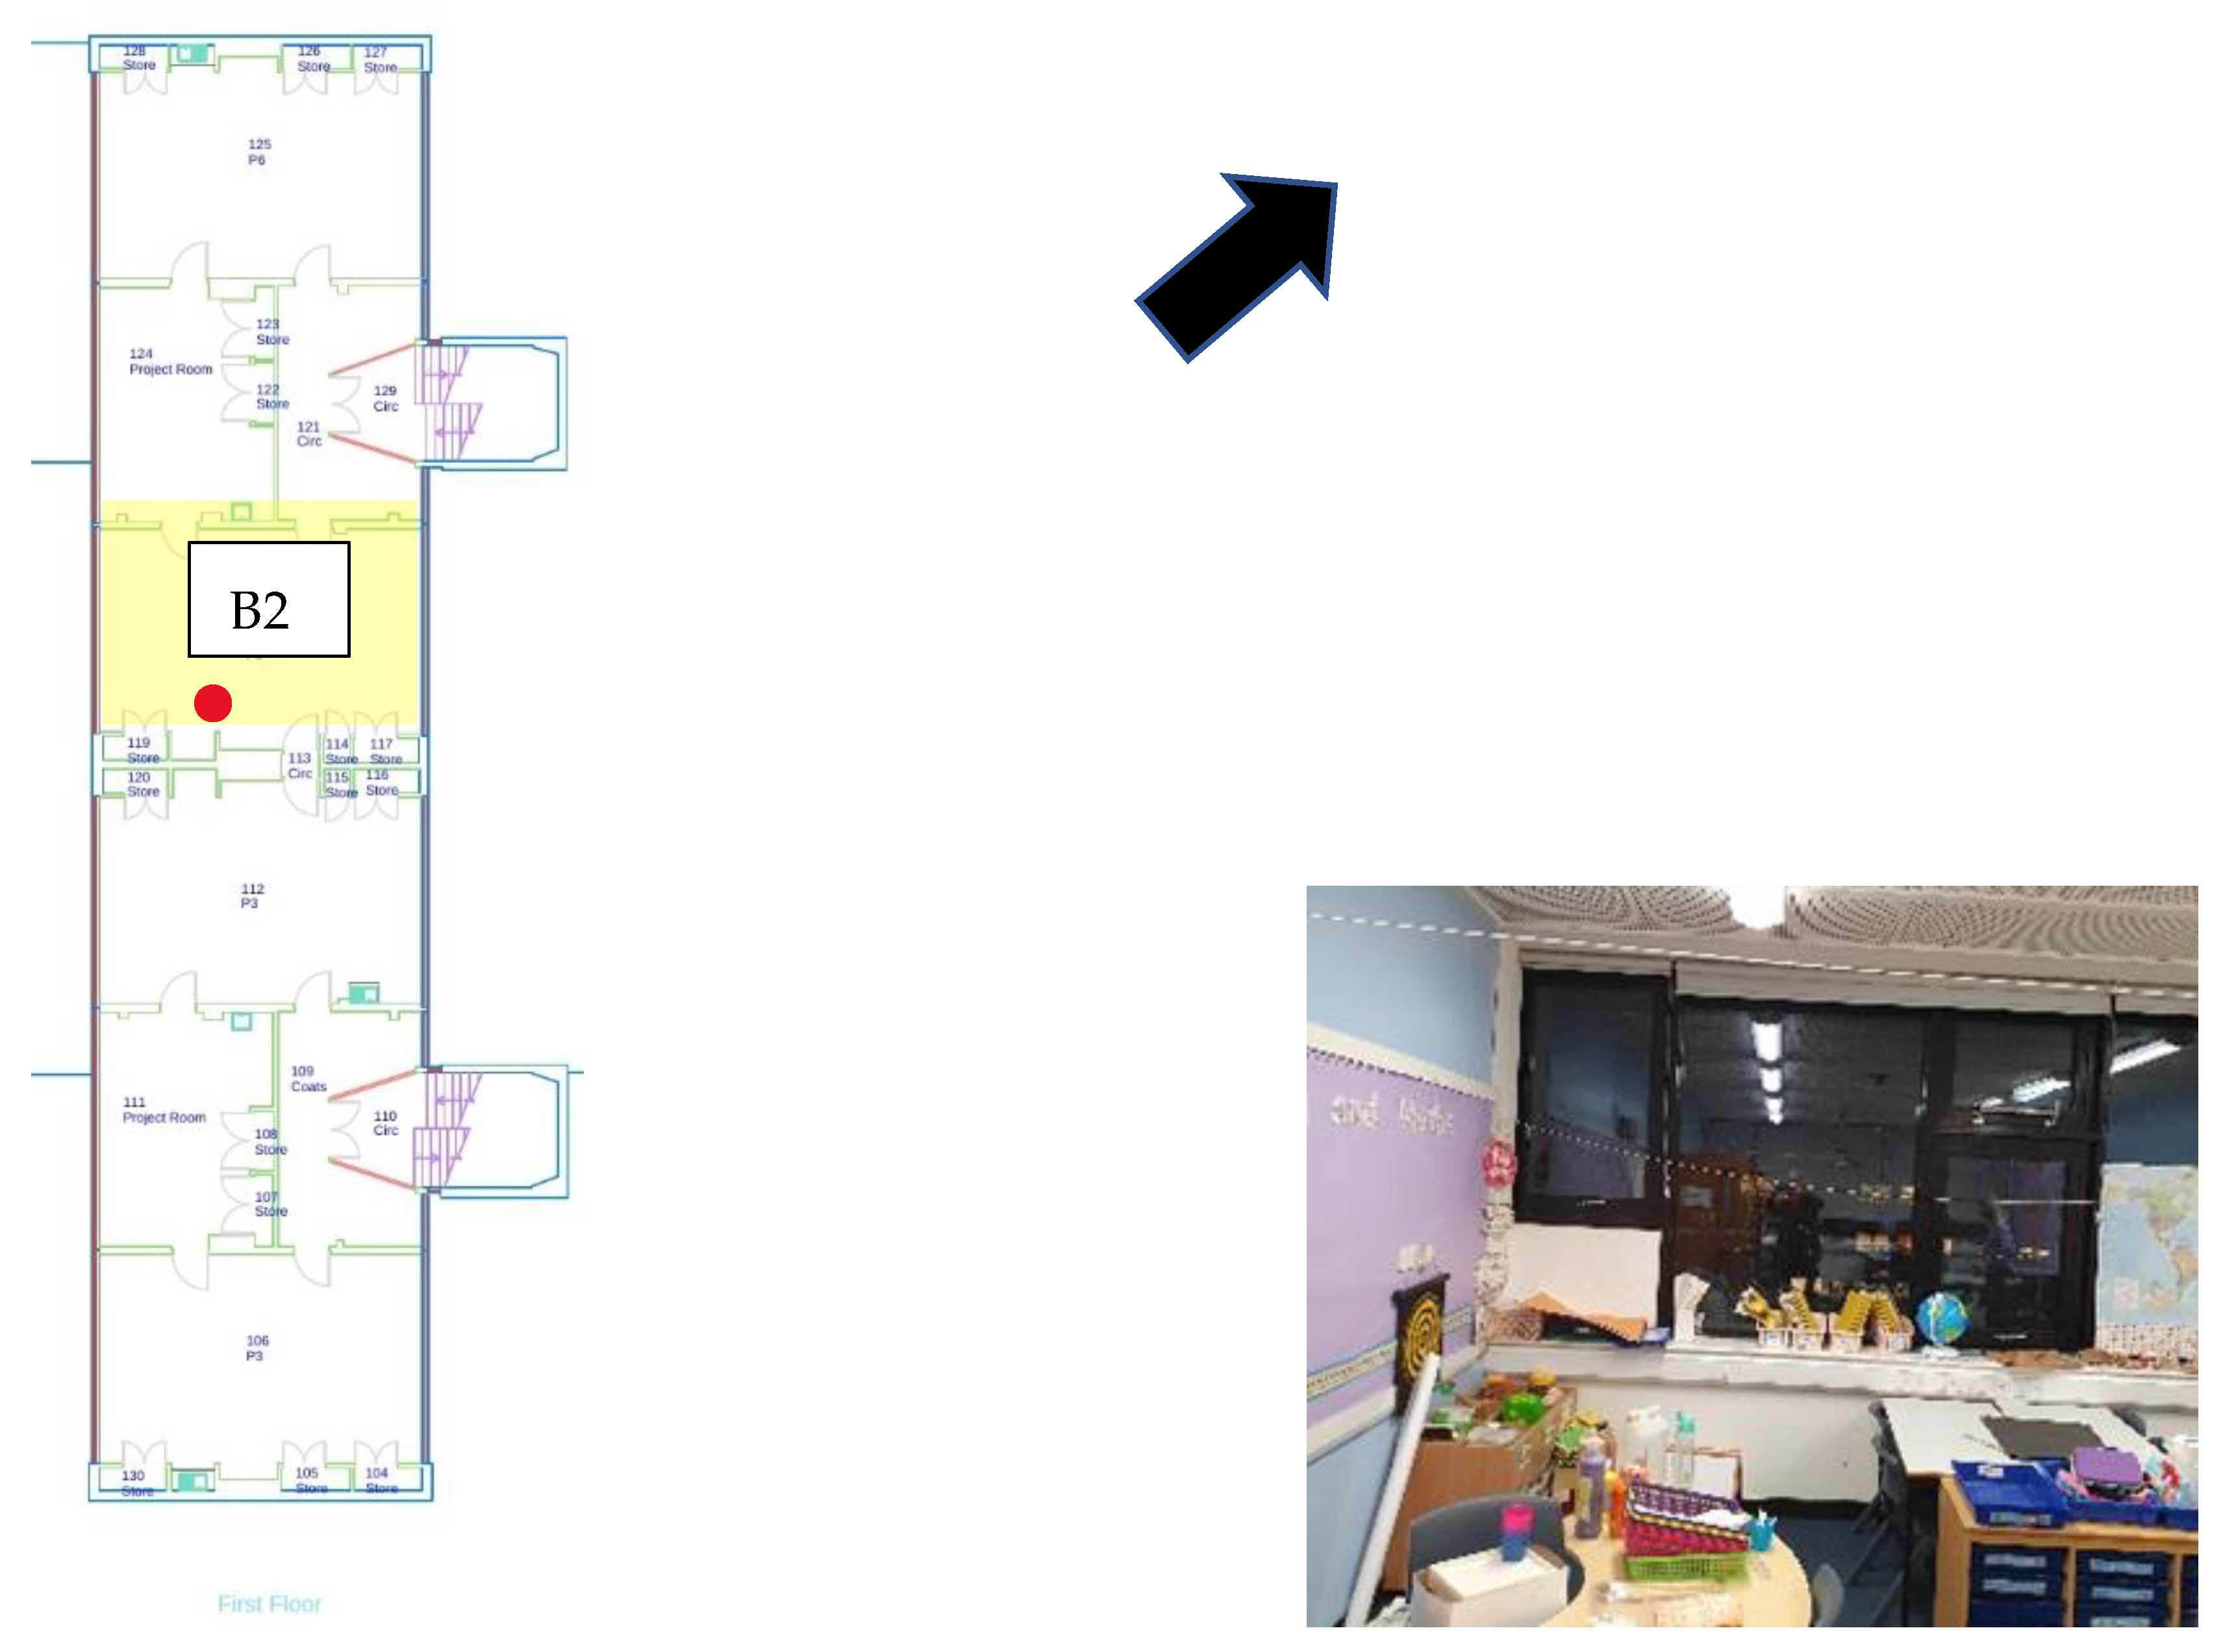
Analysis of the CO2 Concentration for B2 and D2
3.3.2. Ventilation Rates
4. Discussion
5. Limitations and Further Work
5.1. Limitations
5.2. Further Development
Author Contributions
Funding
Data Availability Statement
Conflicts of Interest
References
- World Green Building Council. Health, Wellbeing & Productivity in Offices; World Green Building Council: London, UK, 2014; p. 46. [Google Scholar]
- Building Engineering Services Association (BESA). 70% of Office Workers Complain about Poor Air Quality. Available online: https://www.thebesa.com/news/70-of-office-workers-complain-about-poor-air-quality/ (accessed on 19 August 2021).
- Edem, M.; Akpan, E.; Pepple, N. Impact of Workplace Environment on Health Workers. Occup. Med. Health Aff. 2017, 5, 1–5. [Google Scholar] [CrossRef]
- Chatzidiakou, L.; Mumovic, D.; Summerfield, A.J. What do we know about indoor air quality in school classrooms? A critical review of the literature. Intell. Build. Int. 2012, 4, 228–259. [Google Scholar] [CrossRef]
- Tak, S.; Groenewold, M.; Alterman, T.; Park, R.M.; Calvert, G.M. Excess risk of head and chest colds among teachers and other school workers. J. Sch. Health 2011, 81, 560–565. [Google Scholar] [CrossRef] [PubMed]
- Allen, J.G.; MacNaughton, P.; Satish, U.; Santanam, S.; Vallarino, J.; Spengler, J.D. Associations of cognitive function scores with carbon dioxide, ventilation, and volatile organic compound exposures in office workers: A controlled exposure study of green and conventional office environments. Environ. Health Perspect. 2016, 124, 805–812. [Google Scholar] [CrossRef] [PubMed] [Green Version]
- Toyinbo, O.; Shaughnessy, R.; Turunen, M.; Putus, T.; Metsämuuronen, J.; Kurnitski, J.; Haverinen-Shaughnessy, U. Building characteristics, indoor environmental quality, and mathematics achievement in Finnish elementary schools. Build. Environ. 2016, 104, 114–121. [Google Scholar] [CrossRef]
- Fisk, W.J.; Chan, W.R.; Johnson, A.L. Does dampness and mold in schools affect health? Results of a meta-analysis. Indoor Air 2019, 29, 895–902. [Google Scholar] [CrossRef]
- Annesi-Maesano, I.; Baiz, N.; Banerjee, S.; Rudnai, P.; Rive, S. Indoor air quality and sources in schools and related health effects. J. Toxicol. Environ. Health Part B Crit. Rev. 2013, 16, 491–550. [Google Scholar] [CrossRef]
- Coley, D.A.; Greeves, R.; Saxby, B.K. The Effect of Low Ventilation Rates on the Cognitive Function of a Primary School Class. Int. J. Vent. 2007, 6, 107–112. [Google Scholar] [CrossRef]
- Kielb, C.; Lin, S.; Muscatiello, N.; Hord, W.; Rogers-Harrington, J.; Healy, J. Building-related health symptoms and classroom indoor air quality: A survey of school teachers in New York State. Indoor Air 2015, 25, 371–380. [Google Scholar] [CrossRef]
- Mazurek, J.M.; Filios, M.; Willis, R.; Rosenman, K.D.; Reilly, M.J.; McGreevy, K.; Schill, D.P.; Valiante, D.; Pechter, E.; Davis, L.; et al. Work-related asthma in the educational services industry: California, Massachusetts, Michigan, and New Jersey, 1993–2000. Am. J. Ind. Med. 2008, 51, 47–59. [Google Scholar] [CrossRef]
- Bakó-Biró, Z.; Clements-Croome, D.J.; Kochhar, N.; Awbi, H.B.; Williams, M.J. Ventilation rates in schools and pupils’ performance. Build. Environ. 2012, 48, 215–223. [Google Scholar] [CrossRef]
- Haverinen-Shaughnessy, U.; Moschandreas, D.J.; Shaughnessy, R.J. Association between substandard classroom ventilation rates and students’ academic achievement. Indoor Air 2011, 21, 121–131. [Google Scholar] [CrossRef] [PubMed]
- Haverinen-Shaughnessy, U.; Shaughnessy, R.J. Effects of classroom ventilation rate and temperature on students’ test scores. PLoS ONE 2015, 10, e0136165. [Google Scholar] [CrossRef] [PubMed]
- World Green Building Council. Indoor Air Quality in Schools. 2020. Available online: https://www.worldgbc.org/sites/default/files/Better Places for People - Schools Briefing Notes -IAQ.pdf (accessed on 28 May 2021).
- Mendell, M.J.; Heath, G.A. Do indoor pollutants and thermal conditions in schools influence student performance? A critical review of the literature. Indoor Air 2005, 15, 27–52. [Google Scholar] [CrossRef] [PubMed]
- Bluyssen, P.M.; Kim, D.H.; Eijkelenboom, A.; Ortiz-Sanchez, M. Workshop with 335 primary school children in The Netherlands: What is needed to improve the IEQ in their classrooms? Build. Environ. 2020, 168, 106486. [Google Scholar] [CrossRef]
- Sundell, J.; Levin, H.; Nazaroff, W.W.; Cain, W.S.; Fisk, W.J.; Grimsrud, D.T.; Gyntelberg, F.; Li, Y.; Persily, A.K.; Pickering, A.C.; et al. Ventilation rates and health: Multidisciplinary review of the scientific literature. Indoor Air 2011, 21, 191–204. [Google Scholar] [CrossRef] [PubMed]
- Angelon-Gaetz, K.A.; Richardson, D.B.; Marshall, S.W.; Hernandez, M.L. Exploration of the effects of classroom humidity levels on teachers’ respiratory symptoms. Int. Arch. Occup. Environ. Health 2016, 89, 729–737. [Google Scholar] [CrossRef] [Green Version]
- Eng, A.; Mannetje, T.; Douwes, J.; Cheng, S.; Mclean, D.; Ellison-loschmann, L.; Pearce, N. The New Zealand Workforce Survey II: Occupational Risk Factors for Asthma. Ann. Occup. Hyg. 2010, 54, 154–164. [Google Scholar] [CrossRef] [Green Version]
- Whelan, E.A.; Lawson, C.C.; Grajewski, B.; Petersen, M.R.; Pinkerton, L.E.; Ward, E.M.; Schnorr, T.M. Prevalence of respiratory symptoms among female flight attendants and teachers. Occup. Environ. Med. 2003, 60, 929–934. [Google Scholar] [CrossRef] [Green Version]
- Mendell, M.J.; Eliseeva, E.A.; Davies, M.M.; Lobscheid, A. Do classroom ventilation rates in California elementary schools influence standardized test scores? Results from a prospective study. Indoor Air 2016, 26, 546–557. [Google Scholar] [CrossRef]
- Maddalena, R.; Mendell, M.J.; Eliseeva, K.; Chan, W.R.; Sullivan, D.P.; Russell, M.; Satish, U.; Fisk, W.J. Effects of ventilation rate per person and per floor area on perceived air quality, sick building syndrome symptoms, and decision-making. Indoor Air 2015, 25, 362–370. [Google Scholar] [CrossRef] [PubMed]
- Barker, J.; Stevens, D.; Bloomfield, S.F. Spread and prevention of some common viral infections in community facilities and domestic homes. J. Appl. Microbiol. 2001, 91, 7–21. [Google Scholar] [CrossRef] [PubMed]
- Cutler, R. Promoting hygiene in schools: Breaking the chain of infection. Br. J. Sch. Nurs. 2010, 5, 187–190. [Google Scholar] [CrossRef]
- CDC. How Coronavirus Spreads CDC. 2020. Available online: https://www.cdc.gov/coronavirus/2019-ncov/prevent-getting-sick/how-covid-spreads.html (accessed on 19 August 2021).
- World Health Organisation Coronavirus Disease (COVID-19): How Is It Transmitted? Coronavirus Disease (COVID-19) Pandemic. Q A Detail 2020. Available online: https://www.who.int/news-room/q-a-detail/coronavirus-disease-covid-19-how-is-it-transmitted (accessed on 19 August 2021).
- Morawska, L.; Tang, J.W.; Bahnfleth, W.; Bluyssen, P.M.; Boerstra, A.; Buonanno, G.; Cao, J.; Dancer, S.; Floto, A.; Franchimon, F.; et al. How can airborne transmission of COVID-19 indoors be minimised? Environ. Int. 2020, 142, 105832. [Google Scholar] [CrossRef]
- Rudnick, S.N.; Milton, D.K. Risk of indoor airborne infection transmission estimated from carbon dioxide concentration. Indoor Air 2003, 13, 237–245. [Google Scholar] [CrossRef]
- Chatzidiakou, L.; Mumovic, D.; Summerfield, A. Is CO2 a good proxy for indoor air quality in classrooms? Part 1: The interrelationships between thermal conditions, CO2 levels, ventilation rates and selected indoor pollutants. Build. Serv. Eng. Res. Technol. 2015, 36, 129–161. [Google Scholar] [CrossRef]
- Sage-Emg. Role of Ventilation in Controlling SARS-CoV-2 Transmission; Sage-Emg: High Wycombe, UK, 2020; pp. 2–33. [Google Scholar]
- ANSI/ASHRAE Standard 62.1-2019; Ventilation for Acceptable Indoor Air Quality. ASHRAE: Atlanta, GA, USA, 2019. Available online: www.ashrae.org/technology (accessed on 18 January 2022).
- Scottish Government. Coronavirus (COVID-19): Guidance on Reducing the Risks from COVID-19 in Schools Non-Statutory Guidance to Ensure a Safe and Supportive Environment for Learning and Teaching; Scottish Government: Edinburgh, UK, 2022.
- Scottish Government. Coronavirus (COVID-19): Guidance on Reducing the Risks in Schools. 2021. Available online: https://www.gov.scot/publications/coronavirus-covid-19-guidance-on-reducing-the-risks-in-schools/pages/overview/ (accessed on 19 August 2021).
- CIBSE. COVID-19 Ventilation Guidance. 2020; Version 4; pp. 1–26. Available online: https://www.cdc.gov/coronavirus/2019-ncov/more/scientific-brief-sars-cov-2.html (accessed on 10 May 2021).
- World Health Organization. Methods for Monitoring Indoor Air Quality in Schools; World Health Organization: Bonn, Germany, 2011. [Google Scholar]
- REHVA. COVID-19 Ventilation and Building SERVICES Guidance for School Personnel; REHVA: Brussels, Belgium, 2020; pp. 1–5. [Google Scholar]
- HCSP COVID-19: Aération, Ventilation et Mesure du CO2 Dans les ERP. Available online: https://www.hcsp.fr/Explore.cgi/AvisRapportsDomaine?clefr=1009 (accessed on 10 September 2021).
- HPSC Guidance on Non-Healthcare Building Ventilation during. 2020, pp. 1–10. Available online: www.hpsc.ie (accessed on 10 September 2021).
- CIBSE. CIBSE COVID-19 Ventilation Guidance, Version 4. 2020; p. 26. Available online: https://www.cdc.gov/coronavirus/2019-ncov/more/scientific-brief-sars-cov-2.html%0Ahttps://www.cibse.org/knowledge/knowledge-items/detail?id=a0q3Y00000HsaFtQAJ# (accessed on 22 November 2021).
- Azuma, K.; Yanagi, U.; Kagi, N.; Kim, H.; Ogata, M.; Hayashi, M. Environmental factors involved in SARS-CoV-2 transmission: Effect and role of indoor environmental quality in the strategy for COVID-19 infection control. Environ. Health Prev. Med. 2020, 25, 66. [Google Scholar] [CrossRef]
- ASHRAE. ASHRAE Epidemic Task Force. Ashrae 2020. Available online: www.ashrae.org/covid19 (accessed on 18 November 2021).
- Montazami, A.; Gaterell, M.; Nicol, F. A comprehensive review of environmental design in UK schools: History, conflicts and solutions. Renew. Sustain. Energy Rev. 2015, 46, 249–264. [Google Scholar] [CrossRef]
- Batterman, S. Review and extension of CO2-based methods to determine ventilation rates with application to school classrooms. Int. J. Environ. Res. Public Health 2017, 14, 145. [Google Scholar] [CrossRef]
- Allen, J.; Spengler, J.; Jones, E. 5-Step Guide to Checking Ventilation Rates in Classrooms; Harvard Healthy Buildings Program: 2020. Available online: www.ForHealth.org (accessed on 18 January 2022).
- Zhang, D.; Ding, E.; Bluyssen, P.M. Guidance to assess ventilation performance of a classroom based on CO2 monitoring. Indoor Built. Environ. 2022, 1420326X2110587. [Google Scholar] [CrossRef]
- Coley, D.A.; Beisteiner, A. Carbon Dioxide Levels and Ventilation Rates in Schools. Int. J. Vent. 2002, 1, 45–52. [Google Scholar] [CrossRef]
- Beisteiner, A.; Coley, D.A. Carbon Dioxide Levels and Summertime Ventilation Rates in UK Schools. Int. J. Vent. 2003, 1, 181–187. [Google Scholar] [CrossRef]
- Settimo, G.; Indinnimeo, L.; Inglessis, M.; De Felice, M.; Morlino, R.; Di Coste, A.; Fratianni, A.; Avino, P. Indoor air quality levels in schools: Role of student activities and no activities. Int. J. Environ. Res. Public Health 2020, 17, 6695. [Google Scholar] [CrossRef] [PubMed]
- Bannister, P. Why Good Buildings Go Bad, While Some Are Just Born That Way. Ecolibrium. J. Aust. Inst. Refrig. AC Heat. 2009, 24–32. Available online: https://iifiir.org/en/fridoc/why-good-buildings-go-bad-while-some-are-just-born-that-way-131023 (accessed on 19 January 2022).
- Burman, E.; Kimpian, J.; Mumovic, D. Building schools for the future: Lessons learned from performance evaluations of five secondary schools and academies in england. Front. Built Environ. 2018, 4, 22. [Google Scholar] [CrossRef] [Green Version]
- Vassura, I.; Venturini, E.; Bernardi, E.; Passarini, F.; Settimo, G. Assessment of indoor pollution in a school environment through both passive and continuous samplings. Environ. Eng. Manag. J. 2015, 14, 1761–1770. [Google Scholar] [CrossRef]


| School | Classroom | Storey | Ventilation System | Orientation | Space Volume (m3) | Space Area (m2) | Year Built/Last Renovation | Occupancy (Teachers and Pupils) | |
|---|---|---|---|---|---|---|---|---|---|
| Min | Max | ||||||||
| A | A1 | Ground | Natural | SSE-E | 71.8 | 28.0 | 1964 | 23 | 27 |
| A2 | Ground | Natural | SSE | 94.3 | 36.3 | 1964 | 11 | 26 | |
| A3 | Ground | Natural | SSE | 116.8 | 38.9 | 1964 | 24 | 28 | |
| A4 | 1st | Natural | E-NNE | 145.1 | 48.4 | 1964 | 23 | 24 | |
| A5 | 2nd (Top) | Natural | SSE-W | 145.1 | 48.4 | 1964 | 19 | 22 | |
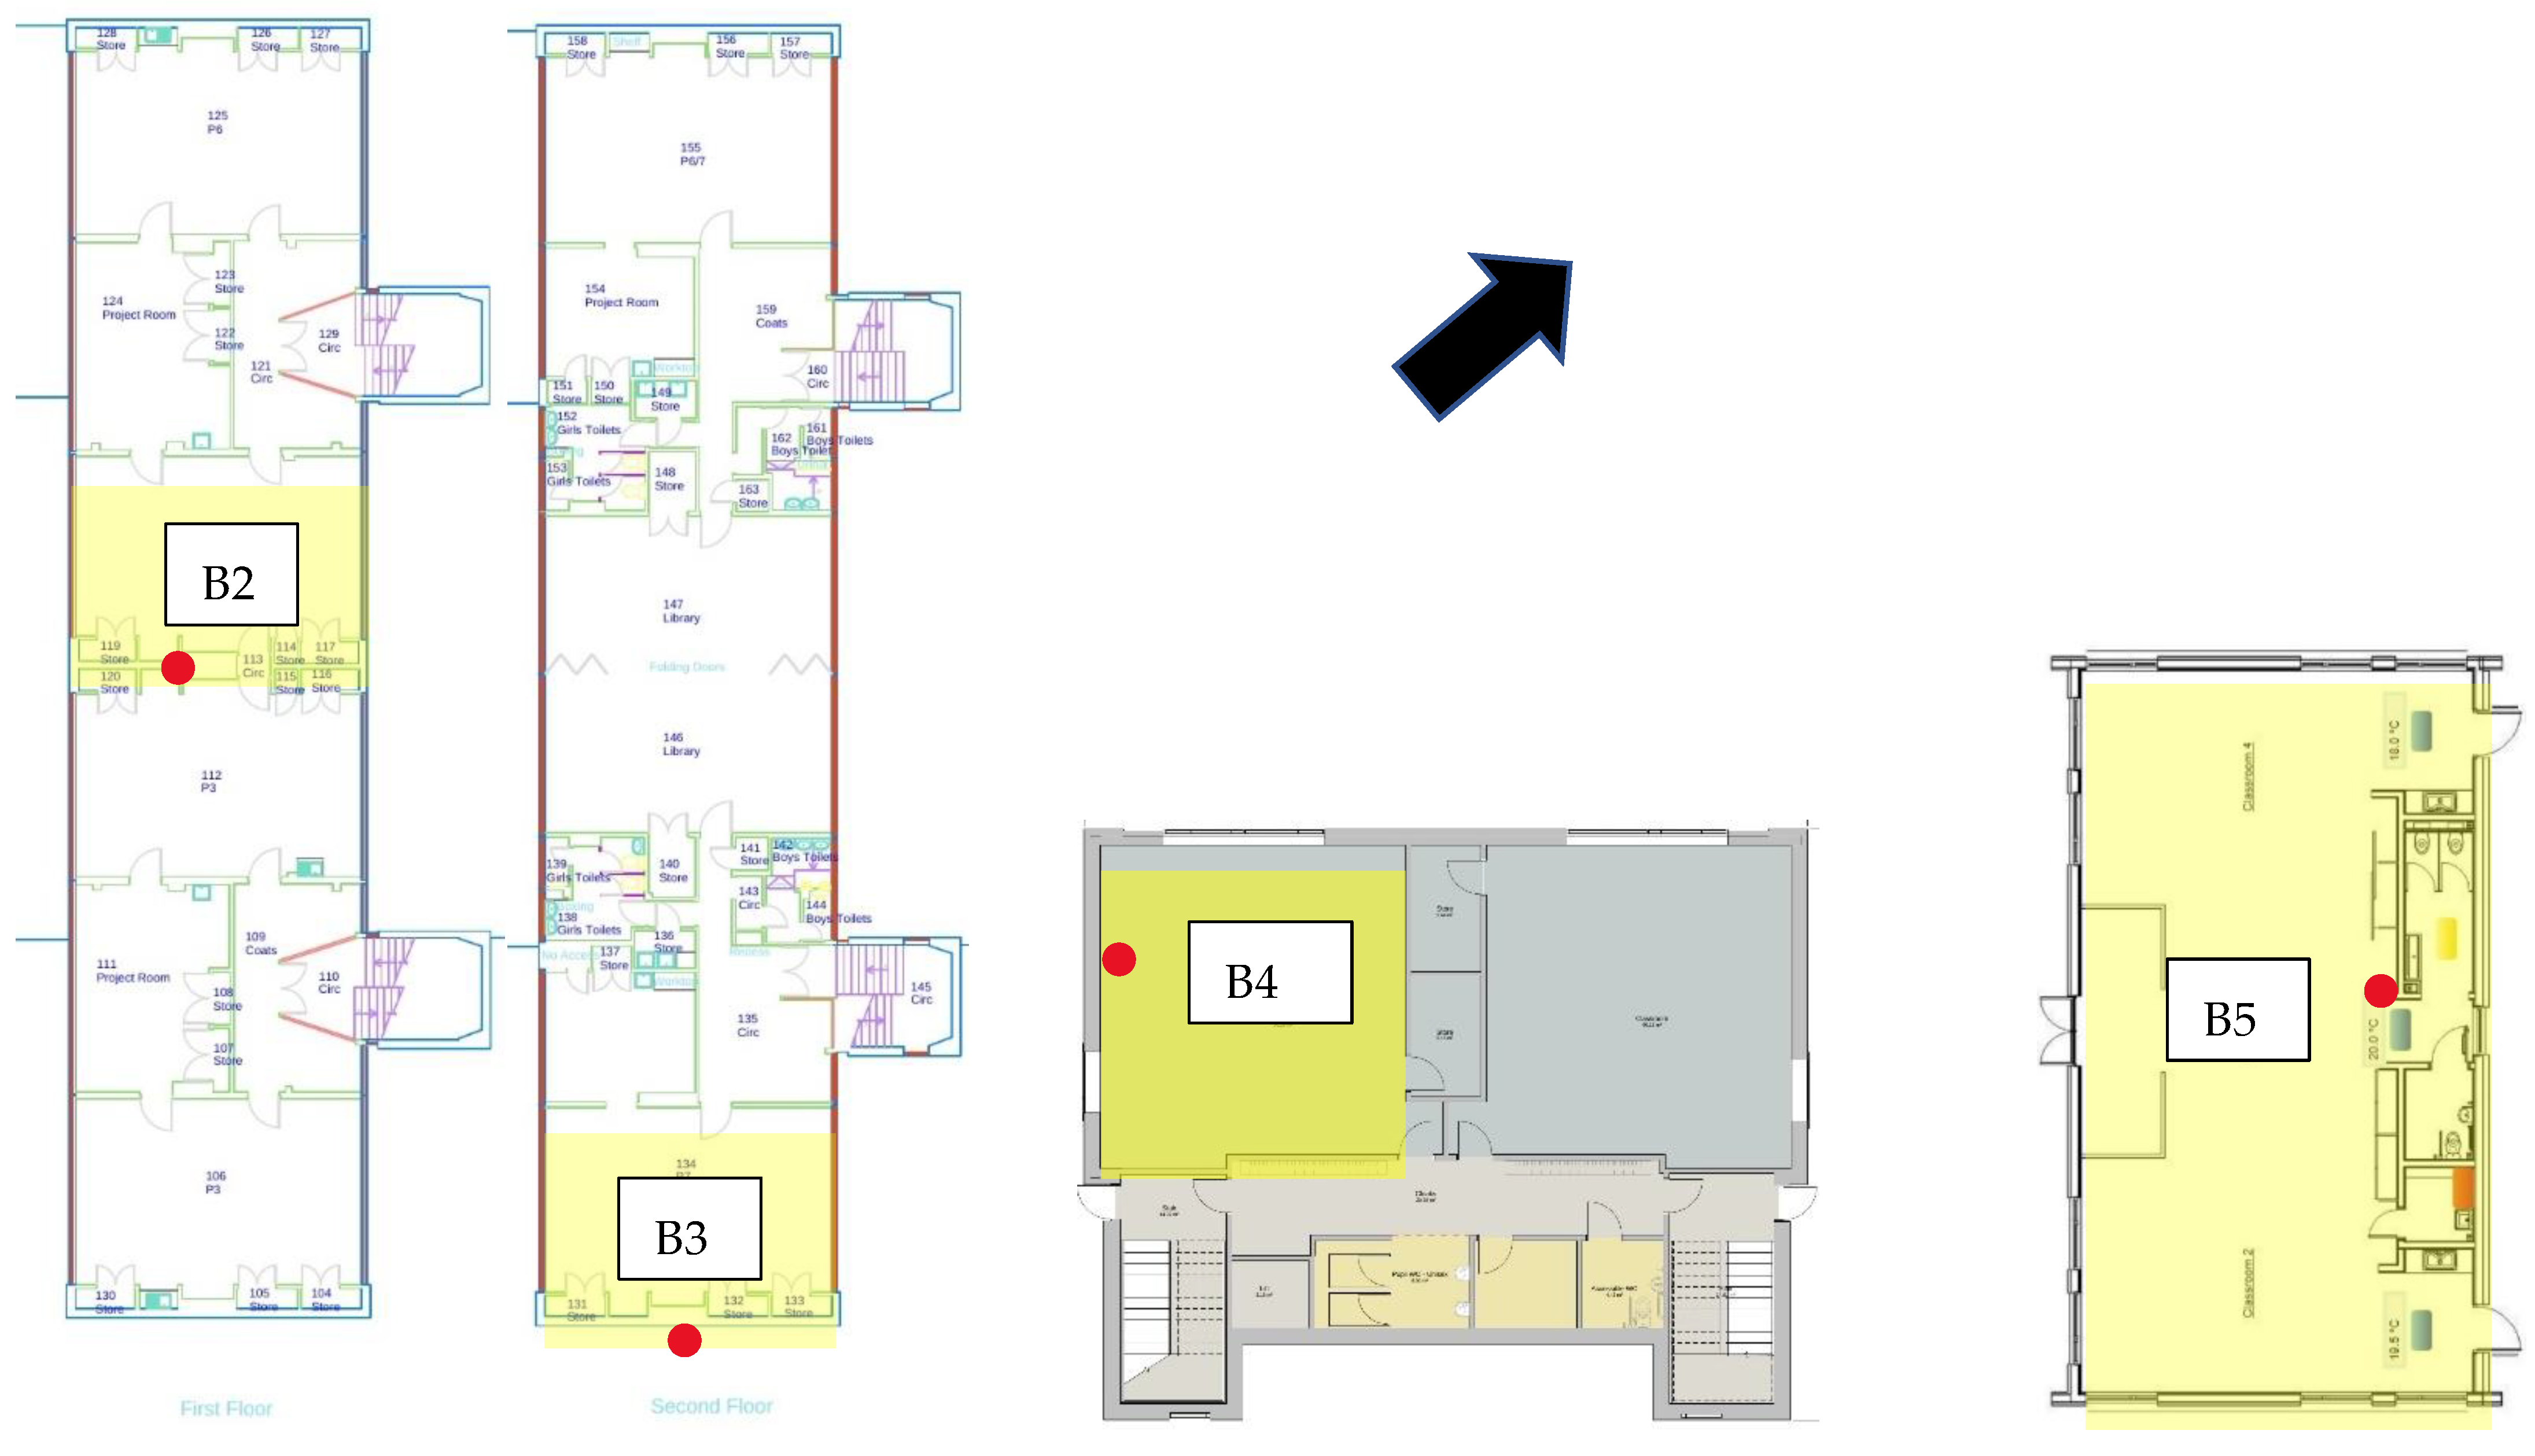
| B | B1 | Ground | Mechanical | E-W | 142.8 | 47.6 | 1968 | 30 | 33 |
| B2 | 2nd (Top) | Natural | NE-SW | 148.1 | 51.9 | 1968 | 27 | 29 | |
| B3 | 1st | Natural | NE-SW | 61.2 | 23.5 | 1968 | 22 | 29 | |
| B4 | Ground | Mechanical | NW | 126.8 | 42.3 | 2013 | 23 | 27 | |
| B5 | Ground | Mechanical | N-S-E-W | 432.0 | 154.3 | 2017 | 47 | 51 | |
| C | C1 | Ground | Natural | W | 196.0 | 38.2 | 1891 | 22 | 30 |
| C2 | 2nd(Top) | Natural | SW-W | 184.3 | 40.0 | 1891 | 33 | 34 | |
| C3 | 2nd (Top) | Natural | W | 173.4 | 38.2 | 1891 | 22 | 31 | |
| C4 | 2nd (Top) | Natural | NE | 250.7 | 54.5 | 1891 | 22 | 30 | |
| C5 | 2nd (Top) | Natural | NE-W | 250.6 | 54.5 | 1891 | 32 | 33 | |
| D | D1 | Ground | Mechanical | W | 168.0 | 42 | 2015 | 24 | 35 |
| D2 | Ground | Natural | SW | 210.0 | 42 | 1902 | 30 | 34 | |
| D3 | 1st | Natural | NE | 192.0 | 48 | 1902 | 29 | 34 | |
| D4 | 2nd (Top) | Natural | SW | 165.0 | 33 | 1902 | 24 | 30 | |
| D5 | Ground | Mechanical | S | 162.0 | 40.5 | 2007 | 23 | 31 | |
| Classroom | Storey | Orientation | Windows Area (m2) | Occupancy (Teachers and Pupils) | |
|---|---|---|---|---|---|
| Min | Max | ||||
| A1 | Ground | SSE-E | 22.99 | 23 | 27 |
| A2 | Ground | SSE | 41.47 | 11 | 26 |
| A3 | Ground | SSE | 10.44 | 24 | 28 |
| A4 | 1st | E-NNE | 17.48 | 23 | 24 |
| A5 | 2nd (Top) | SSE-W | 33.70 | 19 | 22 |
| B1 | Ground | E-W | 4.34 | 30 | 33 |
| B2 | 2nd (Top) | NE-SW | 9.63 | 27 | 29 |
| B3 | 1st | NE-SW | 2.10 | 22 | 29 |
| B4 | Ground | NW | 12.87 | 23 | 27 |
| B5 | Ground | N-S-E-W | 7.68 | 47 | 51 |
| C1 | Ground | W | 5.21 | 22 | 30 |
| C2 | 2nd(Top) | SW-W | 8.83 | 33 | 34 |
| C3 | 2nd (Top) | W | 10.47 | 22 | 31 |
| C4 | 2nd (Top) | NE | 8.83 | 22 | 30 |
| C5 | 2nd (Top) | NE-W | 2.30 | 32 | 33 |
| D1 | Ground | W | 4.00 | 24 | 35 |
| D2 | Ground | SW | 5.00 | 30 | 34 |
| D3 | 1st | NE | 4.22 | 29 | 34 |
| D4 | 2nd (Top) | SW | 4.40 | 24 | 30 |
| D5 | Ground | S | 22.99 | 23 | 31 |
| Naturally Ventilated Classrooms | Mechanically Ventilated Classrooms | ||||||||||||||||||
|---|---|---|---|---|---|---|---|---|---|---|---|---|---|---|---|---|---|---|---|
| Class Number | A1 | A2 | A3 | A4 | A5 | B2 | C1 | C2 | C3 | C4 | C5 | D2 | D3 | D4 | B1 | B4 | B5 | D1 | D5 |
| Average Peak CO2 (ppm) | 945 | 1186 | 982 | 1043 | 1137 | 1710 | 1192 | 1032 | 1396 | 1028 | 1343 | 1624 | 1410 | 1704 | 1459 | 1413 | 2001 | 1213 | 664 |
| ACH (h−1) | 10.2 | 5.4 | 6.3 | 3.6 | 2.9 | 2.2 | 2.7 | 4.1 | 2.6 | 2.7 | 1.9 | 1.8 | 2.4 | 1.9 | 3.2 | 2.7 | 1.0 | 3.7 | 10.6 |
| Ventilation rate per person (l/s/pers.) | 7.54 | 5.44 | 7.35 | 6.09 | 5.32 | 3.05 | 4.86 | 6.1 | 4.01 | 6.18 | 4.05 | 3.1 | 3.77 | 2.92 | 3.89 | 3.81 | 2.39 | 4.88 | 15.39 |
| average ACH | 3.6 | 4.2 | |||||||||||||||||
| average Ventilation rate | 4.99 | 6.08 | |||||||||||||||||
| average ACH Victorian buildings only | 2.5 | ||||||||||||||||||
| average Ventilation rate Victorian only | 4.38 | ||||||||||||||||||
| average ACH newer buildings only | 5.1 | ||||||||||||||||||
| average Ventilation rate newer only | 5.80 | ||||||||||||||||||
Publisher’s Note: MDPI stays neutral with regard to jurisdictional claims in published maps and institutional affiliations. |
© 2022 by the authors. Licensee MDPI, Basel, Switzerland. This article is an open access article distributed under the terms and conditions of the Creative Commons Attribution (CC BY) license (https://creativecommons.org/licenses/by/4.0/).
Share and Cite
Bain-Reguis, N.; Smith, A.; Martin, C.H.; Currie, J. Indoor CO2 and Thermal Conditions in Twenty Scottish Primary School Classrooms with Different Ventilation Systems during the COVID-19 Pandemic. Pollutants 2022, 2, 180-204. https://doi.org/10.3390/pollutants2020014
Bain-Reguis N, Smith A, Martin CH, Currie J. Indoor CO2 and Thermal Conditions in Twenty Scottish Primary School Classrooms with Different Ventilation Systems during the COVID-19 Pandemic. Pollutants. 2022; 2(2):180-204. https://doi.org/10.3390/pollutants2020014
Chicago/Turabian StyleBain-Reguis, Natalie, Andrew Smith, Caroline Hollins Martin, and John Currie. 2022. "Indoor CO2 and Thermal Conditions in Twenty Scottish Primary School Classrooms with Different Ventilation Systems during the COVID-19 Pandemic" Pollutants 2, no. 2: 180-204. https://doi.org/10.3390/pollutants2020014
APA StyleBain-Reguis, N., Smith, A., Martin, C. H., & Currie, J. (2022). Indoor CO2 and Thermal Conditions in Twenty Scottish Primary School Classrooms with Different Ventilation Systems during the COVID-19 Pandemic. Pollutants, 2(2), 180-204. https://doi.org/10.3390/pollutants2020014