
Understanding Land Changes for Sustainable Environmental Management: The Case of Basilicata Region (Southern Italy)

 ,
, 
 ,
,
Abstract
:1. Introduction
2. Materials and Methods
2.1. Basilicata Region Study Area
2.2. MODIS Land Cover Database
2.3. LULC Changes: How to Detect
3. Results
3.1. Year-to-Year Quantitative Assessment of LULC
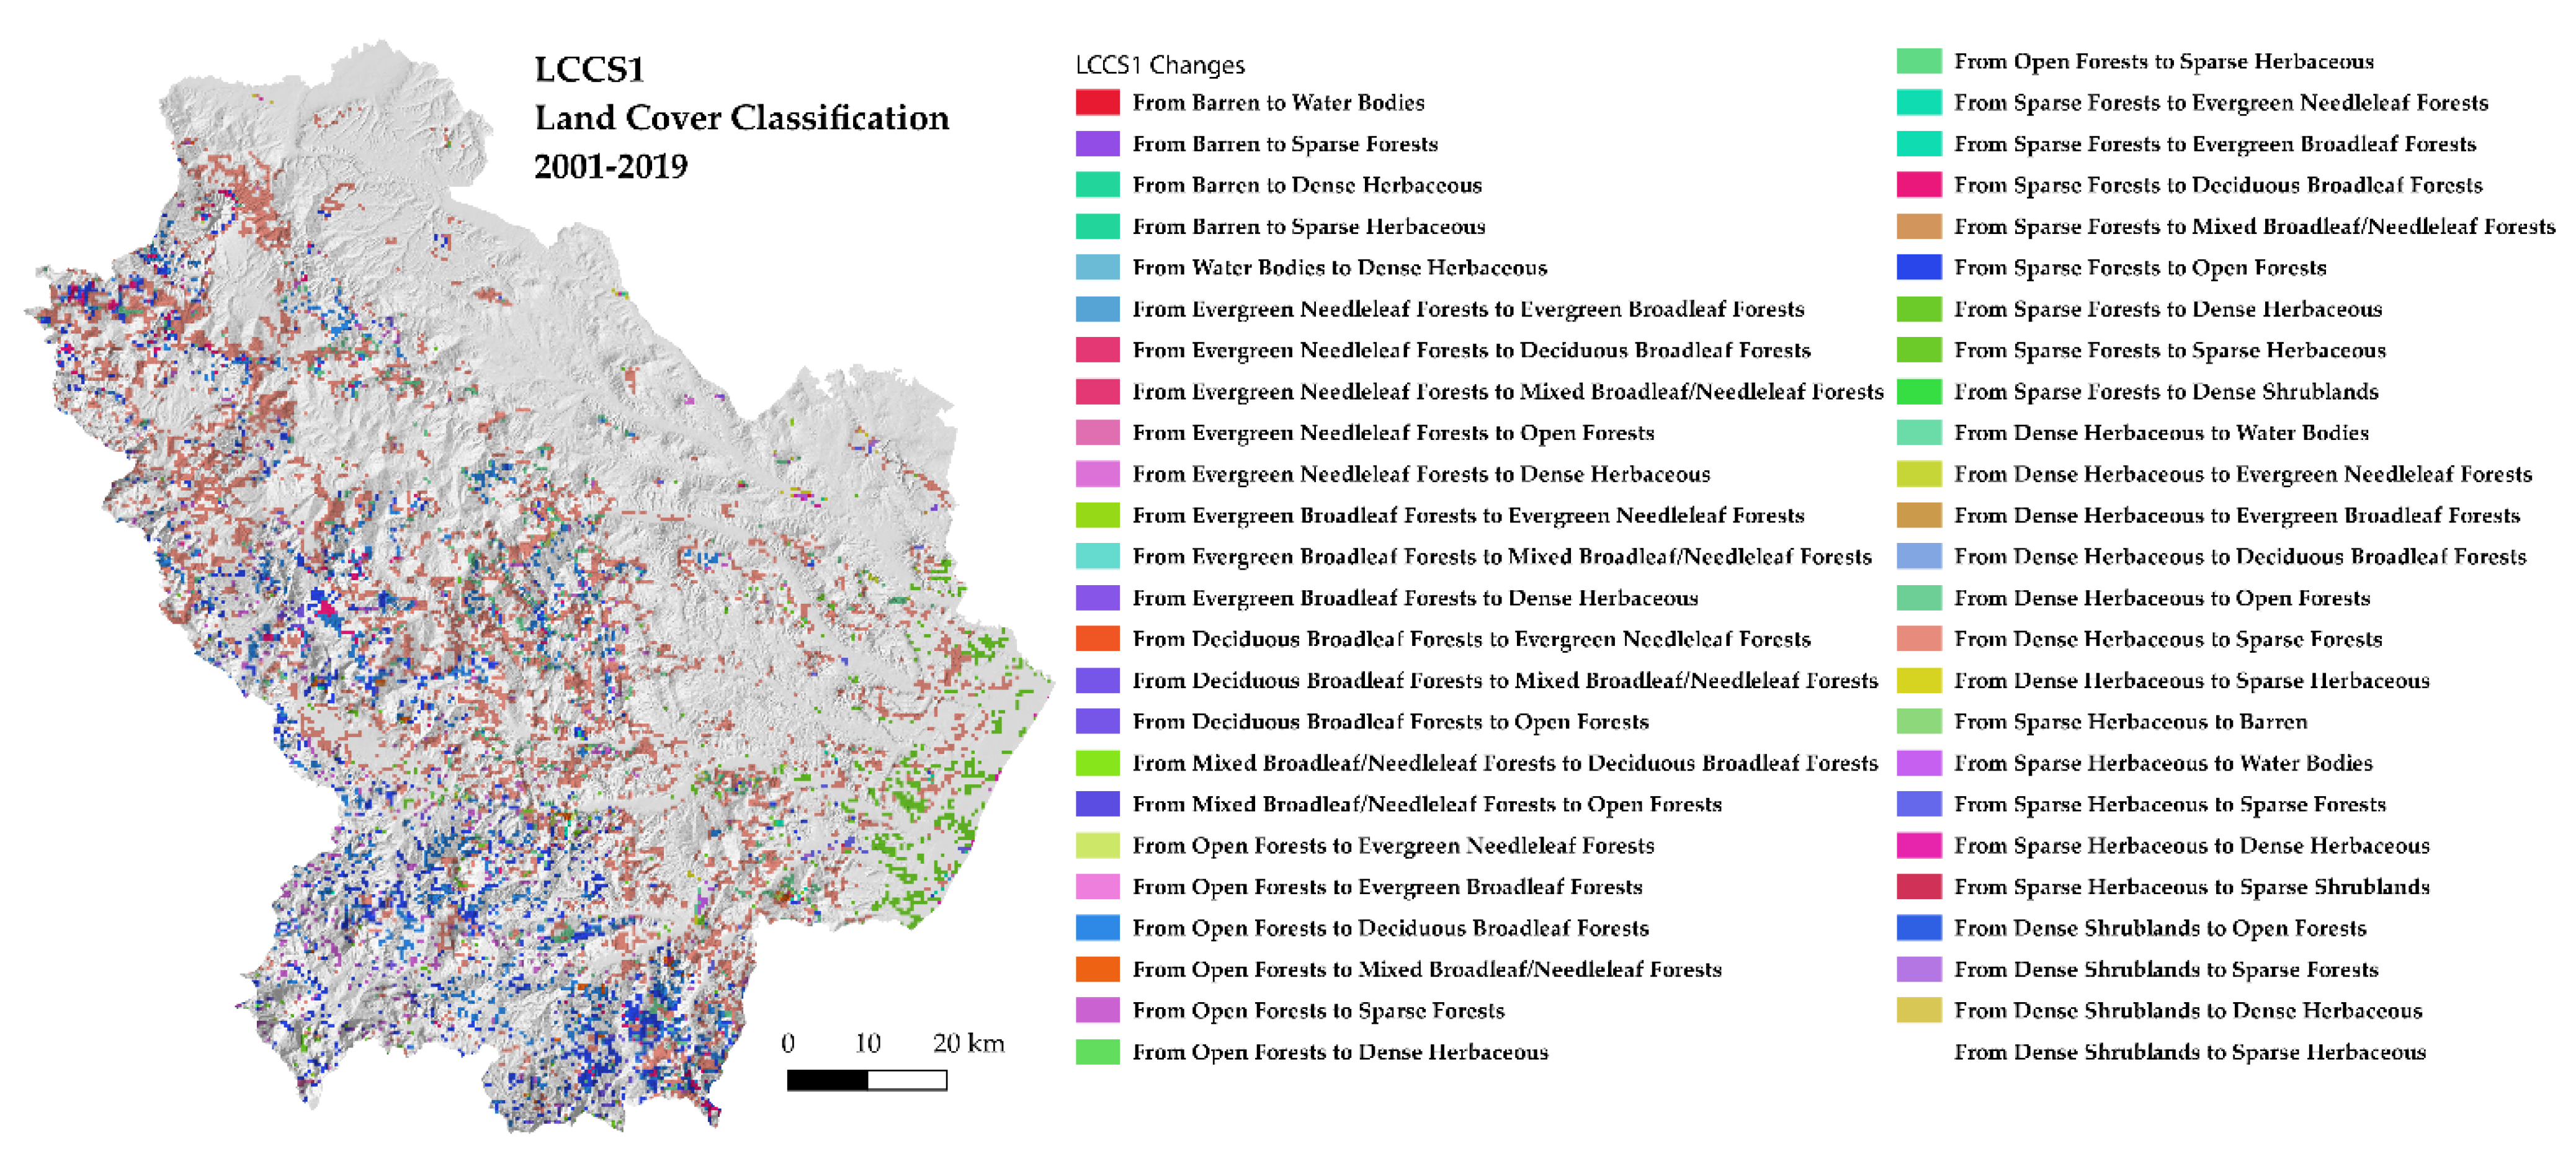
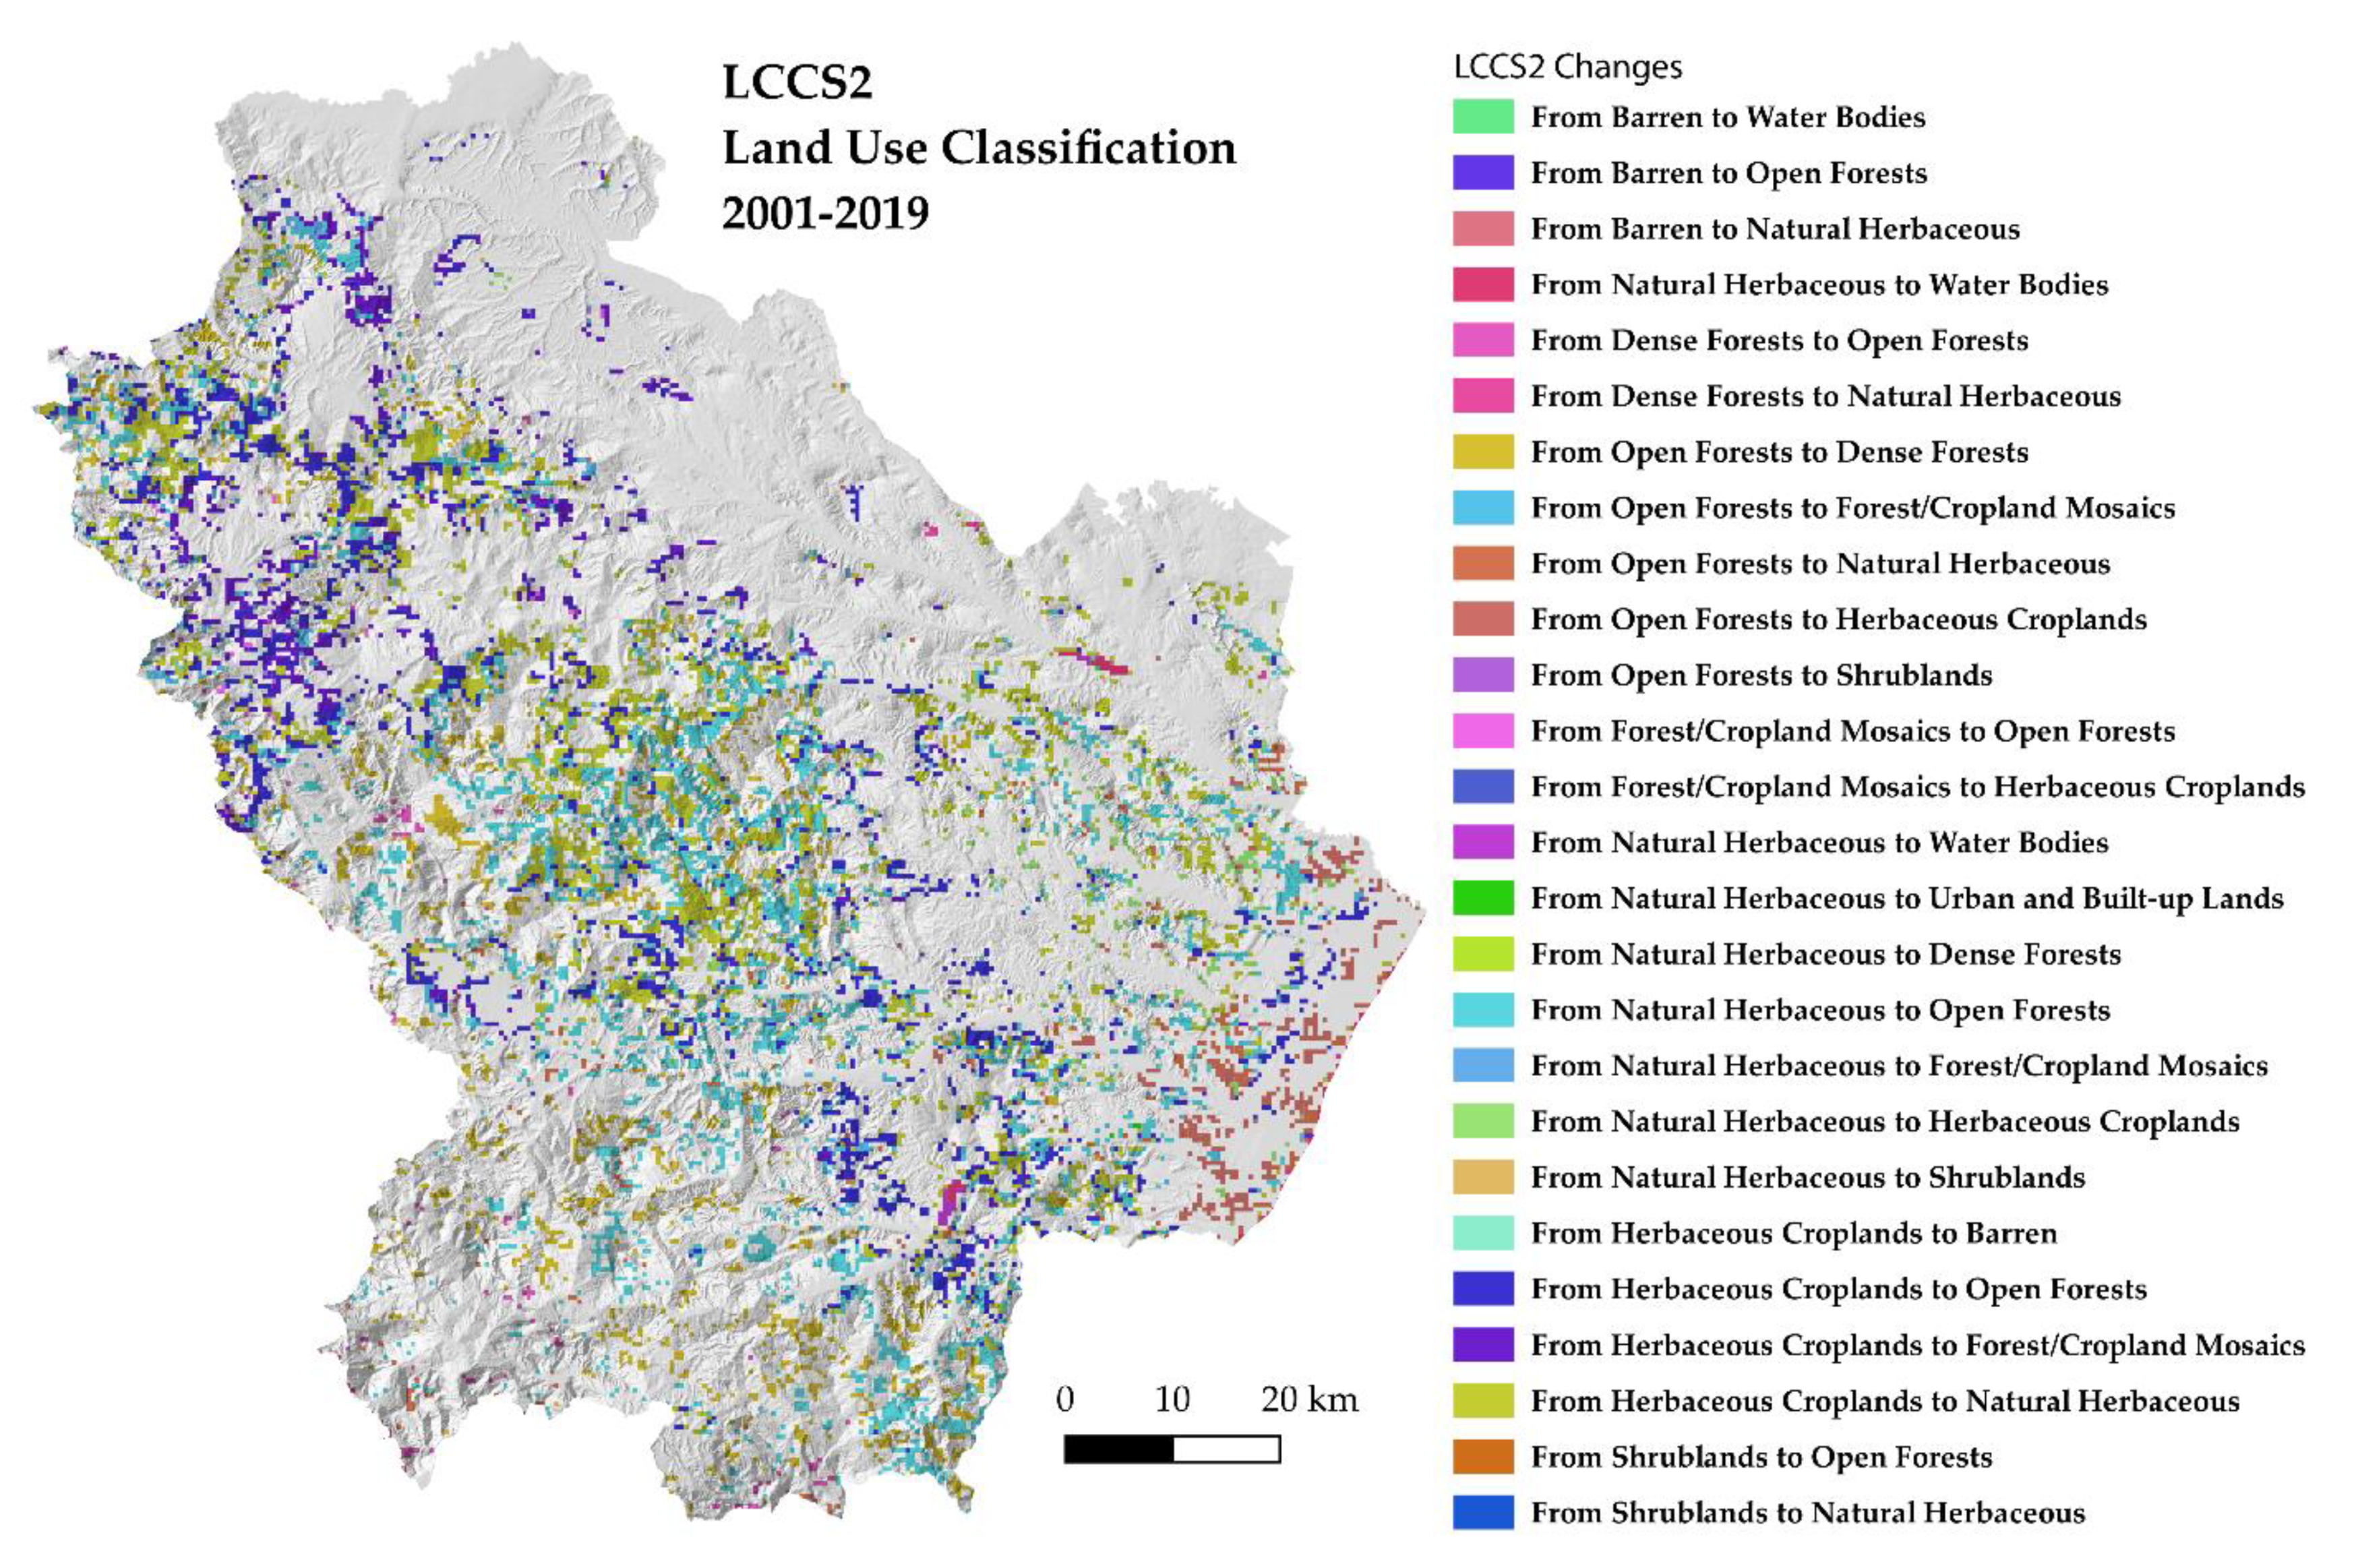
3.2. LULC 2001–2019 Dynamics Mapping
4. Discussion
4.1. LULC Changes in Basilicata Region: The Land Abandonment Issue
4.2. How to Use LULC Data in Sustainable Environmental Planning
5. Conclusions
Author Contributions
Funding
Institutional Review Board Statement
Informed Consent Statement
Data Availability Statement
Conflicts of Interest
Appendix A

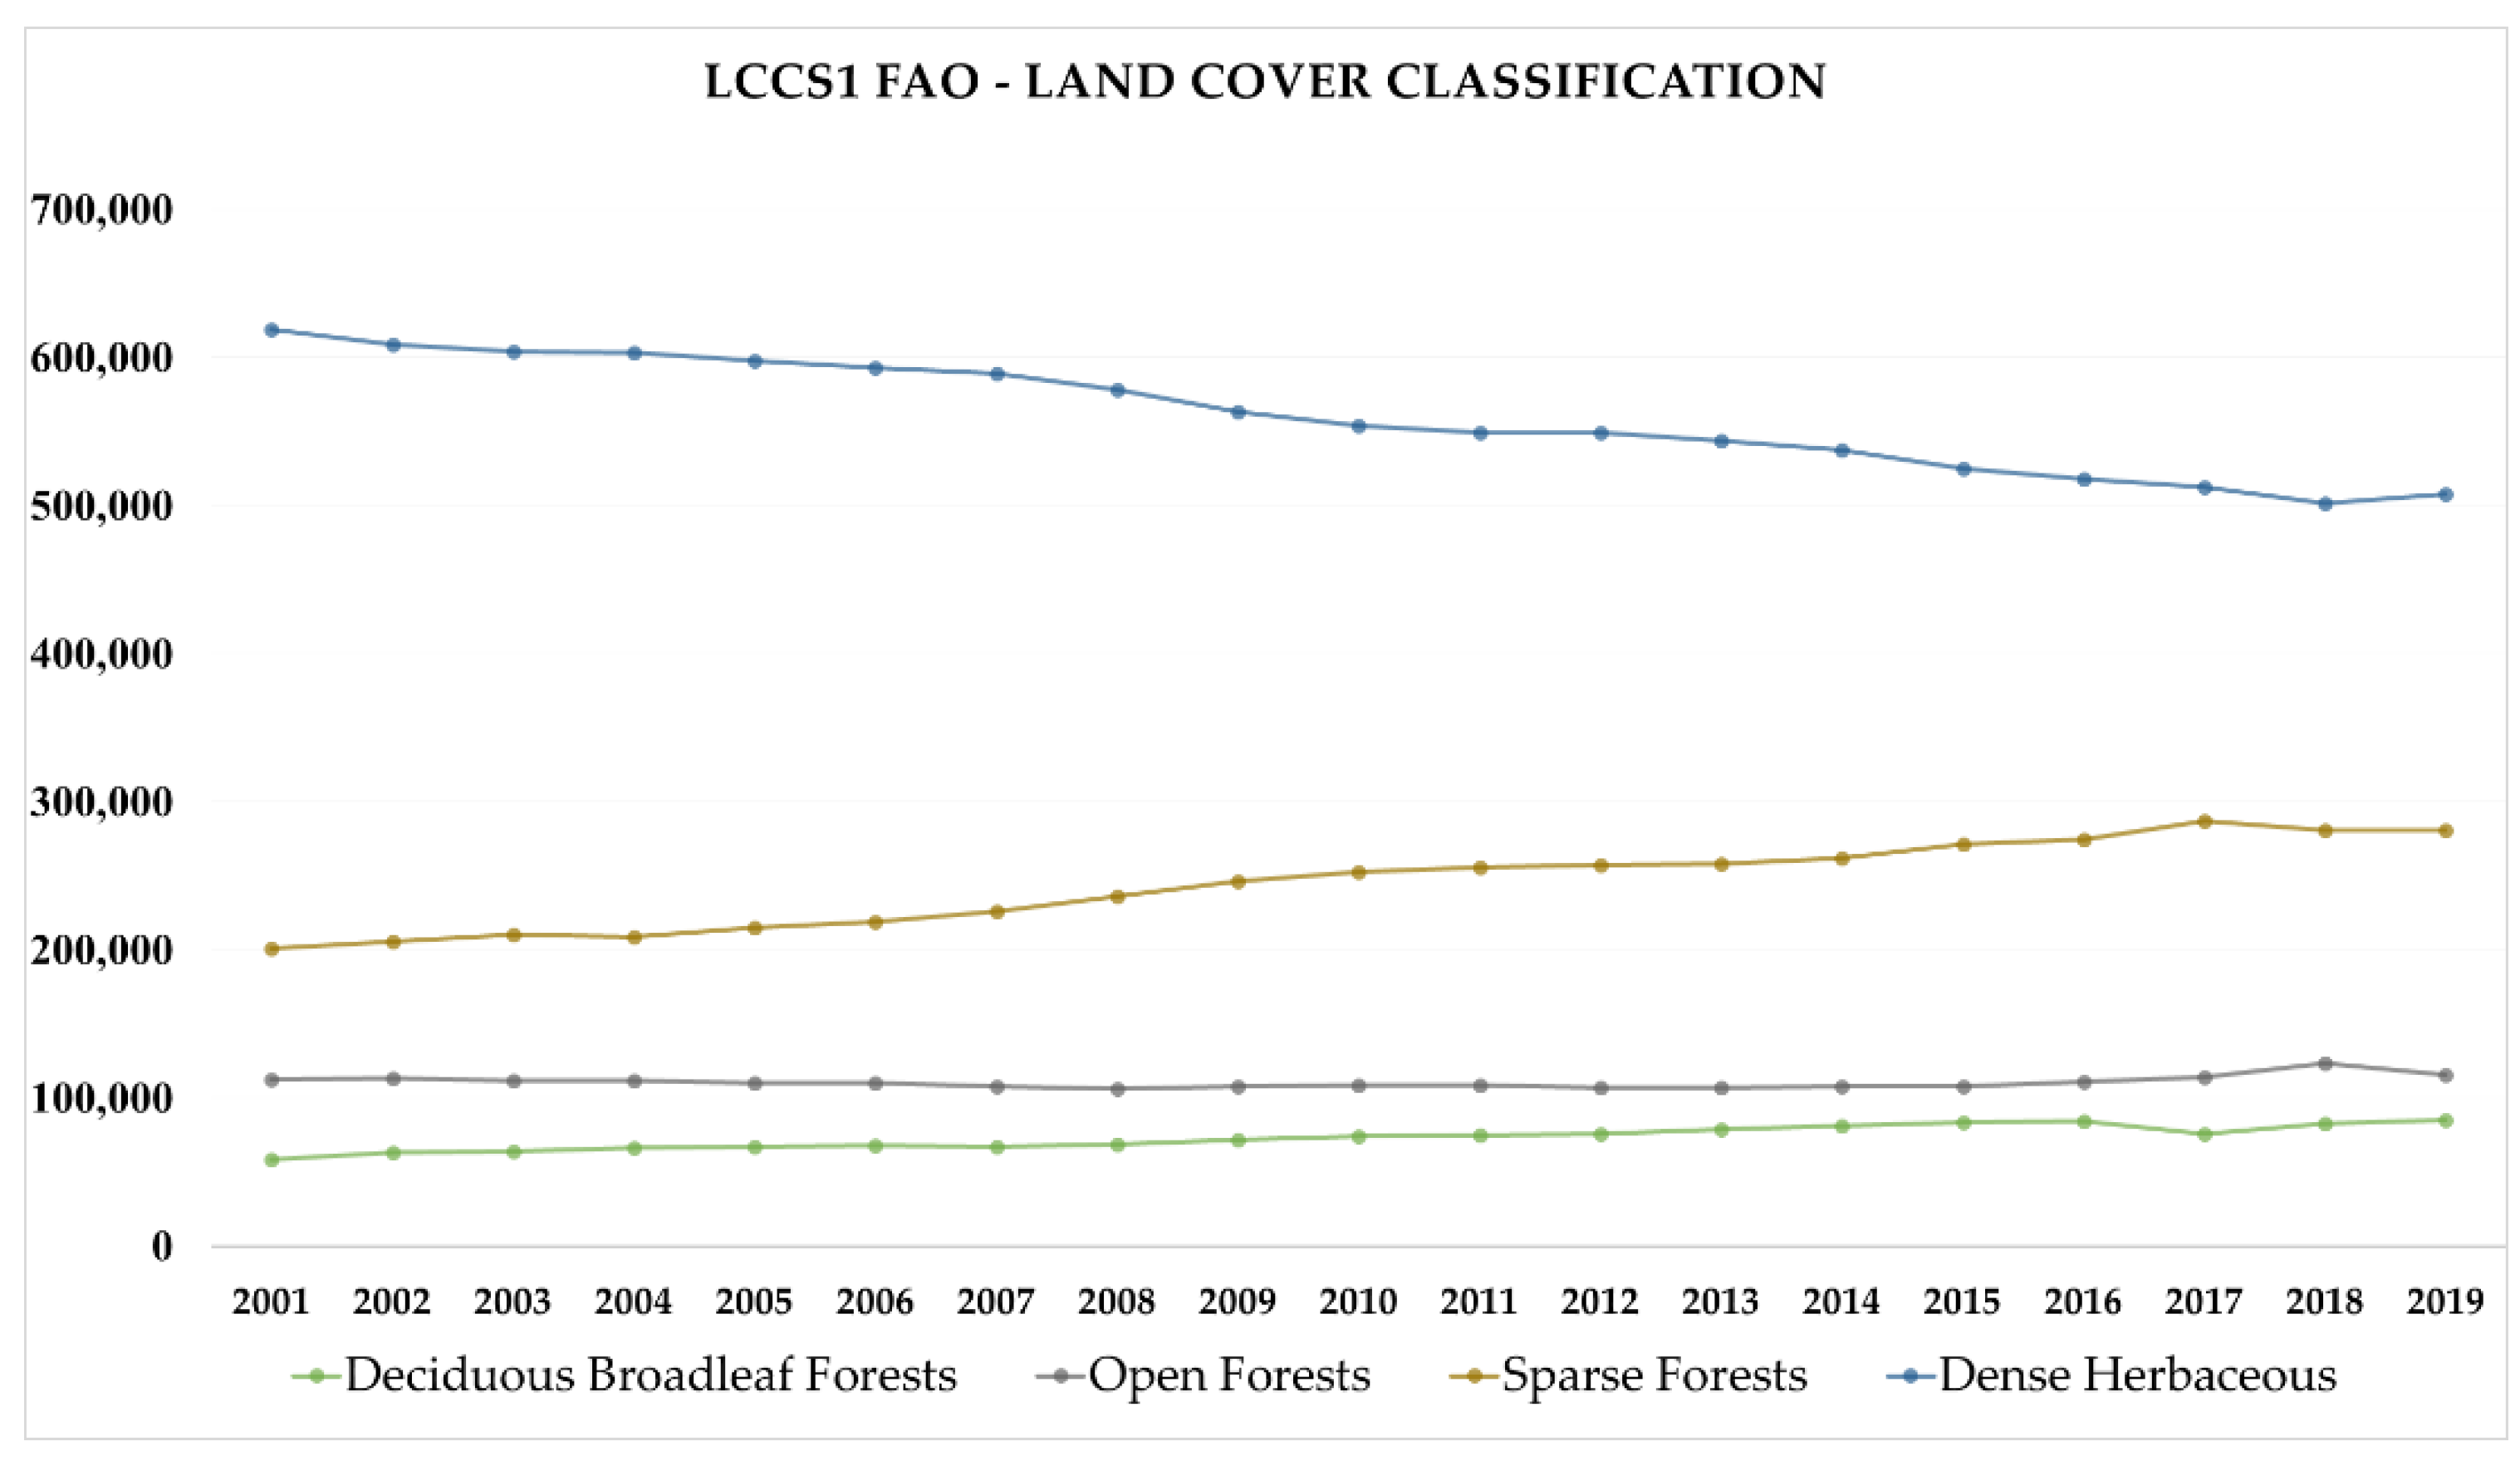
| LCCS1 FAO Land Cover Classification | 2001 | 2002 | 2003 | 2004 | 2005 | 2006 | 2007 | 2008 | 2009 |
|---|---|---|---|---|---|---|---|---|---|
| Barren | 112.68 | 94.2 | 74.84 | 37 | 55.48 | 55.48 | 55.48 | 55.48 | 37 |
| Water Bodies | 948.32 | 948.32 | 1359.4 | 1472.96 | 1529.28 | 1548.64 | 1492.28 | 1416.6 | 1472.92 |
| Evergreen Needleleaf Forests | 1954.52 | 2100.72 | 2416.2 | 2527.72 | 2547.08 | 2750.48 | 3008.48 | 3174.04 | 3438 |
| Evergreen Needleleaf Forests | 578.92 | 559.56 | 502.36 | 546.56 | 528.92 | 621.36 | 639 | 733.2 | 770.16 |
| Deciduous Broadleaf Forests | 58,543.2 | 62,770 | 64,121 | 66,232.8 | 66,616 | 67,664.88 | 66,682.28 | 68,883.44 | 71,472.32 |
| Mixed Broadleaf/Needleleaf Forests | 1351.88 | 1517.4 | 1498.96 | 1613.36 | 1637.4 | 1618.04 | 1686.44 | 1785.28 | 1955.12 |
| Mixed Broadleaf Evergreen/Deciduous Forests | 0 | 18.48 | 18.48 | 18.48 | 18.48 | 0 | 0 | 0 | 0 |
| Open Forests | 112,531.6 | 113,215.2 | 111,717.9 | 111,412.6 | 109,913.9 | 109,603.6 | 107,447.3 | 106,280.2 | 107,327.4 |
| Sparse Forests | 200,917.6 | 205,488.6 | 210,025.2 | 208,493.7 | 215,132.3 | 218,783.2 | 225,841.5 | 235,837.1 | 246,447.5 |
| Dense Herbaceous | 618,775.4 | 608,930.8 | 603,828.8 | 603,152.6 | 597,643.4 | 592,977 | 588,996.4 | 577,810.6 | 563,009.5 |
| Sparse Herbaceous | 2541.88 | 2626.48 | 2661.48 | 2753.04 | 2656.24 | 2655.68 | 2391.6 | 2338.72 | 2509.24 |
| Dense Shrublands | 19.36 | 19.36 | 124.48 | 124.48 | 124.48 | 124.48 | 162.32 | 126.2 | 58.04 |
| Shrubland/Grassland Mosaics | 0 | 0 | 0 | 0 | 0 | 0 | 0 | 0 | 0 |
| Sparse Shrublands | 352.28 | 338.32 | 278.32 | 242.2 | 224.56 | 224.56 | 224.44 | 186.6 | 130.28 |
| Total ha | 998,627.5 | 998,627.5 | 998,627.5 | 998,627.5 | 998,627.5 | 998,627.5 | 998,627.5 | 998,627.5 | 998,627.5 |
| LCCS1 FAO Land Cover Classification | 2010 | 2011 | 2012 | 2013 | 2014 | 2015 | 2016 | 2017 | 2018 | 2019 |
|---|---|---|---|---|---|---|---|---|---|---|
| Barren | 37 | 37 | 0 | 0 | 0 | 0 | 0 | 72.24 | 36.96 | 18.12 |
| Water Bodies | 1546.88 | 1546.88 | 1546.88 | 1546.88 | 1565.4 | 1546.04 | 1546.04 | 1417.48 | 1360.28 | 1398.12 |
| Evergreen Needleleaf Forests | 3480.12 | 3402.72 | 3290.2 | 3721.84 | 3922.04 | 3939.72 | 4219.6 | 3240 | 3310.52 | 2857.68 |
| Evergreen Needleleaf Forests | 915.44 | 933.08 | 861.68 | 857.72 | 819.04 | 966.96 | 1044.4 | 725.48 | 804.04 | 737.48 |
| Deciduous Broadleaf Forests | 73,946.84 | 74,658.72 | 75,213.92 | 78,732 | 80,920.08 | 83,260.76 | 84,433.44 | 75,394.12 | 82,626.64 | 84,858.88 |
| Mixed Broadleaf/Needleleaf Forests | 2138.28 | 2157.6 | 2176.92 | 2325.68 | 2399.64 | 2437.48 | 2531.68 | 2587.16 | 2817.68 | 3043 |
| Mixed Broadleaf Evergreen/Deciduous Forests | 0 | 0 | 0 | 0 | 0 | 0 | 0 | 0 | 0 | 0 |
| Open Forests | 108,107.7 | 108,750.2 | 106,949.3 | 107,226.9 | 107,991 | 107,975.6 | 110,473 | 113,571.2 | 123,155.4 | 115,352.8 |
| Sparse Forests | 252,090.5 | 255,866.2 | 257,172.9 | 258,011.4 | 261,518.9 | 271,047.5 | 274,272.2 | 287,065.6 | 280,804.2 | 280,479.8 |
| Dense Herbaceous | 553,835.1 | 548,699.3 | 548,881.2 | 543,763.8 | 537,078.1 | 525,169.8 | 517,828 | 512,387.7 | 501,595.2 | 507,961.2 |
| Sparse Herbaceous | 2378.28 | 2426.12 | 2385.64 | 2270.96 | 2260.64 | 2117.16 | 2130.32 | 2019.44 | 1948.4 | 1752.32 |
| Dense Shrublands | 39.56 | 37.84 | 18.48 | 22.32 | 22.32 | 18.48 | 18.48 | 18.48 | 18.48 | 18.48 |
| Shrubland/Grassland Mosaics | 0 | 0 | 0 | 0 | 0 | 0 | 0 | 0 | 0 | 0 |
| Sparse Shrublands | 111.8 | 111.8 | 130.28 | 147.92 | 130.28 | 147.92 | 130.48 | 128.56 | 149.64 | 149.64 |
| Total ha | 998,627.5 | 998,627.5 | 998,627.5 | 998,627.5 | 998,627.5 | 998,627.5 | 998,627.5 | 998,627.5 | 998,627.5 | 998,627.5 |
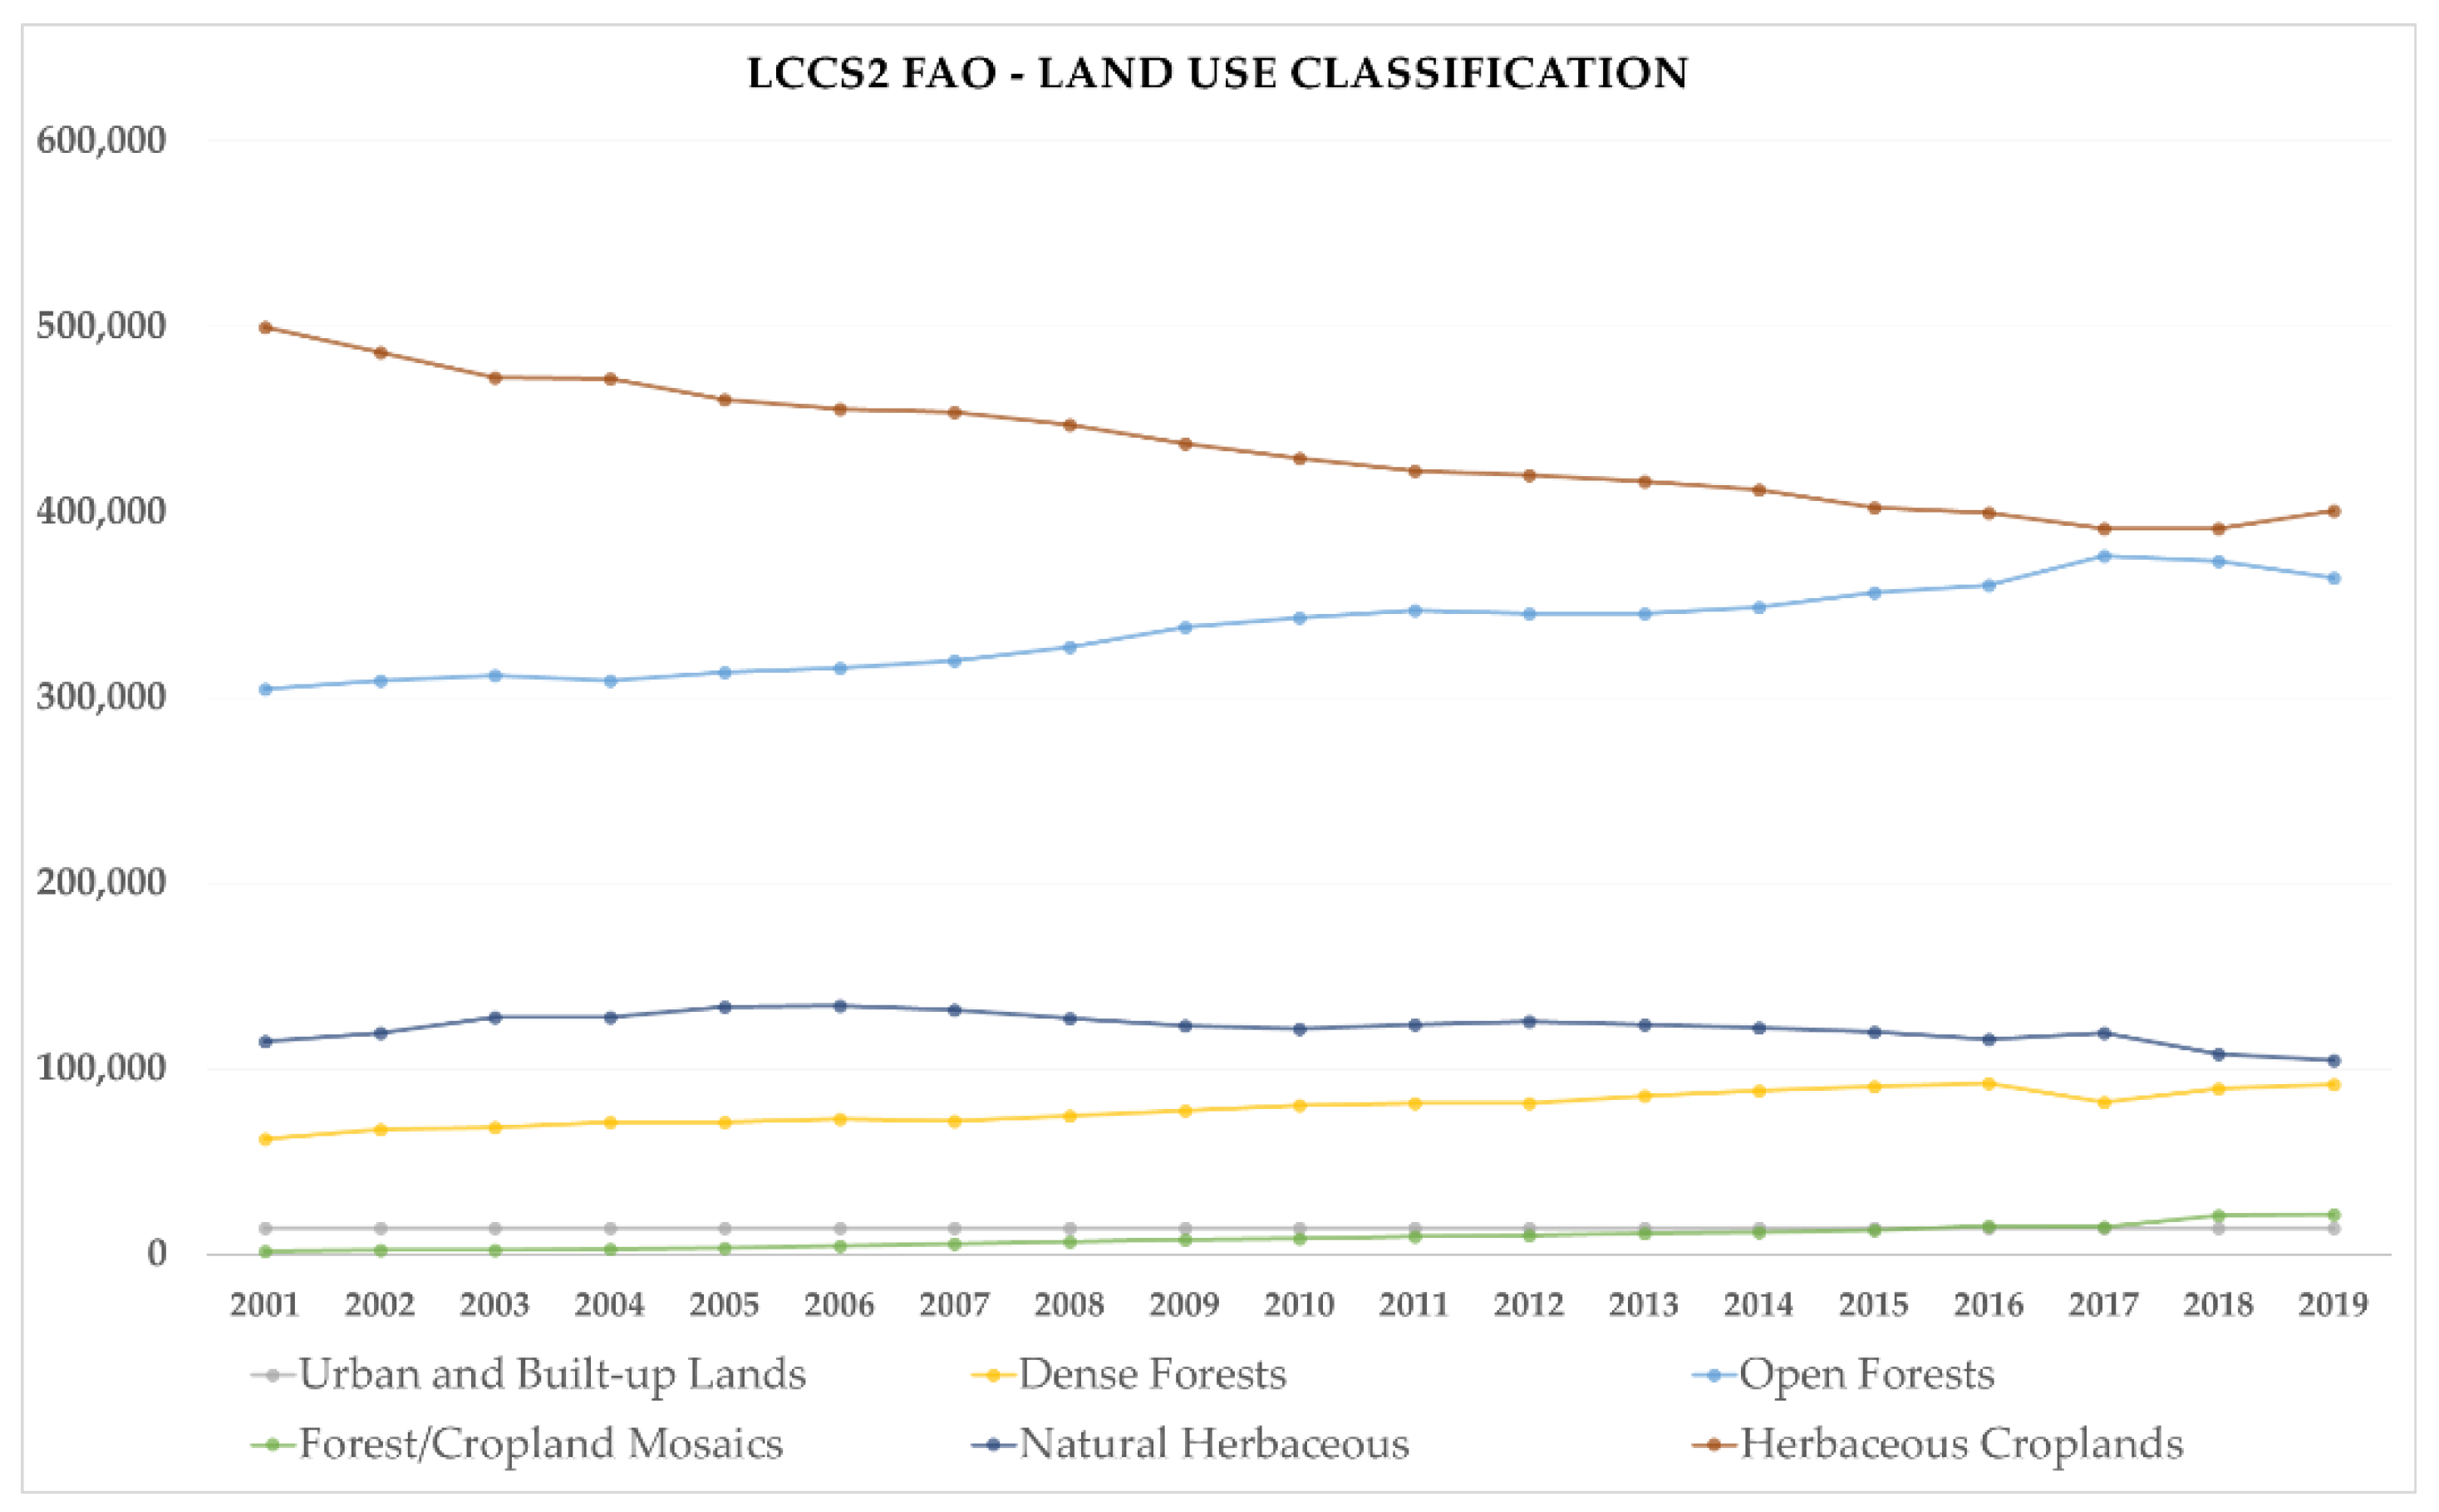
| LCCS2 Class FAO Land Use Classification | 2001 | 2002 | 2003 | 2004 | 2005 | 2006 | 2007 | 2008 | 2009 |
|---|---|---|---|---|---|---|---|---|---|
| Barren | 112.68 | 94.2 | 74.84 | 37 | 55.48 | 55.48 | 55.48 | 55.48 | 37 |
| Water Bodies | 948.32 | 948.32 | 1359.4 | 1472.96 | 1529.28 | 1548.64 | 1492.28 | 1416.6 | 1472.92 |
| Urban and Built-up Lands | 13,853.84 | 13,853.84 | 13,853.84 | 13,853.84 | 13,853.84 | 13,853.84 | 13,853.84 | 13,853.84 | 13,853.84 |
| Dense Forests | 62,428.52 | 66,966.16 | 68,557 | 70,938.92 | 71,347.88 | 72,637.12 | 71,998.56 | 74,558.32 | 77,617.96 |
| Open Forests | 304,700.2 | 309,294.2 | 311,948.8 | 309,318 | 313,914.3 | 316,053 | 319,913.8 | 327,386.6 | 337,947.8 |
| Forest/Cropland Mosaics | 1816.48 | 2061.24 | 2276.36 | 2998.96 | 3487.92 | 4690.84 | 5685.92 | 6778.44 | 7689.12 |
| Natural Herbaceous | 114,761.6 | 119,396.6 | 127,987.3 | 127,535 | 133,435.8 | 133,776.4 | 131,611.3 | 127,017.6 | 123,119.7 |
| Herbaceous Croplands | 499,838.8 | 485,859.4 | 472,335.2 | 472,274.2 | 460,804.4 | 455,813.6 | 453,780.1 | 447,360.5 | 436,757.2 |
| Shrublands | 167.4 | 153.44 | 234.68 | 198.56 | 198.56 | 198.56 | 236.28 | 200.16 | 132 |
| Total ha | 998,627.5 | 998,627.5 | 998,627.5 | 998,627.5 | 998,627.5 | 998,627.5 | 998,627.5 | 998,627.5 | 998,627.5 |
| Class FAO Land Use Classification | 2010 | 2011 | 2012 | 2013 | 2014 | 2015 | 2016 | 2017 | 2018 | 2019 |
|---|---|---|---|---|---|---|---|---|---|---|
| Barren | 37 | 37 | 0 | 0 | 0 | 0 | 0 | 72.24 | 36.96 | 18.12 |
| Water Bodies | 1546.88 | 1546.88 | 1546.88 | 1546.88 | 1565.4 | 1546.04 | 1546.04 | 1417.48 | 1360.28 | 1398.12 |
| Urban and Built-up Lands | 13,853.84 | 13,853.84 | 13,873.2 | 13,892.56 | 13,892.56 | 13,892.56 | 13,892.56 | 13,892.56 | 13,911.04 | 13,911.04 |
| Dense Forests | 80,463.04 | 81,134.48 | 81,525.08 | 85,619.6 | 88,043.16 | 90,587.28 | 92,211.48 | 81,929.12 | 89,541.24 | 91,479.4 |
| Open Forests | 343,136.5 | 346,825.2 | 345,448.2 | 345,399.5 | 348,816.4 | 356,910 | 360,547.4 | 376,516.6 | 373,563.3 | 364,824.2 |
| Forest/Cropland Mosaics | 8701.08 | 9336.56 | 10,219.4 | 11,327.92 | 12,086.68 | 13,172.68 | 15,039.88 | 14,506.24 | 20,847.52 | 21,572.16 |
| Natural Herbaceous | 121,777.4 | 123,534.9 | 125,697.4 | 123,953.8 | 121,984.6 | 120,098.7 | 115,763.8 | 119,012.9 | 107,851.6 | 104,483.6 |
| Herbaceous Croplands | 428,998.2 | 422,246.8 | 420,206.3 | 416,772.5 | 412,123.9 | 402,309.2 | 399,515.4 | 391,188.8 | 391,386.1 | 400,829.9 |
| Shrublands | 113.52 | 111.8 | 110.92 | 114.76 | 114.76 | 110.92 | 110.92 | 91.56 | 129.4 | 110.92 |
| Total ha | 998,627.5 | 998,627.5 | 998,627.5 | 998,627.5 | 998,627.5 | 998,627.5 | 998,627.5 | 998,627.5 | 998,627.5 | 998,627.5 |
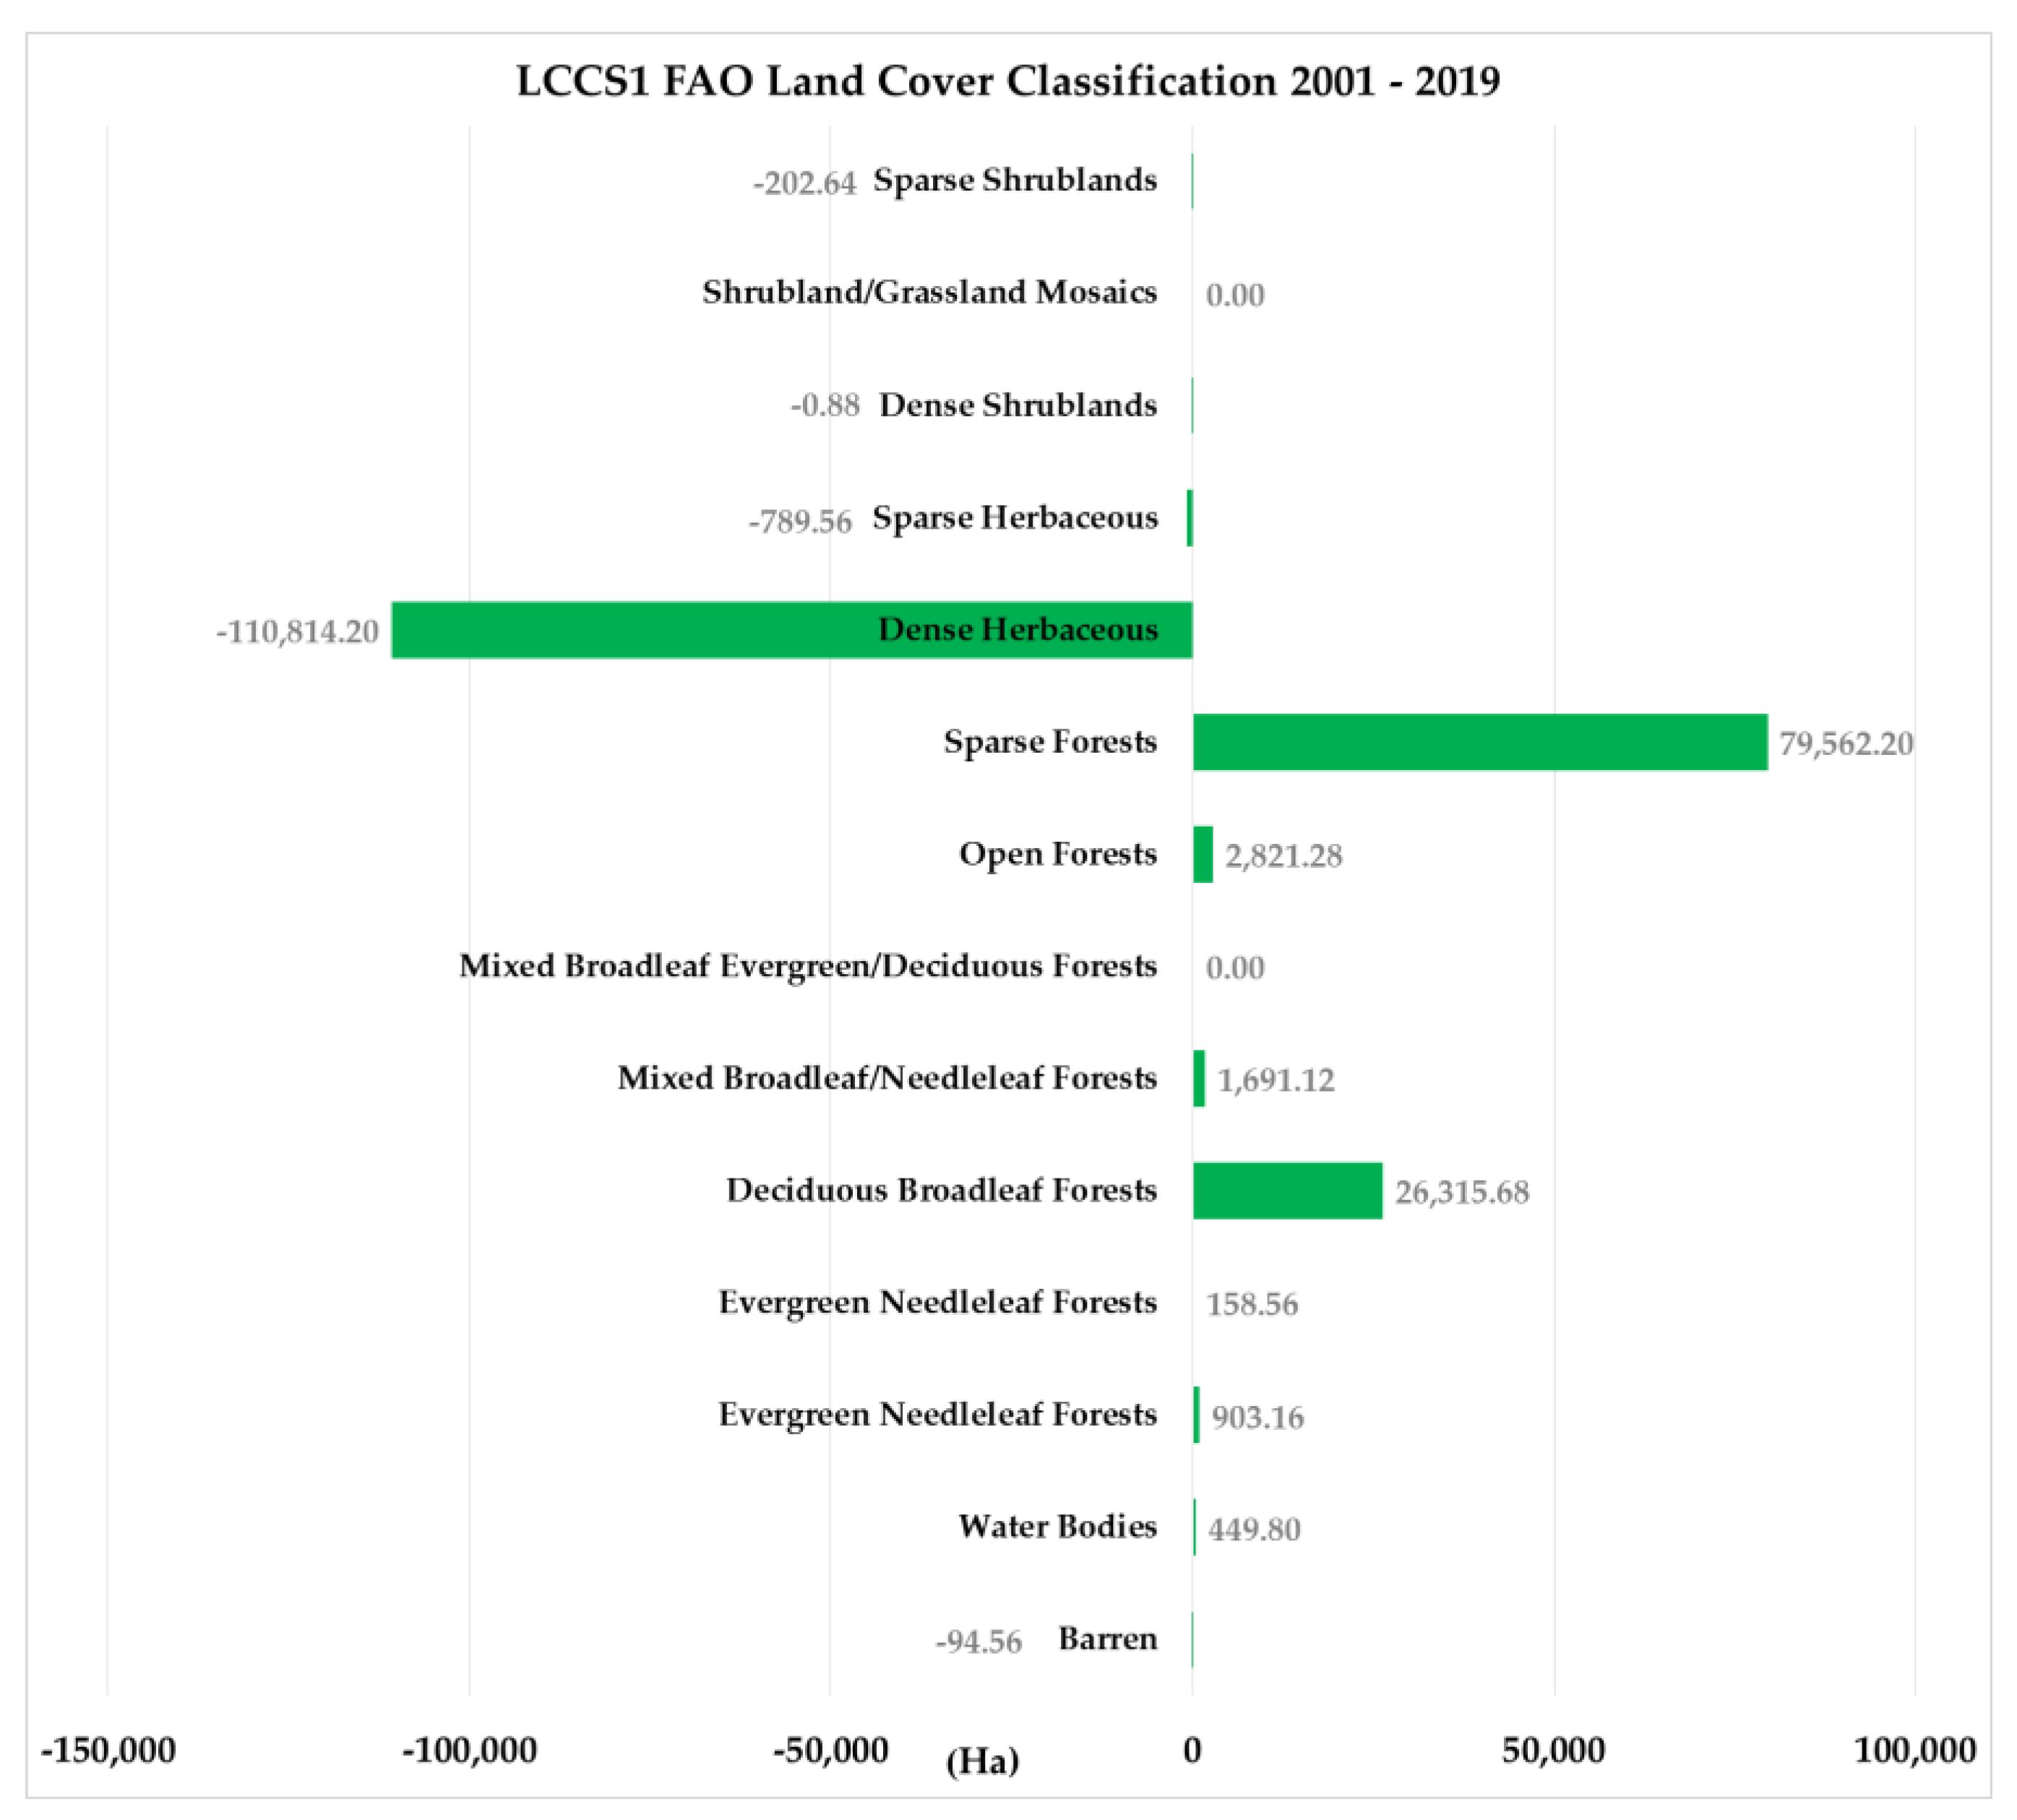
| LCCS1 Dynamics | Hectares (Ha) |
|---|---|
| No changes | 790,339.836 |
| From Barren to Water Bodies | 19.369 |
| From Barren to Sparse Forests | 37.853 |
| From Barren to Dense Herbaceous | 18.491 |
| From Barren to Sparse Herbaceous | 37.015 |
| From Water Bodies to Dense Herbaceous | 18.489 |
| From Evergreen Needleleaf Forests to Evergreen Broadleaf Forests | 37.859 |
| From Evergreen Needleleaf Forests to Deciduous Broadleaf Forests | 17.654 |
| From Evergreen Needleleaf Forests to Mixed Broadleaf/Needleleaf Forests | 241.335 |
| From Evergreen Needleleaf Forests to Open Forests | 150.07 |
| From Evergreen Needleleaf Forests to Dense Herbaceous | 205.226 |
| From Evergreen Broadleaf Forests to Evergreen Needleleaf Forests | 90.768 |
| From Evergreen Broadleaf Forests to Mixed Broadleaf/Needleleaf Forests | 27.215 |
| From Evergreen Broadleaf Forests to Dense Herbaceous | 93.361 |
| From Deciduous Broadleaf Forests to Evergreen Needleleaf Forests | 18.495 |
| From Deciduous Broadleaf Forests to Mixed Broadleaf/Needleleaf Forests | 524.909 |
| From Deciduous Broadleaf Forests to Open Forests | 1823.329 |
| From Mixed Broadleaf/Needleleaf Forests to Deciduous Broadleaf Forests | 167.392 |
| From Mixed Broadleaf/Needleleaf Forests to Open Forests | 49.958 |
| From Open Forests to Evergreen Needleleaf Forests | 821.006 |
| From Open Forests to Evergreen Broadleaf Forests | 91.667 |
| From Open Forests to Deciduous Broadleaf Forests | 24,327.13 |
| From Open Forests to Mixed Broadleaf/Needleleaf Forests | 983.941 |
| From Open Forests to Sparse Forests | 9910.89 |
| From Open Forests to Dense Herbaceous | 32.503 |
| From Open Forests to Sparse Herbaceous | 5.404 |
| From Sparse Forests to Evergreen Needleleaf Forests | 367.452 |
| From Sparse Forests to Evergreen Broadleaf Forests | 166.524 |
| From Sparse Forests to Deciduous Broadleaf Forests | 3762.949 |
| From Sparse Forests to Mixed Broadleaf/Needleleaf Forests | 131.255 |
| From Sparse Forests to Open Forests | 25,988.271 |
| From Sparse Forests to Dense Herbaceous | 12,582.242 |
| From Sparse Forests to Sparse Herbaceous | 161.467 |
| From Sparse Forests to Dense Shrublands | 18.495 |
| From Dense Herbaceous to Water Bodies | 111.862 |
| From Dense Herbaceous to Evergreen Needleleaf Forests | 258.088 |
| From Dense Herbaceous to Evergreen Broadleaf Forests | 73.948 |
| From Dense Herbaceous to Deciduous Broadleaf Forests | 425.624 |
| From Dense Herbaceous to Open Forests | 10,963.766 |
| From Dense Herbaceous to Sparse Forests | 111,841.977 |
| From Dense Herbaceous to Sparse Herbaceous | 425.434 |
| From Sparse Herbaceous to Barren | 18.131 |
| From Sparse Herbaceous to Water Bodies | 337.298 |
| From Sparse Herbaceous to Sparse Forests | 837.554 |
| From Sparse Herbaceous to Dense Herbaceous | 244.87 |
| From Sparse Herbaceous to Sparse Shrublands | 18.488 |
| From Dense Shrublands to Open Forests | 19.372 |
| From Dense Shrublands to Sparse Forests | 147.987 |
| From Dense Shrublands to Dense Herbaceous | 36.142 |
| From Dense Shrublands to Sparse Herbaceous | 37.102 |
| Total ha | 999,067.5 |
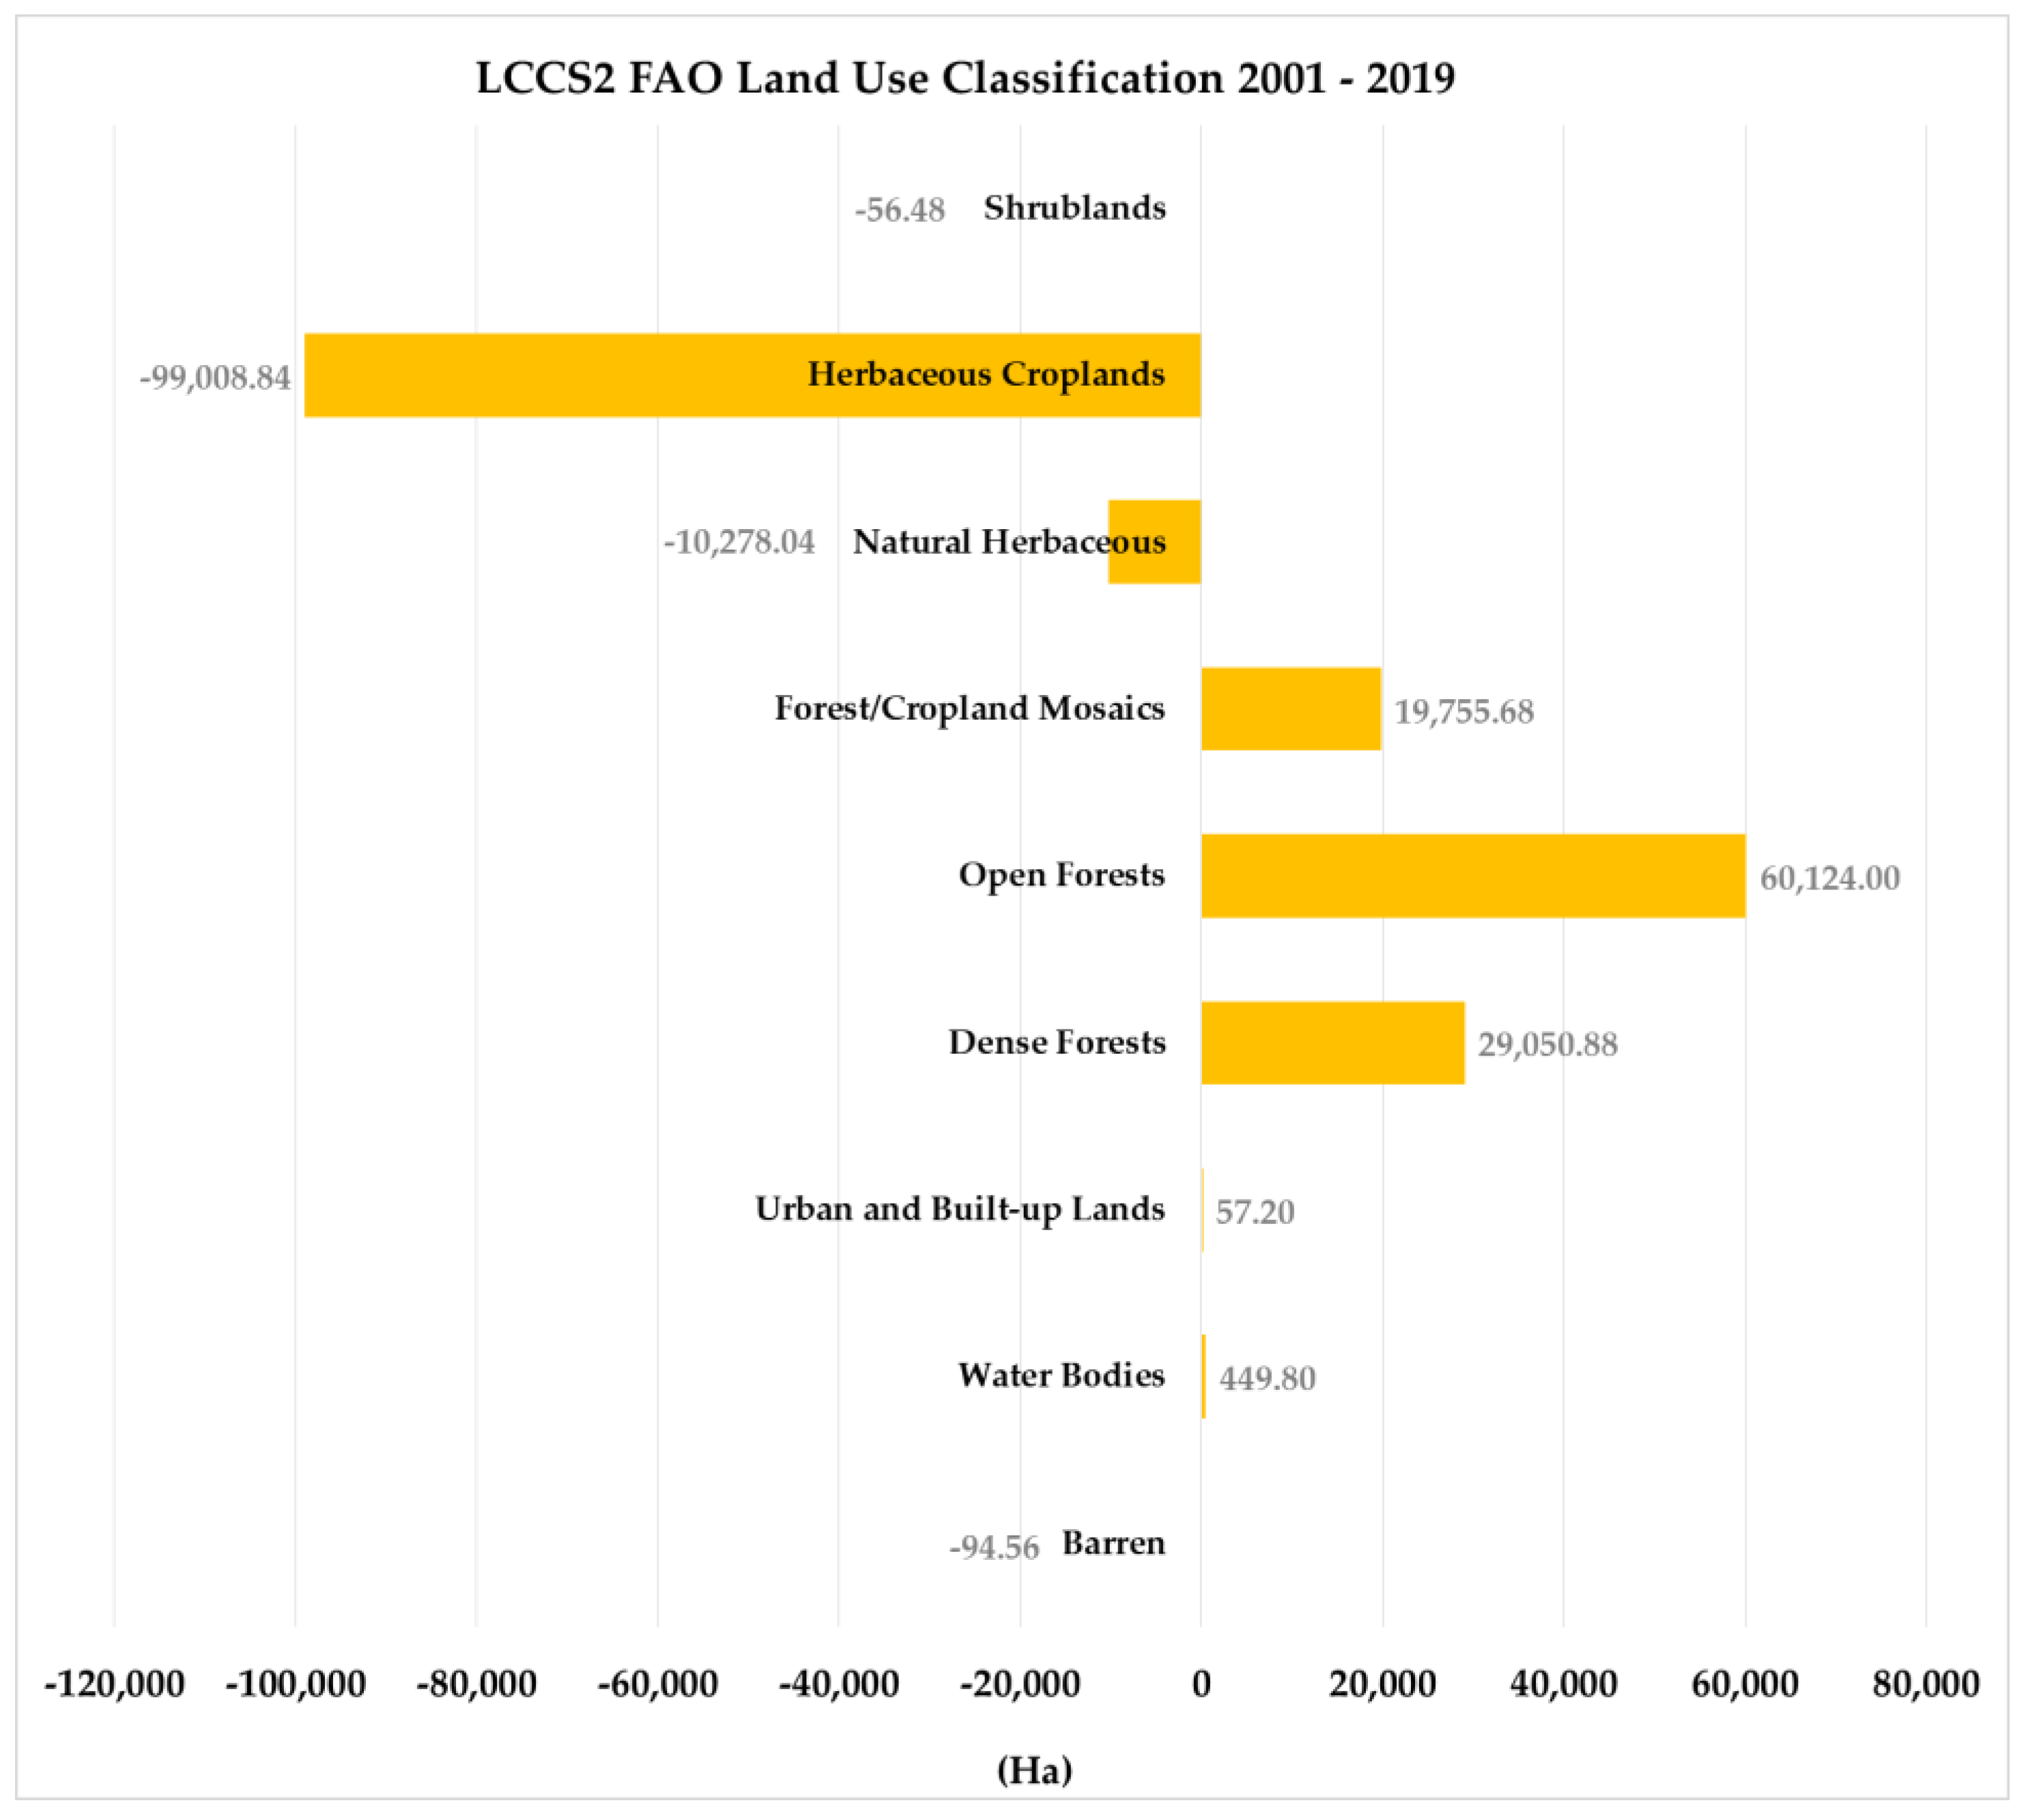
| LCCS2 Dynamics | Hectares (Ha) |
|---|---|
| No changes | 769,206.8 |
| From Barren to Water Bodies | 19.368 |
| From Barren to Open Forests | 37.85 |
| From Barren to Natural Herbaceous | 55.502 |
| From Natural Herbaceous to Water Bodies | 930.211 |
| From Dense Forests to Open Forests | 2023.931 |
| From Dense Forests to Natural Herbaceous | 298.566 |
| From Open Forests to Dense Forests | 30,633.88 |
| From Open Forests to Forest/Cropland Mosaics | 3906.066 |
| From Open Forests to Natural Herbaceous | 5485.824 |
| From Open Forests to Herbaceous Croplands | 6672.287 |
| From Open Forests to Shrublands | 18.493 |
| From Forest/Cropland Mosaics to Open Forests | 633.134 |
| From Forest/Cropland Mosaics to Herbaceous Croplands | 73.999 |
| From Natural Herbaceous to Water Bodies | 449.126 |
| From Natural Herbaceous to Urban and Built-up Lands | 57.222 |
| From Natural Herbaceous to Dense Forests | 757.608 |
| From Natural Herbaceous to Open Forests | 62,898.49 |
| From Natural Herbaceous to Forest/Cropland Mosaics | 727.139 |
| From Natural Herbaceous to Herbaceous Croplands | 3952.81 |
| From Natural Herbaceous to Shrublands | 18.487 |
| From Herbaceous Croplands to Barren | 18.13 |
| From Herbaceous Croplands to Open Forests | 40,876.07 |
| From Herbaceous Croplands to Forest/Cropland Mosaics | 15,842.99 |
| From Herbaceous Croplands to Natural Herbaceous | 52,940.09 |
| From Shrublands to Open Forests | 93.362 |
| From Shrublands to Natural Herbaceous | 0.12 |
| TOT | 998,627.5 |
References
- UN General Assembly, Transforming Our World: The 2030 Agenda for Sustainable Development, 21 October 2015, A/RES/70/1. Available online: https://www.refworld.org/docid/57b6e3e44.html (accessed on 30 September 2021).
- UN. Integrated Approach to the Planning & Management of Land Resources. Available online: https://www.un.org/esa/dsd/agenda21/res_agenda21_10.shtml (accessed on 30 September 2021).
- Nkonya, E.; Gerber, N.; Baumgartner, P.; von Braun, J.; De Pinto, A.; Graw, V.; Kato, E.; Kloos, J.; Walter, T. The Economics of Desertification, Land Degradation, and Drought Toward an Integrated Global Assessment (May 2011). ZEF Discussion Papers on Development Policy No. 150. Available online: https://ssrn.com/abstract=1890668 (accessed on 5 September 2021).
- Tepes, A.; Galarraga, I.; Markandya, A.; Sánchez, M.J.S. Costs and benefits of soil protection and sustainable land management practices in selected European countries: Towards multidisciplinary insights. Sci. Total. Environ. 2021, 756, 143925. [Google Scholar] [CrossRef] [PubMed]
- Tsegai, D.; Kaushik, I. Drought risk insurance and sustainable land management: What are the options for integration? In Current Directions in Water Scarcity Research; Mapedza, E., Tsegai, D., Bruntrup, M., Mcleman, R., Eds.; Elsevier: Amsterdam, The Netherlands, 2019; Volume 2, pp. 195–210. [Google Scholar] [CrossRef]
- ISPRA—Rapporto Consumo Di Suolo Dinamiche Territoriali E Servizi. 2021. Available online: https://www.snpambiente.it/2021/07/14/consumo-di-suolo-dinamiche-territoriali-e-servizi-ecosistemici-edizione-2021/ (accessed on 5 July 2021).
- Schwilch, G.; Liniger, H.P.; Hurni, H. Sustainable land management (SLM) practices in drylands: How do they address desertification threats? Environ. Manag. 2014, 54, 983–1004. [Google Scholar] [CrossRef] [PubMed] [Green Version]
- Ferreira, C.S.S.M.; Seifollahi-Aghmiuni, S.; Destouni, G.; Ghajarnia, N.; Kalantari, Z. Soil degradation in the European Mediterranean region: Processes, status and consequences. Sci. Total. Environ. 2021, 805, 150106. [Google Scholar] [CrossRef]
- Esgalhado, C.; Guimarães, H.; Debolini, M.; Guiomar, N.; Lardon, S.; Ferraz de Oliveira, I. A holistic approach to land system dynamics—The Monfurado case in Alentejo, Portugal. Land Use Policy 2020, 95, 104607. [Google Scholar] [CrossRef]
- Ellis, E.; Pontius, R. Land-Use and Land-Cover Change—Encyclopedia of Earth. Available online: https://web.archive.org/web/20070503192914/http://www.eoearth.org/article/Land-use_and_land-cover_change (accessed on 6 June 2021).
- Braimoh, A.K.; Osaki, M. Land-use change and environmental sustainability. Sustain. Sci. 2010, 5, 5. [Google Scholar] [CrossRef] [Green Version]
- Owers, C.J.; Lucas, R.M.; Clewley, D.; Planque, C.; Punalekar, S.; Tissott, B.; Chua, S.M.T.; Bunting, P.; Mueller, N.; Metternicht, G. Living earth: Implementing national standardised land cover classification systems for earth observation in support of sustainable development. Big Earth Data 2021, 5, 368–390. [Google Scholar] [CrossRef]
- Di Gregorio, A.; Jansen, L.J.M. Land Cover Classification System Classification Concepts and User Manual; Food & Agriculture Organization: Rome, Italy, 2005. [Google Scholar]
- Di Gregorio, A. Land Cover Classification System User Manual; Software Version 3; Food and Agriculture Organization of the United Nations: Rome, Italy, 2016; Available online: http://www.fao.org/3/i5428e/i5428e.pdf (accessed on 1 December 2020).
- Coetzee, S.; Ivánová, I.; Mitasova, H.; Brovelli, M.A. Open geospatial software and data: A review of the current state and a perspective into the future. ISPRS Int. J. Geoinf. 2020, 9, 90. [Google Scholar] [CrossRef] [Green Version]
- Santarsiero, V.; Nolè, G.; Lanorte, A.; Tucci, B.; Baldantoni, P.; Murgante, B. Evolution of soil consumption in the municipality of melfi (Southern Italy) in relation to renewable energy. In Lecture Notes in Computer Science, Proceedings of the Computational Science and Its Applications—ICCSA 2019, Saint Petersburg, Russia, 1–4 July 2019; Misra, S., Ed.; Springer: Cham, Switzerland, 2019; Volume 11621, p. 11621. [Google Scholar] [CrossRef]
- Cillis, G.; Statuto, D.; Picuno, P. Integrating remote-sensed and historical geodata to assess interactions between rural buildings and agroforestry land. J. Environ. Eng. Landsc. Manag. 2021, 29, 229–243. [Google Scholar] [CrossRef]
- Vîrghileanu, M.; Săvulescu, I.; Mihai, B.A.; Nistor, C.; Dobre, R. Nitrogen dioxide (NO2) pollution monitoring with sentinel-5P satellite imagery over Europe during the coronavirus pandemic outbreak. Remote Sens. 2020, 12, 3575. [Google Scholar] [CrossRef]
- Turner, W.; Rondinini, C.; Pettorelli, N.; Mora, B.; Leidner, A.; Szantoi, Z.; Buchanan, G.; Dech, S.; Dwyer, J.; Herold, M.; et al. Free and open access satellite data are key to biodiversity conservation. Biol. Conserv. 2015, 182, 173–176. [Google Scholar] [CrossRef] [Green Version]
- Joe, H.; Lamker, C.W.; Taylor, E.J.; Stead, D.; Hellmich, M.; Lange, L.; Rowe, H.; Beeck, S.; Phibbs, P.; Forsyth, A. Exchange between researchers and practitioners in urban planning: Achievable objective or a bridge too far?/The use of academic research in planning practice: Who, what, where, when and how?/Bridging research and practice through collaboration: Lessons from a joint working group/Getting the relationship between researchers and practitioners working/Art and urban planning: Stimulating researcher, practitioner and community engagement/Collaboration between researchers and practitioners: Political and bureaucratic issues/Investigating Research/Conclusion: Breaking down barriers through international practice? Plan. Theory Pract. 2016, 17, 447–473. [Google Scholar] [CrossRef] [Green Version]
- Stuart, O. The Causes of Erosive Land Degradation in the Basilicata Region of Italy. Geography 1999, 84, 331–344. Available online: http://www.jstor.org/stable/40573338 (accessed on 26 August 2021).
- Santarsiero, V.; Nolè, G.; Lanorte, A.; Tucci, B.; Cillis, G.; Scorza, F.; Murgante, B. A remote sensing methodology to assess the abandoned arable land using NDVI index in Basilicata region. In Lecture Notes in Computer Science, Proceedings of the Computational Science and Its Applications—ICCSA 2021, Cagliari, Italy, 13–16 September 2021; Gervasi, O., Ed.; Springer: Cham, Switzerland, 2021; Volume 12954, p. 12954. [Google Scholar] [CrossRef]
- Pellegrini, L.; Tasciotti, L.; Spartaco, A. A regional resource curse? A synthetic-control approach to oil extraction in Basilicata, Italy. Ecol. Econ. 2021, 185, 107041. [Google Scholar] [CrossRef]
- OECD 28th Territorial Development Policy Committee 2012. Available online: https://www.oecd.org/cfe/regionaldevelopment/basilicata_edited.pdf (accessed on 14 September 2021).
- Sulla-Menashe, D.; Friedl, M.A. User Guide to Collection 6 MODIS Land Cover (MCD12Q1 and MCD12C1) Product. Available online: https://lpdaac.usgs.gov/documents/101/MCD12_User_Guide_V6.pdf (accessed on 10 July 2021).
- Friedl, M.; Sulla-Menashe, D. MCD12Q1 MODIS/Terra+Aqua Land Cover Type Yearly L3 Global 500m SIN Grid V006 [Data set]. NASA EOSDIS Land Processes DAAC. Available online: https://doi.org/10.5067/MODIS/MCD12Q1.006 (accessed on 4 October 2021). [CrossRef]
- Zhang, H.K.; Roy, D.P. Using the 500m MODIS land cover product to derive a consistent continental scale 30m Landsat land cover classification. Remote Sens. Environ. 2017, 197, 15–34. [Google Scholar] [CrossRef]
- Mark, A.; Friedl, M.; Sulla-Menashe, D.; Tan, B.; Schneider, A.; Ramankutty, N.; Sibley, A.; Huang, X. MODIS Collection 5 global land cover: Algorithm refinements and characterization of new datasets. Remote Sens. Environ. 2010, 114, 168–182. [Google Scholar] [CrossRef]
- Fisher, P.; Comber, A.J.; Wadsworth, R. Land use and land cover: Contradiction or complement. Re-Presenting GIS 2005, 85–98. [Google Scholar]
- FAO; UNEP. The Future of Our Land. Facing the Challenge. FAO and UNEP GUIDELINES for Integrated Planning for Sustainable Management of Land Resources; FAO Lands and Water Development Division: Rome, Italy, 1999; 71p. [Google Scholar]
- Lambin, E.F.; Turner, B.L.; Geist, H.J.; Agbola, S.B.; Angelsen, A.; Bruce, J.W.; Coomes, O.T.; Dirzo, R.; Fischer, G.; Folke, C.; et al. The causes of land-use and land-cover change: Moving beyond the myths. Glob. Environ. Chang. 2001, 11, 261–269. [Google Scholar] [CrossRef]
- Liang, S.; Li, X.; Wang, J. Land Cover and Land Use Changes; Academic Press: Cambridge, MA, USA, 2012; pp. 703–772. [Google Scholar] [CrossRef]
- QGIS Geographic Information System. Open Source Geospatial Foundation Project. 2021. Available online: http://qgis.osgeo.org (accessed on 15 July 2021).
- Picuno, P.; Cillis, G.; Statuto, D. Investigating the time evolution of a rural landscape: How historical maps may provide environmental information when processed using a GIS. Ecol. Eng. 2019, 139, 105580. [Google Scholar] [CrossRef]
- Perpiña Castillo, C.; Kavalov, B.; Diogo, V.; Jacobs-Crisioni, C.; Batista, F.; Silva, F.; Lavalle, C. JRC113718, European Commission 2018. Available online: https://ec.europa.eu/jrc/sites/default/files/jrc113718.pdf (accessed on 2 June 2021).
- MacDonald, D.; Crabtree, R.; Wiesinger, G.; Dax, T.; Stamou, N.; Fleury, P.; Gutierrez Lazpita, J.; Gibon, A. Agricultural abandonment in mountain areas of Europe: Environmental consequences and policy response. J. Environ. Manag. 2000, 59, 47–69. [Google Scholar] [CrossRef]
- Van der Zanden, E.H.; Verburg, P.H.; Schulp, C.J.E.; Verkerk, P.J. Trade-offs of European agricultural abandonment. Land Use Policy 2017, 62, 290–301. [Google Scholar] [CrossRef]
- Hart, K.; Allen, B.; Lindner, M.; Keenleyside, C.; Burgess, P.; Eggers, J.; Buckwell, A. Land as an Environmental Resource, Report Prepared for DG Environment; Institute for European Environmental Policy: London, UK, 2013. [Google Scholar]
- Lasanta, T.; Sánchez-Navarrete, P.; Medrano-Moreno, L.M.; Khorchani, M.; Nadal-Romero, E. Soil quality and soil organic carbon storage in abandoned agricultural lands: Effects of revegetation processes in a Mediterranean mid-mountain area. Land Degrad. Dev. 2020, 31, 2830–2845. [Google Scholar] [CrossRef]
- Schuh, B.; Andronic, C.; Derszniak-Noirjean, M.; Gaupp-Berghausen, M.; Hsiung, C.; Münch, A. Research for AGRI Committee—The Challenge of Land Abandonment after 2020 and Options for Mitigating Measures, European Parliament, Policy; Department for Structural and Cohesion Policies: Brussels, Belgium, 2020. [Google Scholar]
- Perpiña Castillo, C.; Jacobs-Crisioni, C.; Diogo, V.; Lavalle, C. Modelling agricultural land abandonment in a fine spatial resolution multi-level land-use model: An application for the EU. Environ. Model. Softw. 2021, 136, 104946. [Google Scholar] [CrossRef] [PubMed]
- Statuto, D.; Cillis, G.; Picuno, P. Using historical maps within a GIS to analyze two centuries of rural landscape changes in Southern Italy. Land 2017, 6, 65. [Google Scholar] [CrossRef] [Green Version]
- Otero, I.; Marull, J.; Tello, E.; Diana, G.L.; Pons, M.; Coll, F.; Boada, M. Land abandonment, landscape, and biodiversity: Questioning the restorative character of the forest transition in the Mediterranean. Ecol. Soc. 2015, 20. Available online: http://www.jstor.org/stable/26270180 (accessed on 19 October 2021). [CrossRef] [Green Version]
- Cillis, G.; Nolè, G.; Lanorte, A.; Santarsiero, V.; Tucci, B.; Scorza, F.; Murgante, B. Soil erosion and land degradation in rural environment: A preliminary GIS and remote-sensed approach. In Lecture Notes in Computer Science, Proceedings of the Computational Science and Its Applications—ICCSA 2021, Cagliari, Italy, 13–16 September 2021; Gervasi, O., Ed.; Springer: Cham, Switzerland, 2021; Volume 12954, p. 12954. [Google Scholar] [CrossRef]
- Tucci, B.; Nolè, G.; Lanorte, A.; Santarsiero, V.; Cillis, G.; Scorza, F.; Murgante, B. Assessment and monitoring of soil erosion risk and land degradation in arable land combining remote sensing methodologies and rusle factors. In Lecture Notes in Computer Science, Proceedings of the Computational Science and Its Applications—ICCSA 2021, Cagliari, Italy, 13–16 September 2021; Gervasi, O., Ed.; Springer: Cham, Switzerland, 2021; Volume 12954, p. 12954. [Google Scholar] [CrossRef]
- Sitzia, T.; Semenzato, P.; Trentanovi, G. Natural reforestation is changing spatial patterns of rural mountain and hill landscapes: A global overview. For. Ecol. Manag. 2010, 259, 1354–1362. [Google Scholar] [CrossRef]
- García-Ruiz, J.M.; Lasanta, T.; Nadal-Romero, E.; Lana-Renault, N.; Álvarez-Farizo, B. Rewilding and restoring cultural landscapes in Mediterranean mountains: Opportunities and challenges. Land Use Policy 2020, 99, 104850. [Google Scholar] [CrossRef]
- Verburg, P.H.; Neumann, K.; Nol, L. Challenges in using land use and land cover data for global change studies. Glob. Chang. Biol. 2011, 17, 974–989. [Google Scholar] [CrossRef] [Green Version]
- Nedd, R.; Light, K.; Owens, M.; James, N.; Johnson, E.; Anandhi, A. A synthesis of land use/land cover studies: Definitions, classification systems, meta-studies, challenges and knowledge gaps on a global landscape. Land 2021, 10, 994. [Google Scholar] [CrossRef]
- Meneses, B.M.; Reis, E.; Reis, R.; Vale, M.J. The effects of land use and land cover geoinformation raster generalization in the analysis of LUCC in Portugal. ISPRS Int. J. Geoinf. 2018, 7, 390. [Google Scholar] [CrossRef] [Green Version]
- Dabiri, Z.; Blaschke, T. Scale matters: A survey of the concepts of scale used in spatial disciplines. Eur. J. Remote Sens. 2019, 52, 419–434. [Google Scholar] [CrossRef] [PubMed] [Green Version]
- Radočaj, D.; Obhođaš, J.; Jurišić, M.; Gašparović, M. Global open data remote sensing satellite missions for land monitoring and conservation: A review. Land 2020, 9, 402. [Google Scholar] [CrossRef]
- Wang, D.; Sagan, V.; Guillevic, P.C. Quantitative remote sensing of land surface variables: Progress and perspective. Remote Sens. 2019, 11, 2150. [Google Scholar] [CrossRef] [Green Version]
- Justice, C.O.; Townshend, J.R.G.; Vermote, E.F.; Masuoka, E.; Wolfe, R.E.; Saleous, N.; Roy, D.P.; Morisette, J.T. An overview of MODIS Land data processing and product status. Remote Sens. Environ. 2002, 83, 3–15. [Google Scholar] [CrossRef]

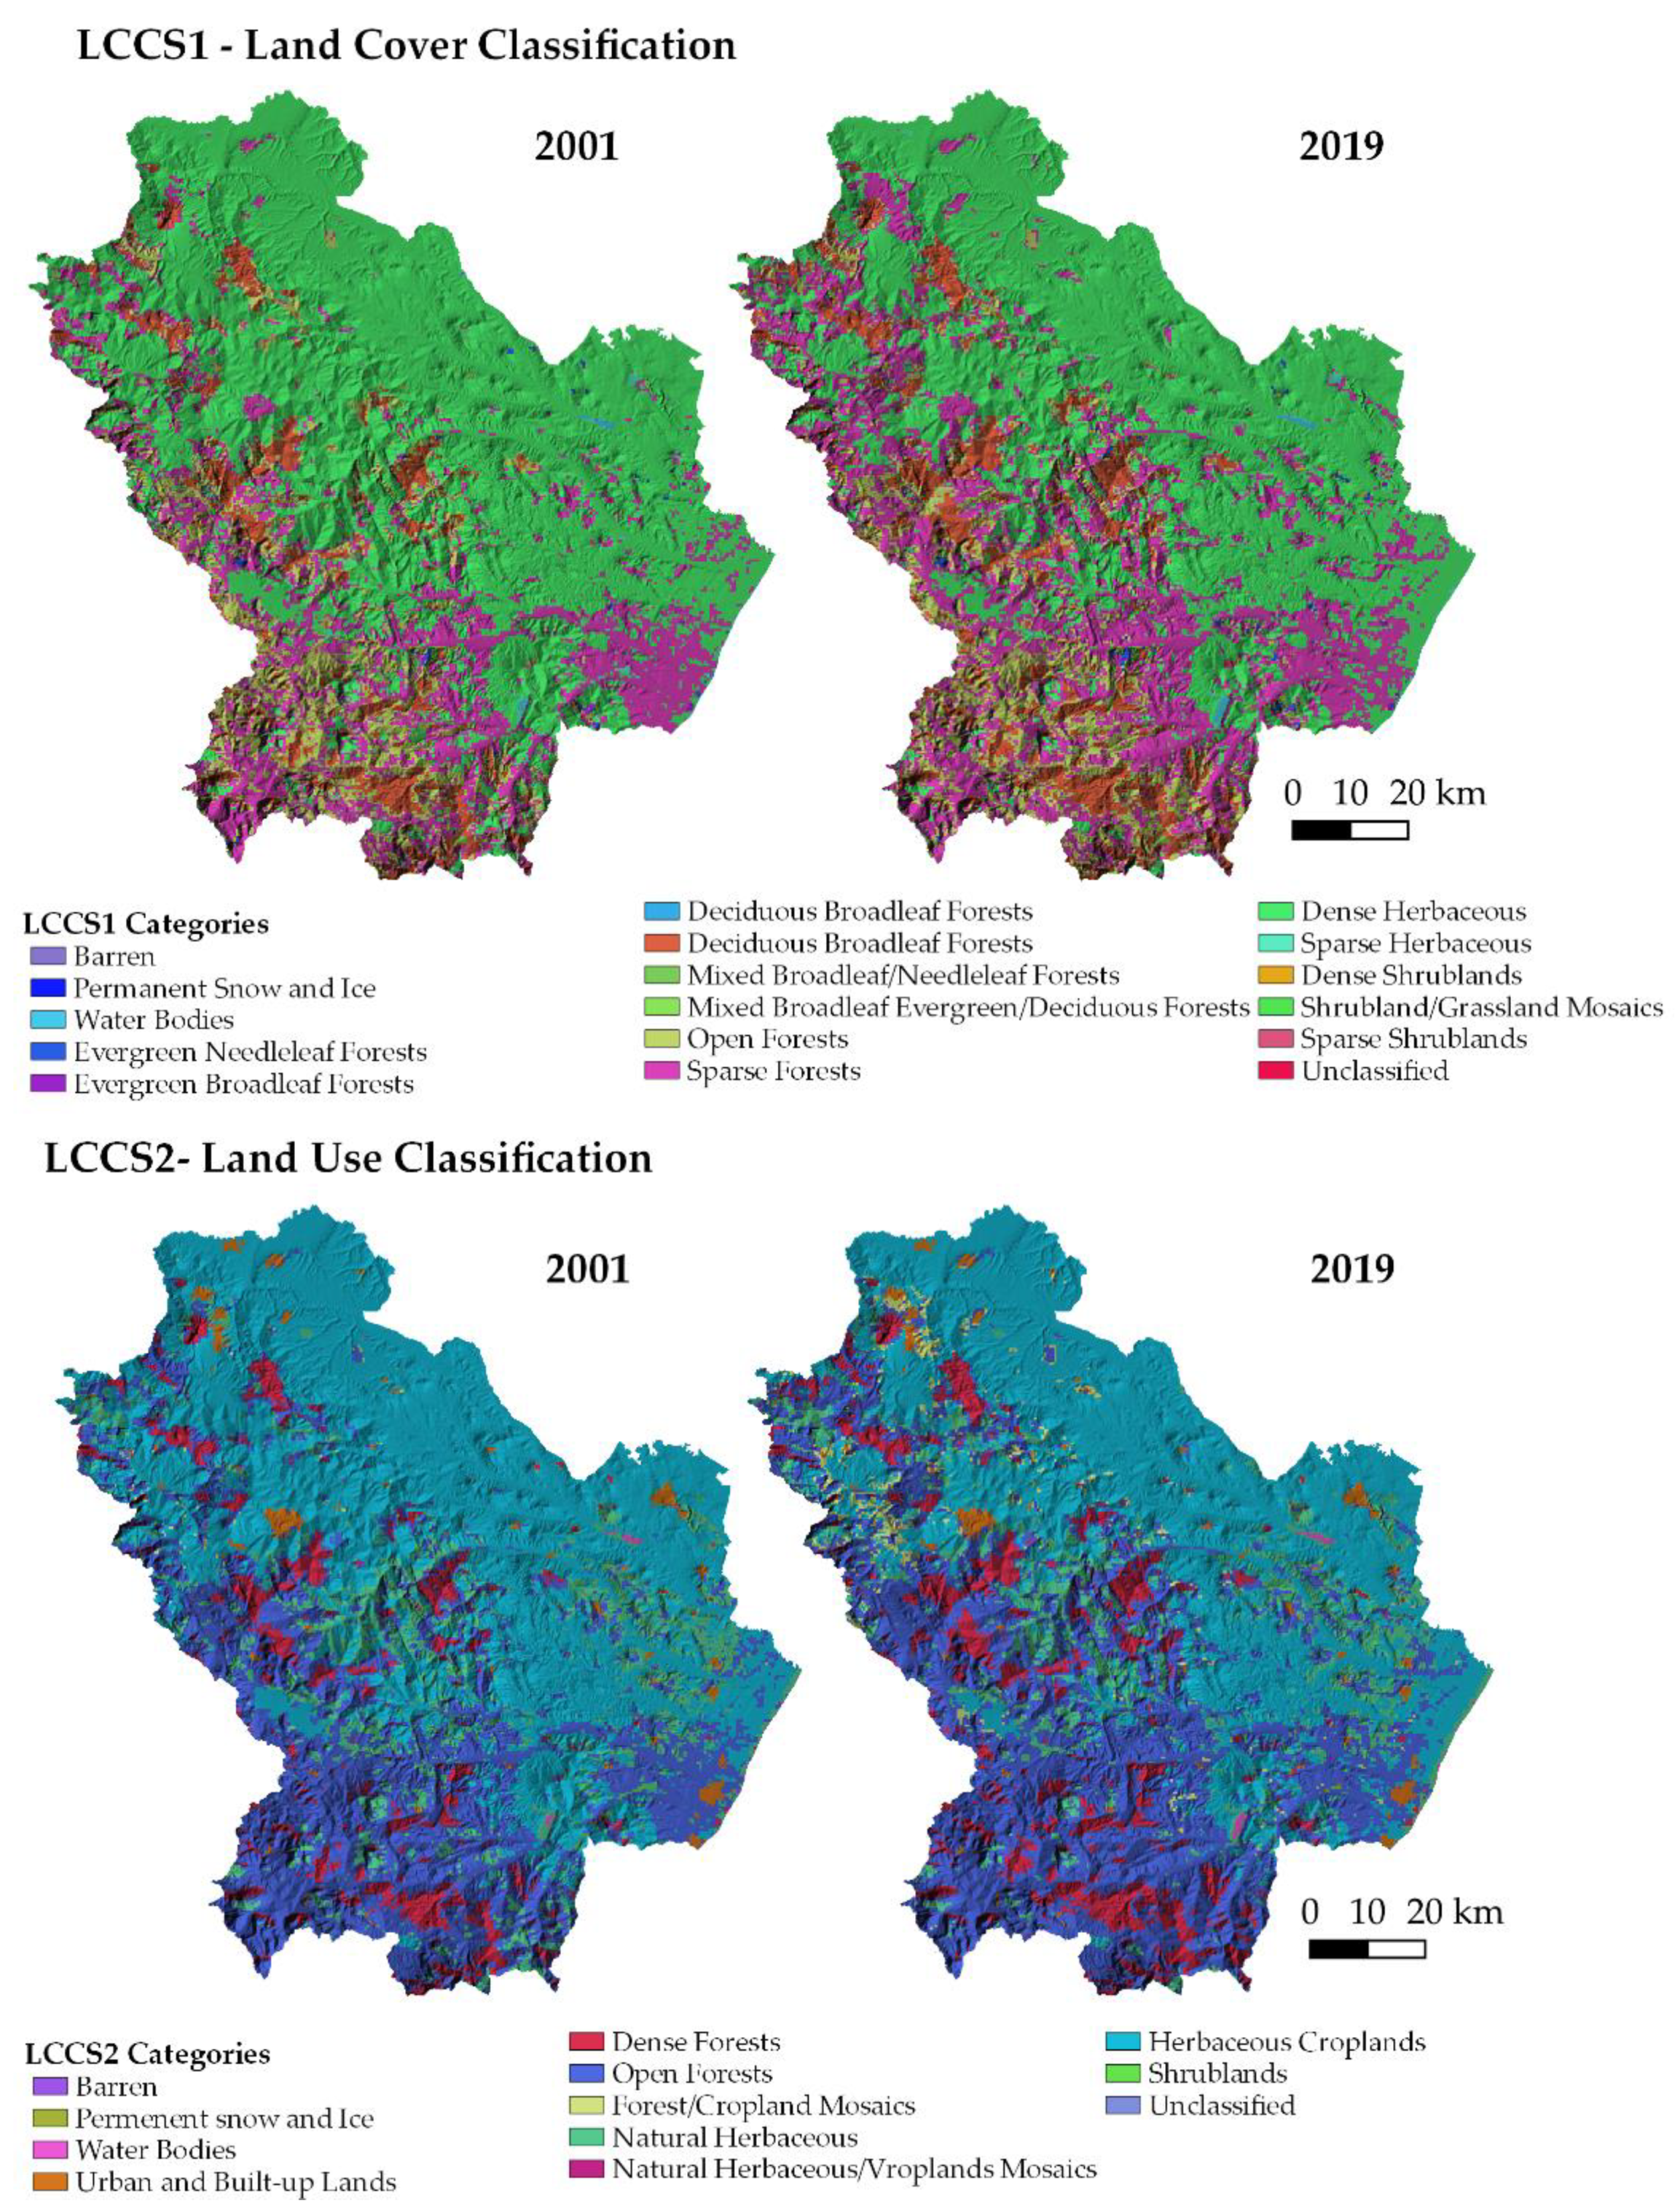
| Category | Description |
|---|---|
| Barren | At least 60% of area is non-vegetated barren (sand, rock, soil) or permanent snow/ice with less than 10% vegetation. |
| Permanent Snow and Ice | At least 60% of area is covered by snow and ice for at least 10 months of the year. |
| Water Bodies | At least 60% of area is covered by permanent water bodies. |
| Evergreen Needleleaf Forests | Dominated by evergreen conifer trees (>2 m). Tree cover > 60%. |
| Evergreen Broadleaf Forests | Dominated by evergreen broadleaf and palmate trees (>2 m). Tree cover > 60%. |
| Deciduous Needleleaf Forests | Dominated by deciduous needleleaf (larch) trees (>2 m). Tree cover > 60%. |
| Deciduous Broadleaf Forests | Dominated by deciduous broadleaf trees (>2 m). Tree cover > 60%. |
| Mixed Broadleaf/Needleleaf Forests | Co-dominated (40–60%) by broadleaf deciduous and evergreen needleleaf tree (>2 m) types. Tree cover > 60%. |
| Mixed Broadleaf Evergreen/Deciduous Forests | Co-dominated (40–60%) by broadleaf evergreen and deciduous tree (>2 m) types. |
| >60%. | |
| Open Forests | Tree cover 30–60% (canopy >2 m). |
| Sparse Forests | Tree cover 10–30% (canopy >2 m). |
| Dense Herbaceous | Dominated by herbaceous annuals (<2 m) at least 60% cover. |
| Sparse Herbaceous | Dominated by herbaceous annuals (<2 m) 10–60% cover. |
| Dense Shrublands | Dominated by woody perennials (1–2 m) >60% cover. |
| Shrubland/Grassland Mosaics | Dominated by woody perennials (1–2 m) 10–60% cover with dense herbaceous annual understory. |
| Sparse Shrublands | Dominated by woody perennials (1–2 m) 10–60% cover with minimal herbaceous understory. |
| Unclassified | Has not received a map label because of missing inputs. |
| Name | Description |
|---|---|
| Barren | At least 60% of area is non-vegetated barren (sand, rock, soil) or permanent snow/ice with less than 10% vegetation. |
| Permanent Snow and Ice | At least 60% of area is covered by snow and ice for at least 10 months of the year. |
| Water Bodies | At least 60% of area is covered by permanent water bodies. |
| Urban and Built-up Lands | At least 30% of area is made up of impervious sur- faces including building materials, asphalt, and vehicles. |
| Dense Forests | Tree cover > 60% (canopy > 2 m). |
| Open Forests | Tree cover 10–60% (canopy > 2 m). |
| Forest/Cropland Mosaics | Mosaics of small-scale cultivation 40–60% with |
| >10% natural tree cover. | |
| Natural Herbaceous | Dominated by herbaceous annuals (<2 m). |
| Natural Herbaceous/Croplands Mo- saics | Mosaics of small-scale cultivation 40–60% with natural shrub or herbaceous vegetation. |
| Herbaceous Croplands | Dominated by herbaceous annuals (<2 m). |
| Shrublands | Shrub cover >60% (1–2 m). |
| Unclassified | Has not received a map label because of missing inputs. |
Publisher’s Note: MDPI stays neutral with regard to jurisdictional claims in published maps and institutional affiliations. |
© 2021 by the authors. Licensee MDPI, Basel, Switzerland. This article is an open access article distributed under the terms and conditions of the Creative Commons Attribution (CC BY) license (https://creativecommons.org/licenses/by/4.0/).
Share and Cite
Cillis, G.; Tucci, B.; Santarsiero, V.; Nolè, G.; Lanorte, A. Understanding Land Changes for Sustainable Environmental Management: The Case of Basilicata Region (Southern Italy). Pollutants 2021, 1, 217-233. https://doi.org/10.3390/pollutants1040018
Cillis G, Tucci B, Santarsiero V, Nolè G, Lanorte A. Understanding Land Changes for Sustainable Environmental Management: The Case of Basilicata Region (Southern Italy). Pollutants. 2021; 1(4):217-233. https://doi.org/10.3390/pollutants1040018
Chicago/Turabian StyleCillis, Giuseppe, Biagio Tucci, Valentina Santarsiero, Gabriele Nolè, and Antonio Lanorte. 2021. "Understanding Land Changes for Sustainable Environmental Management: The Case of Basilicata Region (Southern Italy)" Pollutants 1, no. 4: 217-233. https://doi.org/10.3390/pollutants1040018
APA StyleCillis, G., Tucci, B., Santarsiero, V., Nolè, G., & Lanorte, A. (2021). Understanding Land Changes for Sustainable Environmental Management: The Case of Basilicata Region (Southern Italy). Pollutants, 1(4), 217-233. https://doi.org/10.3390/pollutants1040018