Article

Model-Based Analysis of the Link between Groundwater Table Rising and the Formation of Solute Plumes in a Shallow Stratified Aquifer

1
Dipartimento di Scienze della Terra “A. Desio”, Università degli Studi di Milano, 20133 Milan, MI, Italy
2
Consultant, via F. Baracca 2, 20825 Barlassina, MB, Italy
3
Consultant, via Don Gnocchi 8, 23827 Lierna, LC, Italy
*
Author to whom correspondence should be addressed.
Pollutants 2021, 1(2), 66-86; https://doi.org/10.3390/pollutants1020007
Submission received: 4 March 2021 / Revised: 5 April 2021 / Accepted: 21 April 2021 / Published: 23 April 2021
(This article belongs to the Special Issue Pollution of Groundwater)

Abstract

:
Groundwater table rising (GTR) represents a well-known issue that affects several urban and agricultural areas of the world. This work addresses the link between GTR and the formation of solute plumes from contaminant sources that are located in the vadose zone, and that water table rising may help mobilize with time. A case study is analyzed in the stratified pyroclastic-alluvial aquifer near Naples (Italy), which is notoriously affected by GTR. A dismissed chemical factory generated a solute plume, which was hydraulically confined by a pump-and-treat (P&T) system. Since 2011, aqueous concentrations of 1,1-dichloroethene (1,1-DCE) have been found to exceed regulatory maximum concentration levels in monitoring wells. It has been hypothesized that a 1,1-DCE source may occur as buried waste that has been flushed with time under GTR. To elucidate this hypothesis and reoptimize the P&T system, flow and transport numerical modeling analysis was developed using site-specific data. The results indicated that the formulated hypothesis is indeed plausible. The model shows that water table peaks were reached in 2011 and 2017, which agree with the 1,1-DCE concentration peaks observed in the site. The model was also able to capture the simultaneous decrease in the water table levels and concentrations between 2011 and 2014. Scenario-based analysis suggests that lowering the water table below the elevation of the hypothesized source is potentially a cost-effective strategy to reschedule the pumping rates of the P&T system.

1. Introduction

In recent decades, socio-economic problems connected to groundwater table rising (GTR), also referred to as groundwater rebound [1] or groundwater inundation [2], have become increasingly frequent in several areas around the world [3,4,5,6,7,8]. Groundwater table rising can be due to the reduction or complete decommissioning of large-scale groundwater-based water supply facilities, such as public well fields [9,10]. However, it may also be driven by natural processes, as in the case of coastal aquifers threatened by climate-change-driven sea-level fluctuations [11,12,13]. Groundwater table rising causes well-documented problems to the safety of underground structures and infrastructures [14,15,16,17]. It can also generate flooding of agricultural soils and archaeological sites [18]. However, relatively less attention has been paid to the environmental problems that can be directly triggered by GTR [19,20].
Near densely industrialized and urban contexts, the presence of sparsely distributed buried waste in the shallow subsurface is not uncommon. This is due to multiple factors, from improper landfill impermeabilization to illegal waste disposal [21,22,23,24]. Such waste can be located at shallow depths, and specifically in the unsaturated zone of the subsurface (i.e., the vadose zone). The seepage rates of the vadose zone are typically several orders of magnitude smaller than in the saturated zone for coarse-grained sediments. As such, when the elevation of the water table is lower than the elevation of the waste, no solute plume can form and migrate downgradient of the source. Under water table rising, solute contaminants previously located in the unsaturated zone may be more effectively mobilized if the water table reaches the buried waste source, forming new contamination plumes. The process is graphically conceptualized in Figure 1.
Studies that have quantitatively addressed the link between buried contamination sources and GTR are lacking. To fill this gap in the current state-of the-art, this work studies the occurrence of a new solute plume observed since 2011 in the aquifer underneath a former industrial complex in the municipality of Casalnuovo di Napoli, in the central portion of the “Piana ad Oriente di Napoli” (PON). The PON is a stratified pyroclastic-alluvial aquifer known to be severely affected by GTR [1,18,25]. Due to the progressive abandonment of some important groundwater well fields, from 1990 until today the groundwater levels have rebounded locally by more than 15 m [1]. In 2007 a pump-and-treat (P&T) system was installed to hydraulically confine a contaminant plume spreading from the former industrial complex. While the P&T was initially able to keep the aqueous concentrations below the upper concentration limit set by the Italian law, in 2011 concentrations of 1,1-dichloroethylene (1,1-DCE, a chlorinated aliphatic hydrocarbon) were found to exceed such limit at different locations of the site. The 1,1-DCE was never detected in the site prior to 2011. High concentrations of this compound were observed again in 2017, prompting the local administrations to take actions, such as redesigning the P&T system to properly confine the contaminant source. It was recommended that such actions were assisted by numerical modeling, which is usually developed for the design and cost-effective management of P&T systems [26,27,28,29].
The first purpose of this work was (1) to develop a flow and transport numerical model and prove the link between the occurrence of 1,1-DCE and the GTR affecting the PON. A second purpose was (2) to perform scenario-based analyses to explore an alternative use of the pumping wells that could improve the efficiency of the existing P&T system to contain the 1,1-DCE plume under GTR. To this end, we adopted a process-based modeling framework based on the open-source codes MODFLOW-NWT [30] and MT3DMS [31], following the conceptual model provided in Figure 1. MODFLOW-NWT is an efficient and innovative code that enables simulating water table rising without the notorious instabilities associated to the numerical solution of the saturation changes in water-unsaturated layers. We have no knowledge of previous applications of MODFLOW-NWT for this kind of studies.
By analyzing this specific case study, our broader goal was to elucidate the control of GTR on the formation of new solute plumes in contaminated aquifers. Ultimately, we aimed at proposing a general model-based framework based on open-source codes that could be applied to explore the link between GTR and the formation of solute plumes in any other aquifer of the world.

2. Materials and Methods

2.1. Background Information

2.1.1. Geological and Hydrogeological Background
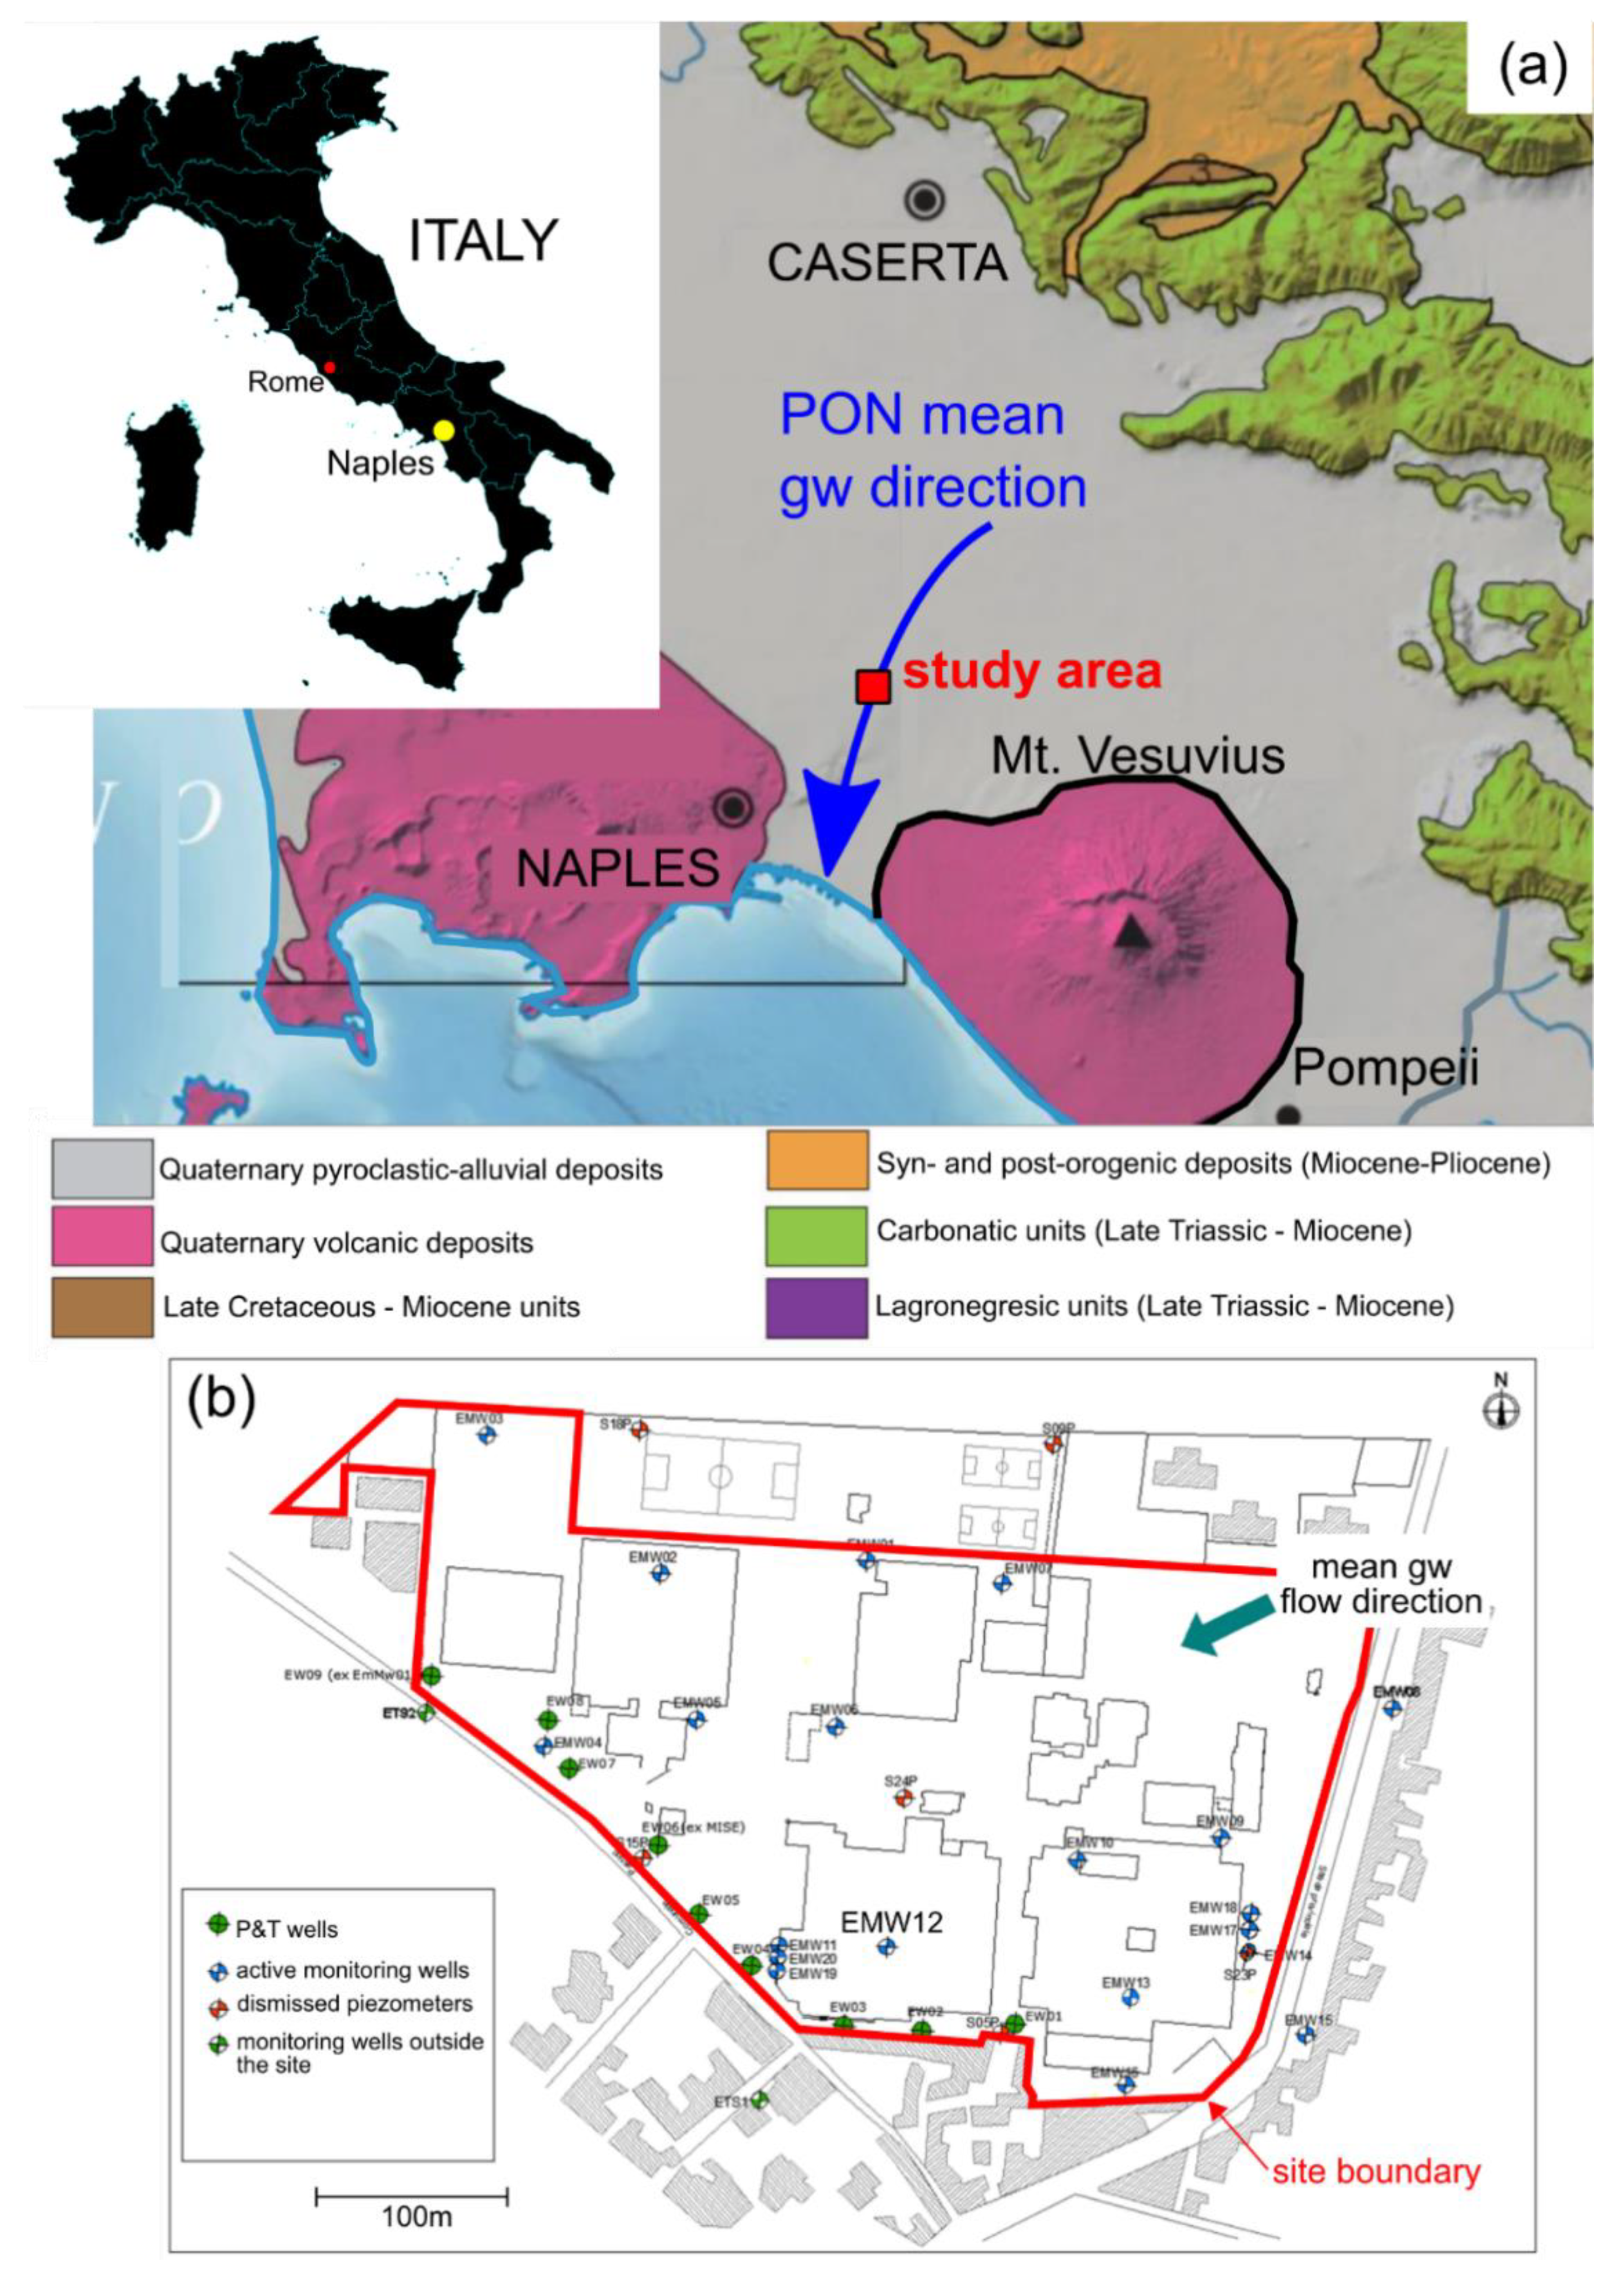
The study area (Figure 2) is situated in the municipality of Casalnuovo di Napoli (hereafter, Casalnuovo) in the densely populated metropolitan area of Naples (Italy). The topographic area is flat, with an elevation of about 27 m above sea level (a.s.l.). The former industrial complex that caused the solute contamination was originally located in agricultural land at the edge of the urban center. Today, the territory is mostly urbanized. The dismissed industrial complex covers an area of about 111,400 m2.
Geologically, Casalnuovo is located in the central sector of the Campanian plain (Figure 2a), formed during the Pliocene and Pleistocene by the filling of a regional depression due to a semi-graben structure originated along the western side of the Apennines during the opening of the Tyrrhenian Sea [32]. Starting from about 300,000 years ago, an intense volcanic activity began with the formation of the Phlegraean Fields and the Mt. Vesuvius [33]. Ash-fall deposits and pyroclastic rocks covered the entire area of the plain and beyond. In the last 25,000 years, pyroclastic deposits, river sedimentation and weathering processes have contributed to the filling of the Campanian plain, resulting in thick deposits of mixed alluvial, marine and fluvio-lake material [34]. More information on the geological background is provided as Supplementary Materials.
Figure 2. (a) Location of the study area and main geological outcrop, according to [35]. (b) The study area, indicating the boundary of the former factory, the position of the pumping wells and the monitoring boreholes (piezometers).
Pollutants 01 00007 g002
The geological configuration of the Campanian plain controls the hydrogeological setup of the PON aquifer. At a regional scale, this aquifer has an estimated extension of about 392 km2, being physically bounded by the Avella, Partenio and Pizzo mountains at NE, Mt. Vesuvius at SE and the Tyrrhenian Sea at SW. At N–NW there are no physical boundaries, as such the PON is assumed to be limited by the Cancello–Caivano–Marano railway route. The regional groundwater flow is oriented from N–NW to SW, outflowing at the sea near Naples.
At local scales, the aquifer hydrodynamics are very articulated and complex, reflecting the presence of different lithological units with spatially variable textural properties and composition. The aquifer can be subdivided into multiple sub-aquifers, depending on distance from the sea and the presence of aquitards and other fine-grained layers that can hydraulically separate the most permeable units. Casalnuovo is located in the central sector of the PON (Figure 2). Here, the local subsurface is characterized by a well-defined vertical sequence of different facies, reflecting the stratified nature of the regional geological background. The first 17 m of the soil encompass the shallow aquifer affected by the solute plume contamination originated from the former industrial complex. The aquifer is mainly hosted by the coarse-grained volcanic deposits underneath the Campanian Ignimbrite unit, as described in Section 2.1.
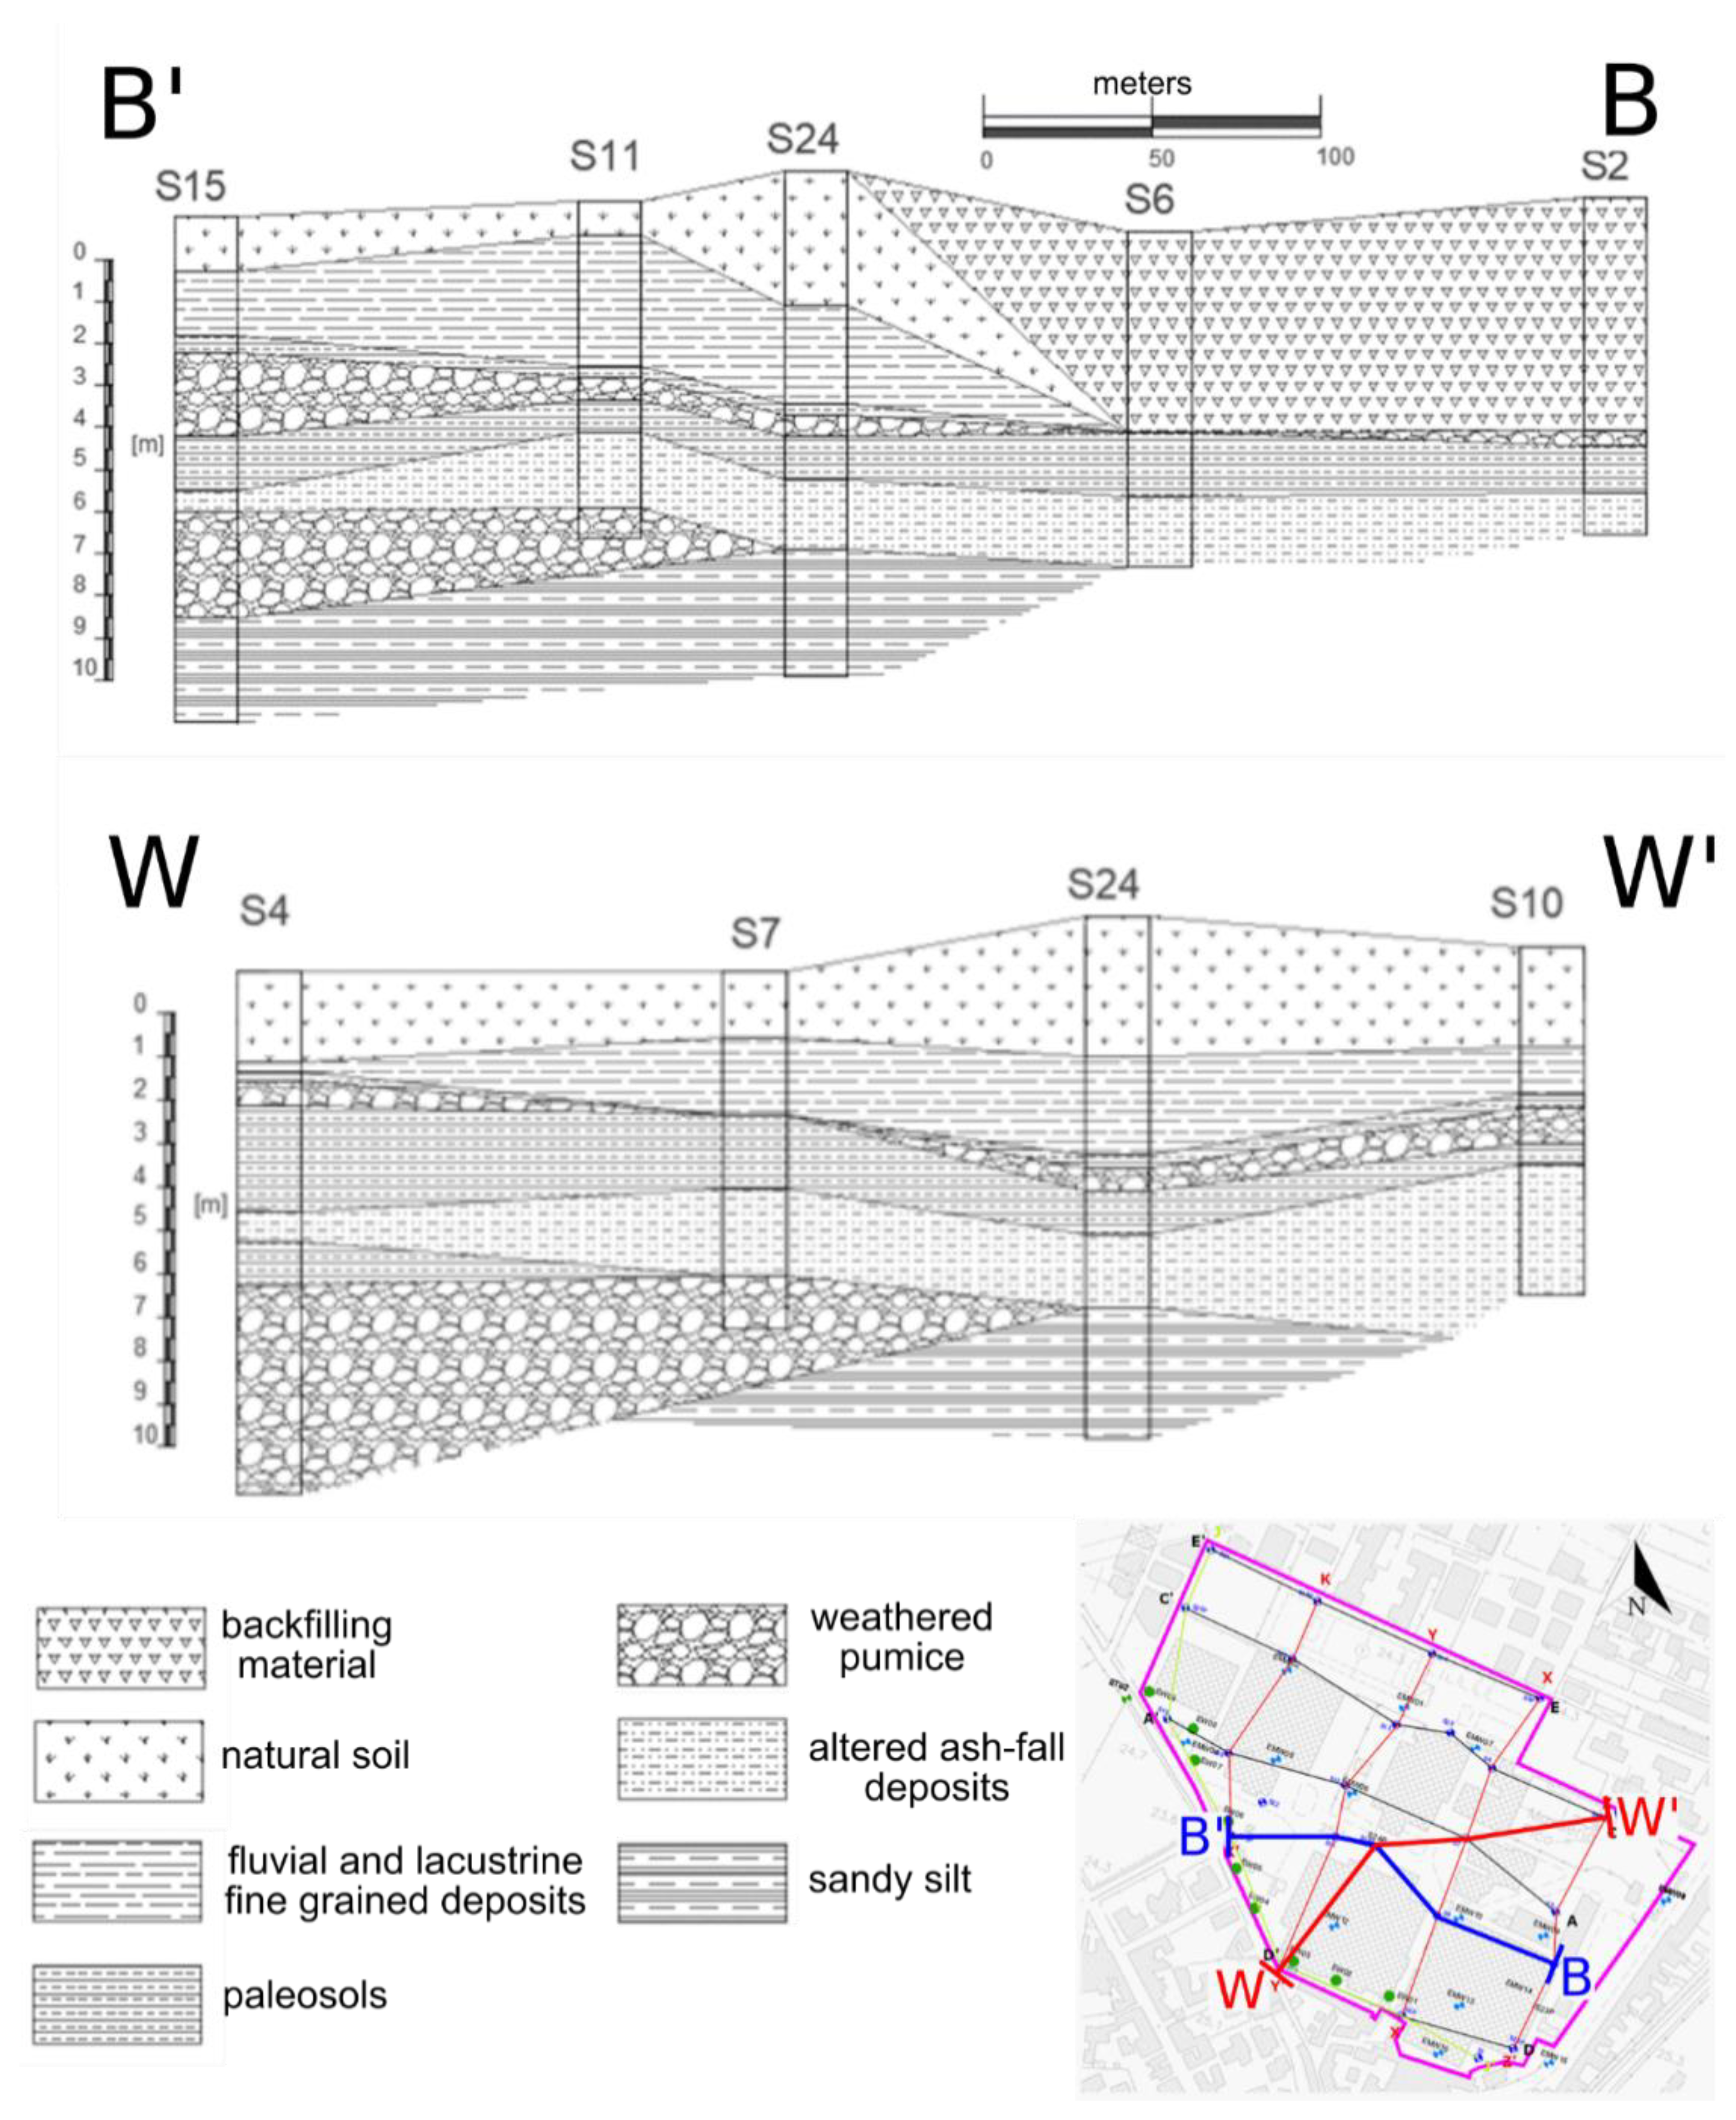
We drew several cross-sections to evaluate the detailed stratigraphic configuration of the lithological units present in the Casalnuovo subsurface. This step was propaedeutic to the implementation of the numerical model setup, as it served both to identify the thicknesses and spatial variability of the different hydrofacies composing the aquifer and to assess possible morphological aspects that could be relevant to locate the 1,1-DCE source forming the solute plume under GTR. These cross-sections were built primarily using the borehole logs obtained from the drillings performed during the different characterization phases of the industrial site (more information is provided as Supplementary Materials). We created 11 stratigraphic cross-sections, of which 5 were oriented along the E–W axis, 5 were oriented along the N–S axis and one crossed the wells forming the hydraulic barrier. Two representative cross-sections are shown in Figure 3. All 11 cross-sections are reported as Supplementary Materials.
The local subsurface at the site shows clear textural contrasts that form the following main hydrogeological units.
  • The top 6–7 m below the ground surface (g.s.) are characterized by volcanic deposits mixed with alluvial deposits and anthropogenic backfilling material. Alternations of sands, silts, pumices and small size lapilli are attributable to a combination of processes, which include weathering and low-energy fluvial and lacustrine settlement. This most superficial geological unit can contain perched aquifers, seasonally forming as a consequence of rainfall-driven recharge and the presence of low-permeable layers. However, it is unlikely that the top unit hosts a permanent aquifer in the site.
  • Low-permeable horizons associated with low-energy fluvial and lacustrine deposits and paleosols are mainly found at two different depths, at 6–7 m and at 10–12 m below the g.s. respectively. These horizons can act as aquitards that separate the top unit from the bottom units. Of particular importance for this study is the paleosol found at 10–12 m below the g.s., which can be associated to the Campanian Ignimbrite (IC).
  • Coarse-grained volcanic deposits characterized by high hydraulic conductivity are found below the IC. These deposits are associated with weathered pumice, fractured tuff horizons and other coarse-grained lithologies. These deposits host the main aquifer of the site. Unaltered pumice mixed with centimetric-size rocks, including volcanic lapilli and fragments from the carbonate substrate ejected during the volcanic explosions, were also found.
  • Ash-fall and sandy silt deposits are encountered towards the end of the stratigraphic sequence.
Since 1990, a continuous rise in aquifer level has been observed in the PON, reaching up to about 16 m of groundwater recovery in about 30 years [1,25]. Such rising was mainly due to the decommissioning of three major well fields in the areas, due to high costs for maintaining drinking quality standards above regulation levels and the deindustrialization of the area [36].

2.1.2. Solute Contamination

In 2007, a P&T system was built to hydraulically contain a solute plume contamination detected downgradient of the industrial complex. The P&T system is still active today and consists of 9 pumping wells, located along the south and south-west limit of the industrial complex for a total length of about 400 m (Figure 2b). The wells were drilled to a depth of 12 m. Each well has a diameter of 5 inches and is screened between 6 m and 12 m below the g.s. The cumulative pumping rate ( Q ) of the P&T was about 22 m3/d. To ensure the actual confining ability of the hydraulic barrier, additional piezometers were installed, and new geochemical surveys were periodically carried out, targeting the main pollutants described by Italian law (Decree 152/2006), including metals, inorganic compounds, chlorinated aliphatic hydrocarbons and fertilizers.
The monitoring activities performed after 2007 suggested that the P&T system was initially able to hydraulically confine the multicomponent solute plume spreading from the former industrial setting. However, since 2011, a progressive increase of the concentrations of 1,1-dichloroethylene (1,1-DCE) has been observed in some piezometers of the site. Also known as vinylidene chloride, 1,1-DCE is a well-known contaminant, labelled by the European Community (EC) with number 200-864-0 and by the Chemical Abstract Service Registry (CAS) with number 75-35-4. The upper concentration limit set by the Italian law for 1,1-DCE in groundwater is 0.05 μg/L [37]. Maximum concentrations of 1,1-DCE were observed at piezometer EMW12, reaching a first peak of 7.69 μg/L in March 2011 and a second peak of 39 μg/L in December 2017. The increase of 1,1-DCE in 2017 prompted the environmental regulators to take new actions to improve the effectiveness of the hydraulic barrier.

2.2. Numerical Model

It has been hypothesized that the occurrence of 1,1-DCE can be directly linked to the regional GTR. Recalling the conceptual model presented in Figure 1, we postulated that:
  • prior to the increase in the piezometric levels, a 1,1-DCE source could have been located in the vadose zone, thus not being mobilized in the aquifer;
  • after 2011, the rising water table might have flooded part of the vadose zone, flushing the 1,1-DCE source and resulting in its mobilization.
The main purpose of the study is to demonstrate this hypothesis by developing a three-dimensional (3-D) flow and transport numerical model, and to simulate alternative operational scenarios to improve the effectiveness of the P&T system. Process-based numerical modeling was adopted to simulate the main physical and chemical mechanisms that control the formation and evolution of solute plumes. Due to strong vertical heterogeneity, the numerous boundary conditions affecting the aquifer and the transient nature of groundwater dynamics, numerical modeling was preferred over analytical solutions. As evidenced by the local-scale stratigraphic analysis presented in Section 2, the horizontal correlation scale of the units is comparable to the vertical scale of the domain, suggesting that 3-D modeling was required to properly reproduce flow and transport in the studied area [38,39].
The model was developed based on established frameworks [40,41] and according to the following steps:
  • A groundwater flow model was developed using stratigraphic information and initial hydrodynamic parameters obtained from the literature [42] and preliminary aquifer tests performed on the site (not reported). The flow model was calibrated against field observations of groundwater head levels measured from the wells and piezometers of the site between 2018 and 2019.
  • An advective-dispersive-reactive solute transport model was coupled to the flow model to obtain the distribution of 1,1-DCE in space and time. The transport model results were compared against 1,1-DCE concentrations measured between 2010 and 2014 at one piezometer (EMW12).
  • The solute transport model was adopted to generate predictive scenarios supporting the re-optimization of the P&T system.

2.2.1. Flow Model Setup

The code MODFLOW-NWT [30] was used for the flow model. MODFLOW-NWT was derived from MODFLOW-2005 [43] to resolve the well-known numerical instabilities of initial MODFLOW versions when simulating the water table rising in unsaturated model layers [30,44,45,46]. As in other MODFLOW codes, MODFLOW-NWT resolves the 3-D groundwater flow equation using a finite-difference, block-centered scheme. The flow equation resolved by MODFLOW-NWT is illustrated in Appendix A.
The model was implemented using the interface ModelMuse v4.3 [47] (Figure 4). The lateral extension of the modelled domain was 1700 m × 1200 m. The selected dimension was sufficiently large to minimize the effect at the boundaries and sufficiently small to maximize the computational time required for the solution of non-linear equations in the heterogeneous 3-D system. The domain was discretized with a telescopic mesh refinement towards the center of the domain corresponding to the former industrial facility, which is the main focus of the model analysis (Figure 4). The grid size gradually decreases from a maximum of 100 × 100 m cell size to a minimum of 10 × 10 m cell size, with a refinement step of 1.2. The blue box in Figure 4 shows the position of the area with higher mesh refinement.
Along the vertical direction (Figure 4b), the number of model layers was determined considering the average depths of the main hydrofacies identified through the stratigraphic cross-sections presented in Section 2.1. We first considered that, at the scale of the site, the geological units present lateral continuity. This observation suggested that the aquifer could be modelled as a stratified system, a consolidated working approach when dealing with transport in heterogeneous formations [48]. The stratified approach is particularly suited when the scale of transport in the horizontal direction is comparable with those occurring in the vertical direction, which is the case of this work. After an initial tuning, we discretized the system in 12 layers, as summarized in Table 1. The spatial variability of the layers’ morphology was obtained by interpolating the layers-separating surfaces using the lithological information contained in the well logs used to construct the cross-sections presented in Section 2.1 (boreholes-specific values are reported as Supplementary Materials). The ModelMuse-native Natural Neighbors algorithm was chosen for the surface interpolation. A minimum layer thickness of 10 cm was imposed to prevent the model to create layers pinch-outs, which cannot be resolved by MODFLOW-NWT.
Note from Figure 4b that a higher vertical discretization was used for the deeper paleosol, which was split into four model layers (layers 5 to 8, Table 1). This was done since the deeper paleosol is found topographically at a depth which was very close to the position of the water table in 2010, i.e., prior to the water table rising. As discussed in the following section, it is possible that, due to its fine-grained nature, this paleosol may host a possible 1,1-DCE source that is activated when the water table rises under GTR. The higher discretization of the paleosol aimed at better capturing the flow dynamics in that layer, particularly as associated to the water table rising, and the associated mobility of 1,1-DCE.
The model parameterization was set up as follows. The hydraulic conductivity (K) is usually the most relevant parameter when dealing with flow and transport in heterogeneous aquifers [39]. Since the variability in groundwater flow dynamics at the scale of the domain was mainly attributed to the vertical stratification of the aquifer, we assumed that the flow and transport was primarily controlled by the change in K of each layer. Each layer was assumed as isotropic and homogeneous. The other flow parameters were homogeneous at the scale of the model. The specific storage ( S s ) was set to S s = 10−5 m−1 and the specific yield ( S y ) to S y = 0.25.
The model was run in a transient state for a simulated period of 16 years (2003–2019). We set 61 stress periods, of which the first spin-up period was run under steady state conditions and the other 60 periods were run under transient state conditions. For each transient stress period, we found that 14 timesteps were adequate to reach numerical convergence of the MODFLOW-NWT solution.
In the simulated area there are no physical boundaries (e.g., river or sea) to be associated to the model’s boundary conditions. Moreover, there were no reliable data of piezometric levels in the areas outside the industrial site that could be used to set lateral boundaries of the model, e.g., to set general head boundary conditions. In light of this limitation and recalling that the main purpose of this study was to evaluate the processes leading to the formation of new plumes at the center of the domain as a consequence of GTR, we set the boundary conditions using a mathematically simplified approach. Specifically, we set time-dependent constant-head boundary conditions in the eastern and western sides of the model (Figure 4a) to simulate the regional GTR in the study area, and no-flow boundaries to the other sides. Initial upgradient and downgradient boundary head levels and their variations over time were estimated extrapolating the hydraulic gradient within the site. The head levels at the boundary were then refined during the calibration stage.
Second type (Neumann) boundary conditions were used to simulate pumping wells and areal recharge. The transient pumping rate Q w of the nine P&T wells (labelled EW01 to EW09), as measured on site, is reported in the Supplementary Materials. Areal recharge was calculated neglecting runoff, being the area essentially flat. Initial values of the areal recharge, R E C H , [mm/year] were obtained considering that R E C H = P E V T , where P is the precipitation [mm/year] and EVT is evapotranspiration [mm/year]. The average precipitation is P = 985 mm/year. Ducci and Sellerino [49] obtained an EVT value for the city of Naples equal to EVT = 136 mm/year, equivalent to one fifth of the potential evapotranspiration (EVP) calculated with the Turc method, being equal to EVP = 680 mm/year. This resulted in an initial R E C H = 849 mm, which was then refined in the calibration stage. While precipitation is seasonally varying in the study area, during the initial setup of the model a transient recharge function (correlated to the precipitation rates) only induced a larger computational time without significant improvement in terms of model accuracy. Therefore, we decided to simplify the modeling analysis by keeping a constant recharge.
Since automatic calibration of MODFLOW-NWT was not implemented in ModelMuse v.4.3, manual calibration of the flow model was adopted. The calibration encompassed three main parameters: the hydraulic conductivity of the hydrofacies, K; the areal recharge, R E C H ; the values of the time-dependent constant-head boundary conditions. Calibration was achieved by minimizing the root mean square error (RMSE) calculated from the difference between calculated and observed hydraulic head levels collected in three different monitoring surveys:
  • a survey during which the hydraulic barrier was active (“t1”, 28 June 2018);
  • a survey during which the hydraulic barrier was active (“t2”, 5 February 2019);
  • a survey carried out 24 h after t2, during which the hydraulic barrier was stopped (“t3”, 6 February 2019).
For all three reference datasets, a satisfactory model fitting with RMSE close to 0.05–0.06 was achieved, as indicated in the Supplementary Materials. The resulting hydraulic gradients and the calibrated K (Table 1) were consistent with those reported in the literature for other parts of the PON [1]. The resulting areal recharge was R E C H = 656 mm/y. This value determines that the evapotranspiration of the study area is E V T = 354 mm/year, i.e., about 50% of the EVT calculated with the Turc method reported by Ducci and Sellerino [49] and about 260% of the E V T calculated by the same authors for the city of Naples. This result is consistent with the different land-use characteristics between the study area and the more urbanized setting of the city of Naples. Note that, for calibration purposes, it was not possible to use any existing head measurements before 2018, due to the imprecise knowledge of the topographic reference at the boreholes (i.e., the datum, z), from which the hydraulic head (h) was computed. In 2018 a topographic survey of the area was carried out with the aim of verifying more accurately the exact z (and in turn, h) of each borehole present on site.
A sensitivity analysis (Supplementary Materials) was performed to facilitate the identification of the parameters that have the greatest influence on the hydrogeological system and to corroborate the parameters obtained during the calibration stage [41]. We focused mainly on the sensitivity of the model to variations of K up to one order of magnitude (lower or higher than the calibrated value). The results suggest that the calibrated K values are quite sensitive to small changes of K , supporting the reliability of the identified dataset for the modeling analysis.

2.2.2. Transport Model Setup

The code MT3DMS was used to simulate the main transport mechanisms that control the migration of dissolved 1,1-DCE in the aquifer. The equations solved by MT3DMS are presented in Appendix B. Key elements for the solute transport model setup were the position of a contamination source in the aquifer that contributed to generate a 1,1-DCE plume under GTR and the parameters feeding the governing equations of MT3DMS.
We hypothesized a potential source that could be physically consistent with nature of 1,1-DCE and that could explain the concentrations measured at the monitoring boreholes. Specifically, we focused on EMW12, where a well-defined and complete breakthrough curve (BTC) of 1,1-DCE was recorded between 2011 and 2014 and could be used to compare and validate the model results against a reference dataset. The selection of this piezometer was also motivated by the fact that EMW12 was the first borehole where 1,1-DCE was detected in the site.
The solute release zone was modelled as a continuous source, mathematically reproduced through a prescribed-concentration boundary condition. The source concentration, C s [mg/L], was treated as a fitting parameter. The position of the source was located considering that 1,1-DCE is a dense non-aqueous phase liquid (DNAPL), with solubility of about 2400 mg/L at 20 °C and a specific gravity of 1.22 [50]. When large amounts of 1,1-DCE are spilled, separate phases of 1,1-DCE can migrate under gravitative forces until capillary barriers are encountered. DNAPL pools may form on top of fine-grained low-K horizons. Along its way, part of the DNAPL mass can be trapped by the porous medium in residual quantities. Both the residual zone and the pools behave as a source of the aqueous plumes of chlorinated solvents [24,51,52]. We have no knowledge of the possible presence of DNAPL pools in the site, also due to the relatively low concentrations of the 1,1-DCE compared to its solubility limit. As such, one hypothesis was that the aqueous 1,1-DCE source may be associated with some residual compounds trapped above fine-grained horizons, such as the paleosols belonging to the Campanian Ignimbrite.
Longitudinal dispersivity was set to α L = 10 m. Transverse horizontal and vertical dispersivity were set respectively as α T h = 0.1 α l and α T v = 0.01 α z [53]. The effective aqueous molecular diffusion of 1,1-DCE in porous media was calculated as D m = τ D , where τ = 0.5 is the tortuosity coefficient and D = 1.04 × 10 9 m2/s is the free diffusion coefficient of 1,1-DCE in water [54]. The porosity was set to ϕ = 0.25. The retardation factor R was calculated considering ρ s = 2.2 × 10 6 g/m3, f o c = 0.01   and   K o c = 5.2 × 10 5 m3/g [55]. The calculated retardation factor was R = 1.46, which indicates that 1,1-DCE is poorly retarded and, therefore, quickly transported in groundwater. This is consistent with the behavior of 1,1-DCE described by European guidelines [55], which suggested that this compound was unlikely to be adsorbed to the sediment due to its low K o c . All transport parameters are set as homogeneous and isotropic, assuming that the flow and transport variability is mainly associated with the variability in K.

3. Results

3.1. Validation of the Hypothesized Process

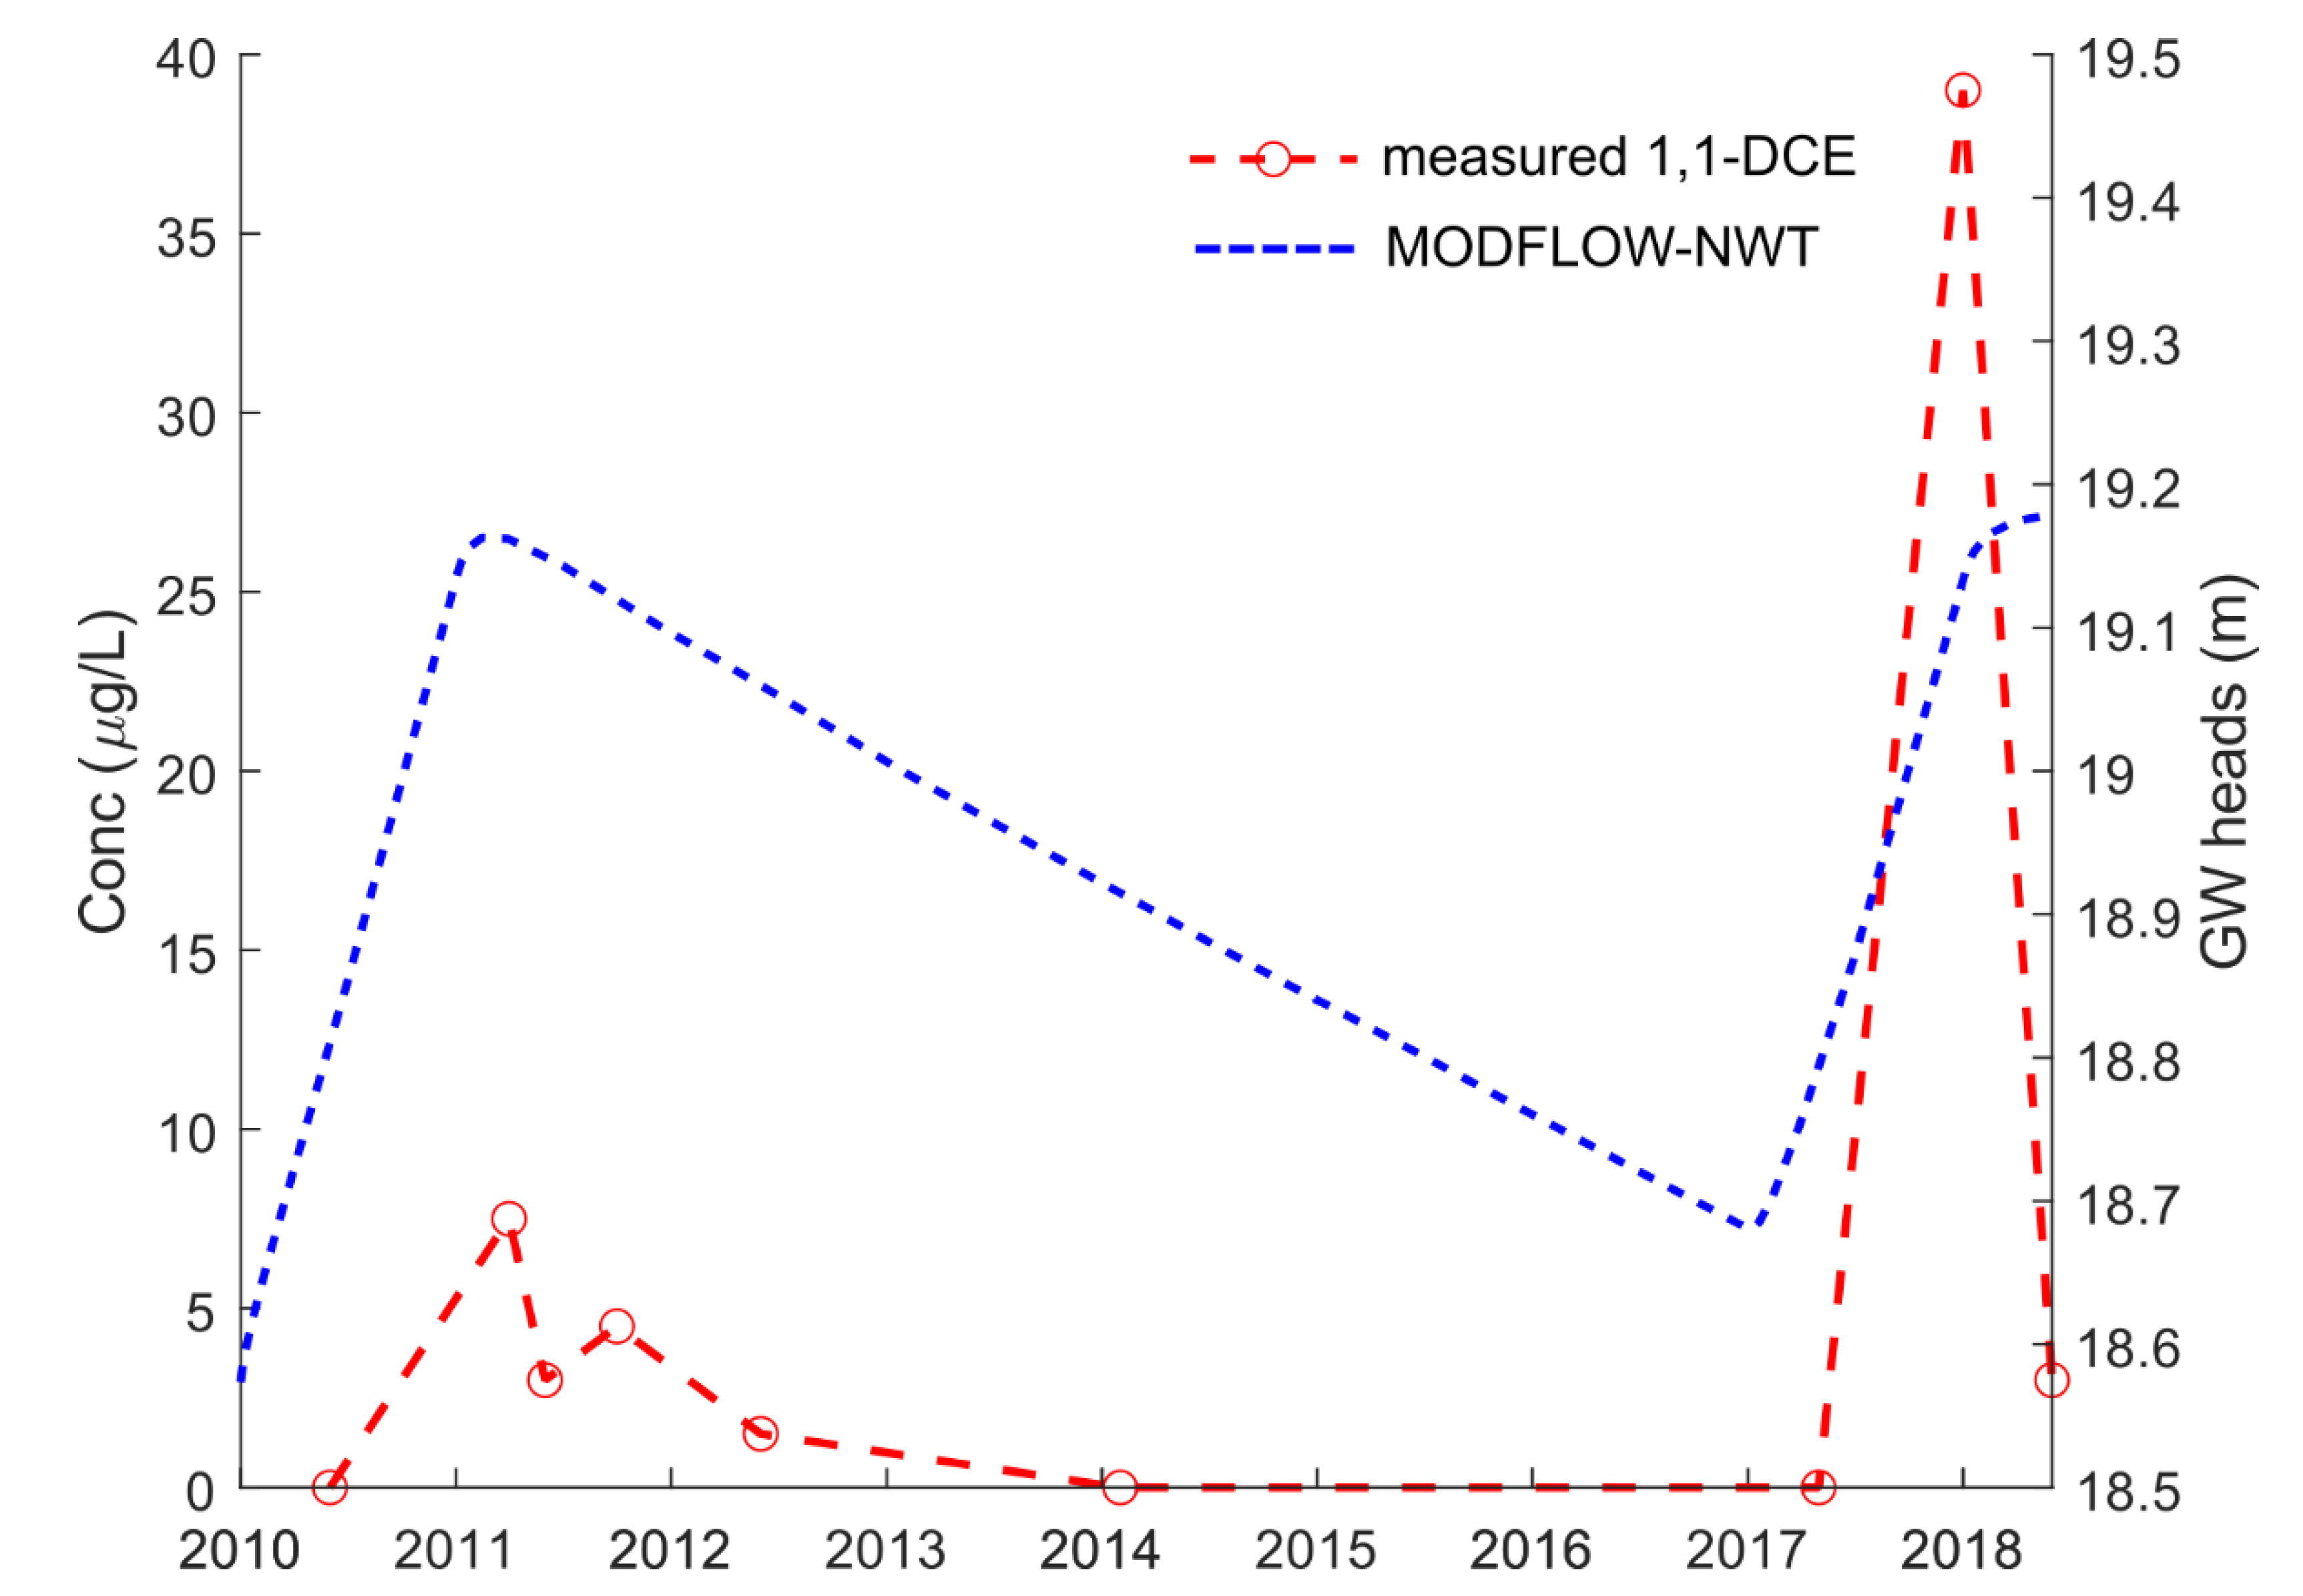
A first important result of our analysis was that the flow model developed using MODFLOW-NWT provided a well-defined correlation between the trends of the calculated groundwaters heads and the measured concentrations of 1,1-DCE. Figure 5 reports the calculated hydrograph at piezometer EWM12 and the 1,1-DCE BTC at the same piezometer. We found that the flow model simulated a transient and non-monotonic evolution of the aquifer water table between 2010 and 2019. The water table increased up to a maximum head ( h ) of h = 19.2 m in 2011, under the effects of the GTR. Then, it decreased to a relative minimum of h = 18.7 m, and ultimately rose again h = 19.2 m until mid-2018.
Observing the measured concentrations at the piezometer EWM12, we found that the shape of the 1,1-DCE breakthrough curve (BTC) resembled quite closely the head time series. A first BTC peak close to 7.5 µg/L was observed in 2011, shortly after the maximum h detected in the same year. The BTC shows a progressive decrease in concentrations as the water table drops, reaching low values close to the CSC levels in 2014. A second BTC peak was observed shortly after the water table began rising again in 2017. These observations suggest that the hypothesized process is consistent with the flow model results, corroborating that new contaminant plumes may indeed form in the site as a consequence of GTR.
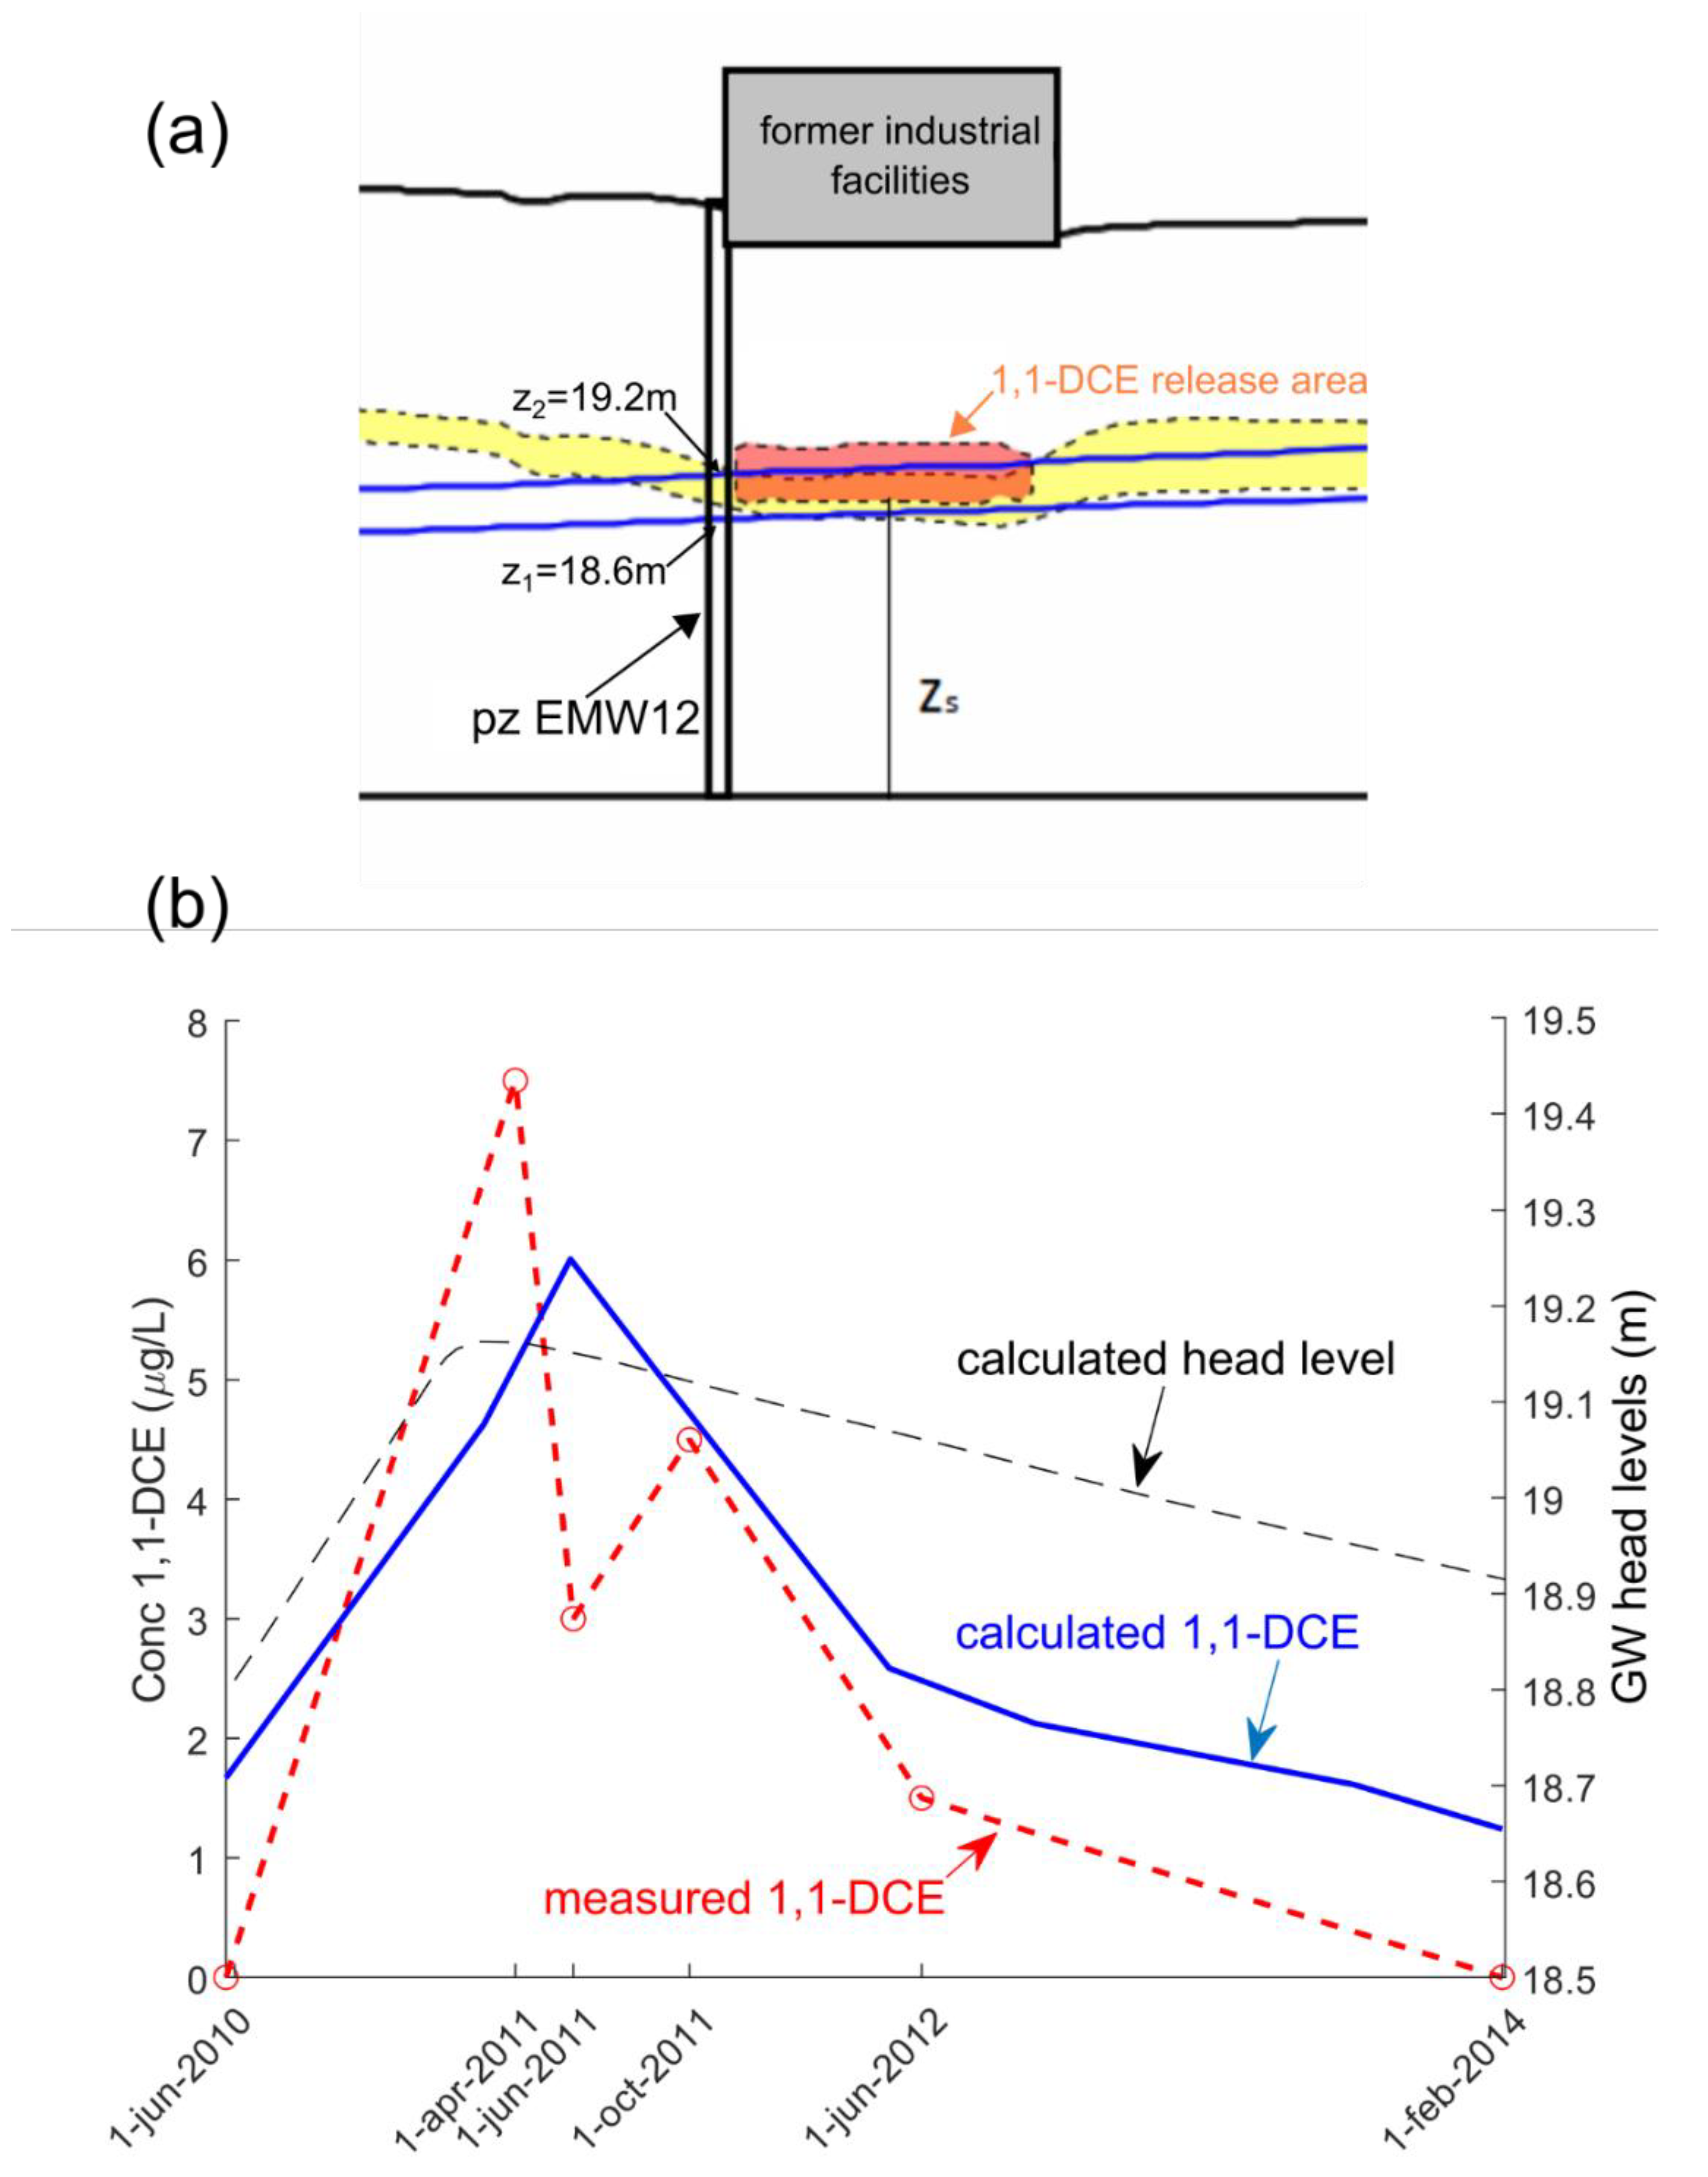
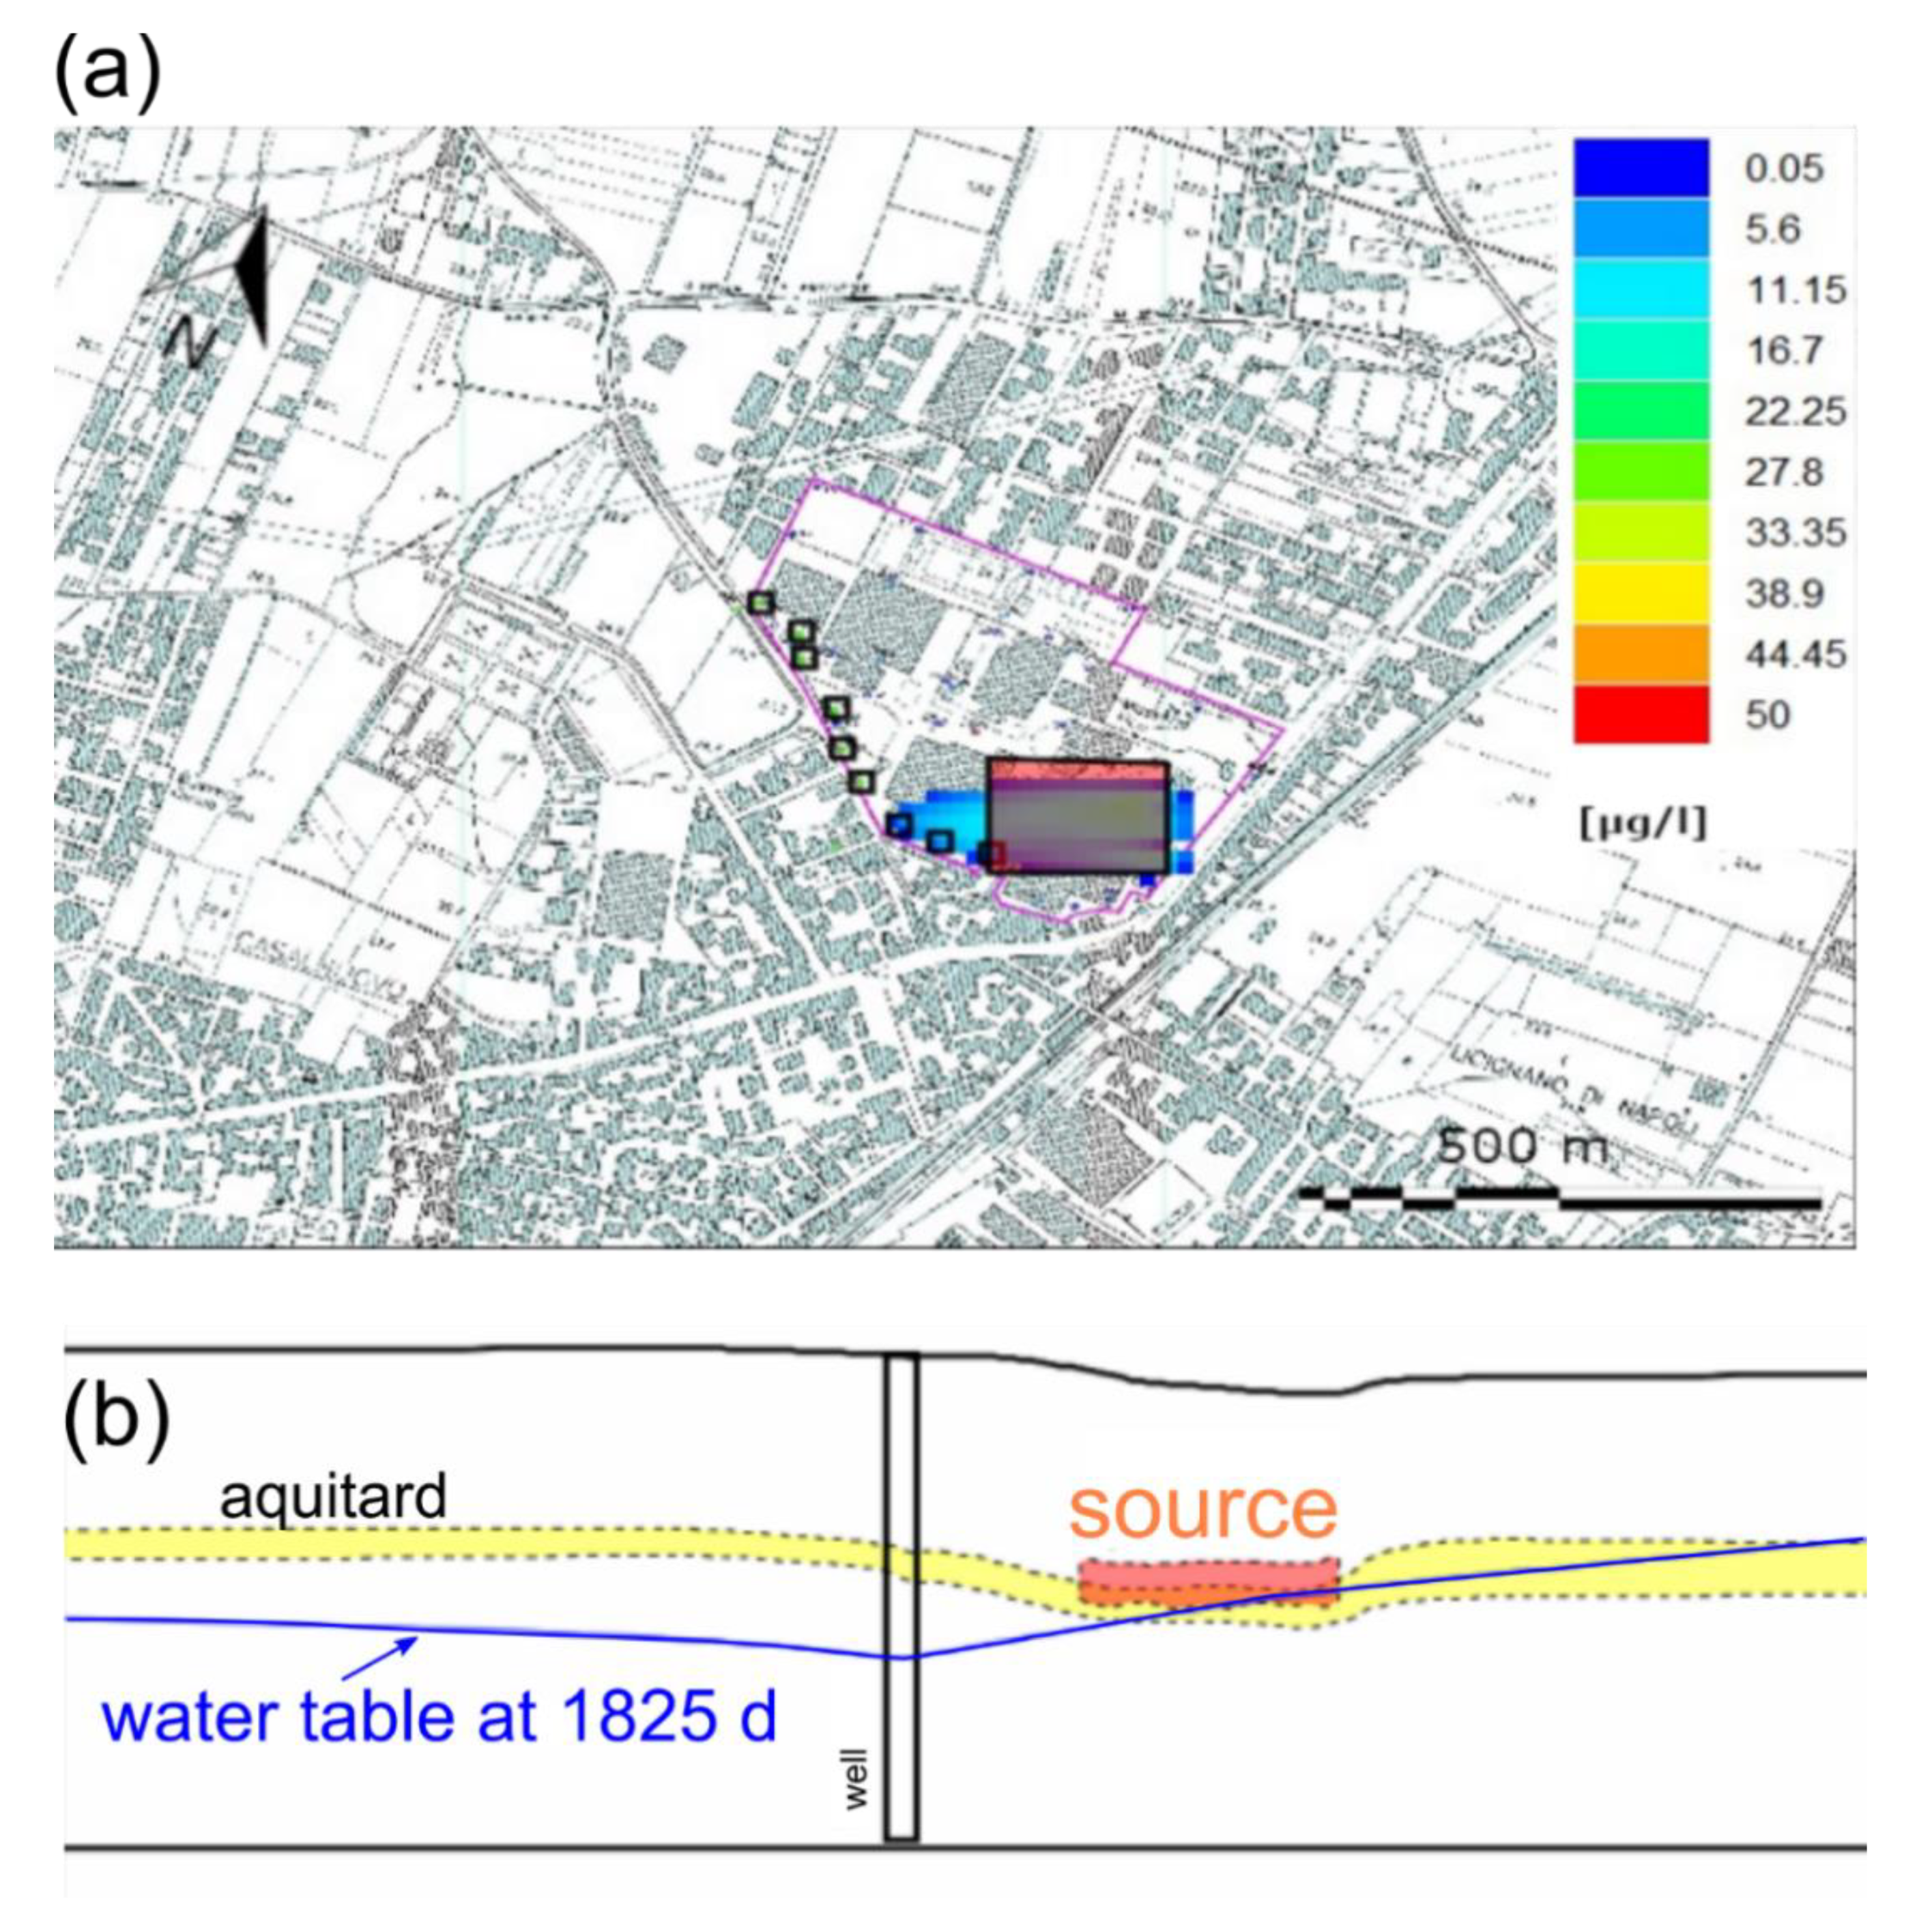
A second result that further supports the proposed conceptual model is obtained from the transport simulations. In Figure 6, the top part of the figure (Figure 6a) shows the vertical position of a hypothesized source of 1,1-DCE located in the proximity of EMW12. The source was located in the model cells on top and within the fine-grained paleosols, which is represented by the yellow layer in the figure. At the beginning of the simulation, the paleosol is found mostly under unsaturated condition, given that its bottom part ( Z B O T ) lies at an elevation lower than the water table ( z 1 = 18.6 m). As the water table tends to higher values ( z 2 19.2 m), a new condition Z B O T < z 2 progressively takes place, implying that solutes can leach out from the source.
The simulated 1,1-DCE BTC at EWM12 matches quite well the first peak of the observed BTC. Figure 6b shows that the rising part of the calculated BTC occurs when the water table increases, reaching a peak of 6 µg/L which is comparable to the measured concentrations (7.5 µg/L). The shape of the tailing (i.e., the post-peak part) of the simulated BTC is also very similar to the tailing of the measured BTC. After an initial steep drop in concentrations after the peak, both measured and simulated BTCs tend to a flatter descent. The fact that the sole fitting parameter of the transport simulation was the specified concentration at the source, which was set to 50 µg/L after some initial calibration, is highly satisfactory. It means that the model correctly captures the mechanisms associated with the formation of the new plume without overparameterization (i.e., forcing the model parameters to reproduce the wanted behavior). This renders the model suitable for predictive use, such as to build up scenarios that could redesign the P&T, as described in the next section.

3.2. Scenarios of P&T Adjustment

The transport model was used to re-design the hydraulic barrier with the goal of containing the 1,1-DCE spilling from the hypothesized source. Two different scenarios were evaluated:
  • Scenario 1: increasing the current pumping rate Q w of each well by 0.002 m3/s;
  • Scenario 2: increasing the current pumping rate Q w of each well by 0.005 m3/s.
The model was run for a total simulated time of 1825 days (5 years), using February 2019 as the starting point (time t = 0). An initial steady-state simulation was run to find the initial spatial distribution of 1,1-DCE concentrations. We considered a continuous and steady increase of the water table by a factor of 0.01 m per year, which was obtained extrapolating the values applied to the constant-head boundary conditions in the 2003–2019 period.
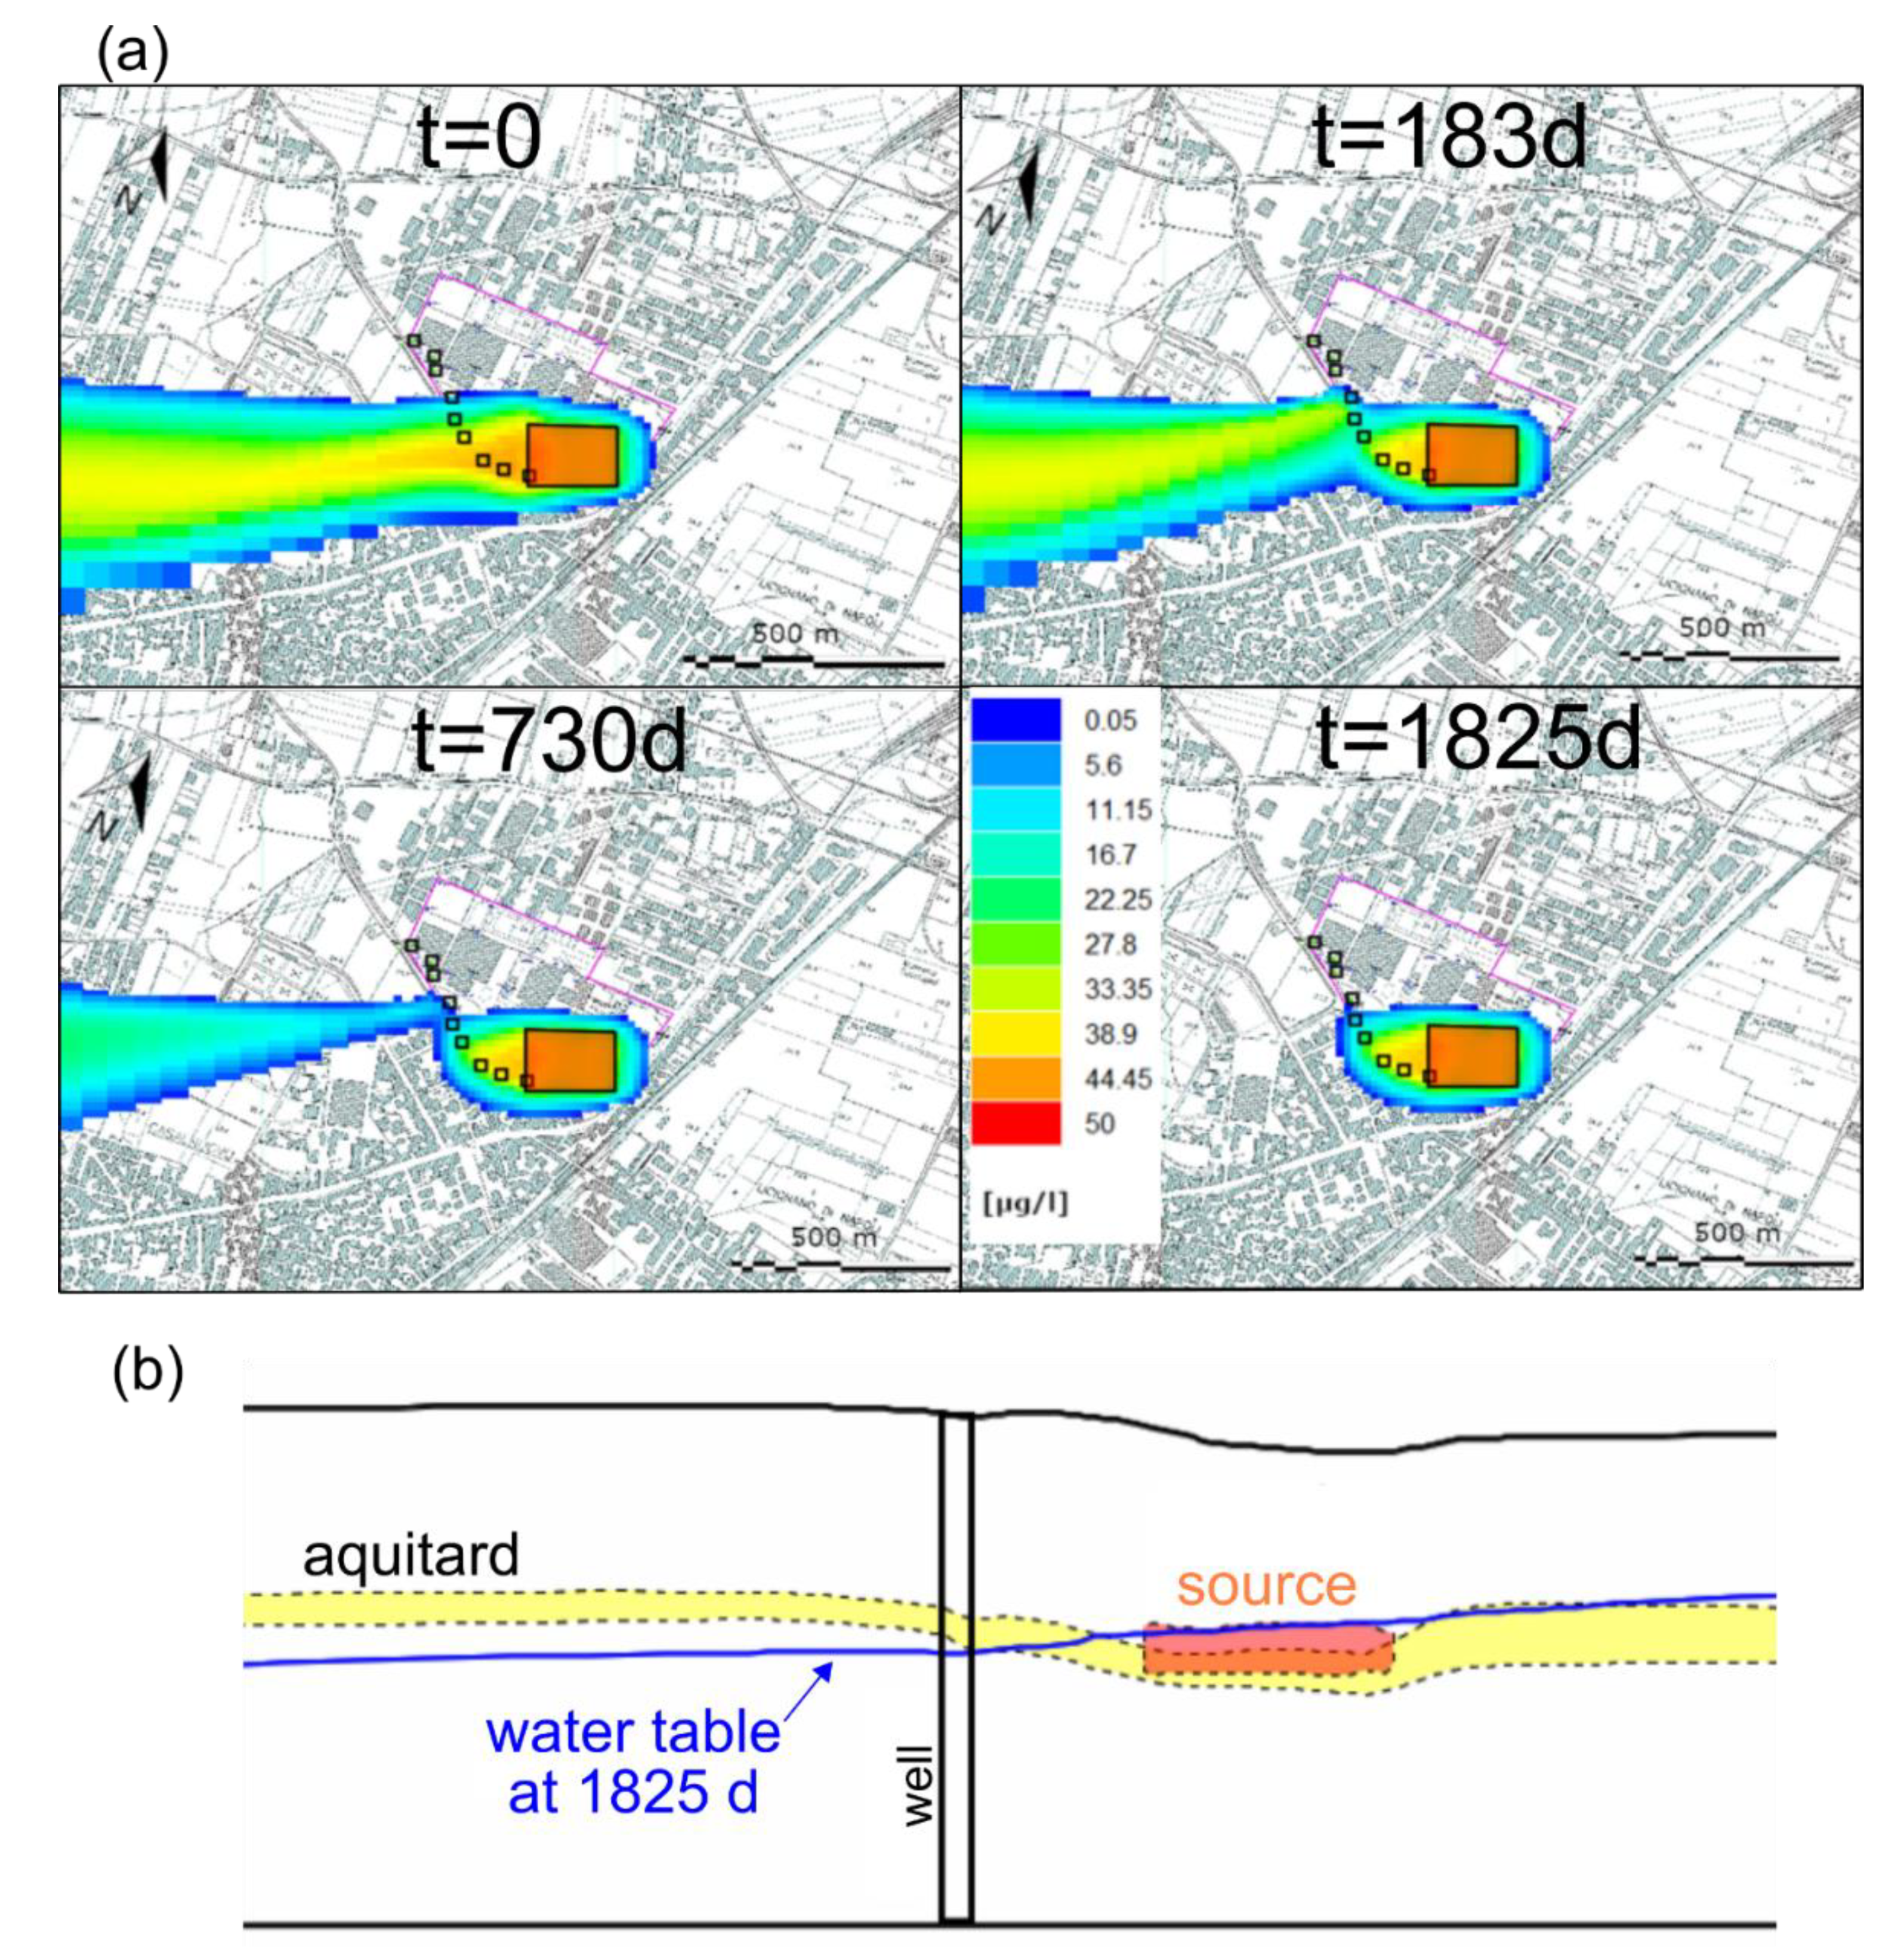
At t = 0, the pumping rates are those currently adopted at the site and used for the model calibration. The steady state simulation (Figure 7a) shows that the plume is not captured by the current hydraulic barrier (square symbols in the figure). The solutes can escape downgradient of the source and beyond the barrier, eventually reaching the outflow boundary. The travel path is aligned according to the mean groundwater flow direction, oriented NNE-SSW.
For scenario 1 (Figure 7a) an increase of Q w by 0.002 m3/s enhances the performance of the P&T system. With time, the plume tends to be almost entirely contained by the hydraulic barrier. At t = 183 days (six months from the beginning of the simulated time), the plume starts to become separated in two parts by the barrier, a process which is completed around t = 730 days (two years). At t = 1825 days (five years), the plume is mainly contained within the hydraulic barrier, while the rest of the plumes have already migrated downgradient and is out of the modelled domain. Concentrations exceeding the threshold of 0.05 µg/L are still found downgradient of the P&T system, suggesting that the pumping rates imposed to Scenario 1 are still not sufficient to ensure a complete plume confinement. Figure 7b shows the relative position of the water table compared to the position of the source at the end of the simulations. Note that the source lies below the water table, suggesting that the source can release aqueous contaminants to the aquifer, generating the solute plume.
A different result is obtained considering Scenario 2 (Figure 8), which entails higher pumping rates than Scenario 1—specifically, an increase of Q w by 0.005 m3/s compared to the current rates. At t = 1825 days, we found that the plume is completely contained by the P&T. The final concentrations are lower than in Scenario 1, and no solute particles escape downgradient of the hydraulic barriers. The higher effectiveness of Scenario 2 can be explained by two simultaneous factors. A higher Q w implies a larger capture zone of the pumping wells, as such the effectiveness of the P&T system is higher. At the same time, a higher Q w lowers the water table in the proximity of the source, determining that the aquifer switches locally from saturated to unsaturated conditions. This second mechanism can be graphically appreciated comparing the position of the water table relative to the position of the source. While in Scenario 1 (Figure 7b) the source remained flooded by the groundwater, in Scenario 2 the water table is mainly found below the source. This implies that in Scenario 2 the source is no longer able to release any contaminant to the aquifer. The validity of this conclusion is further discussed in the next section.

4. Discussion

This study showed that GTR can generate new solute plumes and, therefore, create a potential risk of groundwater pollution in the presence of undetected contaminant sources located in the vadose zone. While the analyzed example focused on a well-defined polluting point-source (the former industrial complex), GTR may determine a generalized increase of aquifer contamination risks when the contaminant sources are diffused.
This issue poses a special concern for areas that are notoriously affected by unknown waste disposals, such as the illegal waste sparsely distributed in the Northwest of Naples [56], in the so-called “triangle of death” [22]. However, our results should pose a concern for other areas that are not directly affected by industrial waste deposits and not necessarily characterized by illegal or improper waste dumping.
For instance, Selim et al. [20] discussed the environmental impact of the water rising at Aswan city in Egypt. Selim et al. suggested that, given the highly evaporative dry climate, the capillary action drew the salty groundwater towards the surface and into the porous walls and foundations of the buildings. Moreover, they indicated that in urban environments GTR can inundate communication networks, wastewater sewage systems, pipes of drinking water distribution networks, high-voltage electrical cables, and others. Similar problems were highlighted by Al-Sefry and Şen [15], who considered the area of Jeddah in Saudi Arabia. At the end of the 2000s, a water table increase of about 0.1 m per year was observed, as associated to leakages from the water supply pipes, irrigation tanks, sewage water leakages and other leakages from surface water storages.
These works highlighted potential sources of groundwater contamination that may create solute plumes in case of water table rising. The modeling framework developed in the present study could be directly applied to evaluate the impact of pollutants that can be flushed by rising aquifer. Moreover, process-based modeling could be also used to build predictive scenarios to calculate future risks associated with the water table rising, such as to evaluate the implication of a climate-change driven water table rising in coastal areas [11,12].
A result of our modeling analysis was that lowering the groundwater table by increasing the pumping decreased the formation of solute plumes in the aquifer. Note that this fact does not entail that no contaminant will eventually be released from the source and transported to the aquifer. Lowering the water table is expected to be insufficient to produce aquifer self-remediation to a contamination by organic compound. Although in the vadose zone gas diffusion may sustain aerobic (bio)degradation of certain organic compound, including 1,1-DCE [57] at shallower parts of an aquifer, at deeper parts oxygen tends to be rapidly consumed by the degradation of organic matter and other biochemical reactions, urging methods such as air sparing [58] to boost bioremediation. Part of the trapped mass of the non-degraded source may be mobilized during rainfall-driven infiltration. While our model analysis neglected the effects of infiltration although the vadose zone, such a mechanism is not expected to play a key role compared to the more dominant effect associated with the groundwater table fluctuation. However, this aspect will be worth evaluating in follow-up studies on the site.
Ultimately, it is noted that the developed model could be easily extended to address cost-based optimization of the P&T system, for instance when MODFLOW and MT3DMS are coupled to cost-based optimization algorithms [59]. The water treatment costs are possibly the most critical operative issue when running P&T systems [26,28,29]. Our results indicated that higher pumping rates may reduce the contaminant mass that can be released from polluted sources with time by keeping the water table below the identified contaminant sources. As such, flow and transport model optimization could be used to find the minimum pumping rates that are needed to satisfy this condition. This aspect will be also explored in future developments.

5. Conclusions

The adopted numerical modeling framework satisfactorily supports the proposed conceptual model. The models confirmed the existence of a relationship between the increase in piezometric level and the appearance of 1,1-DCE at a key piezometer of the site, explaining why this contaminant was never found during the characterization phases of the site.
The first appearance of the contaminant inside the site occurs when groundwater reached a local maximum peak in 2011. After a well-defined rise of the breakthrough curve and groundwater head levels, a subsequent decrease in both heads and concentrations was observed, reaching a minimum concentration in 2014. The concentrations in 2014 were close to the maximum concentration levels admitted by law when the water table reached local minima. When the water table increased again in 2017, a new concentration peak was observed. This event was correctly captured by the flow model. The transport model allowed postulating the presence of a potential contaminant source located in a fine-grained layer topping the polluted aquifer. This position is consistent with the physical and chemical nature of the contaminant (a chlorinated solvent behaving as a DNAPL), further stressing the mechanistic validity of the adopted modeling approach.
The model was used to simulate two predictive scenarios that help in redesigning the P&T system and improve its efficiency to confine the emerging contaminant plume under GTR. In Scenario 1, increasing the pumping rate of each well by 0.002 m3/s compared to their current rate provided a better hydraulic control of the plume, although the solute source keeps generating aqueous-phase contamination. This means that the P&T system cannot be stopped, entailing high long-term operational costs associated with the water treatment. In Scenario 2, increasing the pumping rate by 0.005 m3/s lowered the water table below the source. As such, the source is no longer active and the water treatment system could be virtually stopped, given that no more aqueous contamination is generated. This last solution could result in a more cost-effective use of the P&T system.

Supplementary Materials

The following are available online at https://www.mdpi.com/article/10.3390/pollutants1020007/s1, 1: Additional information on the geological background; 2 Stratigraphic cross-sections of the contaminated site; 3 Interpolated surfaces of the model layers; 4 Time-dependent constant-head boundary conditions; 5 Pumping rates used in the numerical model; 6 Calibration plots and sensitivity analysis.

Author Contributions

Conceptualization: all authors; methodology, S.V., D.P. and G.P.B.; model development and validation, S.V. and D.P.; database, L.R. and P.R. writing—original draft preparation, D.P.; supervision, D.P. All authors have read and agreed to the published version of the manuscript.

Funding

This research received no external funding.

Data Availability Statement

Data supporting the reported results can be found in the Supplementary Materials.

Acknowledgments

We acknowledge the comments by three anonymous Reviewers, who helped increasing the quality of our manuscript. The results here presented have been developed in the frame of the MIUR Project “Dipartimenti di Eccellenza 2017—Le Geoscienze per la societa’: risorse e loro evoluzione”.

Conflicts of Interest

The authors declare no conflict of interest.

Appendix A

The flow equation resolved by MODFLOW-NWT combines the Darcy’s law (by which the specific flow rate of a fluid q [m/s] through a fully saturated porous medium are directly proportional to the hydraulic gradients, h / x , where h [m] is the head level, and scaled by the hydraulic conductivity, K [m/s]) and the mass conservation (by which the difference between the inward and outward flow into an elementary volume is proportional to the transient change of head levels, h / t , where t [s] is time, scaled by the storage coefficient).
For a system aligned along the Cartesian axes (x,y,z), the resulting governing flow equation for a confined aquifer can be mathematically written as:
x ( K x x h x ) + y ( K y y h y ) + z ( K z z h z ) + w = S s h t
where K x x ,   K y y ,   K z z [m/s] are the hydraulic conductivity values, w [s−1] accounts for the presence of sinks and sources (e.g., discharge from pumping wells, Q w [m3/s], per unit volume of aquifer) and S s [m−1] is the specific storage coefficient.
For an unconfined aquifer, the equation can be written as:
x ( K x x h h x ) + y ( K y y h h y ) + z ( K z z h h z ) + w = S y h t
where S y [-] is the yield coefficient. In (A2), the presence of an additional h in each flow term determines the non-linearity in the solution of the governing equation.
In the classic versions of MODFLOW (2005 or earlier), simulation of groundwater flow in unsaturated cells was not explicitly allowed. A cell became dry, and thus “inactive”, if h Z B O T , where Z B O T is the elevation of the cell bottom. To simulate a condition by which part of one cell become saturated with time (therefore, “active”), a heuristic “rewetting” function was introduced [60] to activate the cell in case of recovery of the condition h > Z B O T . Such a recovery could occur either because of the flow from adjacent cells or because of a temporal variation in a boundary condition (e.g., recharge). The rewetting function caused instability and oscillations in the numerical solution, partially due to the Picard’s iterative method implemented in original MODFLOW codes [30,44,45,46]. Such instabilities were exacerbated when numerous cells in a system were activated and/or deactivated due to the transient saturation condition and in the presence of aquifer heterogeneities (strong contrasts in K). MODFLOW-NWT can efficiently resolve the rewetting condition using a Newton-based algorithm, which renders the solution numerically stable [30].

Appendix B

The equations solved by MT3DMS are presented below for a 1-D case oriented along the “x” axis. The change of concentrations in space and time, C (mg/L) can be written as:
D l 2 C x 2 + D t 2 C y 2 + D z 2 C z 2 u x C x = R C t
where u x = q x / ϕ [m/s], q x [m/s] represents the specific discharge rate calculated by MODFLOW-NWT in the x direction, ϕ [-] is the porosity, R [-] is the retardation coefficient, D l , D t , D z [m2/s] are respectively the coefficients of longitudinal, horizontal and vertical dispersivity, defined as:
D l = D x x = a L u x + D m D t = D y y = a T h u x + D m D z = D z z = a T v u x + D m
where α L ,   α T h , α T v [m] are respectively the local longitudinal, horizontal and vertical transverse dispersion and D m [m2/s] is the molecular diffusion coefficient. The equations can be defined in a similar manner for the other flow directions ( y and z ).
The retardation coefficient, R [-], is a dimensionless scaling factor that depends on the reactions affecting a compound when it migrates in the aquifer. Considering that 1,1-DCE can adsorb on the aquifer matrix [55], R was computed as
R = 1 + K d ρ b ϕ
where ρ b = ( 1 ϕ ) ρ S [g/m3] is the bulk density, ρ s [g/m3] is the matrix density and K d [m3/g] is the distribution coefficient, which expresses the relationship between the concentration of a substance in the solid phase and the concentration of the same substance in the liquid phase. For organic substances, such as 1,1-DCE, K d can be calculated as the ratio of the concentration of the adsorbed compound to organic carbon and the concentration of the compound dissolved in water, such that K d = K o c f o c , where K o c [m3/g] is the organic carbon/water partition coefficient and f o c [-] is the organic carbon content of the sorbent, in units of mass of organic carbon (OC) per mass of soil (g OC/g soil).

References

  1. Coda, S.; Tessitore, S.; Di Martire, D.; Calcaterra, D.; De Vita, P.; Allocca, V. Coupled ground uplift and groundwater rebound in the metropolitan city of Naples (southern Italy). J. Hydrol. 2019, 569, 470–482. [Google Scholar] [CrossRef]
  2. Kreibich, H.; Thieken, A.H. Assessment of damage caused by high groundwater inundation. Water Resour. Res. 2008, 44. [Google Scholar] [CrossRef]
  3. Abu-Rizaiza, O.S.; Sarikaya, H.Z.; Khan, M.Z.A. Urban groundwater rise control: Case study. J. Irrig. Drain. Eng. 1989, 115, 588–607. [Google Scholar] [CrossRef]
  4. Brassington, F.C. Rising groundwater levels in the UK. Proc. Inst. Civ. Eng. 1990, 88, 1037–1057. [Google Scholar] [CrossRef]
  5. El Sheikh, A.E.; El Osta, M.M.; El Sabri, M.A. Study of the Phenomenon of Groundwater Levels Rise in South El Qantara Shark Area, Ismailia, Egypt. Hydrogeol. Hydrol. Eng. 2013, 9, 2. [Google Scholar]
  6. Bhaskar, A.S.; Beesley, L.; Burns, M.J.; Fletcher, T.D.; Hamel, P.; Oldham, C.E.; Roy, A.H. Will it rise or will it fall? Managing the complex effects of urbanization on base flow. Freshw. Sci. 2016, 35, 293–310. [Google Scholar] [CrossRef] [Green Version]
  7. Bob, M.; Rahman, N.A.; Elamin, A.; Taher, S. Rising groundwater levels problem in urban areas: A case study from the central area of madinah city, saudi arabia. Arab. J. Sci. Eng. 2015, 41, 1461–1472. [Google Scholar] [CrossRef]
  8. Yihdego, Y.; Danis, C.; Paffard, A. Why is the groundwater level rising? A case study using Hartt to simulate groundwater level dynamic. Water Environ. Res. 2017, 89, 2142–2152. [Google Scholar] [CrossRef]
  9. De Caro, M.; Crosta, G.B.; Previati, A. Modelling the interference of underground structures with groundwater flow and remedial solutions in Milan. Eng. Geol. 2020, 272, 105652. [Google Scholar] [CrossRef]
  10. Kacimov, A.R.; Al-Maktoumi, A.; Šimůnek, J. Water table rise in urban shallow aquifer with vertically-heterogeneous soils: Girinskii’s potential revisited. Hydrol. Sci. J. 2021, 1–14. [Google Scholar] [CrossRef]
  11. Rotzoll, K.; El-Kadi, A.I. Estimating hydraulic properties of coastal aquifers using wave setup. J. Hydrol. 2008, 353, 201–213. [Google Scholar] [CrossRef]
  12. Knott, J.F.; Elshaer, M.; Daniel, J.S.; Jacobs, J.M.; Kirshen, P. Assessing the effects of rising groundwater from sea level rise on the service life of pavements in coastal road infrastructure. Transp. Res. Rec. J. Transp. Res. Board 2017, 2639, 1–10. [Google Scholar] [CrossRef] [Green Version]
  13. May, C. Rising groundwater and sea-level rise. Nat. Clim. Chang. 2020, 10, 889–890. [Google Scholar] [CrossRef]
  14. Vázquez-Suñé, E.; Sanchez-Vila, X.; Carrera, J. Introductory review of specific factors influencing urban groundwater, an emerging branch of hydrogeology, with reference to Barcelona, Spain. Hydrogeol. J. 2005, 13, 522–533. [Google Scholar] [CrossRef]
  15. Al-Sefry, S.A.; Şen, Z. Groundwater rise problem and risk evaluation in major cities of arid lands—Jedddah case in Kingdom of Saudi Arabia. Water Resour. Manag. 2006, 20, 91–108. [Google Scholar] [CrossRef]
  16. Brain, W. Rising groundwater levels in London and possible effects on engineering structures. In Proceedings of the 18th Congress of the IAH, Cambridge, UK, 8–13 September 1985; pp. 145–157. [Google Scholar]
  17. Attard, G.; Winiarski, T.; Rossier, Y.; Eisenlohr, L. Review: Impact of underground structures on the flow of urban groundwater. Hydrogeol. J. 2015, 24, 5–19. [Google Scholar] [CrossRef]
  18. Allocca, V.; Coda, S.; De Vita, P.; Iorio, A.; Viola, R. Rising groundwater levels and impacts in urban and semirural areas around Naples (southern Italy). Rend. Online Soc. Geol. Ital. 2016, 41, 14–17. [Google Scholar]
  19. Al Senafy, M. Management of water table rise at Burgan oil field, Kuwait. Emir. J. Eng. Res. 2011, 16, 27–38. [Google Scholar]
  20. Selim, S.A.; Hamdan, A.M.; Rady, A.A. Groundwater rising as environmental problem, causes and solutions: Case study from aswan city, upper Egypt. Open J. Geol. 2014, 4, 324–341. [Google Scholar] [CrossRef] [Green Version]
  21. Sangodoyin, A.Y. Considerations on contamination of groundwater by waste disposal systems in Nigeria. Environ. Technol. 1993, 14, 957–964. [Google Scholar] [CrossRef]
  22. Senior, K.; Mazza, A. Italian “Triangle of death” linked to waste crisis. Lancet Oncol. 2004, 5, 525–527. [Google Scholar] [CrossRef]
  23. Kaya, M.A.; Özürlan, G.; Şengül, E. Delineation of soil and groundwater contamination using geophysical methods at a waste disposal site in Çanakkale, Turkey. Environ. Monit. Assess. 2007, 135, 441–446. [Google Scholar] [CrossRef] [PubMed]
  24. Pedretti, D.; Masetti, M.; Beretta, G.P.; Vitiello, M. A Revised Conceptual Model to Reproduce the Distribution of Chlorinated Solvents in the Rho Aquifer (Italy). Ground Water Monit. Remediat. 2013, 33, 69–77. [Google Scholar] [CrossRef]
  25. Allocca, V.; Celico, P. Hydrodynamics scenarios in the eastern plain of Naples (Italy), in the last century: Causes and hydrogeological implications. G. Geol. Appl. 2008, 9, 175–198. [Google Scholar]
  26. Bayer, P.; Michael, F.; Georg, T. Combining pump-and-treat and physical barriers for contaminant plume control. Ground Water 2004, 42, 856–867. [Google Scholar] [CrossRef]
  27. Javandel, I.; Tsang, C.-F. Capture-zone type curves: A tool for aquifer cleanup. Ground Water 1986, 24, 616–625. [Google Scholar] [CrossRef]
  28. Pedretti, D. Heterogeneity-controlled uncertain optimization of pump-and-treat systems explained through geological entropy. GEM—Int. J. Geomath. 2020, 11, 1–27. [Google Scholar] [CrossRef]
  29. Casasso, A.; Tosco, T.; Bianco, C.; Bucci, A.; Sethi, R. How can we make pump and treat systems more energetically sustainable? Water 2019, 12, 67. [Google Scholar] [CrossRef] [Green Version]
  30. Niswonger, R.G.; Panday, S.; Ibaraki, M. MODFLOW-NWT, A Newton formulation for MODFLOW-2005. Tech. Methods 2011, 6, 44. [Google Scholar] [CrossRef] [Green Version]
  31. Zheng, C.; Wang, P.P. MT3DMS, A Modular Three-Dimensional Multispecies Transport Model for Simulation of Advection, Dispersion, and Chemical Reactions of Contaminants in Groundwater Systems; Documentation and User’s Guide; University of Alabama: Tuscaloosa, AL, USA, 1999; Available online: https://www.researchgate.net/publication/242586434_ (accessed on 22 September 2015).
  32. Patacca, E.; Sartori, R.; Scandone, P. Tyrrhenian basin and Apenninic arcs: Kinematic relations since late Tortonian times. Mem. Della Soc. Geol. Ital. 1990, 45, 425–451. [Google Scholar]
  33. Rolandi, G.; Bellucci, F.; Heizler, M.T.; Belkin, H.E.; De Vivo, B. Tectonic controls on the genesis of ignimbrites from the Campanian Volcanic Zone, southern Italy. Miner. Pet. 2003, 79, 3–31. [Google Scholar] [CrossRef]
  34. Bellucci, F. Nuove conoscenze stratigrafiche sui depositi vulcanici del sottosuolo del settore meridionale della Piana Campana. Boll. Della Soc. Geol. Ital. 1994, 113, 395–420. [Google Scholar]
  35. Santacroce, R.; Sbrana, A.; Sulpizio, R.; Zanchetta, G.; Perrone, V.; Bravi, S. Progetto CARG-ISPRA-Foglio 448 Ercolano. Available online: https://www.isprambiente.gov.it/Media/carg/note_illustrative/448_Ercolano.pdf (accessed on 22 September 2014).
  36. Celico, P.; Esposito, L.; De Gennaro, M.; Mastrangelo, E. La falda ad Oriente della città di Napoli: Idrodinamica e qualità delle acque. Geol. Romana 1994, 30, 653–660. [Google Scholar]
  37. Italian, D. Italian Legislative Decree No. 152 approving the Code on the Environment. Gazzetta Ufficiale della Repubblica Italiana No. 88. 2006. Available online: http://www.fao.org/faolex/results/details/en/c/LEX-FAOC064213/ (accessed on 3 April 2021).
  38. Dagan, G. Flow and Transport in Porous Formations; Springer: Berlin/Heidelberg, Germany, 1989; p. 465. [Google Scholar]
  39. Pedretti, D.; Bianchi, M. Reproducing tailing in breakthrough curves: Are statistical models equally representative and predictive? Adv. Water Resour. 2018, 113, 236–248. [Google Scholar] [CrossRef] [Green Version]
  40. Zheng, C.; Bennett, G.D. Applied Contaminant Transport Modeling, 2nd ed.; John Wiley & Sons: New York, NY, USA, 2002; p. 656. [Google Scholar]
  41. Anderson, M.P.; Woessner, W.W.; Hunt, R.J. Applied Groundwater Modeling: Simulation of Flow and Advective Transport, 2nd ed.; Elsevier, Science B. V.: Amsterdam, The Netherlands, 2015. [Google Scholar]
  42. Freeze, R.A.; Cherry, J.A. Groundwater; Prentice-Hall: Englewood Cliffs, NJ, USA, 1979. [Google Scholar]
  43. Harbaugh, A.W. MODFLOW-2005: The U.S. Geological Survey modular ground-water model--the ground-water flow process. In Techniques and Methods; US Geological Survey: Reston, VI, USA, 2005. [Google Scholar]
  44. Bedekar, V.; Niswonger, R.G.; Kipp, K.; Panday, S.; Tonkin, M. Approaches to the simulation of unconfined flow and perched groundwater flow in modflow. Ground Water 2011, 50, 187–198. [Google Scholar] [CrossRef] [PubMed]
  45. Keating, E.; Zyvoloski, G. A stable and efficient numerical algorithm for unconfined aquifer analysis. Ground Water 2009, 47, 569–579. [Google Scholar] [CrossRef]
  46. Painter, S.; Başağaoğlu, H.; Liu, A. Robust representation of dry cells in single-layer modflow models. Ground Water 2008, 46, 873–881. [Google Scholar] [CrossRef] [PubMed]
  47. Winston, R.B. ModelMuse Version 4.3 Software Release. U.S. Geological Survey. 2020. Available online: https://water.usgs.gov/water-resources/software/ModelMuse/index4_3.html (accessed on 22 February 2021).
  48. Pedretti, D.; Fiori, A. Travel time distributions under convergent radial flow in heterogeneous formations: Insight from the analytical solution of a stratified model. Adv. Water Resour. 2013, 60, 100–109. [Google Scholar] [CrossRef]
  49. Ducci, D.; Sellerino, M. Groundwater mass balance in urbanized areas estimated by a groundwater flow model based on a 3D hydrostratigraphical model: The case study of the eastern plain of Naples (Italy). Water Resour. Manag. 2015, 29, 4319–4333. [Google Scholar] [CrossRef]
  50. Budavari, S.; O’Neil, M.J.; Smith, A.; Heckelman, P.E. The Merck Index; Merck: Rahway, NJ, USA, 1989. [Google Scholar]
  51. Kueper, B.H. An Illustrated Handbook of DNAPL Transport and Fate in the Subsurface; Environment Agency: Bristol, UK, 2004.
  52. Parker, J.C.; Park, E.; Tang, G. Dissolved plume attenuation with DNAPL source remediation, aqueous decay and volatilization—Analytical solution, model calibration and prediction uncertainty. J. Contam. Hydrol. 2008, 102, 61–71. [Google Scholar] [CrossRef]
  53. Gelhar, L.W.; Welty, C.; Rehfeldt, K.R. A critical review of data on field-scale dispersion in aquifers. Water Resour. Res. 1992, 28, 1955–1974. [Google Scholar] [CrossRef]
  54. EPA. User’s Guide for WATER9 Software; Office of Air Quality Planning and Standards U.S. Environmental Protection Agency: Research Triangle Park, NC, USA, 2001.
  55. ECHA. Guidance on Information Requirements and Chemical Safety Assessment. Chapter R.7b: Endpoint Specific Guidance; Version 4.0; European Chemicals Agency: Helsinki, Finland, 2017; Available online: https://echa.europa.eu/documents/10162/13632/information_requirements_r7b_en.pdf/ (accessed on 22 February 2021).
  56. Ferrara, L.; Iannace, M.; Patelli, A.M.; Arienzo, M. Geochemical survey of an illegal waste disposal site under a waste emergency scenario (Northwest Naples, Italy). Environ. Monit. Assess. 2012, 185, 2671–2682. [Google Scholar] [CrossRef]
  57. Klier, N.; West, R.; Donberg, P. Aerobic biodegradation of dichloroethylenes in surface and subsurface soils. Chemosphere 1999, 38, 1175–1188. [Google Scholar] [CrossRef]
  58. Rabideau, A.J.; Blayden, J.M. Analytical model for contaminant mass removal by air sparging. Ground Water Monit. Remediat. 1998, 18, 120–130. [Google Scholar] [CrossRef]
  59. Wang, M.; Zheng, C. Optimal remediation policy selection under general conditions. Ground Water 1997, 35, 757–764. [Google Scholar] [CrossRef]
  60. McDonald, M.G.; Harbaugh, A.W.; Orr, B.R.; Ackerman, D.J. A Method of Converting No-Flow Cells to Variable-Head Cells for the US Geological Survey Modular Finite-Difference Ground-Water Flow Model; US Dept. of the Interior, US Geological Survey: Reston, VA, USA, 1991.
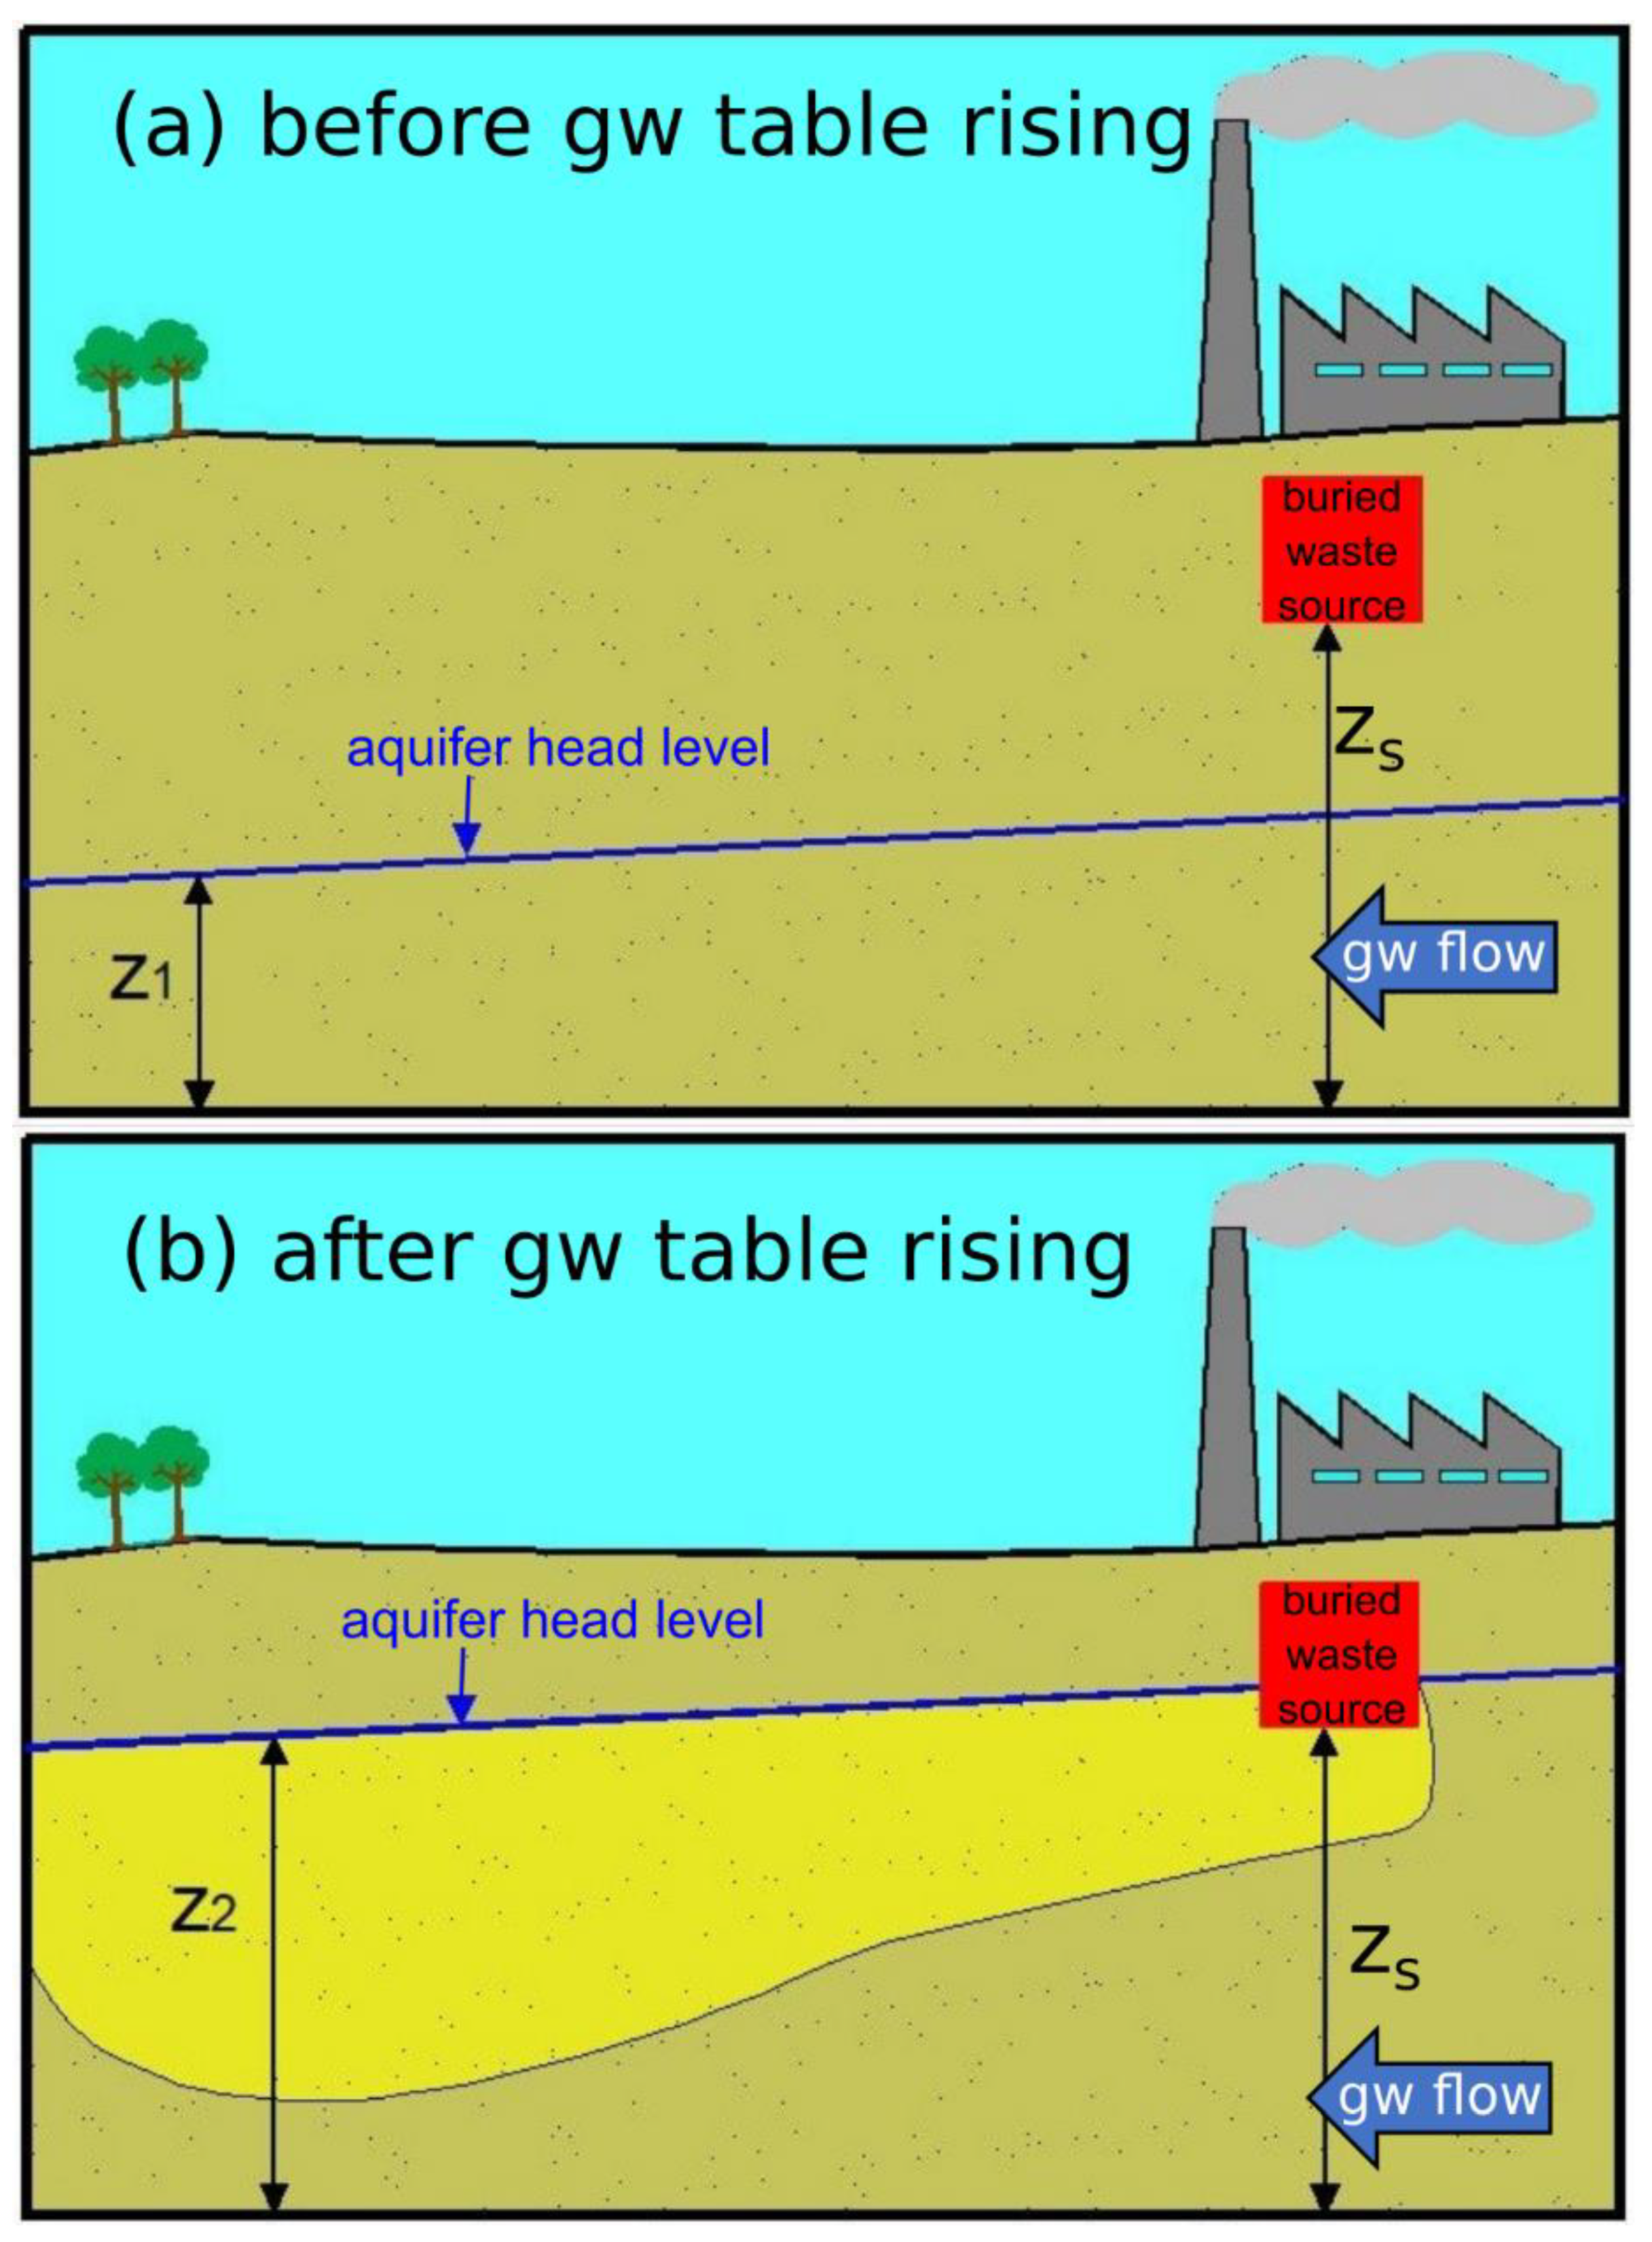
Figure 1. Conceptual model explaining the formation of a solute plume as a consequence of groundwater table rising. (a) During low water table stages, the buried waste source is located in the vadose zone, at an elevation z s higher than the elevation of the water table ( z 1 ). (b) When the water table rises, it reaches a higher elevation ( z 2 ) than z s . Consequently, part of the contaminant can be mobilized and generate a solute plume, which is transported downgradient by the groundwater flow. This conceptual model was used for the modeling analysis presented in this study.
Pollutants 01 00007 g001
Figure 3. Two of the eleven cross sections created using the stratigraphic logs from the boreholes drilled inside the boundaries of the former industrial setting.
Pollutants 01 00007 g003
Figure 4. The model grid extracted from ModelMuse 4.3 reporting the model’s key features. (a) Plane view and (b) vertical section crossing piezometer EMW12. The background image is the technical regional map (in Italian, “carta tecnica regionale”, CTR) of the area.
Pollutants 01 00007 g004
Figure 5. Comparison between the groundwater head levels calculated by MODFLOW-NWT at piezometer EMW12 and the observed breakthrough curve (BTC) of 1,1-dichloroethene (1,1-DCE).
Pollutants 01 00007 g005
Figure 6. (a,b) Comparison between calculated head levels, observed and calculations concentrations 1,1-DCE at piezometer EMW12.
Pollutants 01 00007 g006
Figure 7. Main results from the application of the model in Scenario 1, with wells pumping at a rate individually increased by 0.002 m3/d compared to the current rates. (a) A solute plume is produced, which is collected by the P&T system. The result is shown for model layer 7, which is immediately below the aquitard. (b) After 5 years, the water table remains above the source, generating the plume that travels in layer 7.
Pollutants 01 00007 g007
Figure 8. Main results from the application of the model in Scenario 2, with wells pumping at a rate individually increased by 0.005 m3/d compared to the current rates. (a) Compared to Scenario 1, the solute plume is no longer produced. The result is shown for model layer 7, which is immediately below the aquitard. (b) After 5 years, the water table is below the source, which does not produce any leaching into the saturated zone.
Pollutants 01 00007 g008
Table 1. Model layers properties.
HydrofaciesLayerzs [m]bs [m]K [m/s]
Backfilling material124.52.05.5 × 10−4
Fluvial and lacustrine deposits mixed with volcanic ash-fall deposits222.50.910−5
Paleosol321.61.45 × 10−5
Coarse-grained volcanic deposits with weathered pumice420.22.48 × 10−3
Paleosol5–818.8 *1.4 *5 × 10−5
Ash-fall deposits917.31.35.5 × 10−5
Mixed weathered and unaltered pumice10–1115.22.14.5 × 10−3
Sandy silt1211.24.05.5 × 10−6
z s = mean topographic elevation of the layer in the studied area; b s = mean layer thickness at the site (* average of layers 5–8:); K = calibrated hydraulic conductivity assigned to the layer.
Publisher’s Note: MDPI stays neutral with regard to jurisdictional claims in published maps and institutional affiliations.