
Development of Rare Earth Elements Separation Processes from Coal Fly Ash †


Abstract
:1. Introduction
2. Material and Methods
2.1. Material
2.2. Analytical Methods
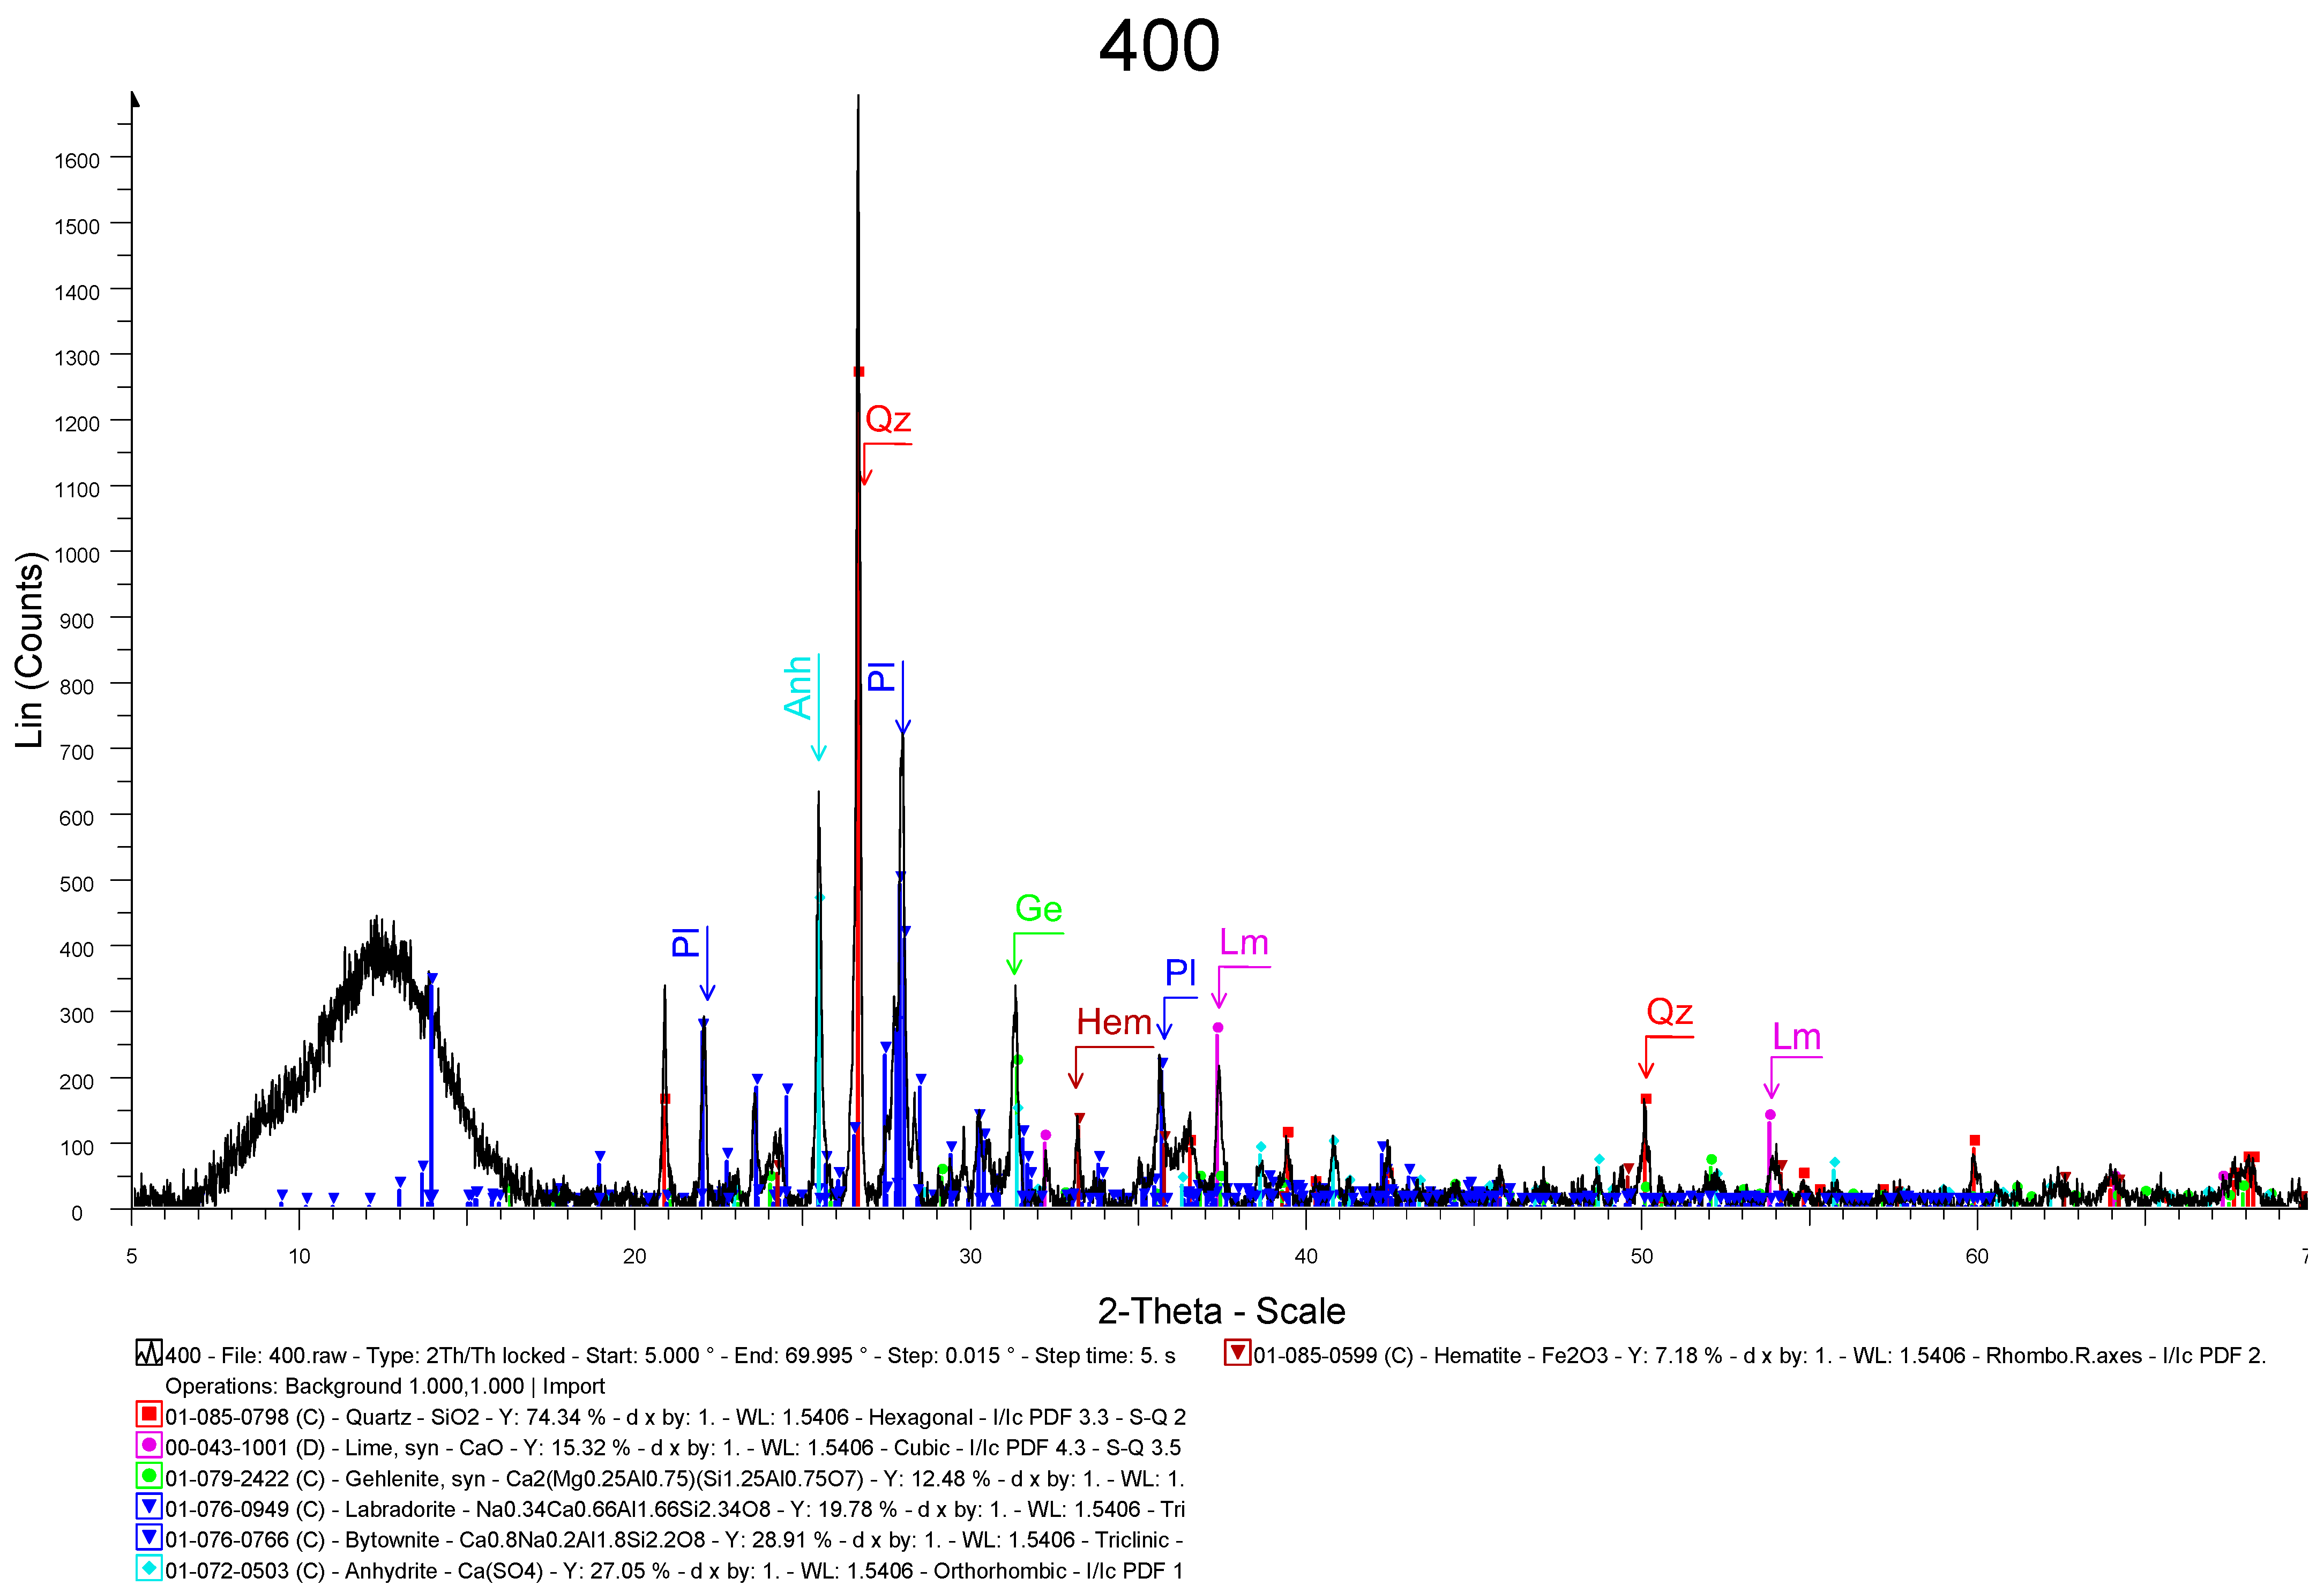
Elemental and Mineralogical Analysis
2.3. Size Separation
3. Results and Discussion
3.1. Material Characterization
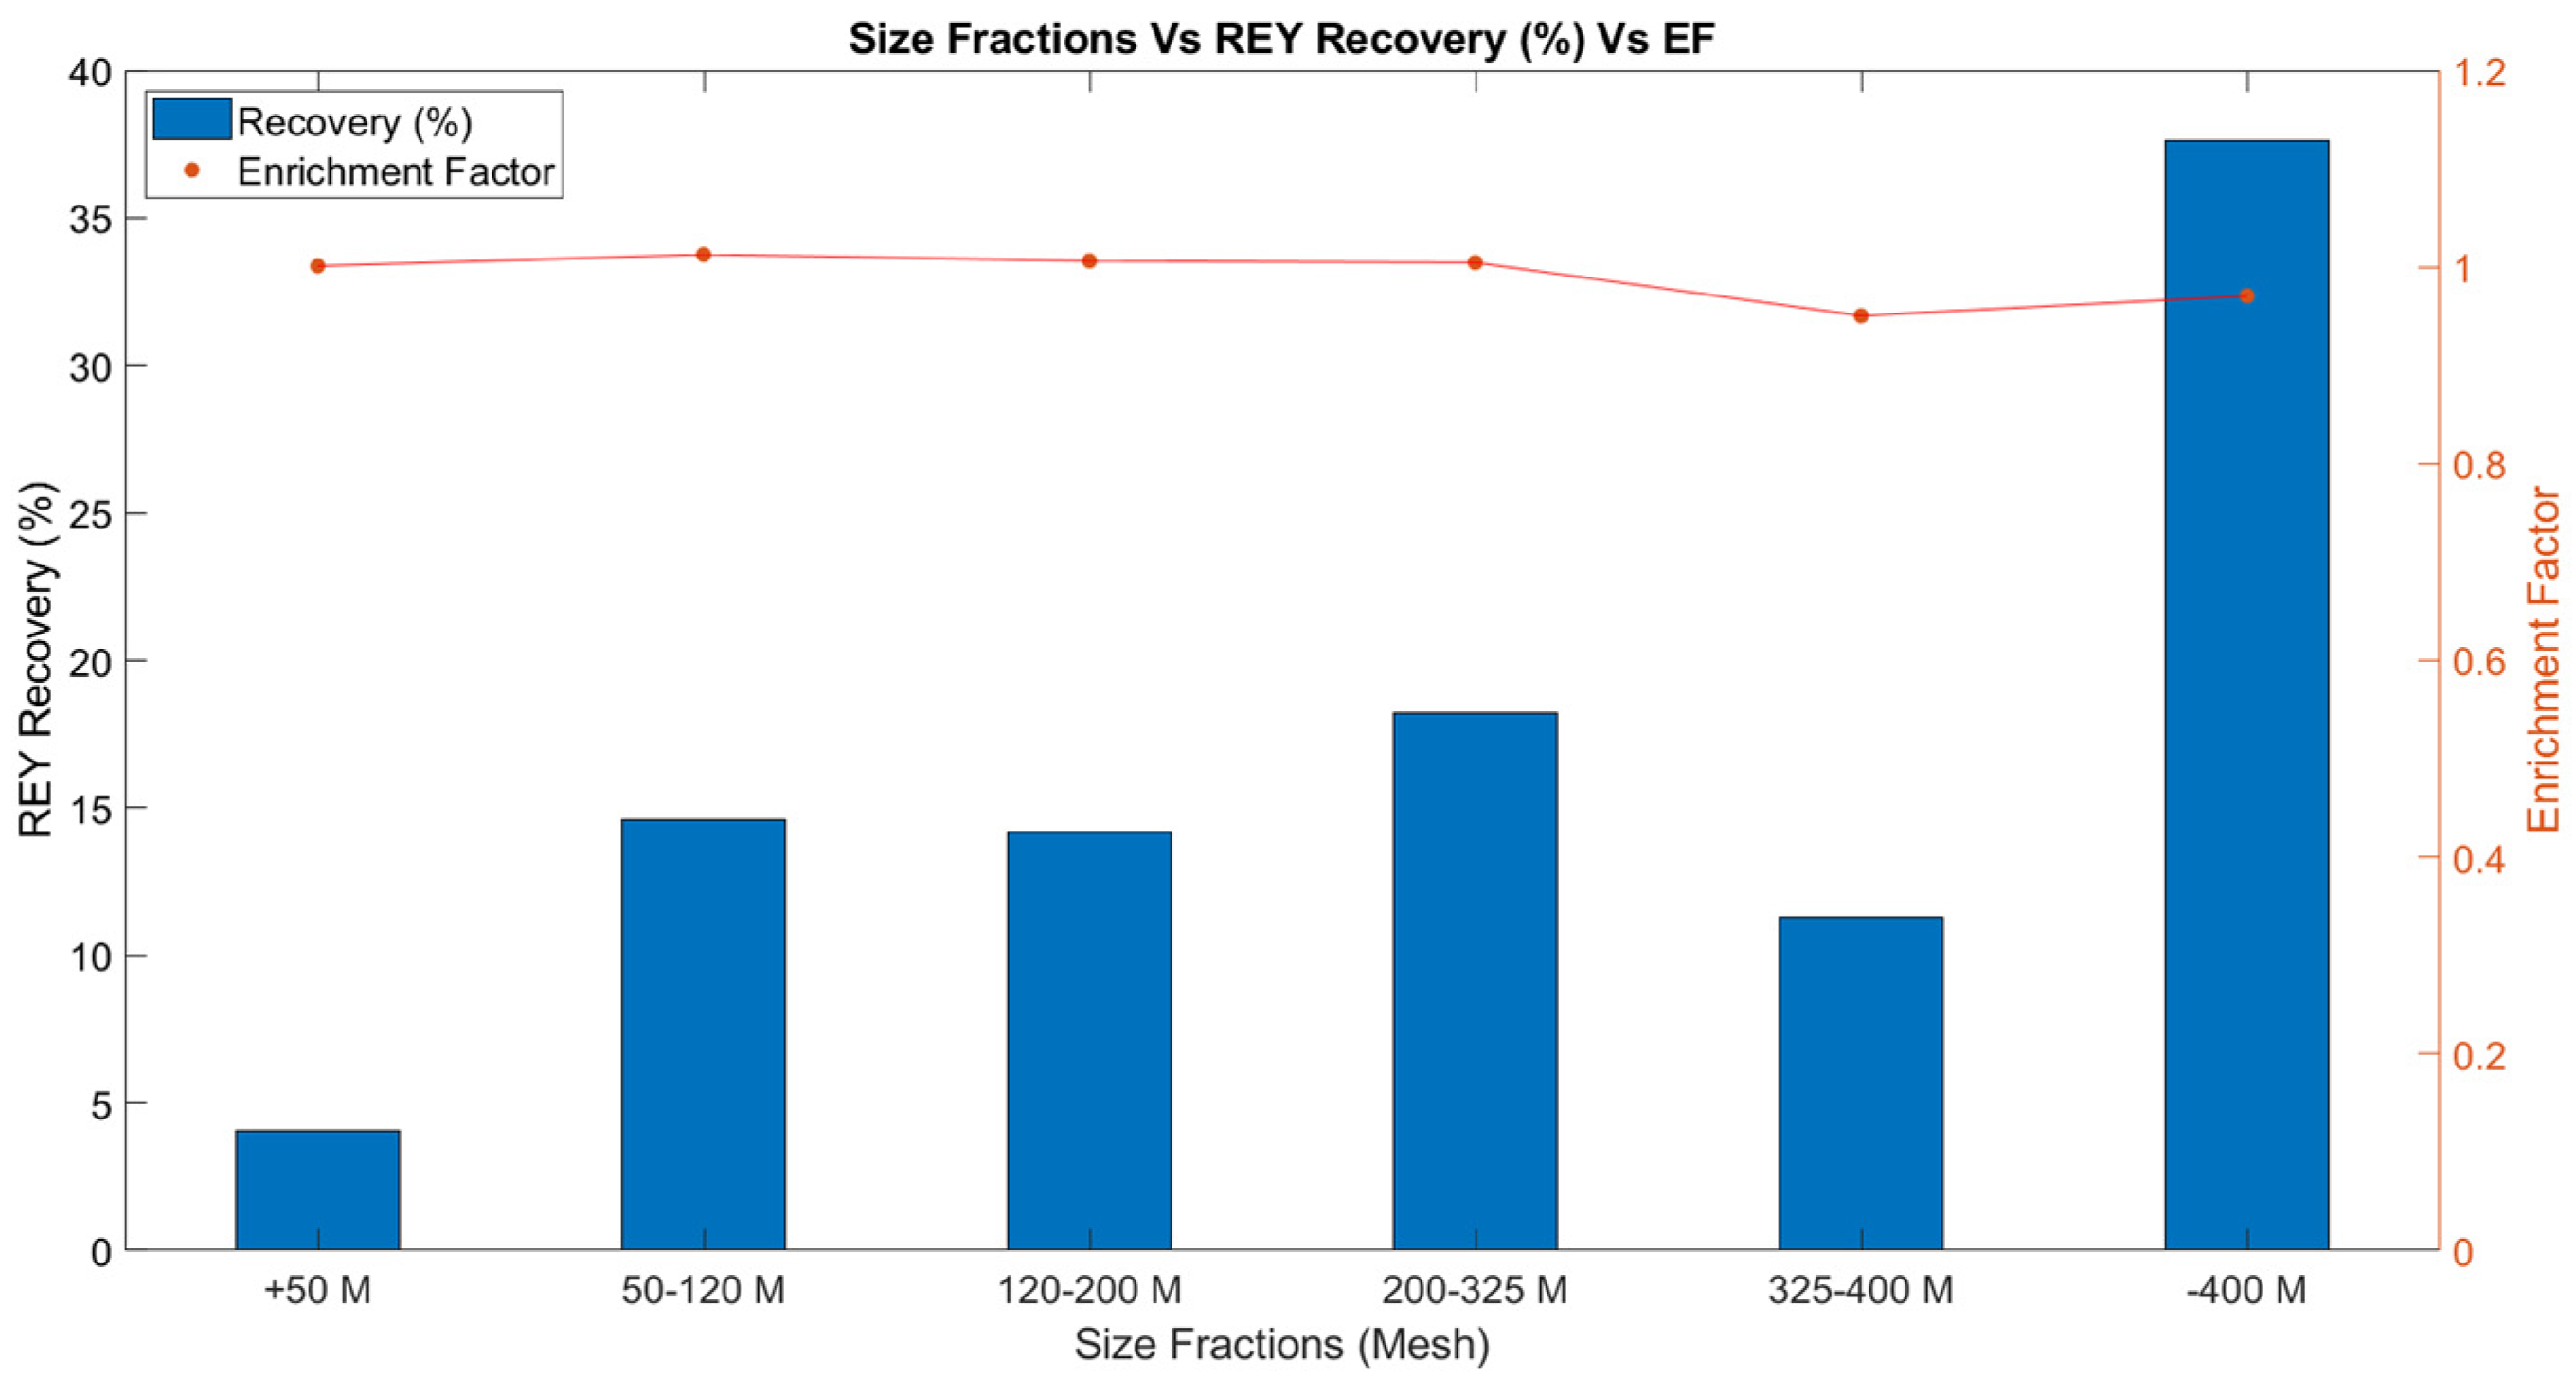
3.2. Size Separation for Potential REY Enrichment
4. Conclusions
Institutional Review Board Statement
Informed Consent Statement
Data Availability Statement
Acknowledgments
References
- Blengini, G.A.; Latunussa, C.E.L.; Eynard, U.; de Matos, C.T.; Wittmer, D.; Georgitzikis, K.; Pavel, C.; Carrara, S.; Mancini, L.; Unguru, M.; et al. Study on the EU’s List of Critical Raw Materials (2020) Final Report; Publications Office of the European Union: Luxembourg, 2020. [Google Scholar] [CrossRef]
- Simoni, M.; Kuhn, E.P.; Morf, L.S.; Kuendig, R.; Adam, F. Urban mining as a contribution to the resource strategy of the Canton of Zurich. Waste Manag. 2015, 45, 10–21. [Google Scholar] [CrossRef]
- Seredin, V.V.; Dai, S. Coal deposits as potential alternative sources for lanthanides and yttrium. Int. J. Coal. Geol. 2012, 94, 67–93. [Google Scholar] [CrossRef]
- Dai, S.; Xie, P.; Jia, S.; Ward, C.R.; Hower, J.C.; Yan, X.; French, D. Enrichment of U-Re-V-Cr-Se and rare earth elements in the Late Permian coals of the Moxinpo Coalfield, Chongqing, China: Genetic implications from geochemical and mineralogical data. Ore Geol. Rev. 2017, 80, 1–17. [Google Scholar] [CrossRef]
- Rosita, W.; Bendiyasa, I.M.; Perdana, I.; Anggara, F. Sequential particle-size and magnetic separation for enrichment of rare-earth elements and yttrium in Indonesia coal fly ash. J. Environ. Chem. Eng. 2020, 8, 103575. [Google Scholar] [CrossRef]
- Hatzistavros, V.S.; Kallithrakas-Kontos, N.G. X-ray fluorescence mercury determination using cation selective membranes at sub-ppb levels. Anal. Chim. Acta 2014, 809, 25–29. [Google Scholar] [CrossRef]
- ASTM C618-12a Standard Specification for Coal Fly Ash and Raw or Calcined Natural Pozzolan for Use in Concrete. Available online: https://www.astm.org/DATABASE.CART/HISTORICAL/C618-12A.htm (accessed on 5 June 2021).
- Blissett, R.S.; Smalley, N.; Rowson, N.A. An investigation into six coal fly ashes from the United Kingdom and Poland to evaluate rare earth element content. Fuel 2014, 119, 236–239. [Google Scholar] [CrossRef] [Green Version]
- Lin, R.; Howard, B.H.; Roth, E.A.; Bank, T.L.; Granite, E.J.; Soong, Y. Enrichment of rare earth elements from coal and coal by-products by physical separations. Fuel 2017, 200, 506–520. [Google Scholar] [CrossRef] [Green Version]
- Wang, S.; Ma, Q.; Zhu, Z.H. Characteristics of unburned carbons and their application for humic acid removal from water. Fuel Process. Technol. 2009, 90, 375–380. [Google Scholar] [CrossRef]
- Bartoňová, L. Unburned carbon from coal combustion ash: An overview. Fuel Process. Technol. 2015, 134, 136–158. [Google Scholar] [CrossRef]
- Abedini, A.; Calagari, A.A. Rare earth element geochemistry of the Upper Permian limestone: The Kanigorgeh mining district, NW Iran. Turk. J. Earth Sci. 2015, 24, 365–382. [Google Scholar] [CrossRef]

| Elements | Bottom Ash | Fly Ash | +50 M | 50–120 M | 120–200 M | 200–325 M | 325–400 M | –400 M |
|---|---|---|---|---|---|---|---|---|
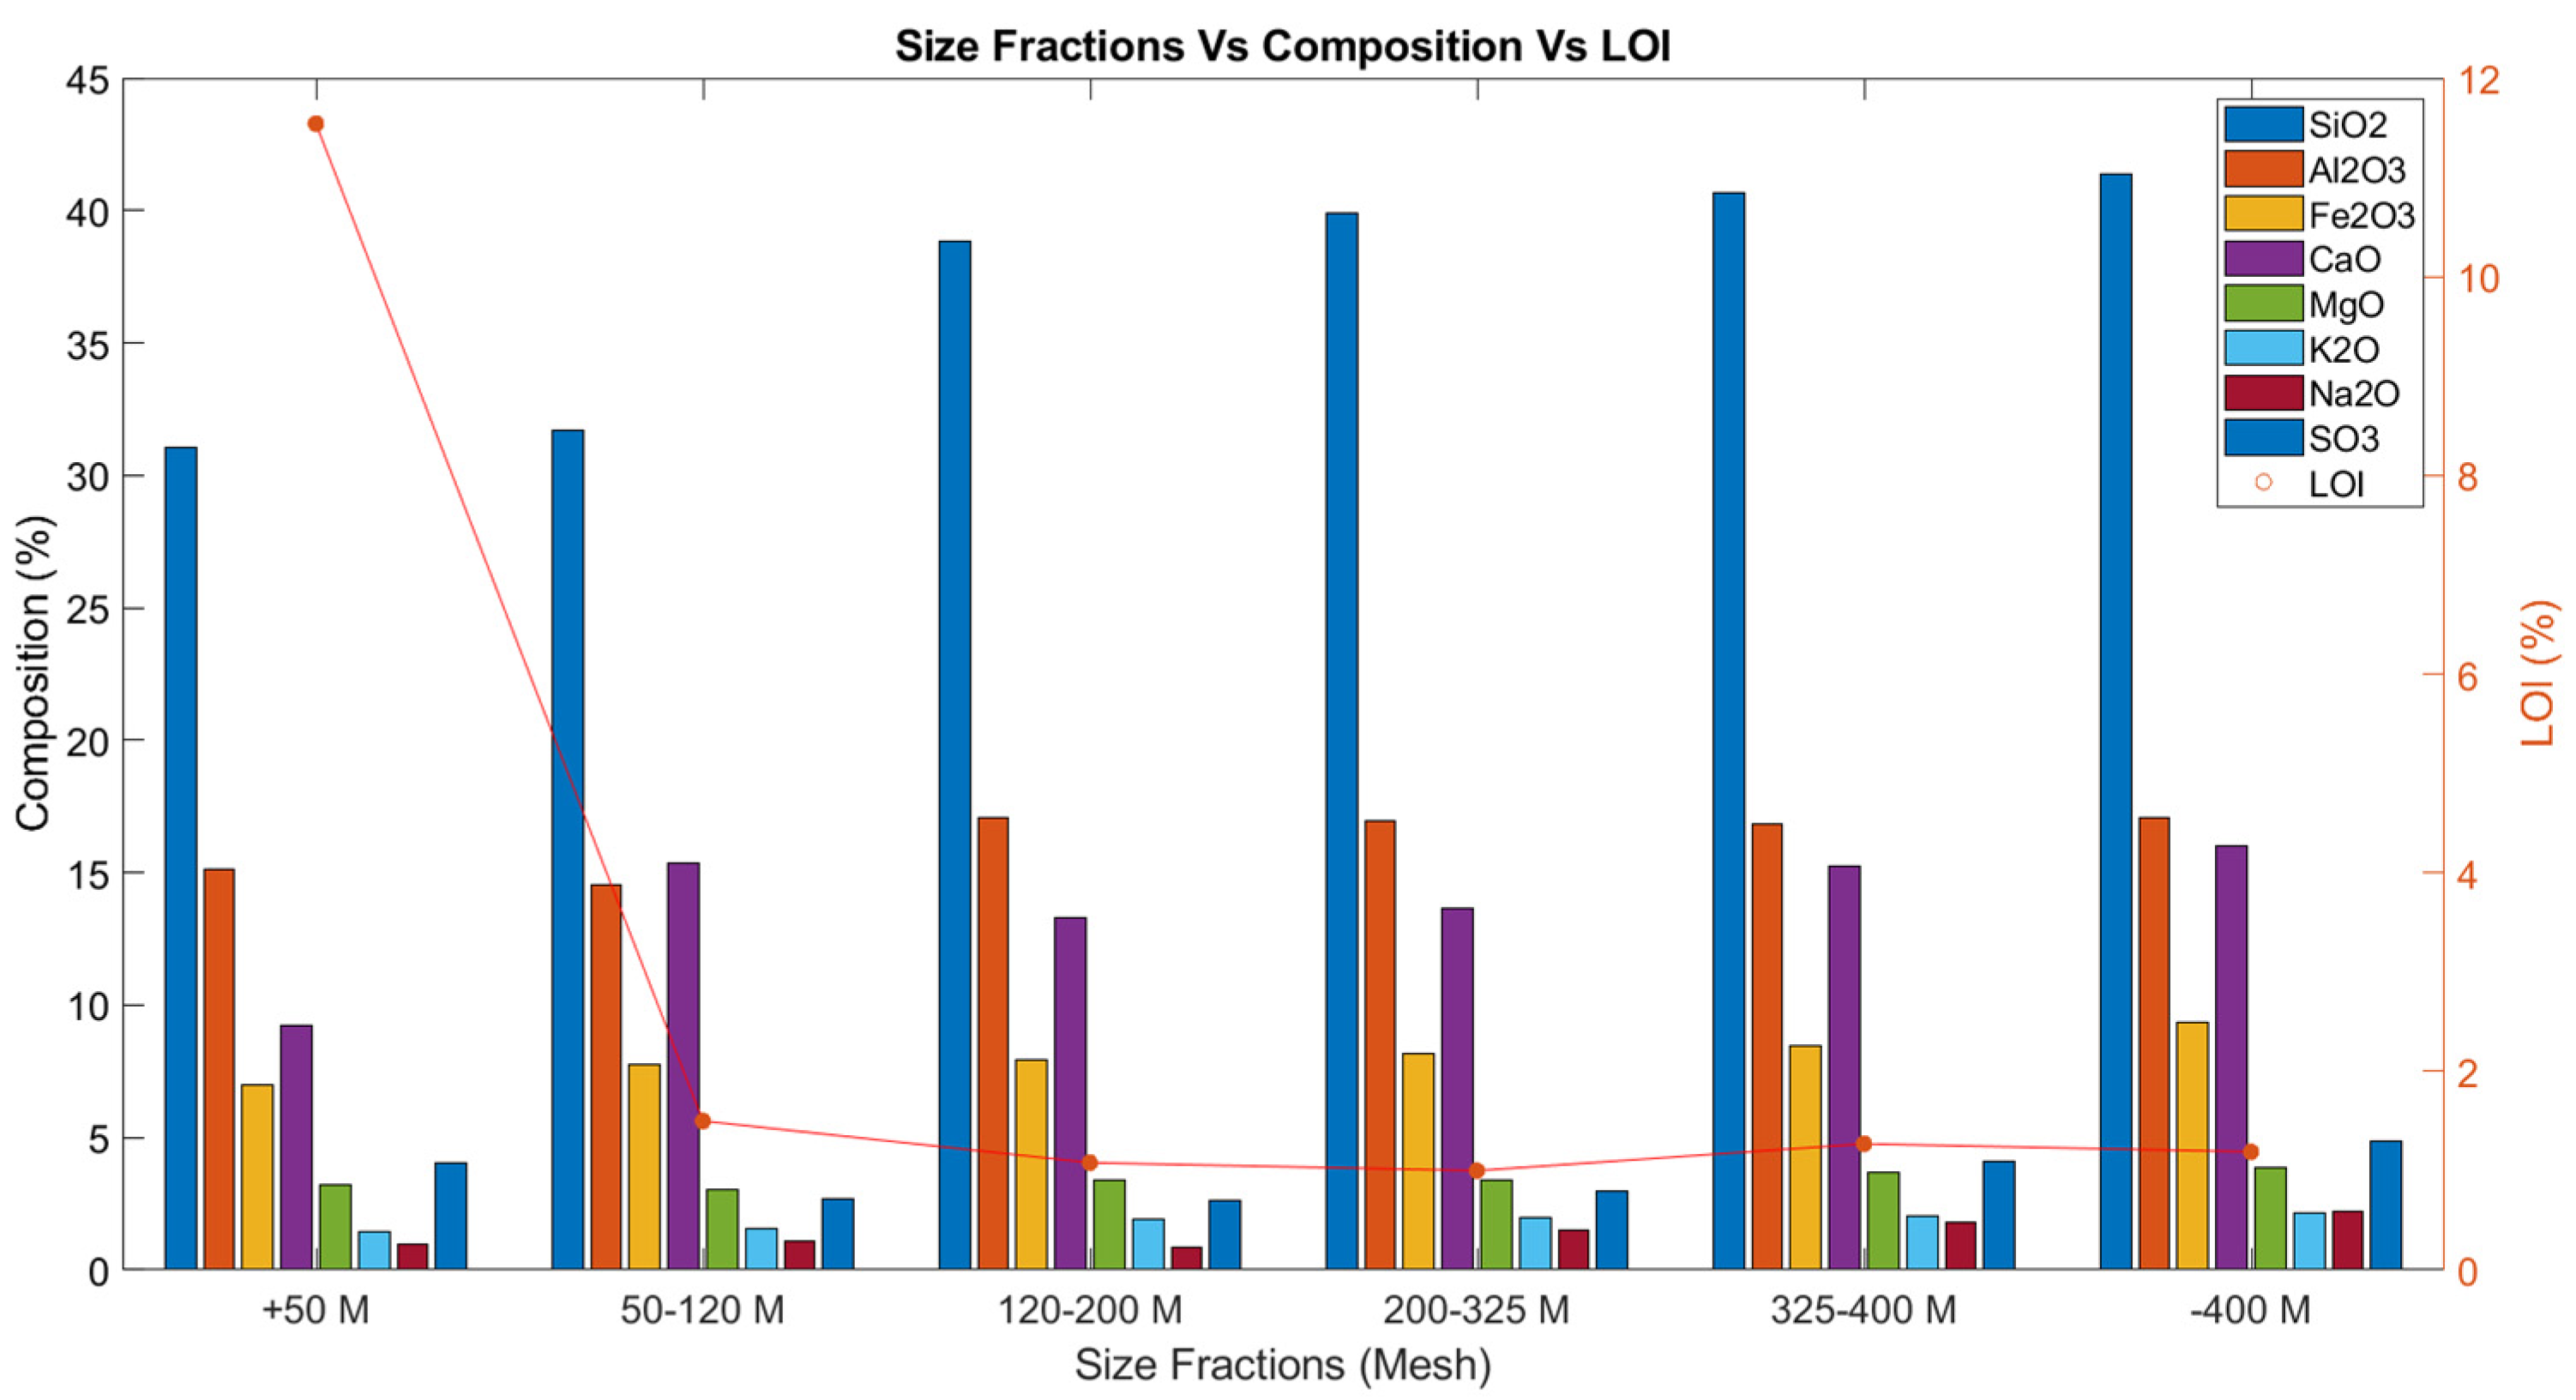
| SiO2 | 38.34 | 41.07 | 31.07 | 31.71 | 38.84 | 39.87 | 40.67 | 41.37 |
| Al2O3 | 14.86 | 16.89 | 15.12 | 14.56 | 17.09 | 16.93 | 16.85 | 17.08 |
| Fe2O3 | 12.69 | 8.52 | 6.97 | 7.73 | 7.92 | 8.15 | 8.44 | 9.35 |
| CaO | 17.71 | 14.83 | 9.23 | 15.34 | 13.31 | 13.63 | 15.26 | 16.03 |
| MgO | 2.72 | 3.73 | 3.22 | 3.05 | 3.38 | 3.41 | 3.68 | 3.85 |
| K2O | 1.71 | 2.05 | 1.44 | 1.57 | 1.93 | 1.97 | 2.04 | 2.15 |
| Na2O | 1.53 | 2.02 | 0.95 | 1.08 | 0.87 | 1.49 | 1.77 | 2.2 |
| SO3 | 3.37 | 4.32 | 4.03 | 2.7 | 2.64 | 2.97 | 4.09 | 4.88 |
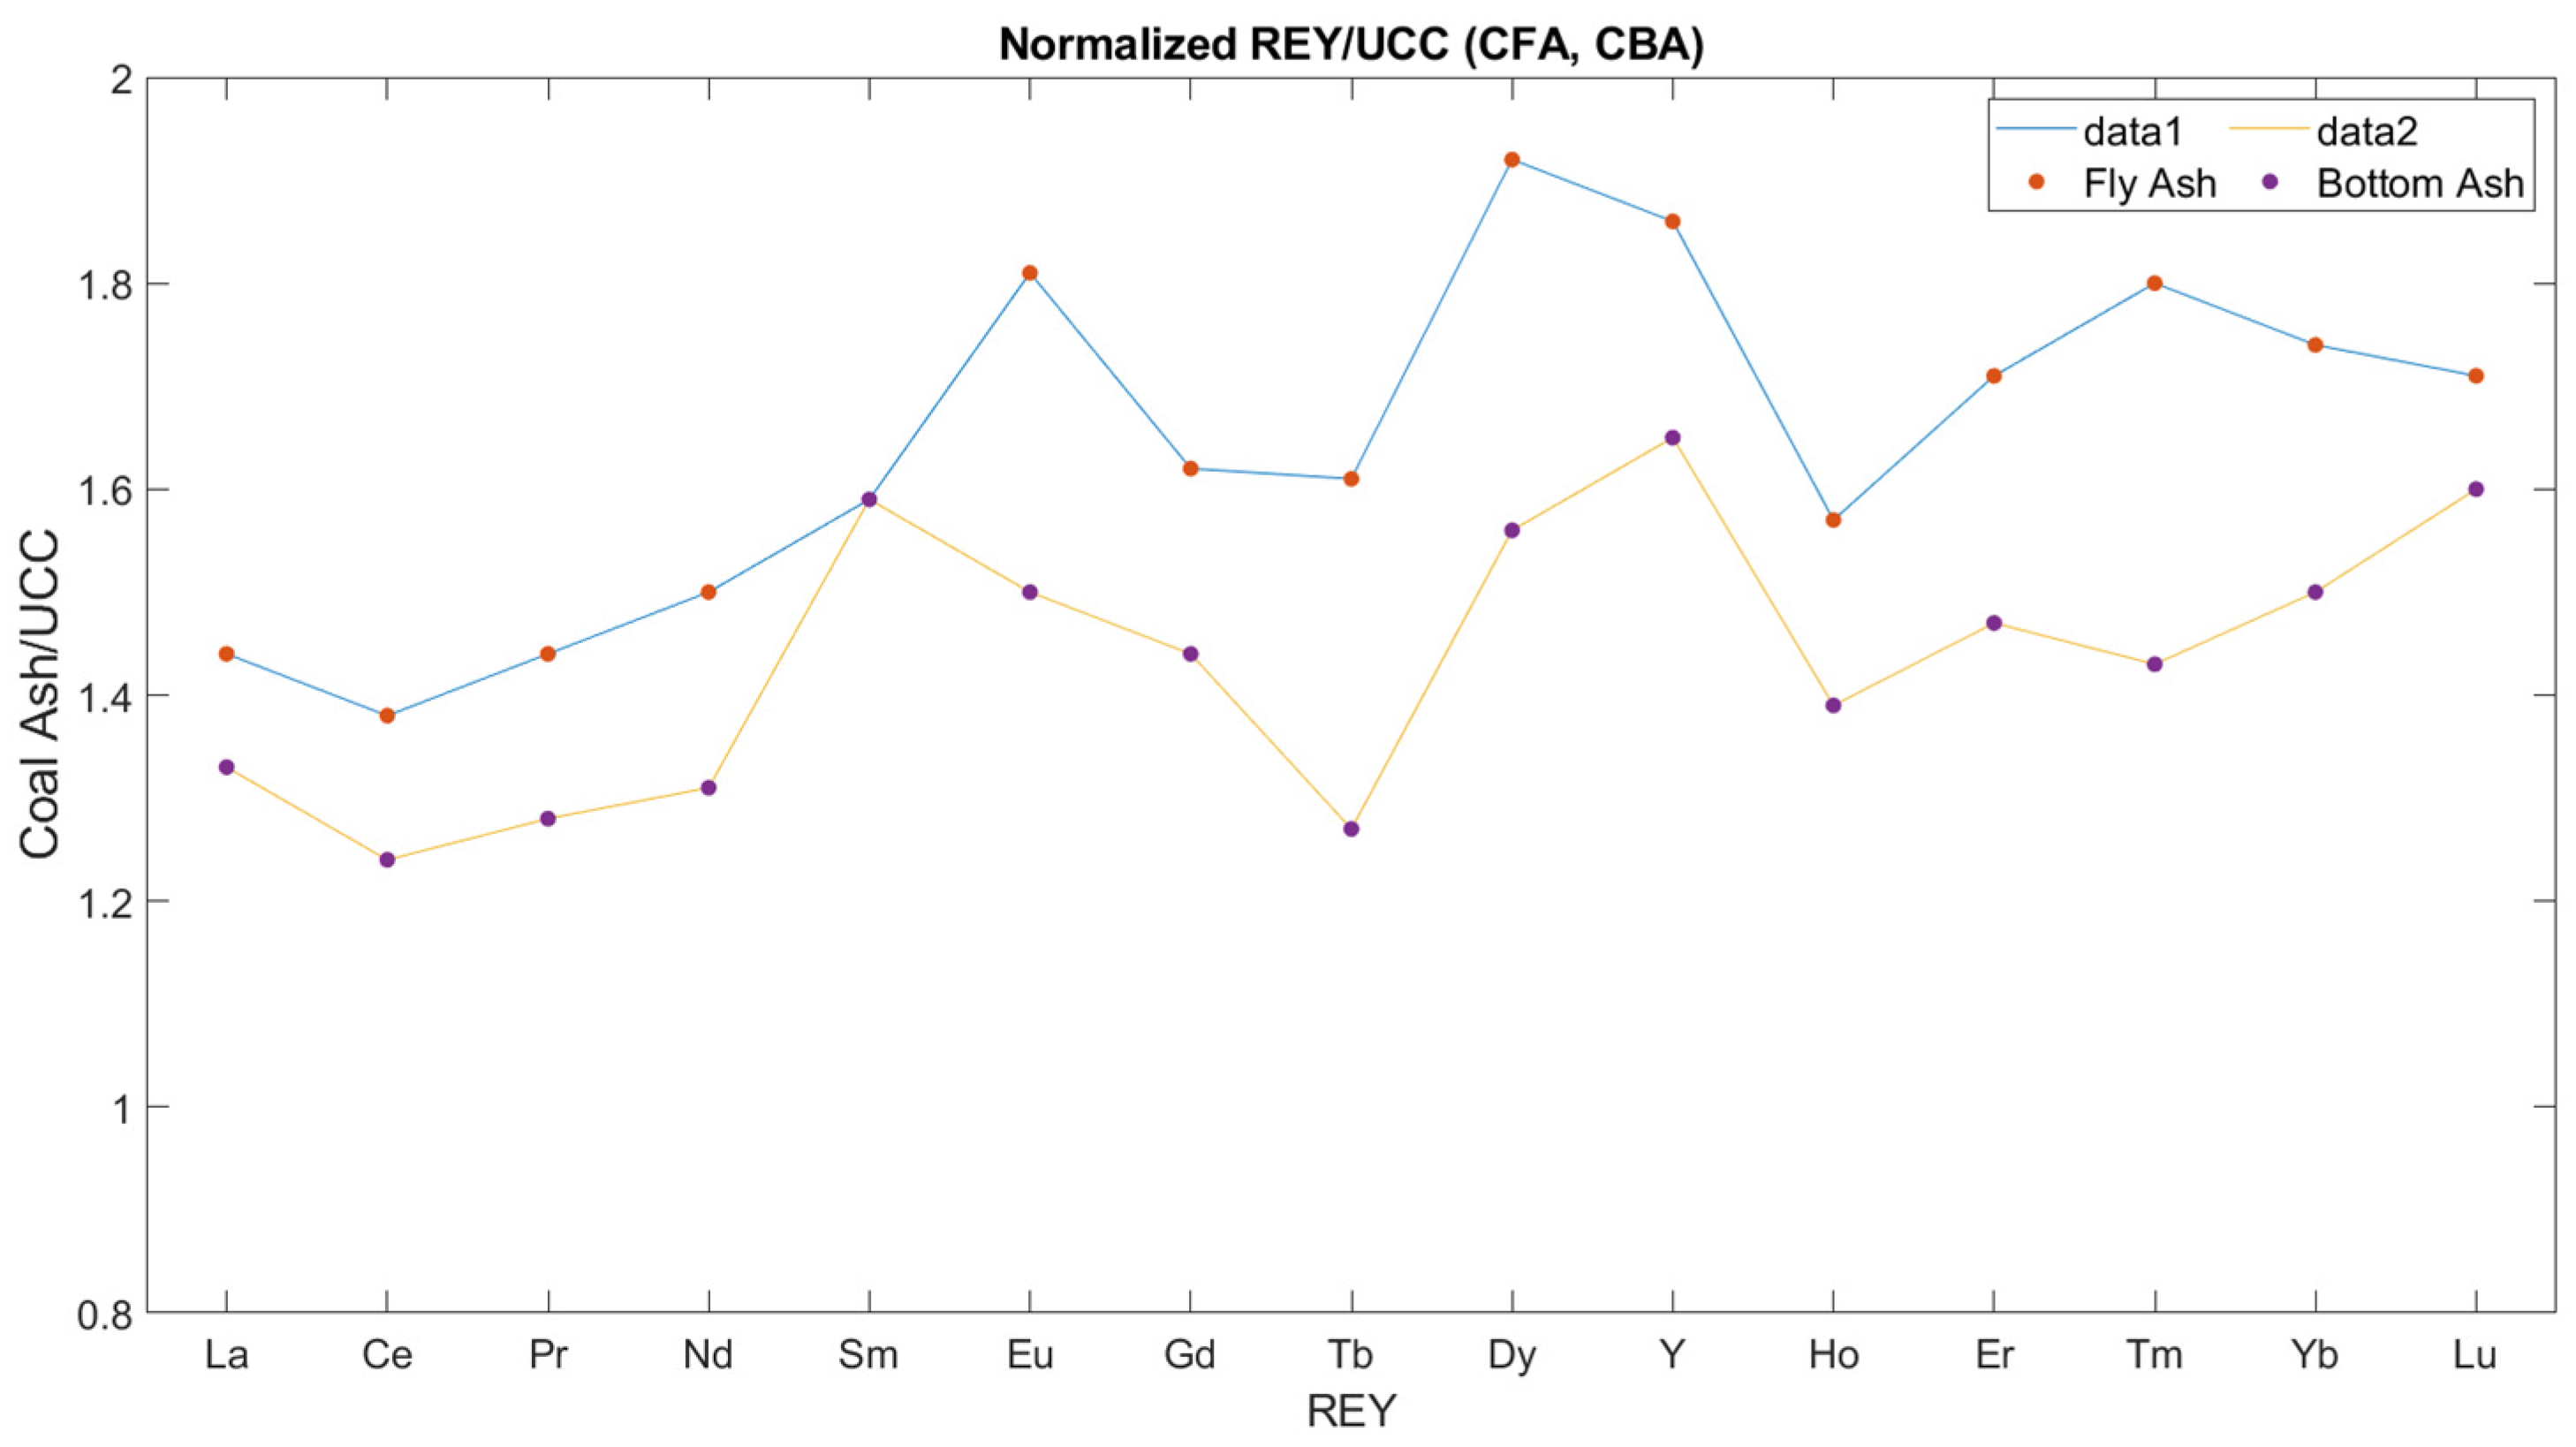
| La | 39.93 | 43.11 | 45.6 | 45.4 | 43.1 | 41.6 | 39.2 | 39.9 |
| Ce | 79.38 | 88.14 | 91.4 | 92.1 | 90.3 | 89.1 | 84.3 | 85.4 |
| Pr | 9.06 | 10.2 | 10.2 | 10.4 | 10.1 | 10.05 | 9.45 | 9.51 |
| Nd | 33.87 | 38.97 | 38.1 | 38.4 | 38.8 | 38.5 | 35.7 | 36.6 |
| Sm | 7.21 | 7.25 | 7.2 | 7.75 | 7.35 | 7.63 | 7.19 | 7.36 |
| Eu | 1.26 | 1.52 | 1.62 | 1.62 | 1.68 | 1.79 | 1.62 | 1.69 |
| Gd | 5.59 | 6.29 | 7.12 | 6.72 | 7.13 | 7.11 | 6.96 | 7.14 |
| Tb | 0.86 | 1.09 | 0.99 | 0.99 | 1.07 | 1.12 | 1.03 | 1.07 |
| Dy | 5.51 | 6.78 | 6.22 | 6.39 | 6.57 | 6.83 | 6.22 | 6.51 |
| Ho | 1.17 | 1.32 | 1.27 | 1.3 | 1.39 | 1.42 | 1.32 | 1.36 |
| Er | 3.45 | 4.02 | 3.8 | 3.82 | 4.08 | 4.22 | 3.92 | 4.11 |
| Tm | 0.48 | 0.61 | 0.52 | 0.56 | 0.6 | 0.64 | 0.6 | 0.58 |
| Yb | 3.29 | 3.82 | 3.86 | 3.76 | 4.22 | 4.07 | 3.84 | 4.15 |
| Lu | 0.54 | 0.58 | 0.55 | 0.59 | 0.58 | 0.64 | 0.59 | 0.63 |
| Y | 36.37 | 40.99 | 36.5 | 38.1 | 39.3 | 41.1 | 40.1 | 41.2 |
| ΣREY | 227.92 | 254.68 | 254.95 | 257.9 | 256.27 | 255.82 | 242.04 | 247.21 |
| Critical (%) | 35.67 | 36.66 | 34.22 | 34.63 | 35.71 | 36.57 | 36.61 | 36.89 |
| Size Fraction | REY Conc. (ppm) | Enrichment Factor | Recovery (%) | Critical (%) |
|---|---|---|---|---|
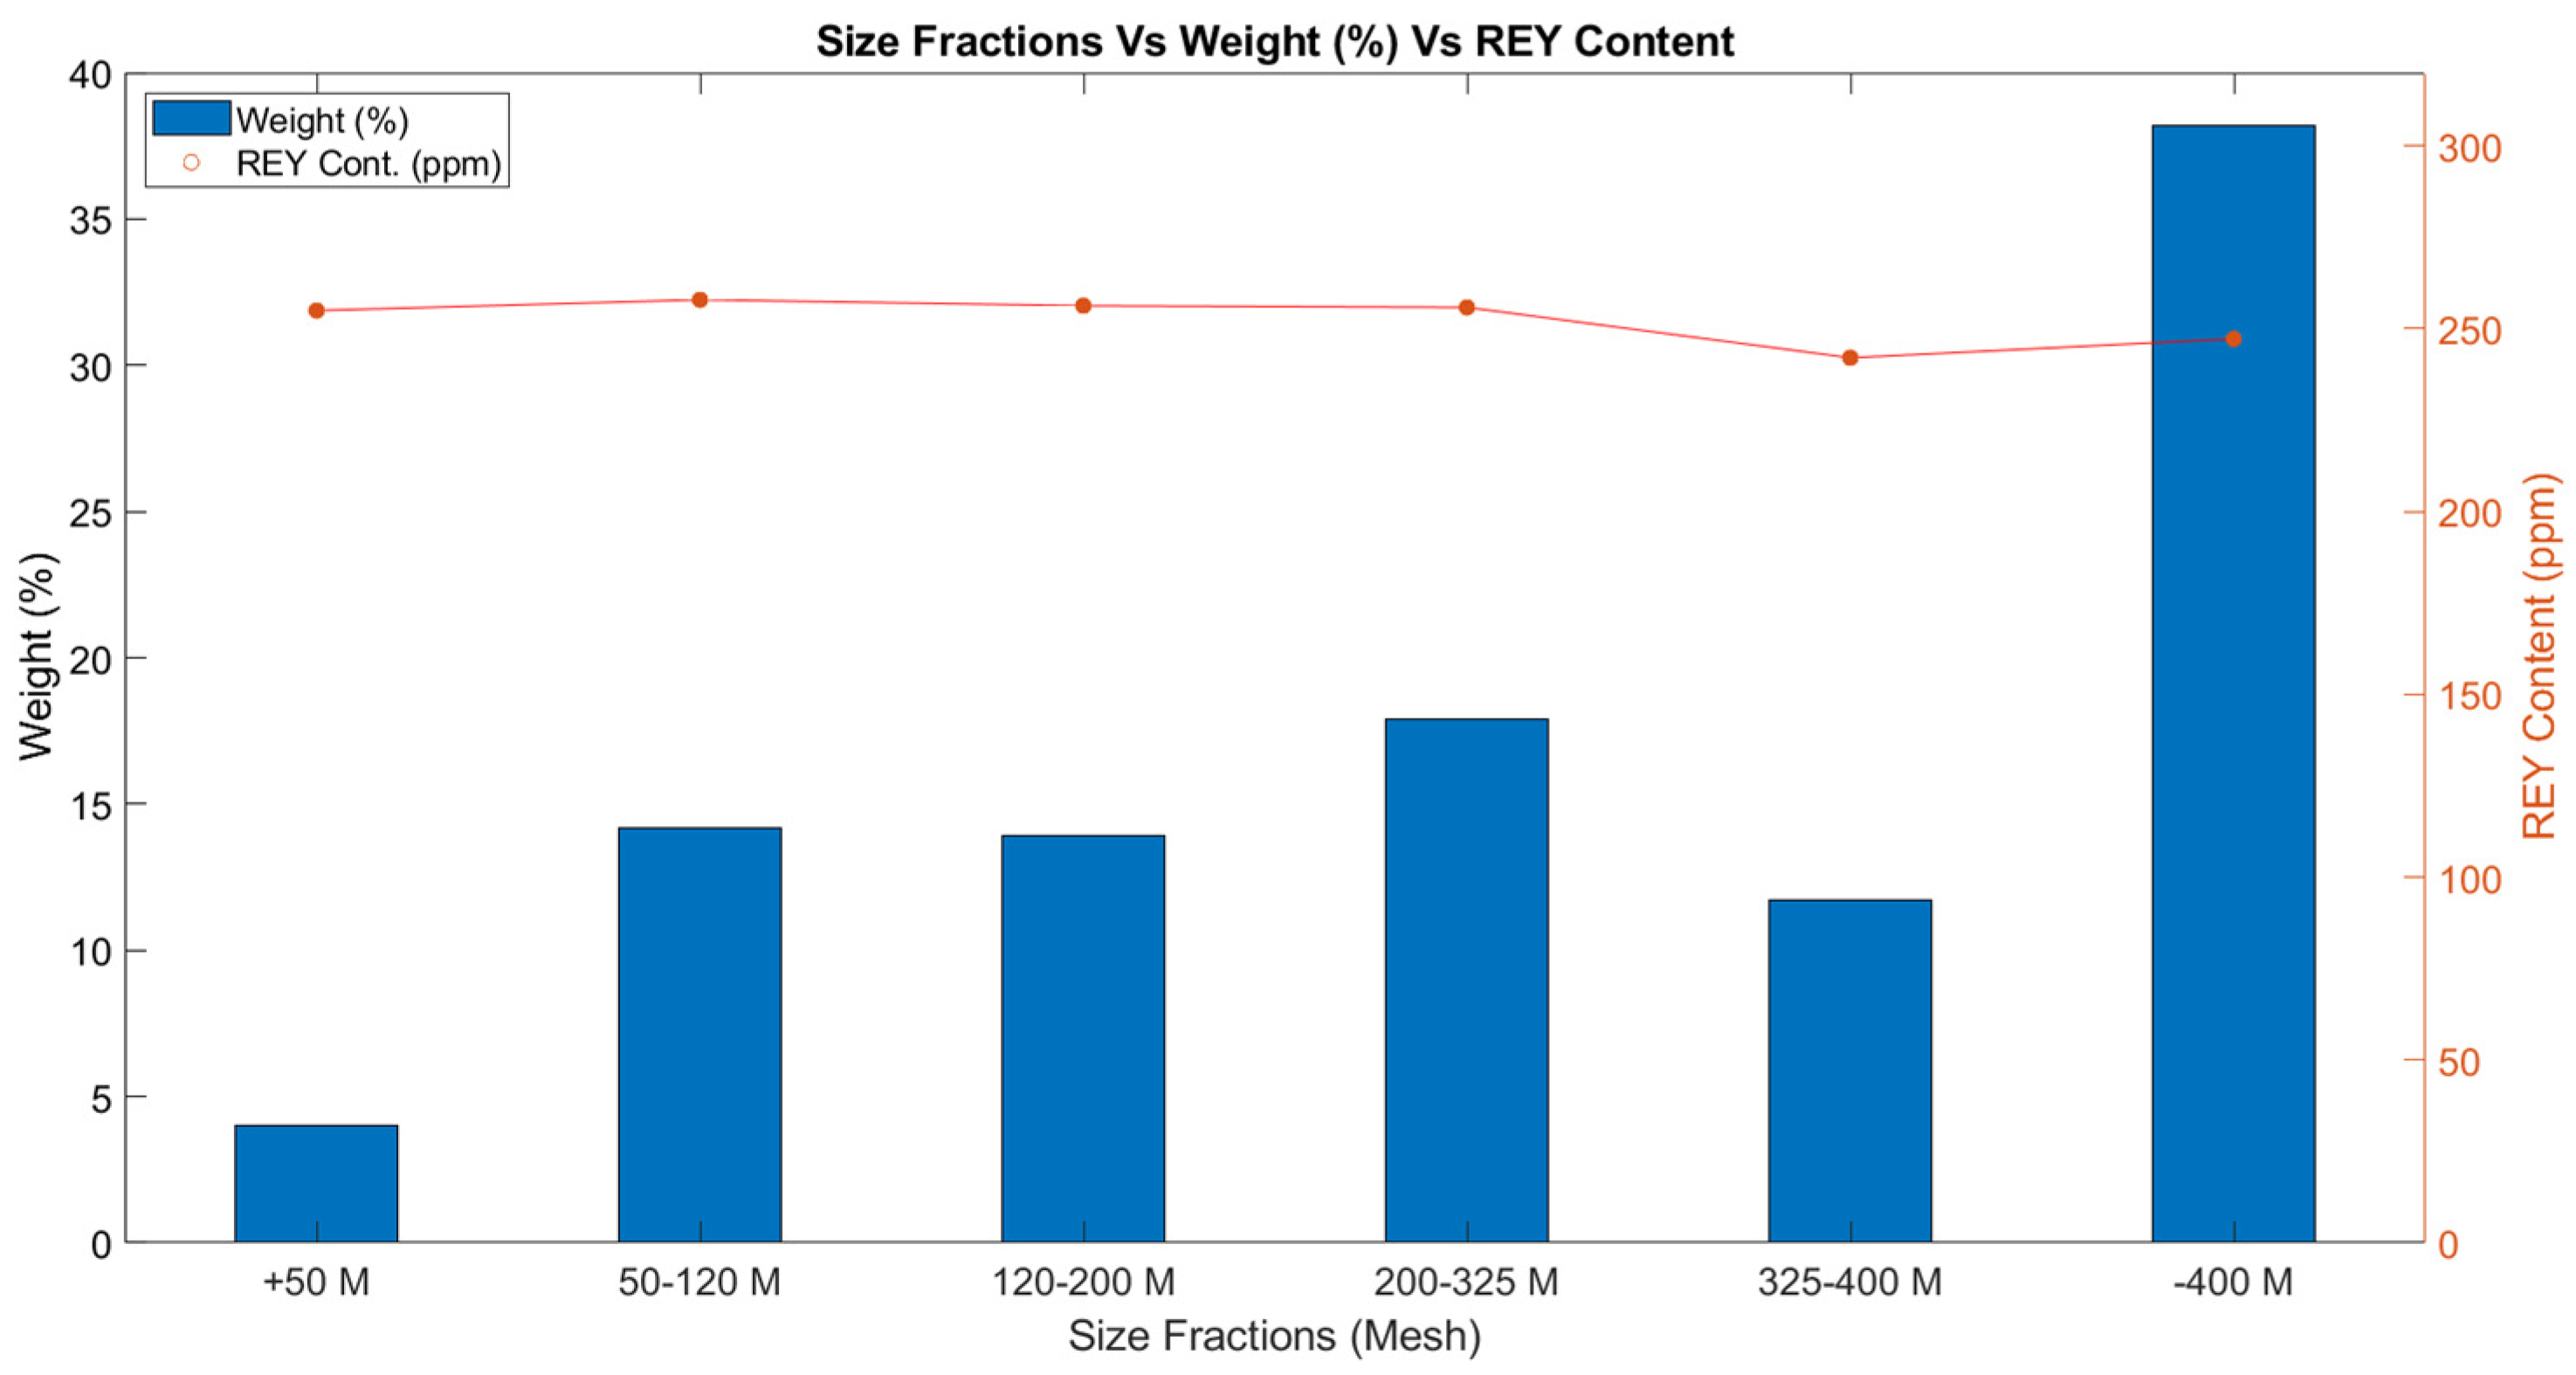
| +50 Mesh | 254.95 | 1.001 | 4.07 | 34.22 |
| 50–120 Mesh | 257.9 | 1.013 | 14.59 | 34.63 |
| 120–200 Mesh | 256.27 | 1.006 | 14.17 | 35.71 |
| 200–325 Mesh | 255.82 | 1.005 | 18.24 | 36.57 |
| 325–400 Mesh | 242.04 | 0.951 | 11.31 | 36.61 |
| –400 Mesh | 247.21 | 0.971 | 37.62 | 36.89 |
Publisher’s Note: MDPI stays neutral with regard to jurisdictional claims in published maps and institutional affiliations. |
© 2021 by the authors. Licensee MDPI, Basel, Switzerland. This article is an open access article distributed under the terms and conditions of the Creative Commons Attribution (CC BY) license (https://creativecommons.org/licenses/by/4.0/).
Share and Cite
Tsachouridis, A.; Pavloudakis, F.; Kiratzis, N. Development of Rare Earth Elements Separation Processes from Coal Fly Ash. Mater. Proc. 2021, 5, 69. https://doi.org/10.3390/materproc2021005069
Tsachouridis A, Pavloudakis F, Kiratzis N. Development of Rare Earth Elements Separation Processes from Coal Fly Ash. Materials Proceedings. 2021; 5(1):69. https://doi.org/10.3390/materproc2021005069
Chicago/Turabian StyleTsachouridis, Aggelos, Francis Pavloudakis, and Nikolas Kiratzis. 2021. "Development of Rare Earth Elements Separation Processes from Coal Fly Ash" Materials Proceedings 5, no. 1: 69. https://doi.org/10.3390/materproc2021005069
APA StyleTsachouridis, A., Pavloudakis, F., & Kiratzis, N. (2021). Development of Rare Earth Elements Separation Processes from Coal Fly Ash. Materials Proceedings, 5(1), 69. https://doi.org/10.3390/materproc2021005069