1. Introduction
The mine ventilation system is one of the most critical modules of an underground mining project, being responsible for the wellbeing and health of all personnel. Its main goal is to constantly supply fresh air to the mine and successfully disperse gaseous pollutants and control the concentration of airborne particulates. The challenges are often significant, especially in cases where complicated mining works are in place or the selected mining scheme requires the development of complex airway paths. Such challenging conditions are located in underground bauxite exploitations where the geology and development of the lenses that are found in clusters require the passage of mine works through them. Sometimes, the mining of new orebodies utilizes previously developed access works to progress and reach the new mining areas; thus, a clean and straightforward ventilation network is rarely put into effect.
In recent years, as the mining activity has progressed and the permitted concentration limits of airborne particulates have become more stringent, the need for a rational and optimized mine ventilation system to ensure the wellbeing of the personnel has become even more critical. The explicit modeling of the ventilation network for an underground mine can optimize the existing system and provide solutions that can optimize the current working arrangement, whereas it can also be used as a guide for the future design or future conditions that will prevail in the dynamically changing mine network. Moreover, besides the benefits in H&S issues, this could also prove beneficial for the reduction in the operating costs of the mine.
This paper analyzes and models the current ventilation design that is in effect in an underground bauxite mine, as well as its future extension. The main aim is to develop a valid and calibrated model that can provide reliable data and insights into the prevailing conditions. In addition, the use of this model could be beneficial for the design of the future ventilation network that is required to facilitate the extension of the mine and the exploitation of neighboring ore lenses.
2. Ventilation Model Design and Validation Process
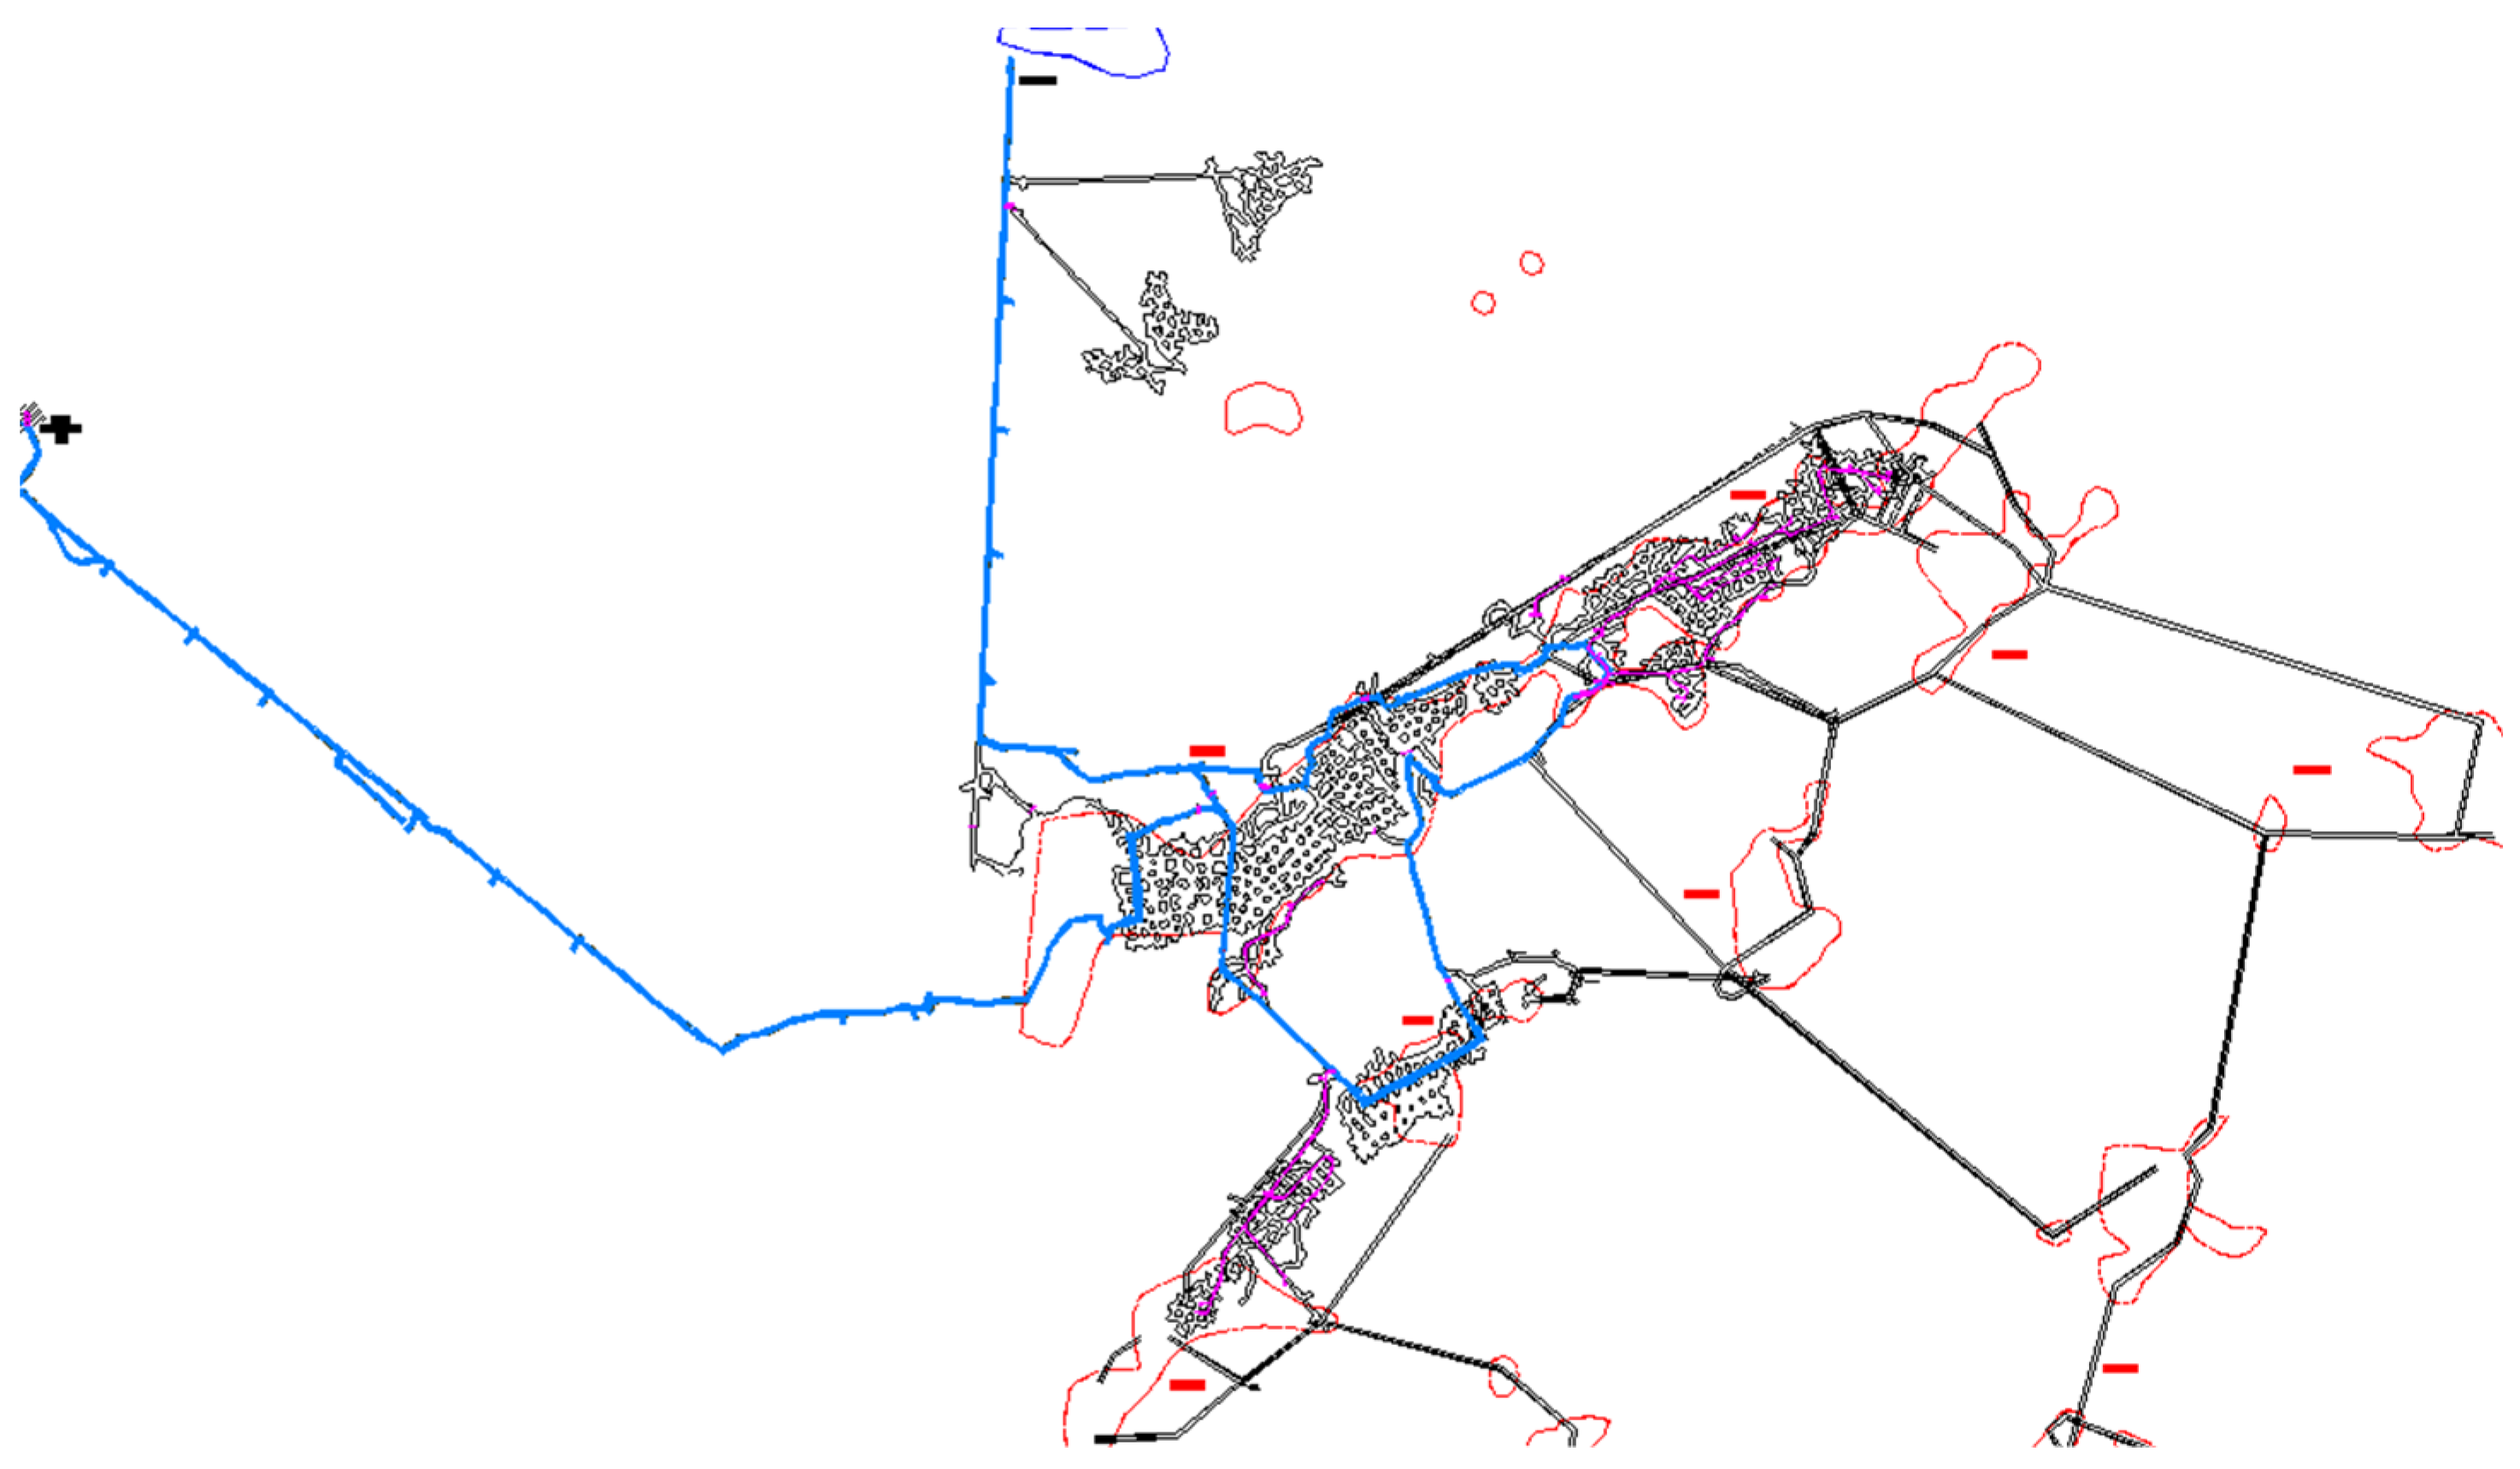
The ventilation network of the underground bauxite mine was initially identified and mapped in detail so as to accurately depict the underground working and recognize the tunnels that are used for the ventilation, as well as the flexible ducts that are mainly used for the secondary ventilation network. In
Figure 1 the general layout of the underground exploitations, the main airway tunnels (blue lines), the flexible ducts (purple lines) and the development of the mine and the complexity of the established network can be witnessed.
The air is supplied through the north-western access tunnel (Σ617); after following this 1.7 km tunnel, it reaches the central point of the mining area and is then diverted to the various operational points (working faces). The airflow’s exit point is through the Σ592 adit. The whole mine ventilation system consists of 8 km of main tunnel network and 2.7 km of flexible ducts. In the normal operation of the mine, the machine equipment working underground consists of two LHD units, two jumbo drills for drilling and rock bolting, two underground trucks, one scaler and one lifting platform. The above along with the necessary personnel require a total airflow volume of approx. 89 m
3/s to meet the ventilation requirements, which is supplied with the use of two main fans—working in parallel—at the entrance of the access tunnel [
1].
The mine resistance, which is the air loss for a given airflow, is calculated at 0.07 Ns2/m8.
The layout of the network was imported to the Ventsim software and developed into a 3D working model, including the positioning of all main fans, as well as the exact layering of all auxiliary booster fans and flexible ducts. The airway profiles of the main network and their characteristics were also imported. Basic and simplistic friction factors and base options for the calculation of shock losses assuming a smooth transition and turning radius of tunnels [
2,
3] were selected for use. These options are important for the calculations of the network solution, and they were used as they represent a reference starting point and a baseline model scenario [
4,
5] (
Table 1).
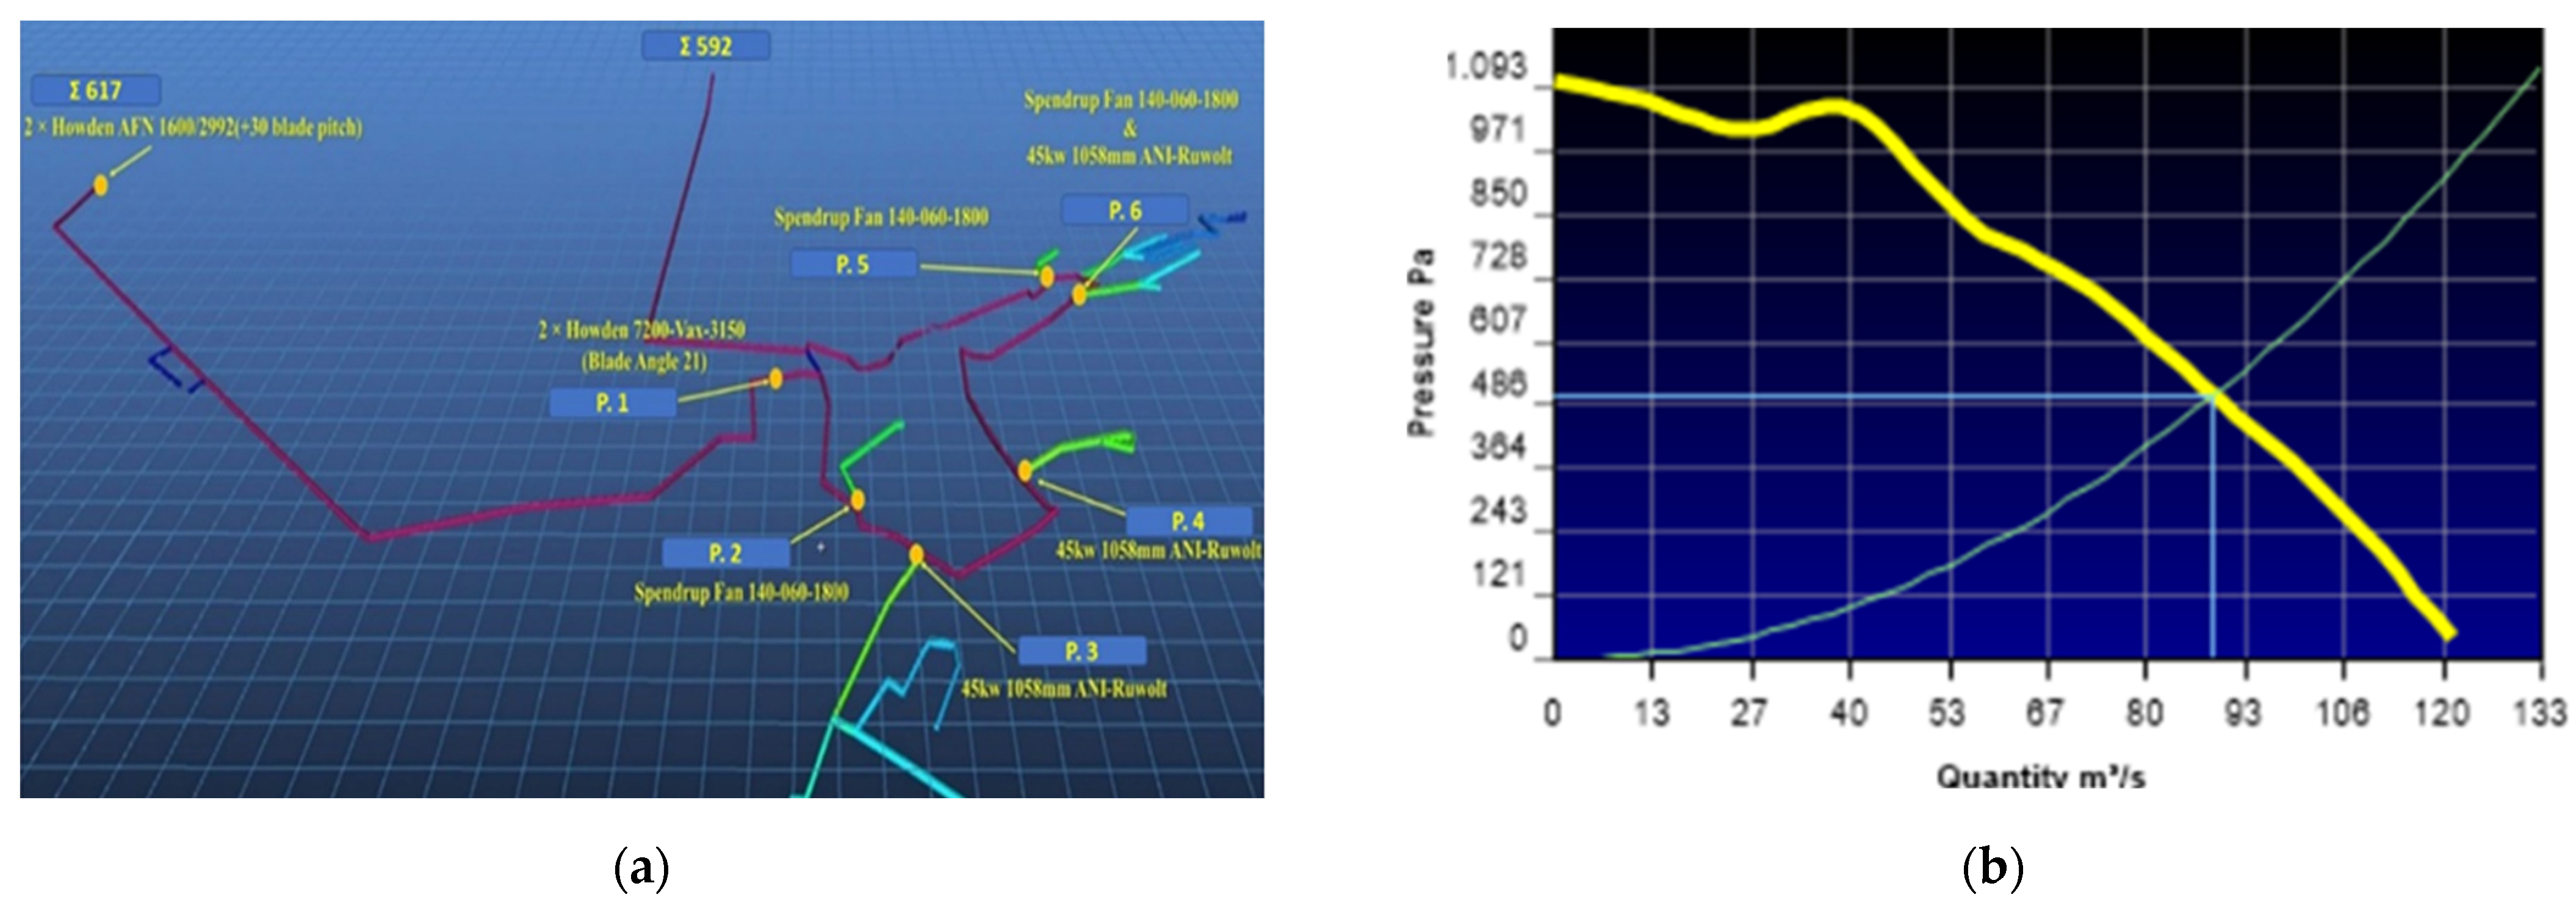
The fan characteristics to be used in the model were also determined, although at the time of the assessment the only data available were their nominal maximum airflow and their rated power. The solution adopted was to analyze a series of fans with characteristics seeming to correspond closely to the existing ones and then by using a trial-and-error approach to try to obtain the ones that had the operational characteristics that yielded the more promising results, especially in terms of the obtained airflow. To do this the results of the network that was modeled in the Ventsim software were monitored closely and compared to the actual working conditions.
Two main fans (in parallel), two secondary fans (in parallel) and six booster fans were used (
Table 2), providing and also shaping the required total airflow. Their placement in the network corresponds to the actual positioning places of the fans in the existing mine. The modeled network and all the details that were used in the analysis are given in
Figure 2a. Based on the model that was developed, the operating point of the system can be estimated at 88.8 m
3/s and 500 Pa (
Figure 2b), almost identical to the actual airflow volume of 89 m
3/s.
The model as it has been stated was validated through its comparison using real data measurements that were carried out in the mine, both in terms of airflow quantity and quality. The goal was to achieve a close connection between them and thereby achieve a fine-tuning optimization. It was an iterative process, and the results obtained through the final model are shown in
Table 3.
It can be seen that the volume of the computed airflow is smoother and more stable than the corresponding flow of the site measurements, whereas some airflow oscillations (inside the mine network) have been recorded in the measurements. In all, the maximum differences obtained are at around 10–15%.
For the air quality validation, the modeling was conducted using the same equipment and personnel as those actually operating at the corresponding locations and the time of the real scale measurements. This process was completed in a total four of instances, corresponding to four relevant measurements.
Table 4 present the comparison of gas concentration between site measurements and the computed data. As it can be seen, there is a very close resemblance between the data (measured vs. modeled), especially for the more important pollutants CO, NO and NO
2.
Through this process, the validated model can be used for the assessment of the air quality in a number of mine areas and scenarios, such as the one shown in
Table 5, where the results of the air quality at the Σ592 adit—at the mine’s airflow exit—are given with respect to the allowable limits [
6].
3. Design of the Ventilation System of the Future Mine Extension
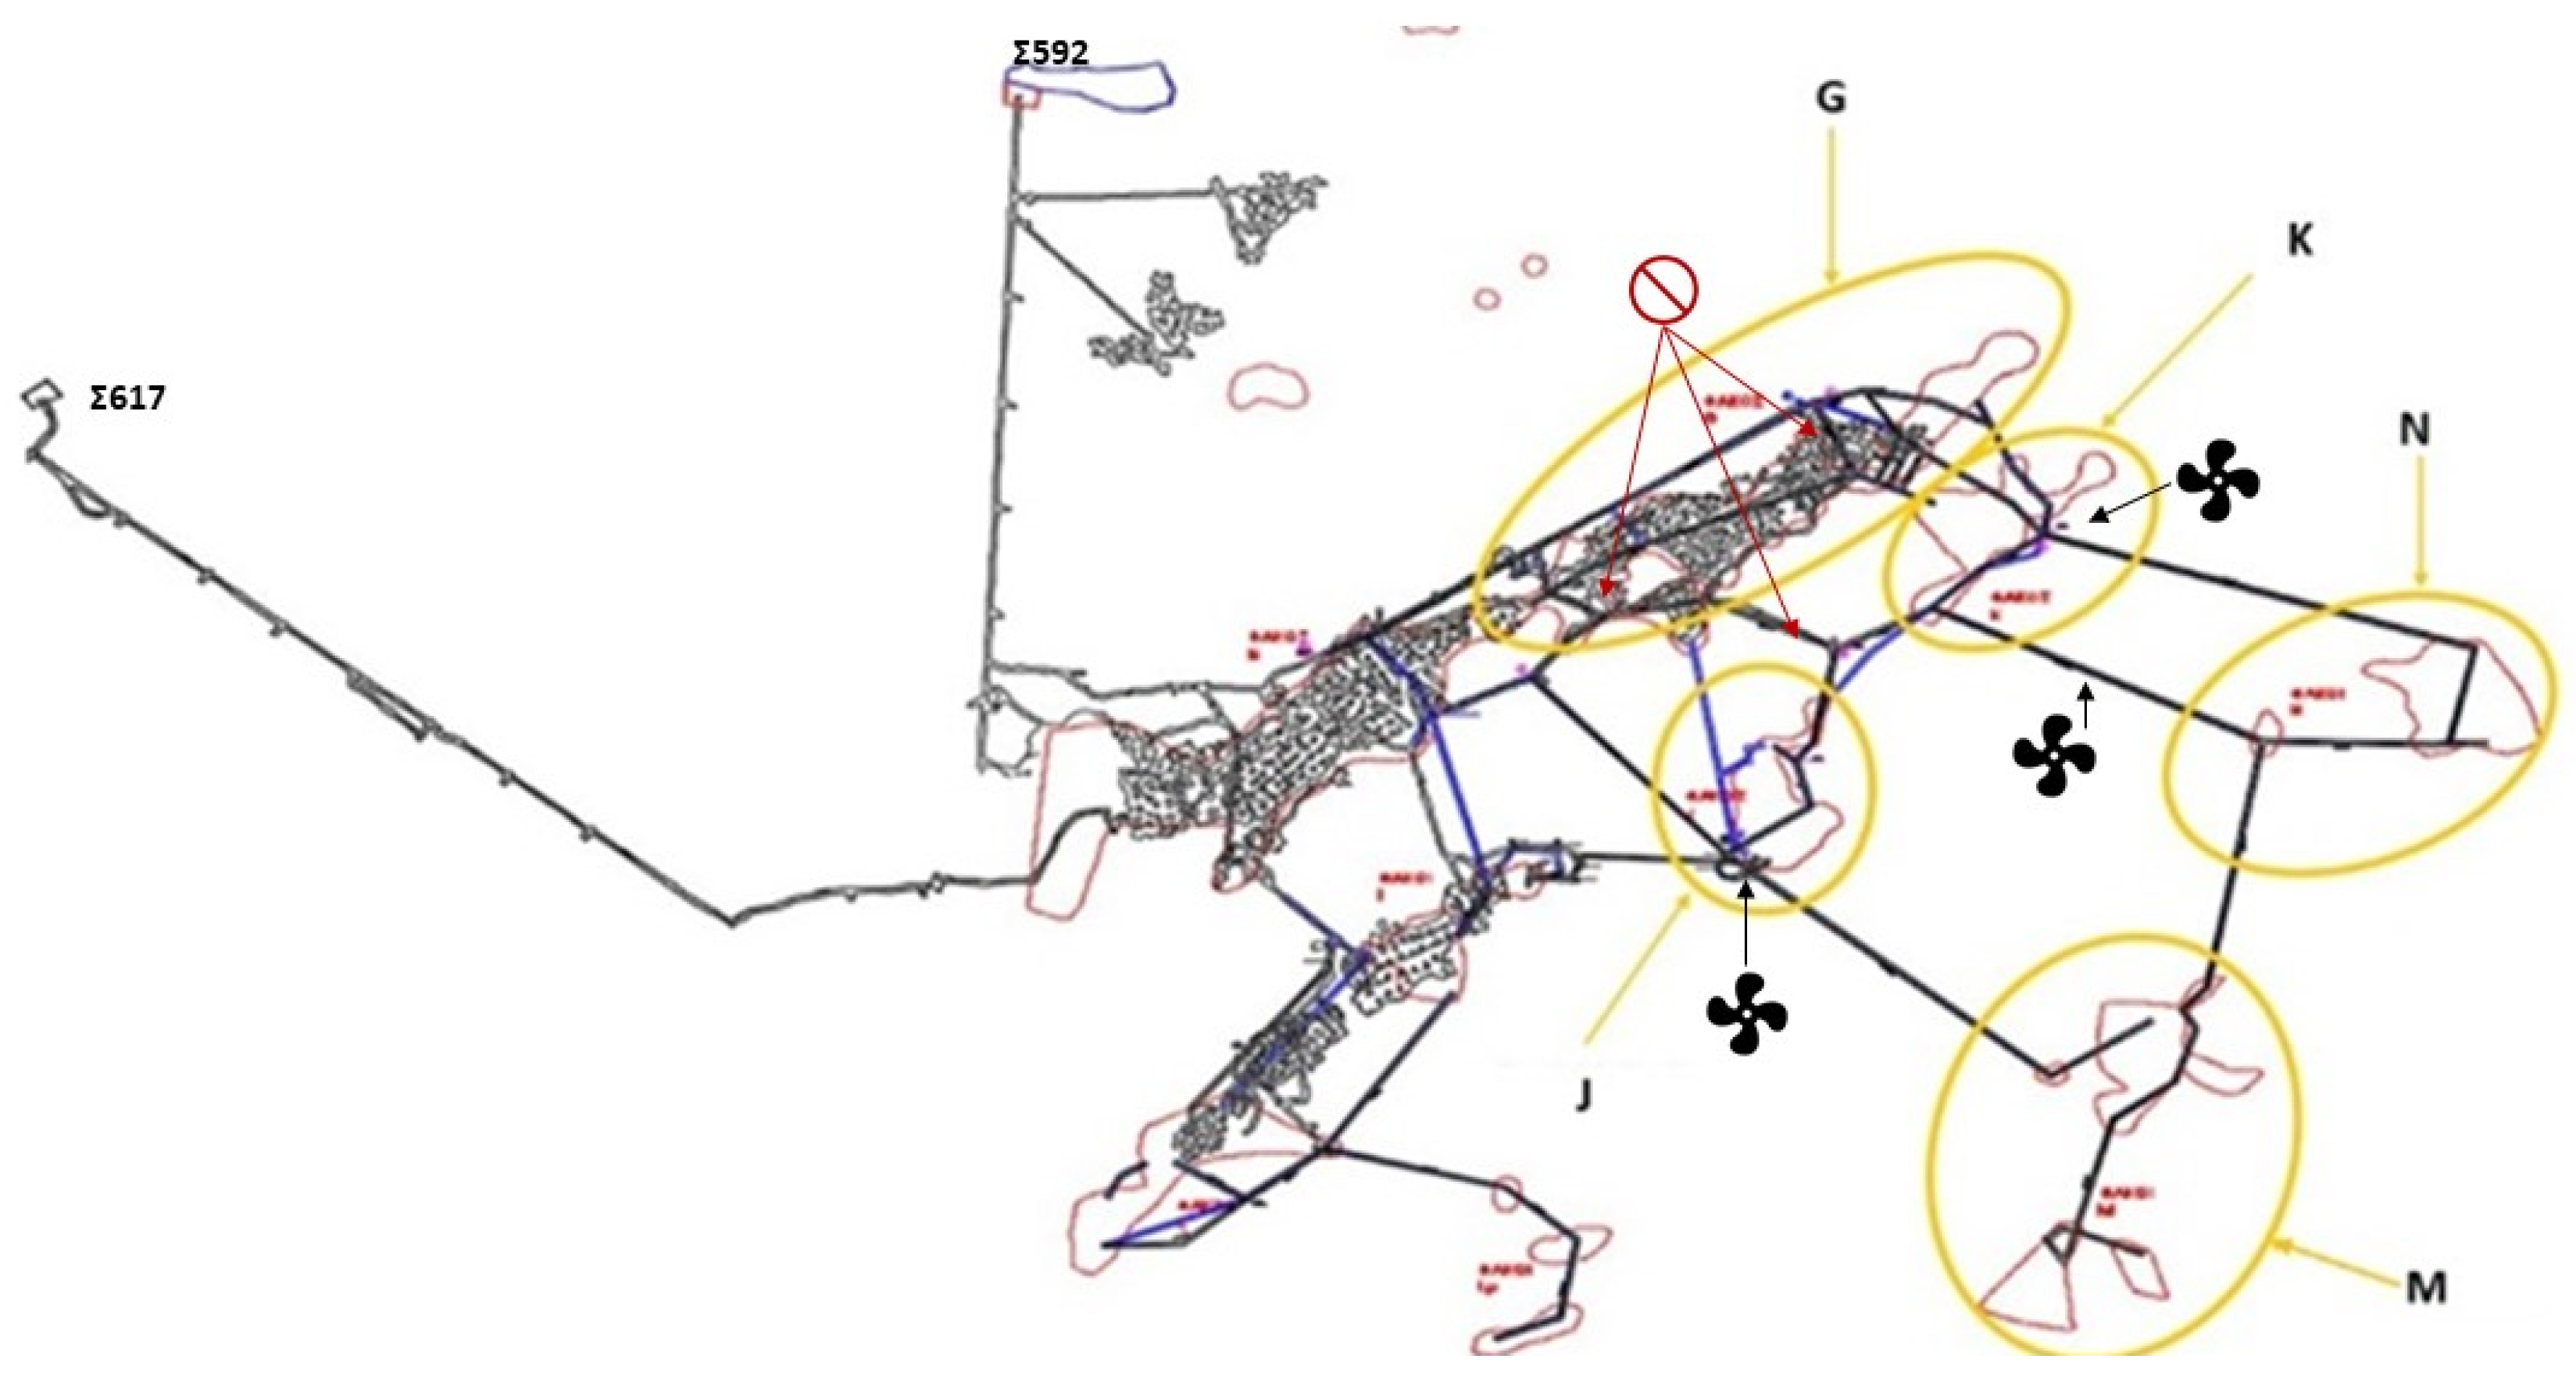
The expansion of the mining activities to new ore bodies in the vicinity of the exploitation requires the redesign of the ventilation system and mainly the change in the positioning of three boosters to facilitate the new operating conditions.
Figure 3 shows the map of future mine expansions (areas G, J, K, N and M) intended to reach the new ore lenses, which are expected to extend the life span of the mine by more than 10–15 years.
In the future ventilation system, some 6 km of new main tunnel network is added to the existing one, while the flexible ducts’ length is almost 2.4 km. The number of fans remains the same and the total airflow requirement remains stable at 89 m3/s, as the amount of diesel equipment and personnel remains the same. In addition, three doors are to be placed in selected junctions of the existing network to divert the airflow and prevent it from reaching mined-out areas (at the time that the new network is to be put in effect).
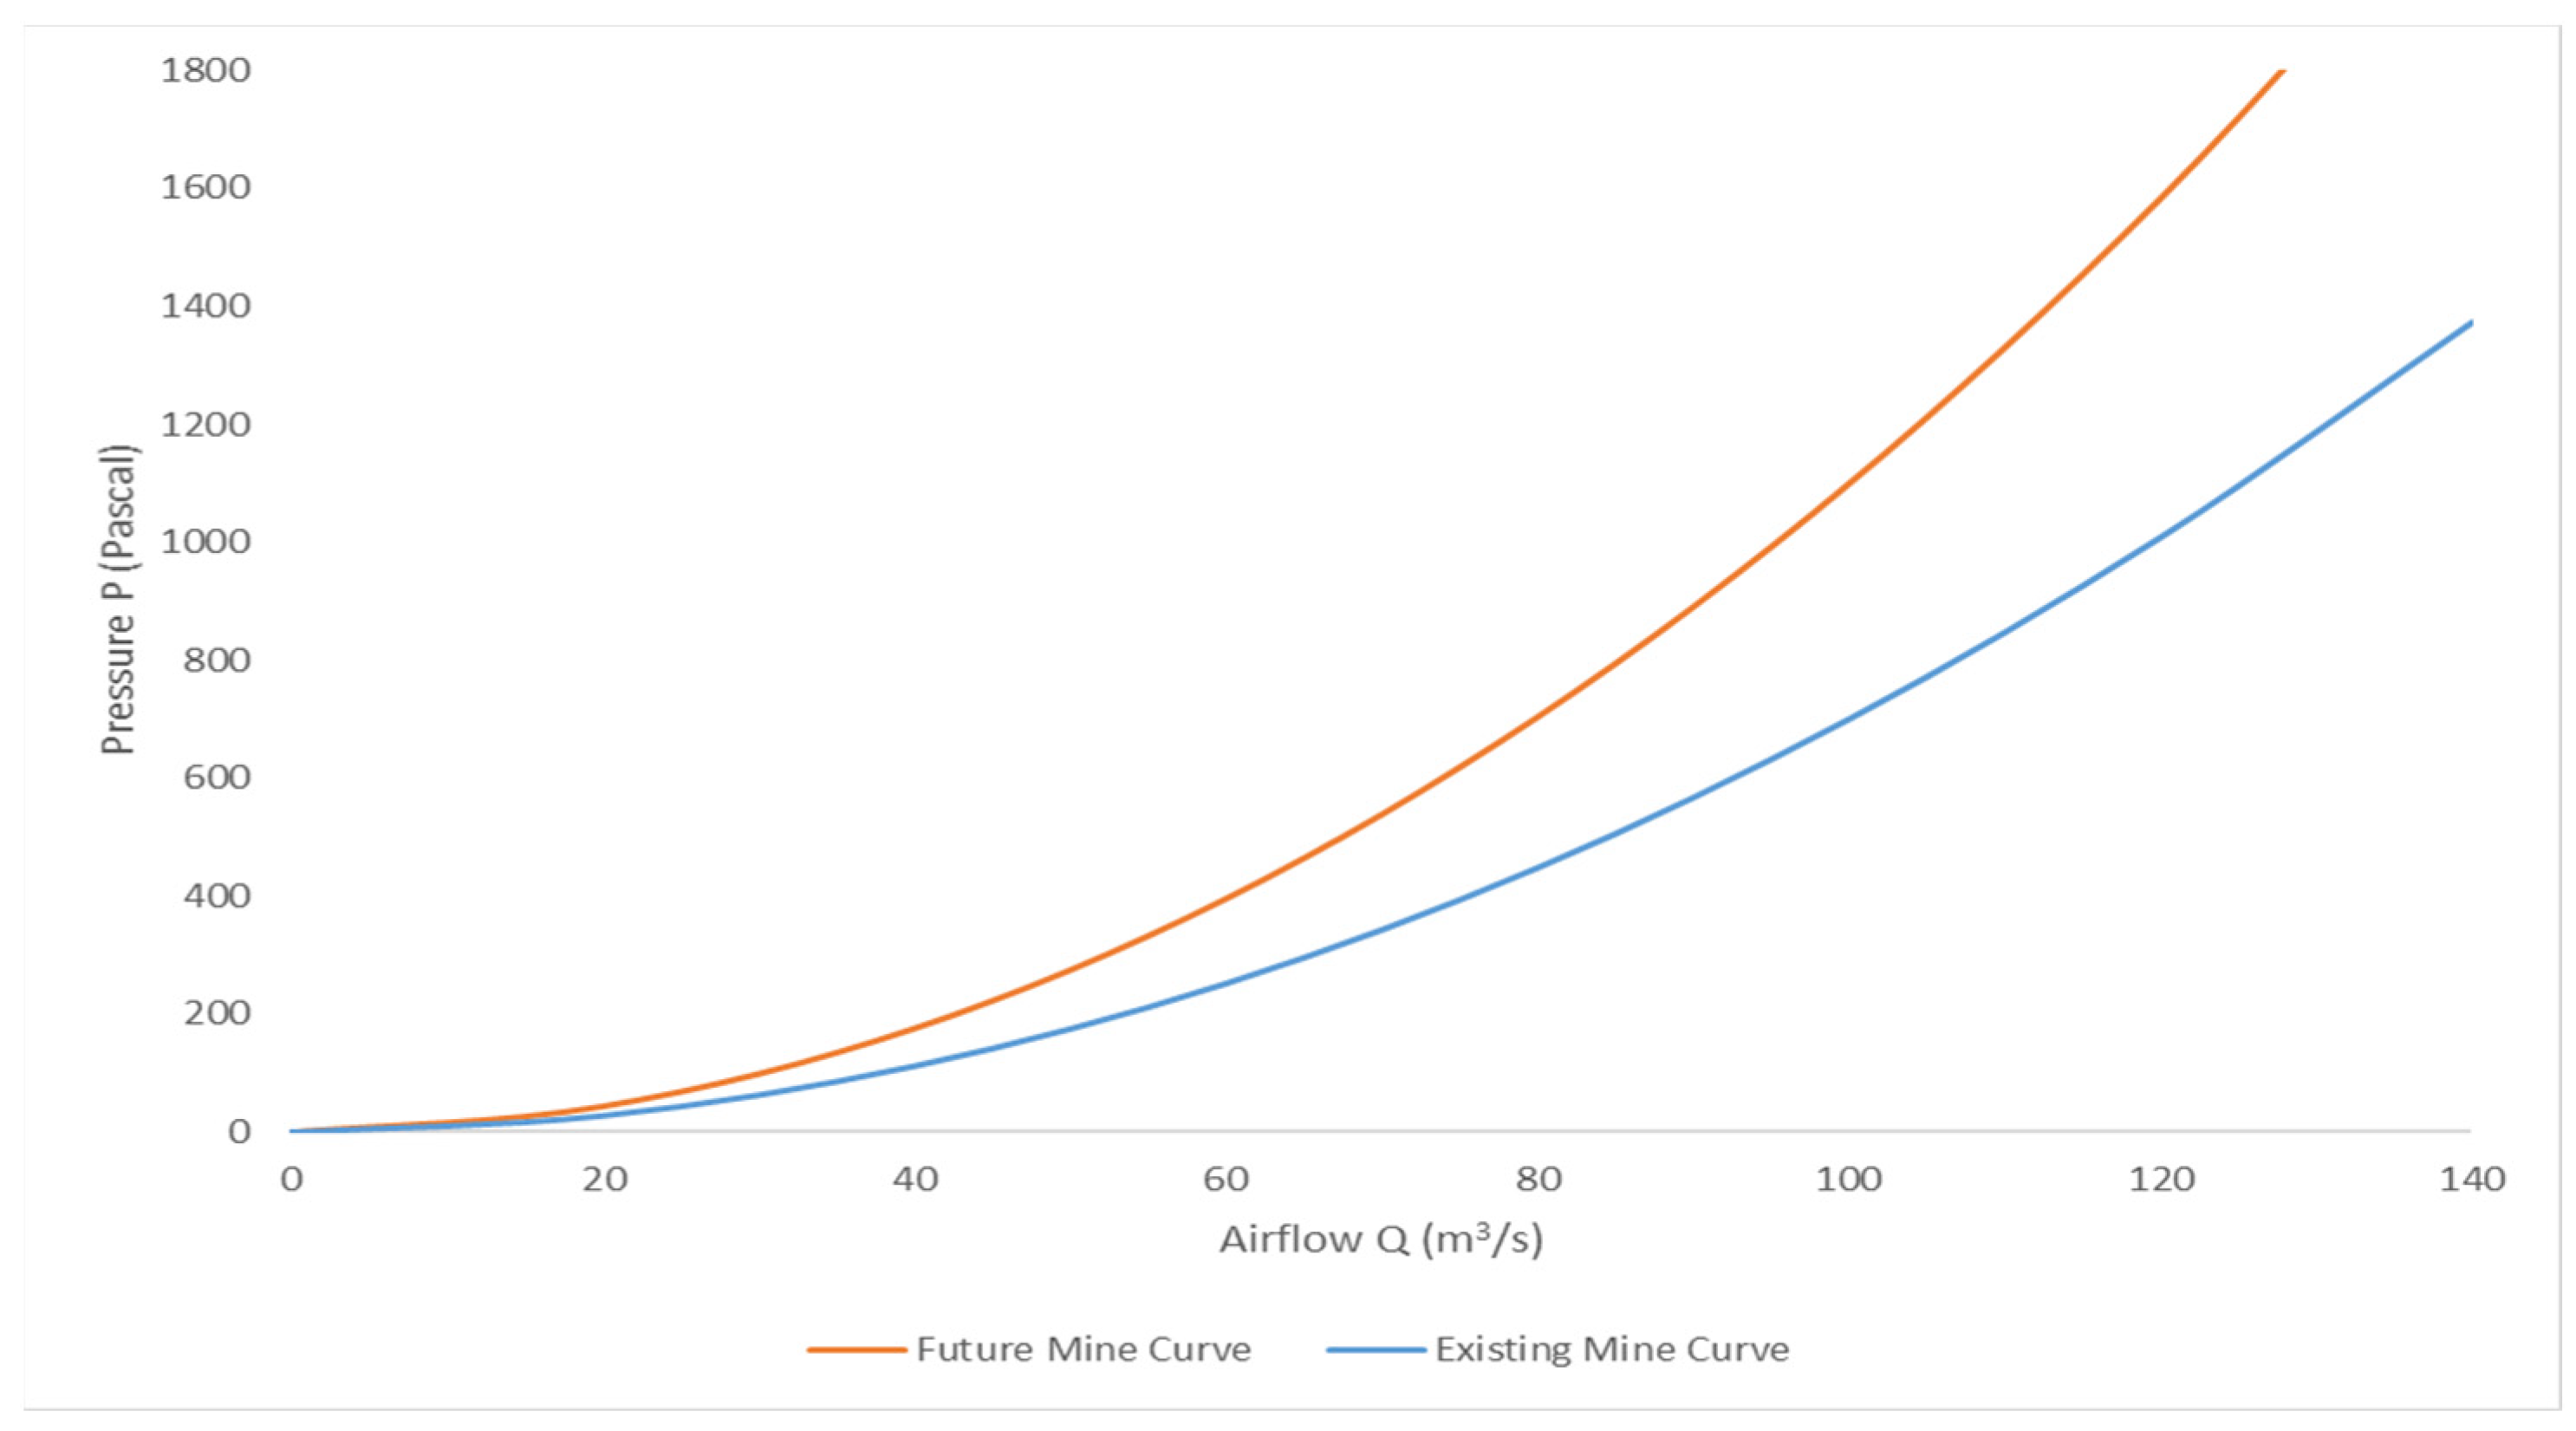
The new mine resistance is calculated at 0.11 Ns
2/m
8, and
Figure 4 presents the change of mine resistance curve during the expansion. The slope of the curve increases as future expansions are developed, as it expresses the mine resistance which is strongly related to the length of the tunnels and the overall complexity of the network [
7,
8,
9].
Besides the above, the final check regarding the successful implementation of the new ventilation plan is to check the ventilation characteristics in some working faces against the airflow quantity (volume) and velocity requirements as set by the standards. The minimum airflow requirement—for the stricter standard in effect in Greece—is defined at 2.3 cubic meters per second per horsepower (m
3/s per HP) for diesel equipment and 5.66 cubic meters per second per person (m
3/s per person) for personnel [
6]. The minimum air velocity is set at 0.1 m/s and the maximum air velocity is set at 6 m/s [
6]. So, considering the worst-case scenario for these areas, i.e., the diesel equipment with the highest horsepower is used and two persons are working in the mine face, according to the above the minimum airflow requirement is calculated at:
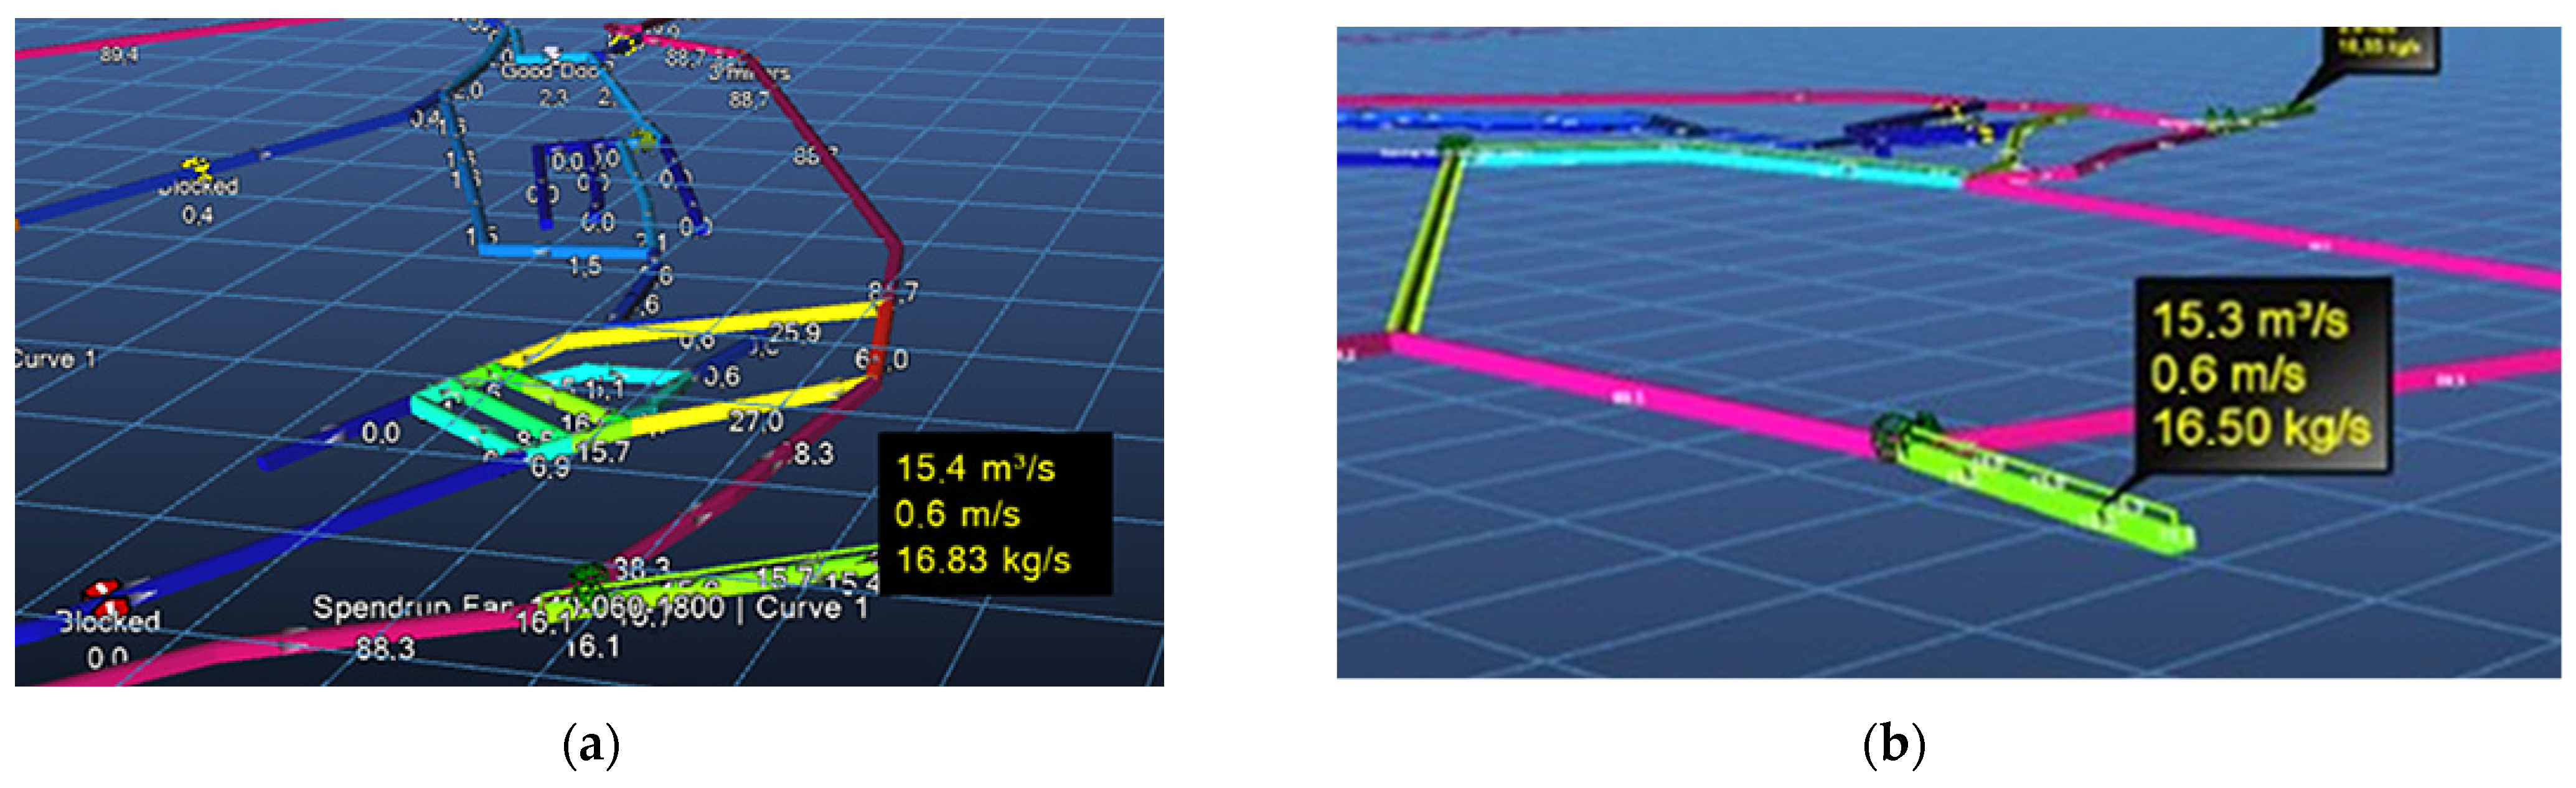
As is shown in
Figure 5, both air velocity and airflow quantity are in compliance with the permissible limits. More particularly, the volume exceeds requirements for at least 1.5 m
3/s, which can also be considered as a good compromise between cost-effectiveness and the uncertainty of the actual future prevailing conditions.
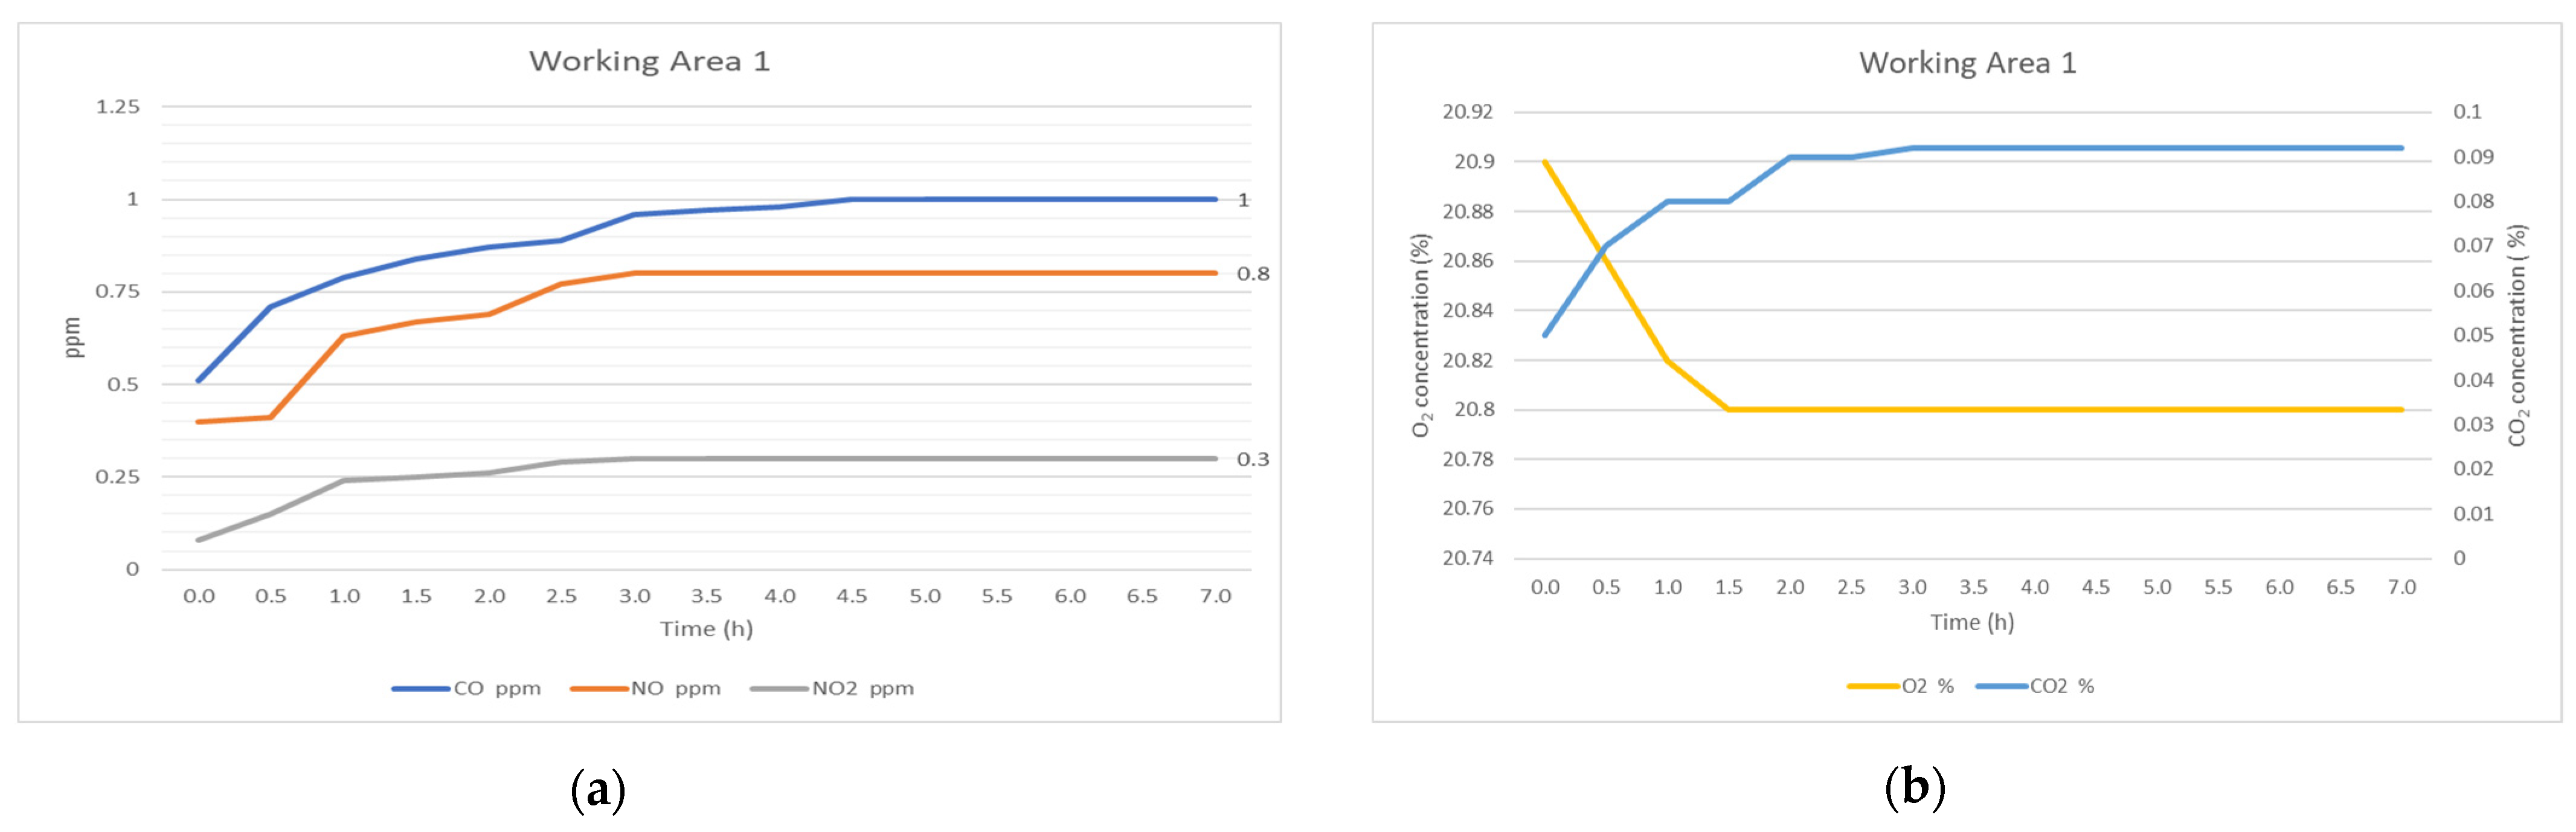
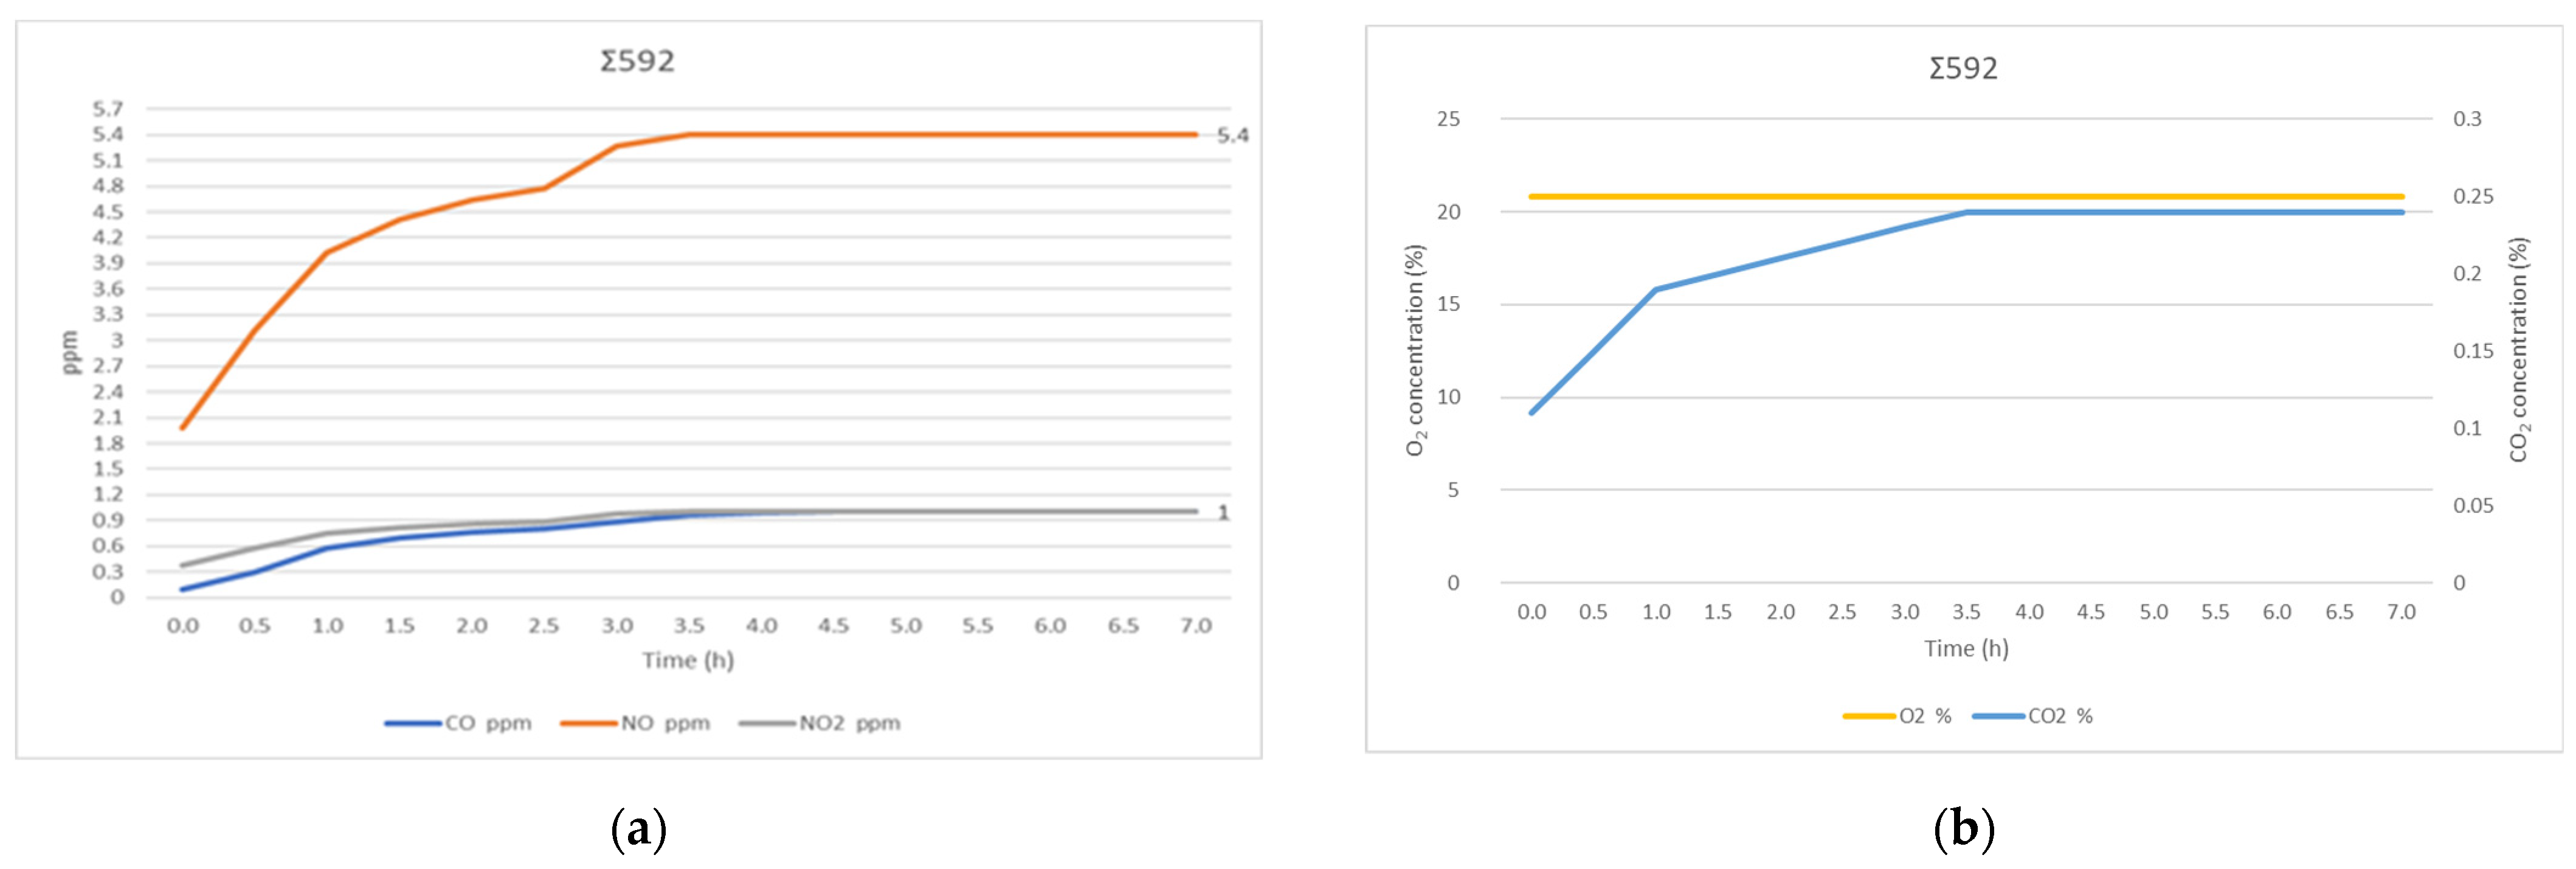
In addition to the above, the air quality characteristics of the mine expansion have also been analyzed.
Figure 6 and
Figure 7 present the results of a 7 h simulation performed at working area #1 and at Σ592 adit with respect to the gas pollutants. As is shown, all concentrations are stabilized after the first 2.5 h of simulation, while they are within the permitted limits.
4. Conclusions
The ventilation of underground exploitations is an essential part of the whole mining process [
10]. This should be developed in a rational and optimized manner to prevent adverse impacts and to ensure cost efficiency that would further facilitate the operations. In this paper, successful ventilation design was completed through the development of a calibrated computer model. This model was firstly validated against actual conditions to ensure the accuracy of the results and to provide the basis for the future design. It is clear that this should be the path forward, especially when useful comparative data of actual measurements are available. In this manner, estimations for the airflow quantity as well as for the obtained air quality can be made in the required level of detail that can assist engineers in adopting design strategies and developing a flexible and yet resilient and robust ventilation system.
For the case examined, this process yielded quantitative results and the ability to easily and successfully model the future ventilation system of the expanded mine workings. Furthermore, it can be further used to model the system in near real time, over different solutions, or even to model the development of air pollutants throughout the shift’s working time in every place of the mine workings.
Finally, the aforementioned process can be further developed with the implementation of ventilation on demand, with the aim of achieving both a significant upgrade of work safety level and a further reduction in operating costs of ventilation systems.


