Proceeding Paper

Dual and Multi Energy XRT and CT Analyses Applied to Copper-Molybdenum Mineralizations in Porphyry Deposits †

1
Development Center X-ray Technology EZRT, Fraunhofer Institute for Integrated Circuits IIS, Flug–Platzstraße 75, 90768 Fürth, Germany
2
GEOPS Université Paris Saclay, Bât 504, 91405 Orsay, France
3
Catura Geoprojects, 2 Rue Marie Davy, 75014 Paris, France
4
Sorbonne Université, CNRS-INSU, Institut des Sciences de la Terre Paris, ISTeP UMR 7193, 75005 Paris, France
5
Department of Earth Sciences, University of Tabriz, Tabriz 51368, Iran
*
Author to whom correspondence should be addressed.
Presented at International Conference on Raw Materials and Circular Economy, Athens, Greece, 5–9 September 2021.
Mater. Proc. 2021, 5(1), 27; https://doi.org/10.3390/materproc2021005027
Published: 23 November 2021
(This article belongs to the Proceedings of International Conference on Raw Materials and Circular Economy)

Abstract

:
X-ray transmission (XRT) and computed tomography (CT) was used on five samples from the Niaz porphyry Cu–Mo deposit in Iran, representing different alteration zones. Analysis of three-dimensional CT data revealed structural information and groups of elements with low, medium and high attenuation, which were assigned to minerals previously determined by scanning electron microscopy. Thus, the mineralization can be located, and the metal/waste ratio can be estimated, leading to more precise ore body modelling and process parameter determination. CT is useful for selected samples as it is time consuming. XRT can be used as real-time process on conveyor belts.

1. Introduction

Copper is an essential element in most renewable and storage technologies [1]. Cu-porphyries represent the most important resource (>60%) for copper, but also for molybdenum and rhenium, and can contain important amounts of gold, silver and other metals [2,3]. Mineralization occurs as stockwork vein systems, as breccias and replace host-rocks. Cu ores are more and more difficult to process, as they have higher and more variable contents in contaminating elements due to decreasing Cu grades and a higher waste/ore ratio. This has a detrimental effect on the entire processing chain, as the throughput has to be increased to keep constant copper metal production. At each step of metallurgical processing, wastes (slags, residues, acid mine drainage) are produced, hosting potentially hazardous elements, e.g., B, Cd, Pb, Hg, and As ([2] and references therein). Thus, operational costs increase related to processing, e.g., finer particle sizes and a greater number of sulfide minerals [4], to stabilizing waste streams and to managing high volumes of wastes, and also the revalorization of slag and acid ([2] and references therein).
Reducing operational costs, and increasing resource efficiency, starts at the exploration state. Rapid definitions of ore grades and ore body morphologies through precise three-dimensional (3D) modelling of reliable data, lead to fast decision making. Combined online-infield chemical and mineralogical analyses (e.g., [5]) are more and more implemented in exploration and mining projects. Separation of valuable material from gangue on a production level based on their fraction of valuable material would decrease processing costs and save energy and water, thereby protecting the environment.
X-rays penetrate rock samples and can thus reveal information on their internal structure and composition without destroying them. Traditional X-ray transmission (XRT) methods only reveal a projection of the samples X-ray attenuation properties into two-dimensional (2D) space, while integrating the signal over the third direction along the X-ray path. Therefore, thin but strongly absorbent samples with a high atomic number cannot be distinguished from thick, weakly absorbent samples with a low atomic number. The obtainable information is thus limited. Dual energy (DE) and multi energy (ME) XRT use the material and energy dependence of X-ray attenuation to gain additional knowledge on the chemical composition of the samples [6].
X-ray computed tomography (CT) requires the recording of projections from different directions, which are then reconstructed into a 3D volume data set. While measurement and reconstruction are more time consuming than XRT, the method allows us to investigate the internal sample structure by virtually slicing the sample in any arbitrary direction. In this way, the local variation of minerals can be visualized [6].
DE- and ME-XRT as well as CT were applied to Cu-porphyry samples being representative of different alteration zones. The combination of these methods allows a detailed analysis of structural and compositional properties of each sample. The relation between these properties and the origin of the sample can be used as a calibration to assign unknown samples to an alteration zone at exploration and mine sites. These data are useful for ore body modelling, which in turn helps to predict processing parameters. In addition, at a production plant, rocks can be sorted into fractions with high or low content of valuables that are consequently included in or excluded from further processing.

2. Materials and Methods
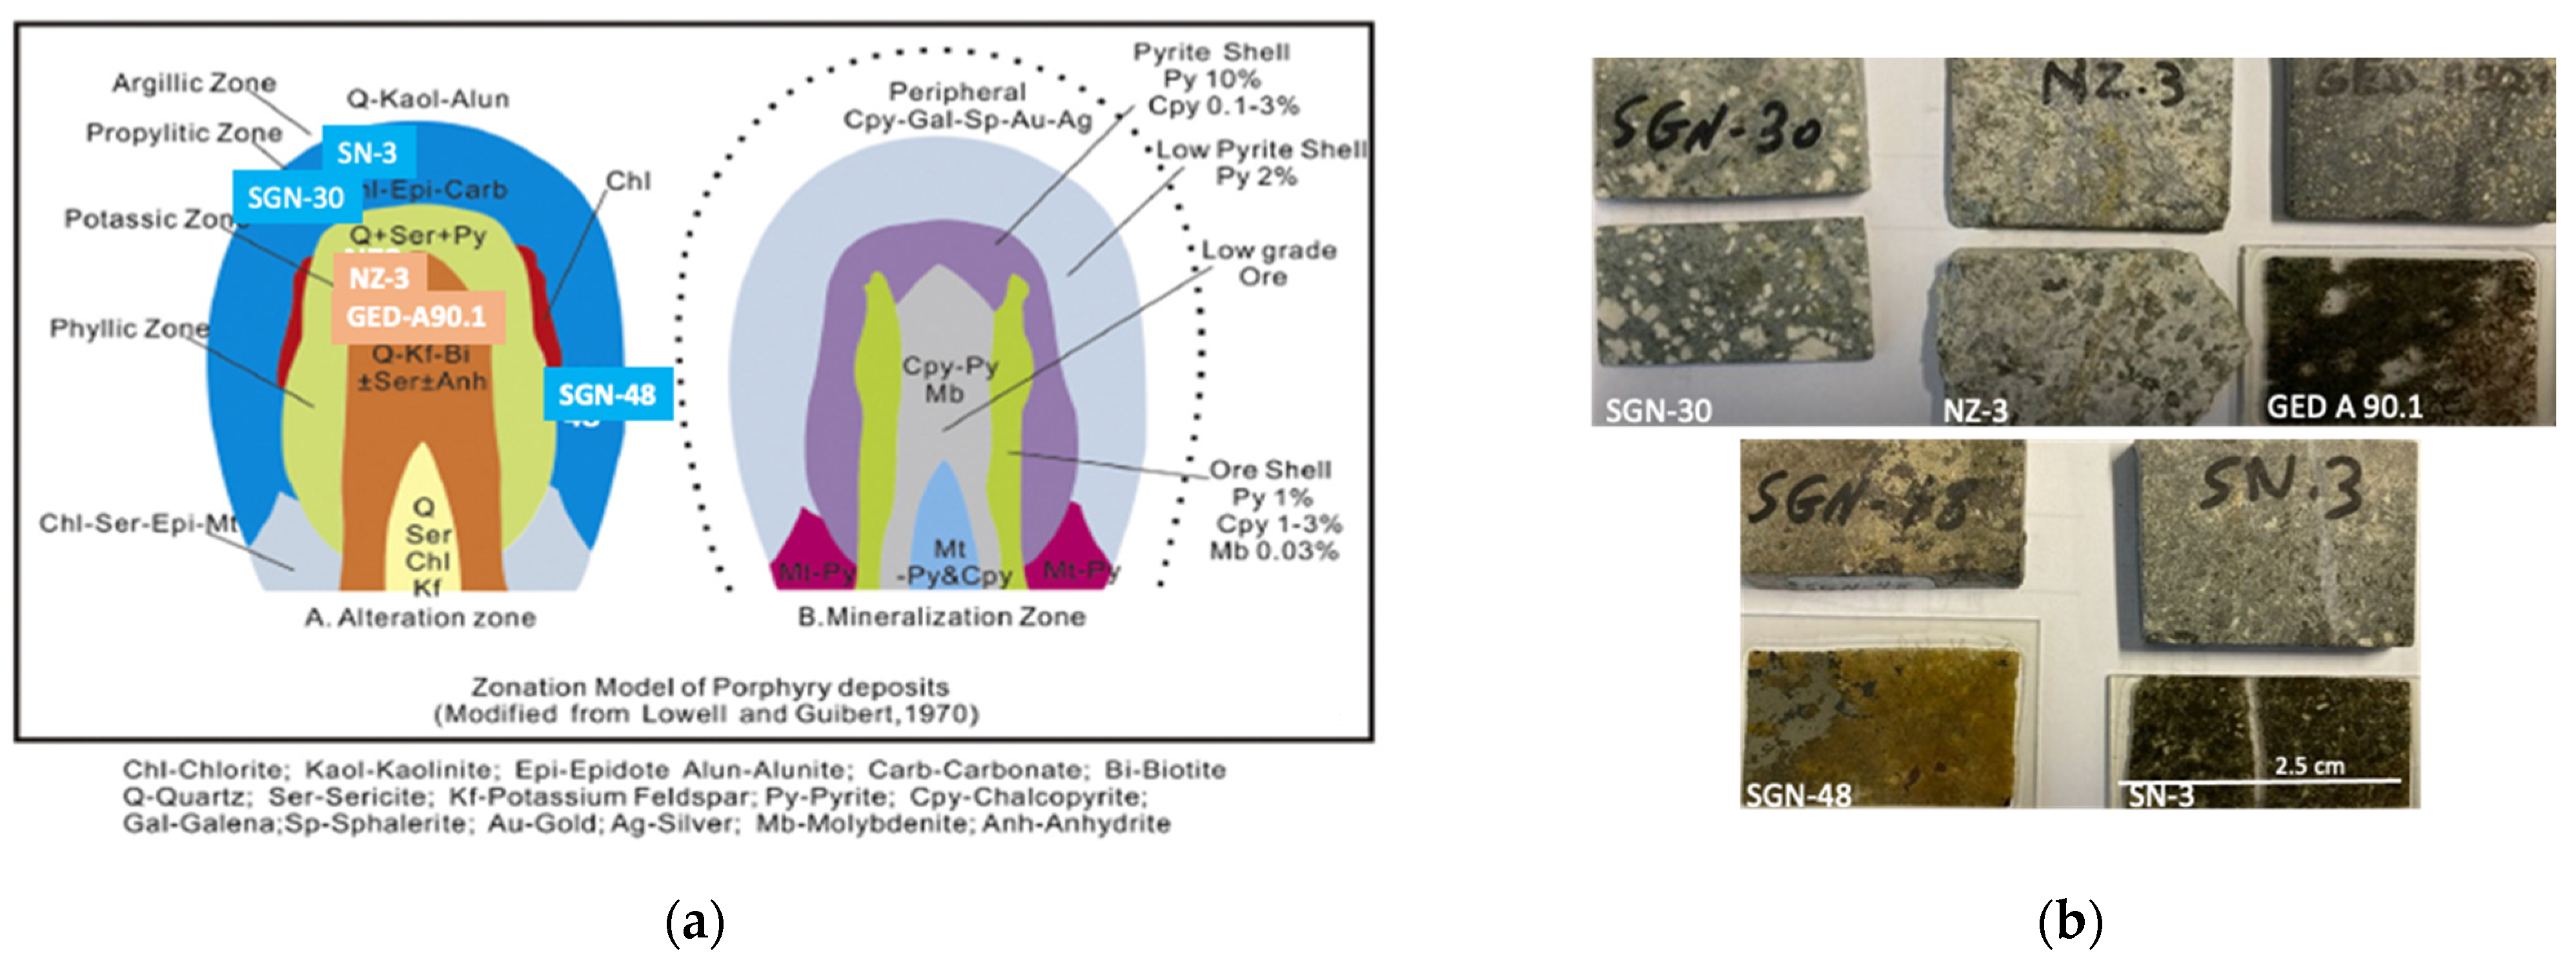
2.1. Samples

Five samples were investigated from the Niaz porphyry Cu-Mo deposit in the Arasbaran metallogenic belt of northwestern Iran (Figure 1b). This deposit is located in the northern part of the northwest–southeast trending Cu-porphyry belt system of about 2000 km length and 50 km width ([7] and references therein). Copper and Mo grades obtained from analyses of drill cores vary between 0.1 and 0.4 wt.%, and 50 and 200 ppm, respectively [8].
The Niaz porphyry stock varies in composition from micro-diorite through monzonite to granodiorite, exhibiting porphyritic to microcrystalline porphyry textures. Diverse generations of quartz-sulfide, quartz-oxide, and sulfide veinlets and micro-veinlets were developed within the porphyry body featuring typical stockwork texture.
The five samples are representative of four temporally and spatially overlapping alteration zones (Figure 1): (1) potassic-phyllic (GED-A90.1, NZ-3), (2) propylitic alteration (SGN-30), (3) phyllic-argillic (SN-3) and (4) peripheral skarn (SGN-48).

2.2. Mineralogy

The mineralogy was accessed through optical microscopic and scanning electron microscopy (SEM, ZEISS Supra 55 VP in BSE mode) investigations at ISTeP (Sorbonne Université), Paris, France. These results were used as a reference for the subsequent ME-XRT, DE-XRT and CT measurements.
Sample GED-A90.1 (Figure 2a) represents quartz diorite in the potassic-phyllic zone. The sample is brownish gray and has a microgranular texture. It is composed of silicates (40% plagioclase, 25% biotite, 25% quartz as veinlets). The mineralization comprises about 10% of pyrite, Cu-sulfides and magnetite. Pyrite has inclusions of chalcopyrite, pyrrhotite (FeS) and galena (PbS). Magnetite (Fe3O4) and barite (BaSO4) are intergrown with chalcopyrite. Ilmenite (Fe,Mn,Ti)O3 is present.
Sample NZ-3 (Figure 2b) represents a quartz monzonite porphyry also belonging to the potassic-phyllic alteration with low grade Cu-Mo mineralization. The sample is light gray to green with granular texture. It is composed of silicates (albite and orthoclase, sericite, quartz, chlorite, biotite, hornblende). Minor calcite and ankerite occur. The mineralization is hosted in veinlets and comprises Cu-sulfides, pyrite, molybdenite (millimetric size). Molybdenite is crosscut by micrometric veins, which are filled with PbS, Cu-Bi and Cu-sulfides hosting Cd, Sb and As.
Sample SGN-30 (Figure 2c) represents a diorite of the propylitic alteration zone. It is a light-gray, whitish rock with a coarse granular texture. The sample is composed of silicates (orthoclase, amphiboles and epidote). Minor calcite occurs. Accessory minerals are apatite (Ca-phosphate), zircon (ZrSiO4), sphene (CaTiSiO5), and ilmenite (FeTiO3). The mineralization comprises disseminated pyrite, including MoS2, PbS and Te-Bi. Rare sphalerite (ZnS) is observed.
Sample SN-3 (Figure 3a,b) represents a quartz-diorite of the phyllic-argillic mineralized zone. The sample is light gray with a microgranular texture, crosscut by a white vein. It is composed of silicates (about 35% albite, 30% orthoclase, 15% biotite and hornblende, sericite, clay minerals). Accessory minerals are apatite, magnetite, and rutile. The mineralization (Cu-sulfides, barite, monazite (REE phosphate), thorite (Th,U)SiO4 and galena) is related to the matrix. The vein hosts quartz and Fe-carbonate (siderite).
Sample SGN-48 (Figure 3c) represents the peripheral part of the porphyry, a garnet-pyroxene skarn. The sample is greenish of coarse granular texture and crosscut by a centimeter thick white vein. The sample is composed of silicates (diopside, actinolite, chlorite, garnet (andradite), epidote). Calcite, phosphates, and Fe-oxides are present. The mineralization comprises pyrite, chalcopyrite, and magnetite. Sphalerite (ZnS) and galena (PbS) are included in pyrite and chalcopyrite. Micrometric Ag-sulfides and Te-Bi clusters are adjacent to galena and occur as inclusions in pyrite. Rare scheelite (CaWO4) occurs in pyrite.
Due to the spatial resolution of approx. 800 µm for XRT and 36 µm for CT (see Section 2.3 and Section 2.4), only Fe-Cu minerals are detected in this paper, as other metal bearing phases are of too small grain size. Most of the other metal phases (molybdenite, Ag-Te-Bi, PbS, ZnS, etc.) are associated or included in the Cu- and Fe-sulfides. Therefore, Cu-Fe sulfide mapping can be used to target the mineralization.

2.3. X-ray Transmission

XRT is performed by placing samples on a conveyor belt and moving them between X-ray source and line detector. The image is recorded line by line. It shows the projection of the X-ray attenuation into 2D space. Along the X-ray beam path, the attenuation is integrated. Thus, the signal is averaged over the structure in this direction.

2.3.1. Dual Energy X-ray Transmission

The DE-XRT setup contains a Comet MXR225/HP11 X-ray source. A DT X-Scan 0.8iL-410 DE-USB-C2 line detector with 0.8 mm pixel pitch was used. It consists of two sensor layers. The first layer and 0.6 mm Cu act as prefilter for the second layer. In this way, two images are recorded simultaneously at different X-ray energies. Measurements were carried out at a tube voltage of 220 kV and a tube current of 2.2 mA. To pre-harden the spectrum, 0.5 mm Cu were used as prefilter. The sample was moved at 340 mm/s corresponding to an exposure time of 2.67 ms per recorded line.
Data were analyzed using basis material decomposition (BMD) [10]. This method utilizes the dependence of X-ray attenuation on energy and on the materials atomic number Z. Applied to two pure materials l (light) and h (heavy), their respective areal densities pl and ph, i.e., their mass per area, can be calculated. Then, a virtual concentration is computed using the formula Ci = pi/(pl+ph), with i = l or h.
The X-ray attenuation of chemically complex compounds, such as rocks, is characterized by an effective atomic number Zeff. Consequently, when executing BMD, basis materials with atomic numbers close to the Zeff of the materials of interest have to be chosen. Here, Cu (Z = 29) and SiO2 (Zeff = 11.65) were used; the latter is a suitable substitute for silicate minerals. Therefore, the quantity obtained by BMD is not a true concentration, but the fraction of low-Z (carbonates of light elements, quartz, Al2O3) and medium-Z materials (Fe, Cu, Zn, Zr, Mo, Ag, Te, Ba as sulfides, alloys, sulfates and silicates). Elements with Z between those of the basis materials (like Ti as ilmenite or rutile) are visible in both groups.

2.3.2. Multi Energy X-ray Transmission

The ME-XRT setup is equipped with the same type of source as the DE-XRT setup. It further contains a MultiX ME100 multi energy line detector. It consists of three modules with 128 pixels with 0.8 mm edge length. Each pixel can record photons with energies between 20 keV and 160 keV in up to 128 energy channels. Scans were performed at a tube voltage of 160 kV and a tube current of 0.5 mA with a 1 mm Ti prefilter. The conveyor belt moved with approximately 40 mm/s, the exposure time was 20 ms per line.
While ME detectors are not yet as established as their DE counterparts, they allow us to distinguish more than two materials if a K-absorption edge is present in the relevant parts of the X-ray spectrum. This is the case for elements with a high atomic number Z, usually larger than approx. 60. Analysis of ME-XRT data is based on an algorithm published in [11,12]. It relies on calibration measurements with combinations of the basis materials with different thicknesses. In this case, quartz glass (SiO2), Cu and W were used. The availability of up to 128 energy channels allows us to choose an optimized energy binning for each application. Here, channels 1 to 44, 45 to 80 and 81 to 128 were merged into three bins, meaning that the first boundary agrees approximately with the K-absorption edge of W. A 3 × 1 median filter along the direction of sample movement was applied to the attenuation in each bin.
Similar to BMD, for chemically complex samples, the method yields the fraction of low-Z (carbonates, quartz, Al2O3, etc.), medium-Z (Fe, Cu, Zn as sulfides and oxides), and high-Z (W) materials instead of true concentrations. In the following text, low-, medium- and high-Z elements refer to the above defined element groups for ME-XRT results.
Without atomic absorption edges in the relevant energy range, the X-ray attenuation can be expressed as a linear combination of the attenuation of other elements. Therefore, the more the atomic number of an element (e.g., Ti, Zr, Mo as sulfides and/or silicates) differs from those chosen for calibration, the more its signal will be distributed over the different element groups. For elements with absorption edges (Ag, Te, Ba, Pb, REE, Th, U as sulfides, alloys and/or phosphates), there is a more complex behavior. For instance, Pb with Z = 82 can end up in the low-Z image. For the investigated samples, the concentration of such elements and thus their influence on the ME-XRT analysis is expected to be low.

2.4. X-ray Computed Tomography

2.4.1. Measurements

The CT facility uses an Yxlon FXE-225.99(48) microfocus X-ray source and a PerkinElmer XRD 1621 flat panel detector with CsI scintillator. Due to the 2x2 pixel binning the effective pixel pitch is 200 µm.
All CT scans were performed with 220 kV tube voltage, 140 µA and a helical trajectory [13], meaning the sample was rotated between source and detector while moving it in vertical direction. For four of the samples, a 1 mm Cu prefilter, an exposure time of 555 ms per projection and 1200 projections per 360° rotation were used. Only sample NZ-3 was measured with 2.5 mm Cu prefilter, 1000 ms exposure time and 1600 projections per 360° to account for the stronger attenuation and to reduce beam-hardening artifacts.
3D volume datasets were reconstructed using filtered backprojection. The voxels (volume elements) have an edge length of 36 µm. This allows us to detect small sample structures not visible in XRT.

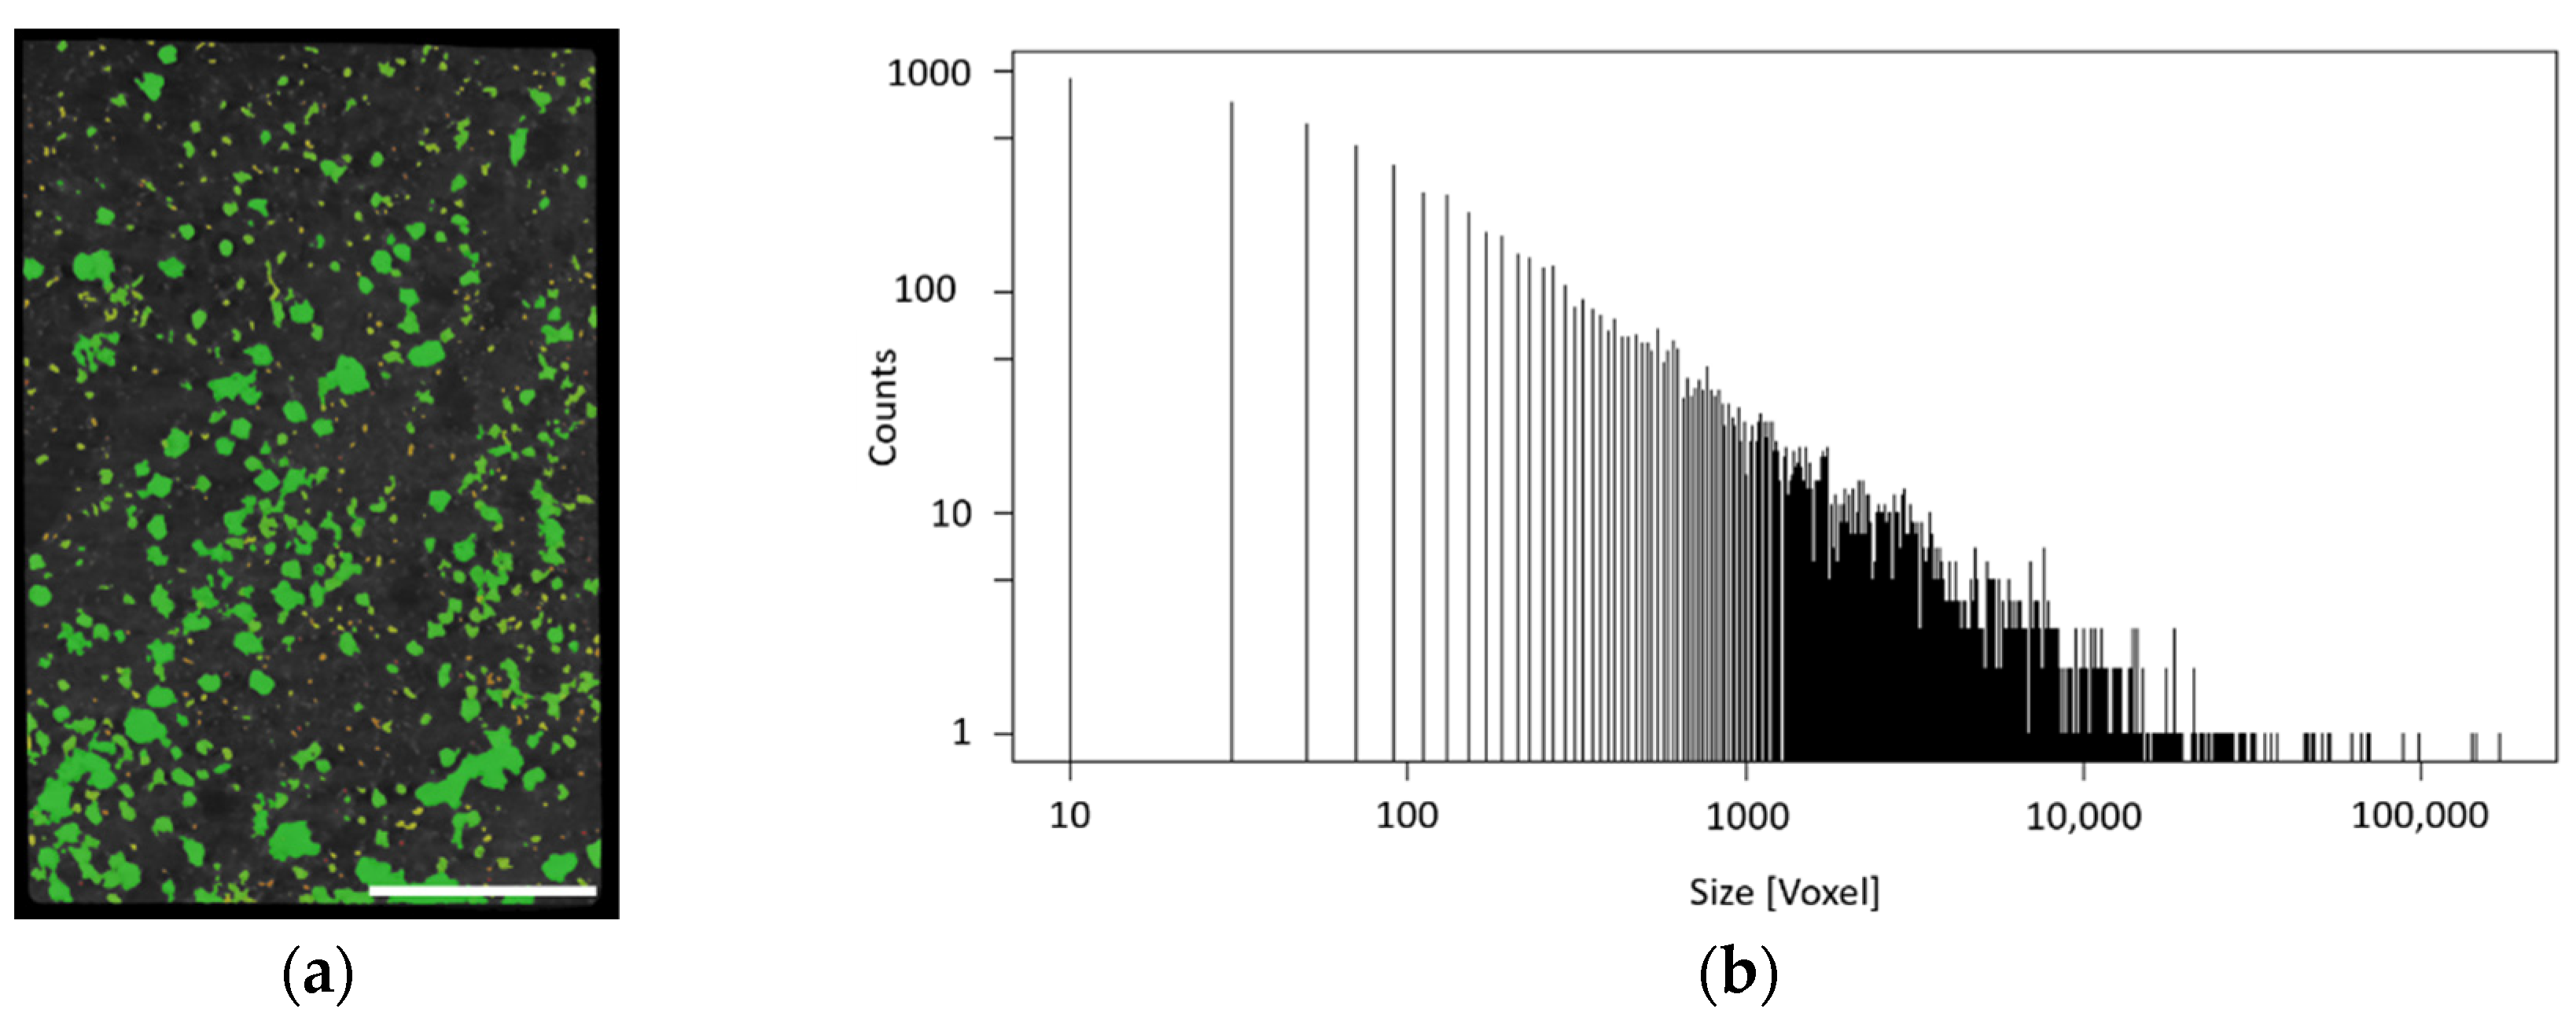
2.4.2. Image Processing

The 3D reconstructions of the five rock samples were processed to obtain characteristic information such as the size and number of internal fractions [6,14]. To reduce noise, a 5 × 5 × 5 median filter (ball mask) was applied to the 3D data. Subsequently the image processing method blob analysis was used to detect regions consisting of connected voxels that differ in their gray values from the background. These regions are called blobs (binary large objects) [15]. As a first step of the blob analysis, the 3D reconstructions were binarized by choosing an appropriate threshold manually. Then, a watershed transformation [16] was applied to segment the interesting objects. Objects smaller than or equal to five voxels were removed from the following analysis. From the data obtained by segmentation, the blob size and volume can be calculated. To obtain the fraction of medium and high-Z elements per sample, the size of all blobs was summed up and divided by the total number of voxels per rock.

3. Results

3.1. Potassic-Phyllic Zone

GED-A90.1 from the potassic-phyllic zone has an intermediate medium-Z concentration (Cu-Fe sulfides), which shows a small variation over the sample area (Figure 4a,b). The high-Z element content (W) is low. In contrast, sample NZ-3 contains a highly attenuating vein, which creates a high signal in the medium-Z images (molybdenite and Cu-sulfides, minor barite) obtained by DE- and ME-XRT (Figure 4a,b). The high-Z content found by ME-XRT is slightly increased in this vein.
Virtual cross sections through the CT volume data can be compared to SEM data to identify minerals based on their gray value. The dark gray silicates and bright pyrite, Cu-sulfides and magnetite are visible in GED-A90.1. Due to their small size, their spatial distribution could not be resolved by XRT. The high attenuation in the vein of NZ-3 is caused by Cu-sulfides, pyrite and molybdenite associated with PbS and Cu-Bi phases. These elements lead to strong beam hardening artifacts in reconstructed CT cross sections. While they are expected to have a limited impact on the blob analysis of the heavy materials fraction, they prevent a quantitative porosity analysis.
In Figure 5a, the result of the blob analysis of GED-A90.1 can be seen as an example. In this sample, 8909 blobs containing more than five voxels were found, which sums up to a volume fraction of 15% (Table 1. Fraction of the different material classes found by XRT and CT for each of the investigated samples). The distribution of the blob size can be seen in the respective histogram (Figure 5b).

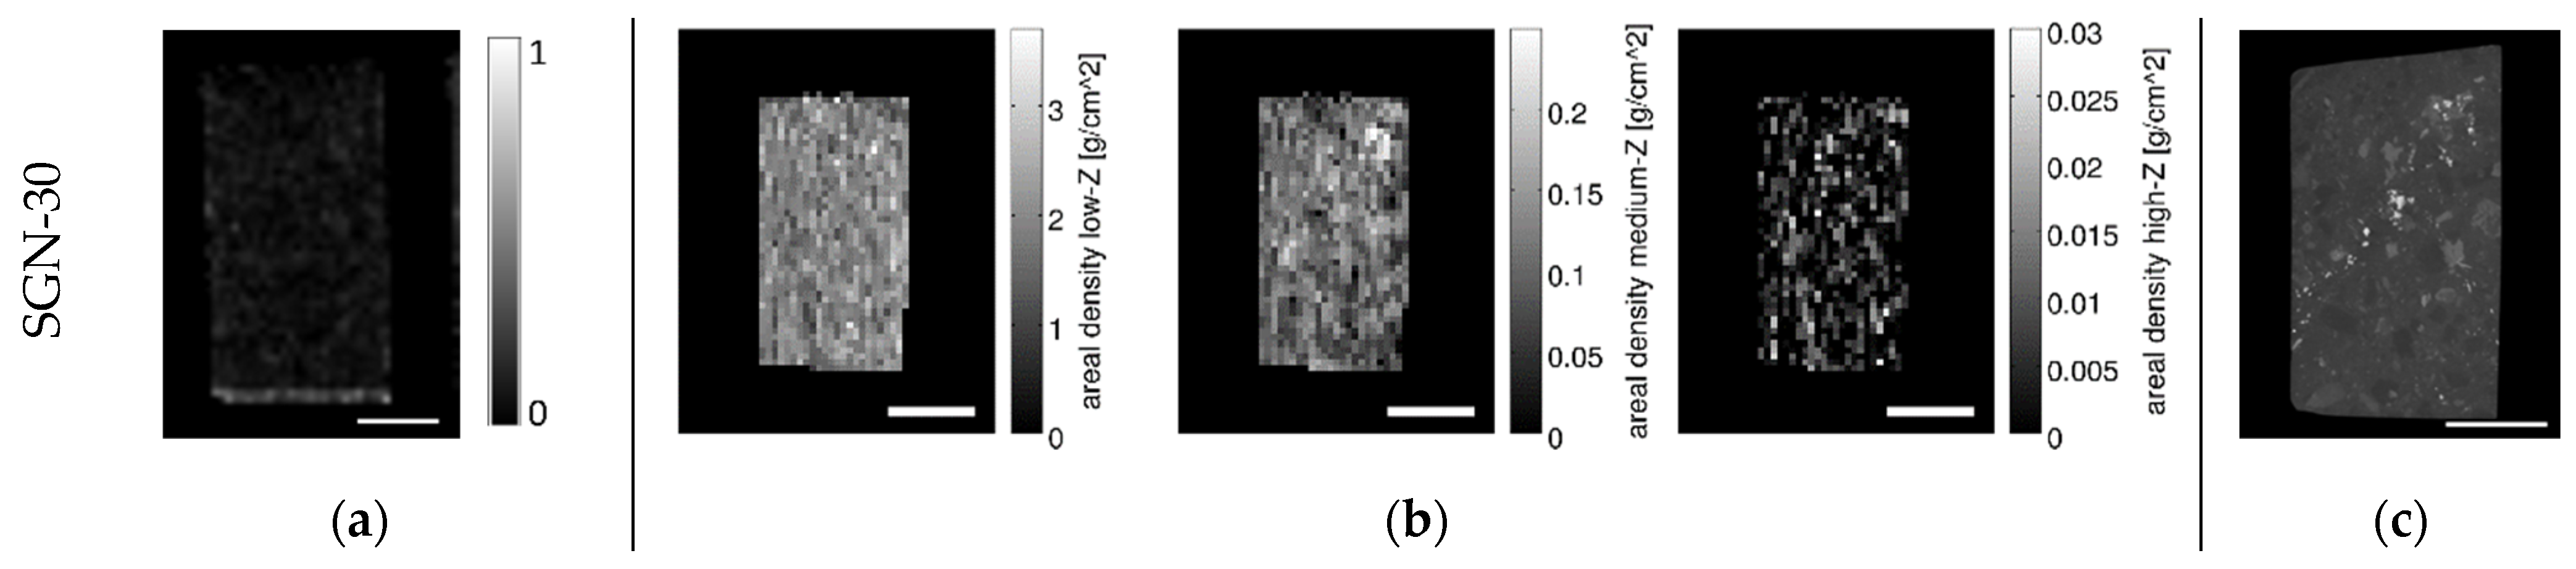
3.2. Propylitic Zone

Figure 6 shows the results obtained for sample SGN-30 from the propylitic zone. DE- as well as ME-XRT show a low content of medium-Z elements (pyrite, sphalerite, sphene, zircon, ilmenite) for this sample. The high-Z content (W) found by ME-XRT also is low.
The obtained CT cross section (see Figure 6c) shows four groups of gray values, which can be attributed to feldspars, epidote, amphibole, apatite (darkest gray), matrix (medium gray) corresponding to molybdenite, Te-Bi phases, pyrite, sphalerite, sphene, ilmenite (light gray) and galena, monazite, and zircons (white).

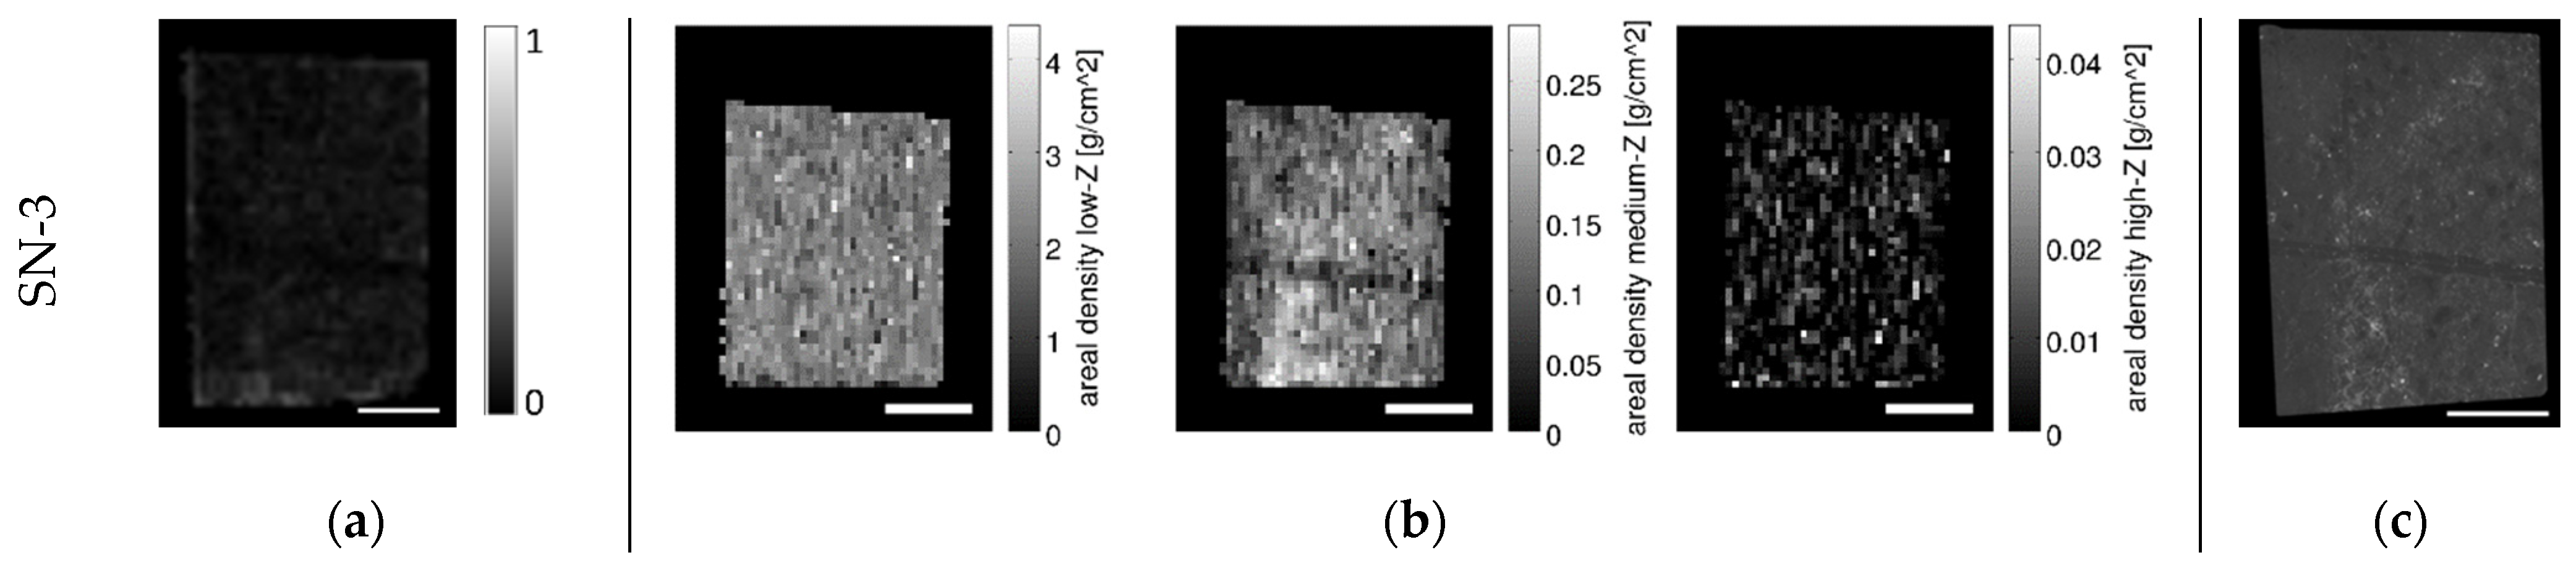
3.3. Phyllic-Argillic Zone

Figure 7 shows the results for sample SN-3 from the phyllic-argillic zone. DE- as well as ME-XRT show a low content of minerals from the medium-Z group. These elements correspond to Cu-sulfides, magnetite, hematite and barite. The high-Z content (W) is low.
The virtual CT cross section shows the quartz, feldspar, biotite, carbonate filled vein (dark) and small light gray and bright particles that are Cu-sulfides, magnetite (±monazite, barite, thorite and galena).

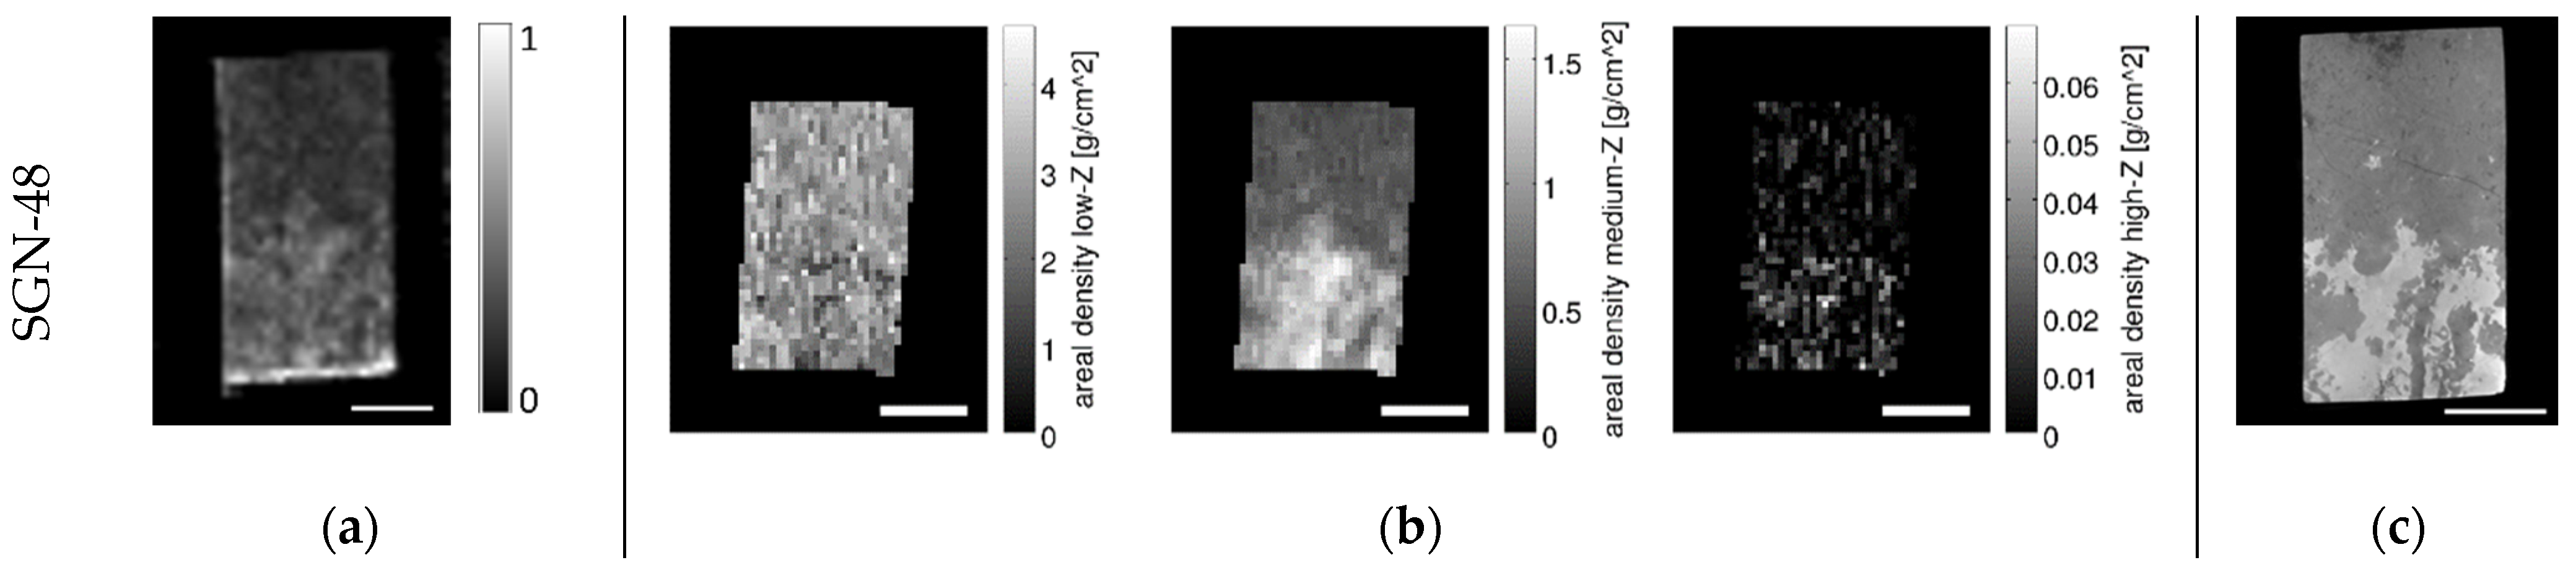
3.4. Peripheral Skarn

The concentration of medium-Z elements (Cu-sulfides, pyrite, Fe-oxides, Ag-Te-Bi) visible in DE- as well as ME-XRT images of SGN-48 from the peripheral skarn zone is the highest of all investigated samples. It varies over the sample area (Figure 8). The high-Z content (wolframite) found by ME-XRT increases slightly in the part rich in medium-Z elements.
The virtual CT cross section shows the same spatial variation of gray values as the XRT images. The lighter gray values in the lower part are caused by the medium-Z elements in Cu-sulfides, pyrite and magnetite (associated with sphalerite, galena and Ag-Te-Bi phases).

4. Discussion

Mining and processing companies are interested in estimating the valuable/waste ratio already at exploration state (drilling) to minimize the expected waste and to reduce the environmental impact. With this intention in mind, we calculated the material fractions.
Table 1 shows the fraction of medium-Z (Fe, Cu, Zn, Mo, Ag, Te, Ba bearing minerals) and high-Z (W) materials found by the different methods. The results presented in this paper cannot be compared to a chemical analysis (inductively coupled plasma mass spectroscopy ICP-MS, X-ray fluorescence spectroscopy XRF) as the sample needs to be powdered. These analyses will be performed after further non-destructive analyses by portable and core scanners using laser-induced breakdown spectroscopy (LIBS), visible and near-infrared and short-wave infrared spectroscopy (VNIR-SWIR) and XRF [5].
However, previous results on iron-oxide ores show the reliability of the used methods [6]. Furthermore, all methods show similar trends for the medium-Z fraction.
High-Z materials have a low concentration and are barely detectable with ME-XRT due to measurement noise. This noise is due to the low photon flux. Higher flux leads to pulse pile-up, which degrades the energy resolution [17] and thus hampers the analysis. In general, noise is lower for the DE-XRT results. The concentration of medium-Z materials is lowest in the propylitic and the phyllic-argillic zones, while the highest value is found in the peripheral skarn.
These preliminary results show that DE- and ME-XRT and CT are powerful tools to roughly estimate mineralized zones in Cu-porphyries. Prior to using these methods as routine analyses on mine or workshop sites, SEM analyses on specific drill core parts from the various alteration zone must be conducted to calibrating XRT and CT analyses. In the samples used in this study, molybdenite, Cu-and Fe-sulfides and Fe-oxides, Ag-Te-Bi, galena are intergrown. Therefore, the micrometric phases such as Ag-Te-Bi and galena inclusions which cannot be detected by XRT and CT due to spatial resolution limits, can be targeted by using Fe and Cu for defining crushing, milling and flotation parameters. In this study, the samples with highest valuable metal contents in the peripheral skarn and the potassic-phyllic zones would comprise about 80% to 85% of mainly silicate waste material.

5. Conclusions

In the scope of this work, XRT can be used to distinguish waste (low-Z) from valuables (medium- and high-Z). This allows sorting valuable metal bearing phases from barren material and reduce waste material entering the processing chain. Calibration through mineralogical studies (optical microscopy and SEM) on key-samples, which are characteristic for the deposits and alteration zones, are necessary to define all elements and general grain sizes of the metal bearing phases. Hence, XRT and CT can significantly contribute to reduce energy and water consumption, and leave maximal barren material in place.

Author Contributions

Conceptualization, B.O.; methodology, R.W. and C.B.; software, R.W. and M.F.; validation, M.F. and C.W.; formal analysis, R.W. and C.B.; investigation, R.W., C.B., C.W. O.B. and K.S.; resources, O.B. and K.S.; data curation, C.W.; writing—original draft preparation, C.B., R.W. and B.O.; writing—review and editing, B.O., M.F., R.W., C.W. and C.B.; visualization, B.O., C.B. and R.W.; supervision, B.O.; project administration, B.O.; funding acquisition, M.F. and B.O. All authors have read and agreed to the published version of the manuscript.

Funding

Part of this research has received funding from the “ANCORELOG” project (Grant N° 17028) from the European Institute of Innovation and Technology (EIT), a body of the European Union under the Horizon 2020, the EU framework Program for Research and Innovation and the “REWO-SORT” project in the scope of the transnational call of the ERA-Net ERA-MIN 2 from the BMBF in Germany (Grant N° 033RU003A). Furthermore, this research was funded by the TRIGGER project, a French–Iranian cooperation.

Conflicts of Interest

The authors declare no conflict of interest.

References

  1. World Bank Group. Minerals for Climate Action: The Mineral Intensity of the Clean Energy Transition. Available online: http://pubdocs.worldbank.org/en/961711588875536384/Minerals-for-Climate-Action-The-Mineral-Intensity-of-the-Clean-Energy-Transition.pdf (accessed on 30 September 2020).
  2. Tabelin, C.B.; Park, I.; Phengsaart, T.; Jeon, S.; Villacorte-Tabelin, M.; Alonzo, D.; Yoo, K.; Ito, M.; Hiroyoshi, N. Copper and critical metal production from porphyry ores and E-wastes: A review of resource availability, processing/recycling challenges, socio-environmental aspects and sustainability issues. Resour. Conserv. Recycl. 2021, 170, 105610. [Google Scholar] [CrossRef]
  3. Sillitoe, R.H. Porphyry copper systems. Econ. Geol. 2010, 105, 3–41. [Google Scholar] [CrossRef] [Green Version]
  4. Aikawa, K.; Ito, M.; Segawa, T.; Jeon, S.; Park, I.; Tabelin, C.B.; Hiroyoshi, N. Depression of lead-activated sphalerite by pyrite via galvanic interactions: Implications to the selective flotation of complex sulfide ores. Miner. Eng. 2020, 152, 106367. [Google Scholar] [CrossRef]
  5. ANCORELOG: Analytical Core Logging System. Available online: https://eitrawmaterials.eu/project/ancorelog/ (accessed on 28 June 2021).
  6. Bauer, C.; Wagner, R.; Orberger, B.; Firsching, M.; Ennen, A.; Garcia Pina, C.; Wagner, C.; Honarmand, M.; Nabatian, G.; Monsef, I. Potential of Dual and Multi Energy XRT and CT Analyses on Iron Formations. Sensors 2021, 21, 2455. [Google Scholar] [CrossRef] [PubMed]
  7. Omrani, J.; Agard, P.; Whitechurch, H.; Benoit, M.; Prouteau, G.; Jolivet, J. Arc-magnetism an subduction history beneath the Zagros Mountain, Iran: A new report of adakites and geodynamic consequences. Lithos 2008, 106, 380–398. [Google Scholar] [CrossRef]
  8. Hassanpour, H.; Alirezaei, S.; Selby, D.; Sergeev, S. SHRIMP zircon U–Pb and biotite and hornblende Ar–Ar geochronology of Sungun, Haftcheshmeh, Kighal, and Niaz porphyry Cu–Mo systems: Evidence for an early Miocene porphyry-style mineralization in northwest Iran. Int. J. Earth Sci. 2015, 104, 45–59. [Google Scholar] [CrossRef]
  9. Lowell, J.D.; Guilbert, J.M. Lateral and Vertical Alteration-Mineralization Zoning in Porphyry Ore Deposits. Econ. Geol. 1970, 65, 373–408. [Google Scholar] [CrossRef]
  10. Firsching, M.; Nachtrab, F.; Uhlmann, N.; Hanke, R. Multi-Energy X-ray Imaging as a Quantitative Method for Materials Characterization. Adv. Mater. 2011, 23, 2655–2656. [Google Scholar] [CrossRef] [PubMed]
  11. Alvarez, R.E. Estimator for photon counting energy selective X-ray imaging with multibin pulse height analysis. Med. Phys. 2011, 38, 2324–2334. [Google Scholar] [CrossRef] [PubMed]
  12. Alvarez, R.E. Efficient, Non-Iterative Estimator for Imaging Contrast Agents with Spectral X-ray Detectors. IEEE Trans. Med. Imaging 2016, 35, 1138–1146. [Google Scholar] [CrossRef] [PubMed]
  13. Kalender, W.A.; Seissler, W.; Klotz, E.; Vock, P. Spiral volumetric CT with single breath-hold technique continuous transport and scanner rotation. Radiology 1990, 176, 181–183. [Google Scholar] [CrossRef]
  14. Bauer, C.; Wagner, R.; Firsching, M.; Orberger, B.; Lucic, J.; Ennen, A.; Wörlein, N.; Dubos, J.L.; Banchet, J.; Milazzo, J.-M.; et al. Recycling of Mn-processing dusts: Quality control through 3D computed tomography. In Proceedings of the IMPC 2020: International Mineral Processing Congress, Cape Town, South Africa, 18–22 October 2020; pp. 3551–3560. [Google Scholar]
  15. Bharodiya, A.K.; Gonsai, A.M. An intelligent assistive algorithm for bone tumor detection from human X-ray images based on binary Blob analysis. Int. J. Inf. Technol. 2020, 107, 2411–2502. [Google Scholar] [CrossRef]
  16. Vincent, L.; Soille, P. Watersheds in digital spaces: An efficient algorithm based on immersion simulations. IEEE Trans. Pattern Anal. Mach. Intell. 1991, 13, 583–598. [Google Scholar] [CrossRef] [Green Version]
  17. Taguchi, K.; Iwanczyk, J.S. Vision 20/20: Single photon counting X-ray detectors in medical imaging. Med. Phys. 2013, 40, 100901. [Google Scholar] [CrossRef] [PubMed]
Figure 1. (a) Schematic sections through Cu-Mo porphyry deposits. Left: The sample locations on the alteration zones and the major silicates of each zone; Right: Alteration zones showing the major mineralizations from high grade Cu and Mo to low grade Pb, Zn, Au and Ag ores (modified from [9]); (b) Samples studied here: SGN-30: propylitic zone; NZ-3: potassic-phyllic zone; GED-A90.1: potassic-phyllic zone; SGN-48: peripheral part, garnet-diopside skarn; SN-3: phyllic argillic zone.
Materproc 05 00027 g001
Figure 2. SEM micrographs: (a) GED-A90.1: Pyrite with chalcopyrite (CuFeS2) inclusion; (b) NZ-3: Overview on ore minerals; (c) SGN-30: Pyrite and associated Mo, PbS, Te-Bi phases.
Materproc 05 00027 g002
Figure 3. SEM micrographs: (a) SN-3: Matrix feldspars with thorite inclusions; (b) SN-3: Chalcopyrite around ankerite and magnetite grains; (c) SGN-48: Cu-sulfide mineralization with galena and Ag-Te-Bi particles.
Materproc 05 00027 g003
Figure 4. Results for samples GED-A90.1 (top) and NZ-3 (bottom): (a) Medium-Z concentration computed from DE-XRT measurement; (b) Areal density computed from ME-XRT measurement for low-, medium- and high-Z elements (from left to right); (c) Virtual cross section through reconstructed CT data. Scale bars are 10 mm.
Materproc 05 00027 g004
Figure 5. CT examination of GED-A90.1: (a) Virtual cross section through reconstruction in the YZ-plane with overlay of the results of the blob analysis. Identified blobs are labeled green, orange and yellow (colors are related to blob size, large blobs in green, small blobs in orange). Scale bar is 10 mm; (b) Histogram of the blob size.
Materproc 05 00027 g005
Figure 6. Results for sample SGN-30: (a) Medium-Z concentration computed from DE-XRT measurement; (b) Areal density computed from ME-XRT measurement for low-, medium- and high-Z elements (from left to right); (c) Virtual cross section through reconstructed CT data. Scale bars are 10 mm.
Materproc 05 00027 g006
Figure 7. Results for sample SN-3: (a) Medium-Z concentration computed from DE-XRT measurement; (b) Areal density computed from ME-XRT measurement for low-, medium- and high-Z elements (from left to right); (c) Virtual cross section through reconstructed CT data. Scale bars are 10 mm.
Materproc 05 00027 g007
Figure 8. Results for sample SGN-48: (a) Medium-Z concentration computed from DE-XRT measurement; (b) Areal density computed from ME-XRT measurement for low-, medium- and high-Z elements (from left to right); (c) Virtual cross section through reconstructed CT data. Scale bars are 10 mm.
Materproc 05 00027 g008
Table 1. Fraction of the different material classes found by XRT and CT for each of the investigated samples.
Alteration ZoneSampleMedium-Z Elements Median DE-XRTMedium-Z Elements Median ME-XRTHigh-Z Elements Median ME-XRTMedium- and High-Z Elements CT
potassic-phyllicGED-A90.117.8%13.3%0.7‰15.1%
NZ-320.9%17.5%3.7‰17.5%
propyliticSGN-306.5%5.4%1.2‰7.4%
phyllic-argillicSN-36.9%5.6%1.3‰7.8%
peripheral skarnSGN-4826.6%20.8%1.1‰20.4%
Publisher’s Note: MDPI stays neutral with regard to jurisdictional claims in published maps and institutional affiliations.

