1. Introduction
Rare Earth Elements (REEs) have attracted specific and high interest in the last 15 years, since they are now one of the most critical metals and appropriate category due to their use in high-technology materials and an indispensable category for the transition to the green era. China is the dominant country concerning the production and the processing of REE, with figures exceeding 80%.
It is now well established that many deep-sea mineral marine deposits (some categories of Fe–Mn nodules or Co-rich crusts) and, in some exceptional cases, deep-sea sediments or marine phosphorites have very high concentrations of REEs. One general characteristic of these deposits is that although they have lower contents of REEs, compared to the well-known terrestrial deposits, their sizes are very extensive, much higher than those of land-based deposits. Therefore, the future use of these marine deposits as a source of REEs could be an effective alternative to the mounding demand for these strategic elements.
However, all the above assessments must consider the most basic and sensitive parameter in the whole story, i.e., the markets and prices, in the present and their outlook of different REEs in the coming years and the general geopolitical situation.
In 2013, Hein et al. [
1] published a paper concerning the possibilities for the future use of deep-sea mineral deposits as a source of critical elements for use in new high-technology materials and use in green technologies. They compared these deposits with two of the largest on-land REE deposits, i.e., Bayan Obo (Obo) in China and Mountain Pass (MP) in the U.S. For their comparison, they used the contents of REEs in the Mn–Fe oxides nodules from the Clarion Clipperton Zone (CCZ) deposits and Co-rich ferromanganese crusts from the PCZ (
Table 1). They concluded that although the two land-based deposits are higher in grade their tonnages are considerably lower than those of the CCZ and PCZ deep-sea deposits (Obo: 8.0 × 10
8 tonnes with 6% total rare earth oxide (TREO); MP, 0.48 × 10
8 tones at 7.0% with total REE oxides; deep-sea CCZ: 211 × 10
8 tonnes with 0.07% TREO; PCZ deposits: 75.3 × 10
8 tonnes with 0.21% TREO).
Here, we have to make it clear that in these deep-sea deposits, the extraction of REEs in economic terms presupposes that they will be extracted as byproducts after extracting the main elements, i.e., Ni, Cu and Co. A critical factor is associated with the metallurgical processing of deep-sea Mn–Fe nodules and Co-rich crusts to extract Ni,Co,Cu,Mn and REEs as byproducts after the extraction of the above-mentioned main elements [
2,
3].
Most of the Fe–Mn nodules with economic interest are concentrated in the zone of the Pacific Ocean in depths to a 5000 average meter at the boundary between the water and the bottom of the sentiments and in the upper part of the column of the sediments.
The most promising on economic terms, Fe–Mn nodules, lies in the CCZ learning between Hawaii and Mexico. It should be mentioned that already from the middle 1970 to 1980, there was high interest for these formations due to their high contents of Ni (1.4%), Cu (1.3%) and Co (0.25%). Today, their high Mn content (30%) and the REE (average: 0.08%) give additional economic value to those nodules.
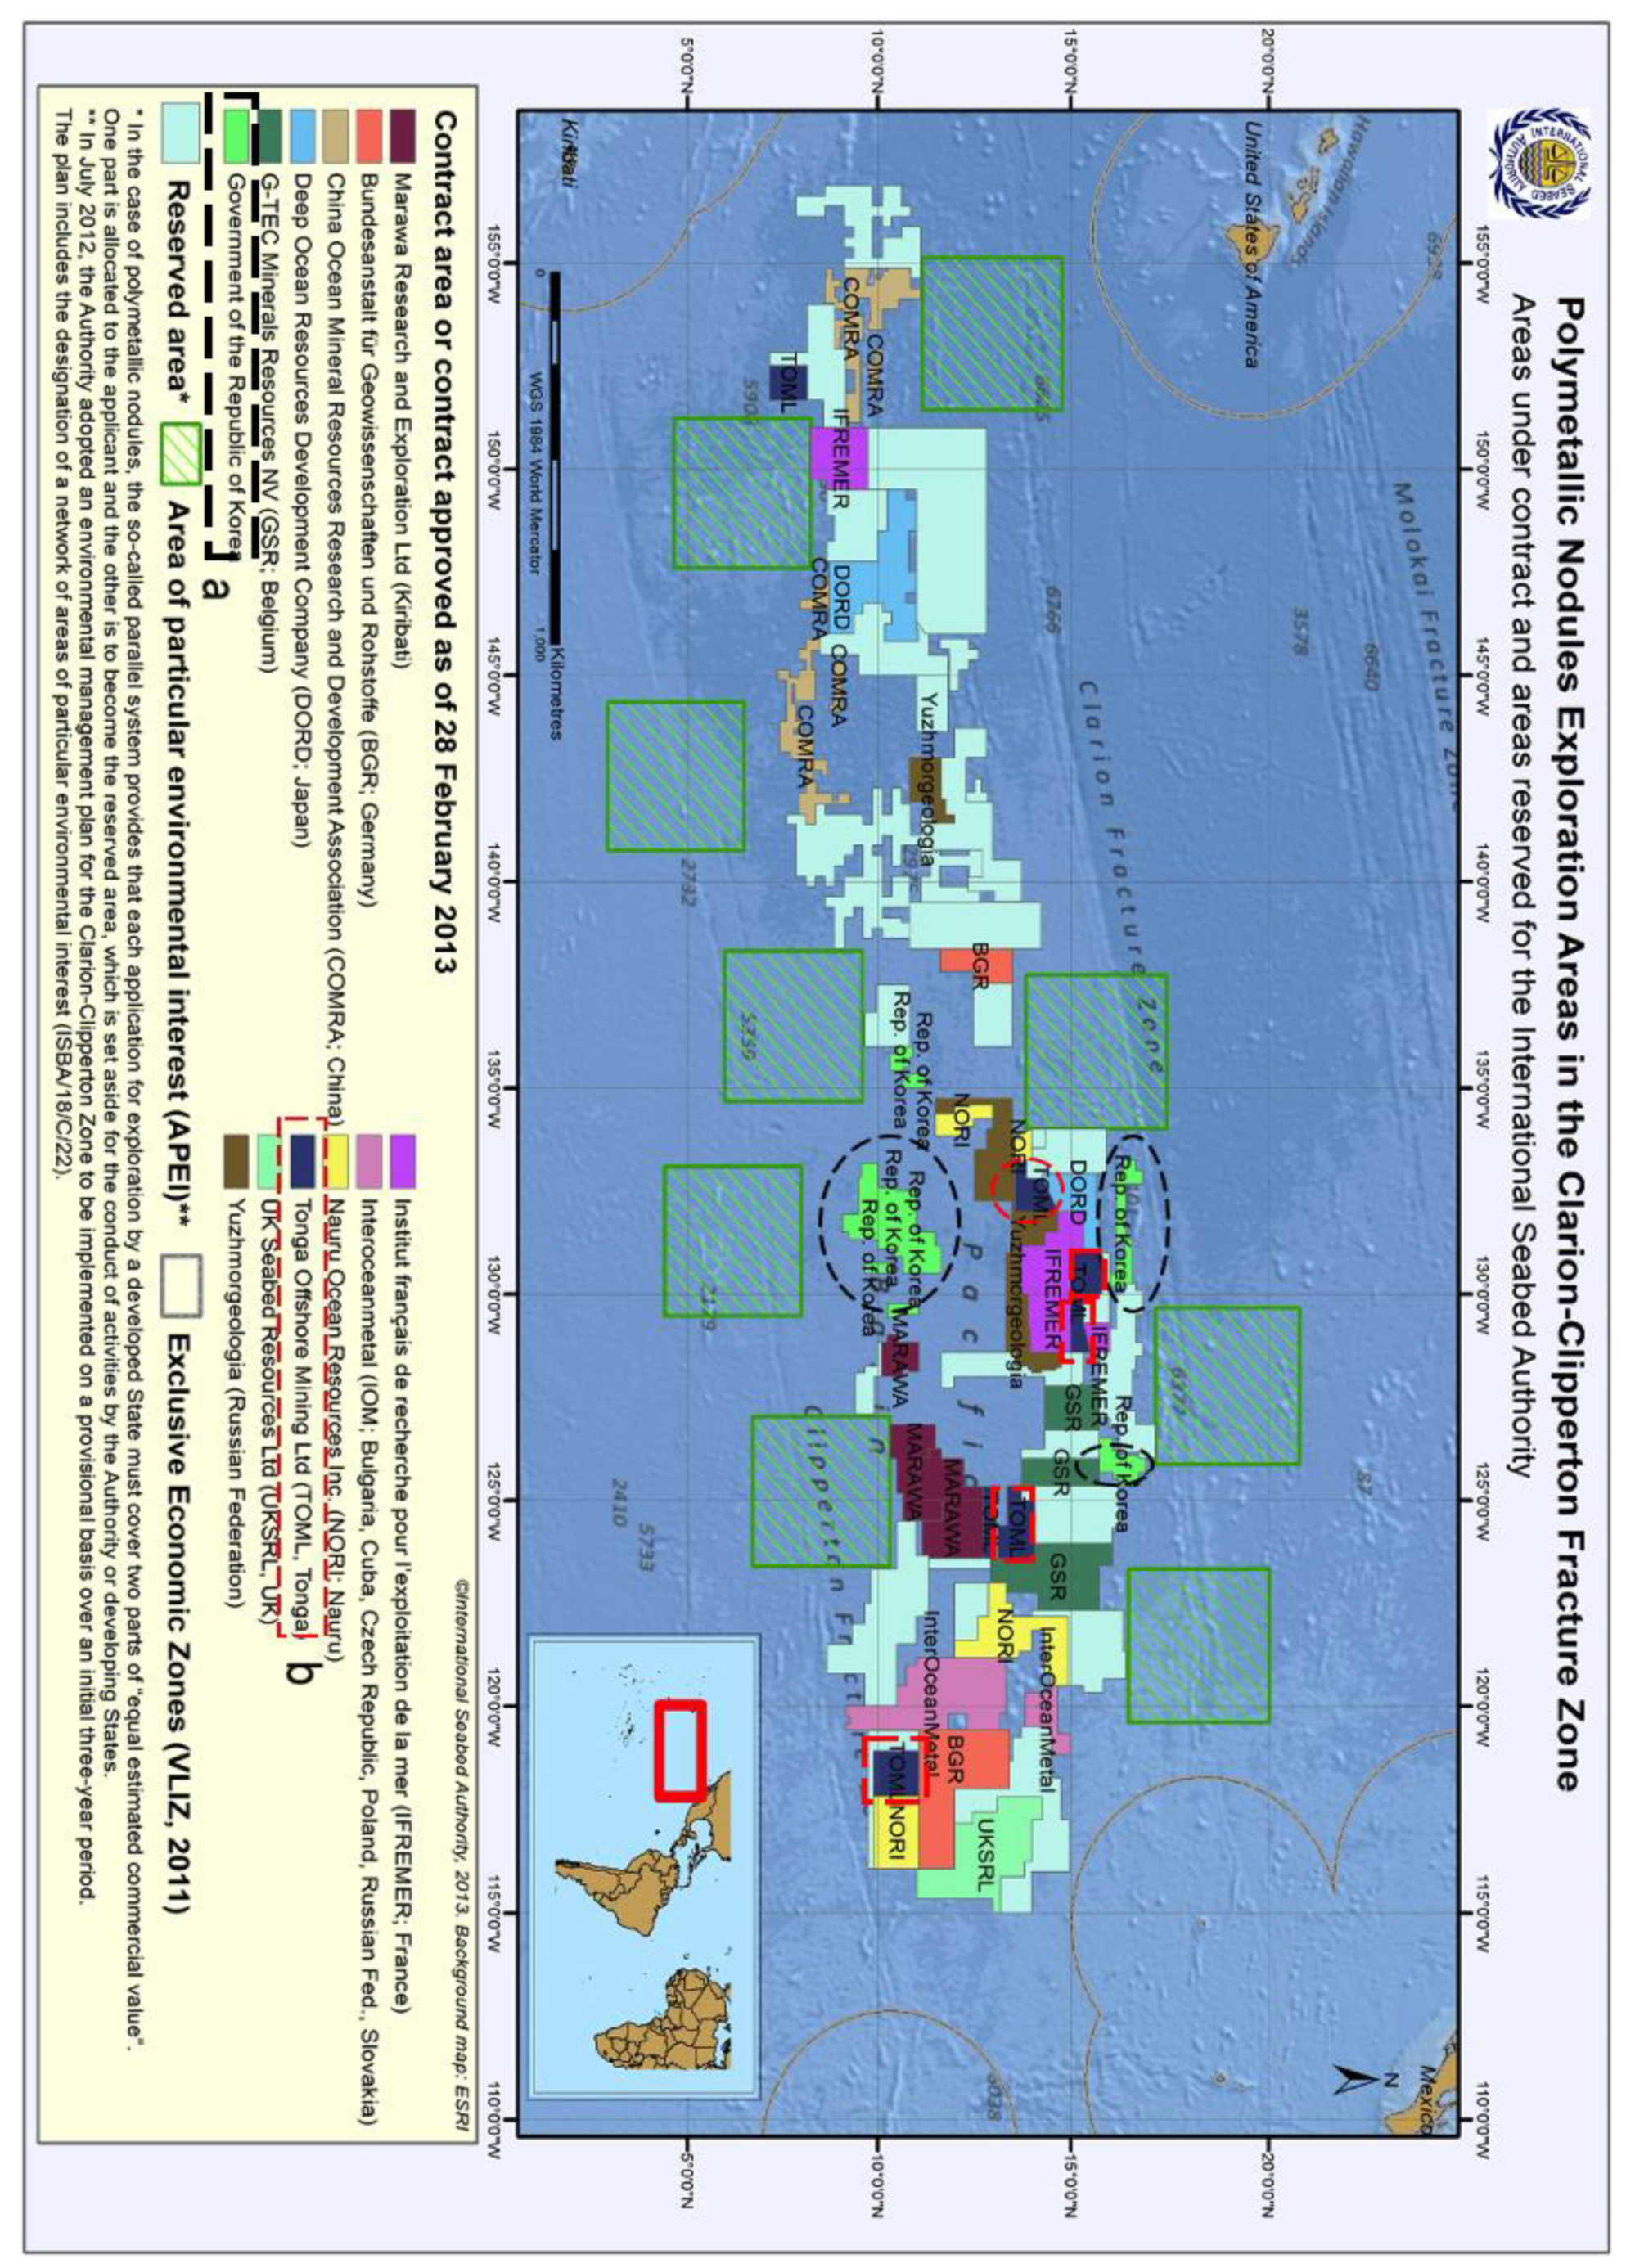
Within the CCZ, a number of localities have exploration permits given by the International Seabed Authority (ISA) to various mining companies or state-owned organisations. One of the most important of our sites exploration permit was contracted during 2011 to the company Tonga Offshore Mining Ltd. (TOML, Maufanga, Tonga), entirely owned by Nautilus Minerals Company (Toronto, Ontario, Canada).
Another exploration licence was granted again on the CCZ to the S.Korean Government during the late 2000s (
Figure 1).
In order to prove the economotechnical importance and the potential not only for Co, Cu and Ni, but also for the REEs of these two licences in the CCZ, we analysed the data from two existing exploration pre-feasibility cases for REEs, i.e., one from Nautilus Minerals (TOML), which is now part of DeepGreen, and the other from the Korean Institute of Ocean Science and Technology or on behalf of the Korean Government (
Figure 1).
2. Materials and Methods
To reach a critical review evaluation of marine resources mining versus land-based ones for REEs, it is necessary to present some basic terms and factors used to assess the economic viability of REE deposits.
Some basic factors in evaluating the REE deposits’ economotechnical feasibility existing in the international bibliography and textbooks are as following: (i) the TREO tonnage; and (ii) the ore grade. In the global markets, the ore grades of the most important on-land REE deposits are usually reported as the rare earth oxide (REO) percentage. Therefore, the REE contents of the seabed deposits presented in this study were also converted to REE oxides to be compared with the ore grades of land-based REE-presented deposits.
It is useful to mention here that the ore grade and the tonnage are not the only critical factors for the economic viability of an REE project. The content of some of high importance for the technology which are usually heavy REEs (HREEs), is of great economic importance [
5]. As a result, those deposits have a higher basket price than about 80% of total deposits even though their ore value is low [
6].
In the international markets, the REE economic value is usually reported and measured as oxides (REO), which have a 1.2 mass factor relative to the elements. Therefore, REE deposits with a specified TREO percentage may vary in the proportion of HREEs, affecting the ore’s value economically.
The ore grade, tonnage, REO’s basket value and REO’s ore value are the most critical considerations in exploring or developing a new REE project, directly determining the success or failure of an REE project to a certain extent.
In the international bibliography and the global markets, the REE projects, concerning their economic viability, often use the term “basket price” meaning the contained value, to assess the products they intend to produce economically. The basket price or contained value is defined by the sum of the individual REOs in the product from an ore deposit, multiplied by the individual REOs price in the international markets. Thus, the basket price is exclusive to considering the ore grade or total recovery rate. Based on this terminology, it should be emphasized that the basket price is a supposed product value, in US$/kg REOs of the product, which is not the contained value of the REEs in the ore (which would be in US$/t).
While the rare earth’ potential in nodules should not be ignored, the relative value is likely to be modest, even if recovery is possible. As such, they are most appropriately considered as a byproduct of any process that aims to extract the other metals hosted by the nodules (Ni, Cu, Co, Mn and Mo).
The basket price of the REEs, which can be recovered from Mn nodules or Co-rich crusts, is very often higher than those of land-based REE deposits due to the higher contents of the most critical REEs such as Nd, Pr and HREEs, especially Dy and Tb. It is now quite clear that in short and medium terms, the supply of main HREEs such as Dy, Nd, Tb, Eu and Y stays behind concerning the market’s needs. This fact creates problems and challenges concerning the broader application of green energy, since those elements are necessary for green technologies. The increasing demand for clean energies technologies applied in the permanent magnets and phosphor industries means that REEs such as Nd, Pr and Dy (for permanent magnets) are critical in the international markets, leading to very high prices. The so-called light REEs, such as La and Ce, have broad use as abrasive constituents and naturally have lower prices than HREEs [
7,
8].
In the ore deposits, the REEs are mixed and concentrated in different minerals, so it is necessary to have a classification for different REEs and REOs.
We used the classification proposed by the Korean Institute of Ocean Science and Technology [
8] for the present study. According to this classification, the REEs are classified into four groups reflecting the HREEs contents of the ore deposit. The first group included REOs such as Sm
2O
3, Er
2O
3, Gd
2O
3, Tb
2O
3 and Y
2O
3 (the so-called SEGTY group from the initials of those elements) of vital importance for the phosphor material manufacturing and naturally have a higher basket price. Those REOs are used for lighting and other optical applications to enable light correction, reduction and energy effectiveness. Some typical applications of such REEs include phosphors for light-emitting diodes, lasers and electronic video displays. The second group includes REOs such as Nd
2O
3, Pr
2O
3 and Dy
2O
3 (the so-called NPD group), which are vital for producing permanent magnets. The third group includes light REOs which includes La
2O
3 and Ce
2O
3 (the so-called LC group), a group having wide applications as abrasive materials manufacturing. This group has a lower basket price compared to the other groups. Furthermore, another group called (other REOs) includes REOs such as Ho
2O
3, Yb
2O
3, Er
2O
3 and Lu
2O
3 having an intermediate basket price. The Tm
2O
3 is not included, since the Tm content in the under examined marine deposits is extremely low and in the most land-based deposits. Another essential term for assessing REEs deposits is the comparative proportionately of the REOs split concentration, which is usually expressed in %.
Based on the above terminology, we can express the basket price or contained value mathematically using the equation [
9]:
For each individual REO, the basket price in (US
$/kg) was expressed as (1)
The relative REO split was expressed as:
The REOs products’ different compositions are mirrored in their basket price. The basket price is defined by the sum of the quantities of each specific REO in the final concentrate product multiplied by the prices of the REOs (see Equation (1)).
With the basket price and the global market price for REOs, we can obtain any deposit’s revenue. It must be stressed that the basket price can give a preliminary suggestion of the existing price situation at a given time, since the ore composition is very different from that of REEs deposits. It should also be emphasized that the REOs extraction process is quite different for each REO. The basket price of on-land deposits varies from 14.7 $/kg of REOs products from the MP mine, with an average of only a 13.5% content in critical REOs (within an average REO content of 8.5% (w/w) in ore) up to 55 $/kg of REOs products from the Round Top mine also in the USA having a proportion of almost 70% of critical REOs within the total of 0.4% in the ore. If we multiply the production quantities with the estimated basket prices, we have the total incomes for each project.
In order to process the calculations and comparisons between deep-sea deposits (Mn nodules, Co-rich crusts and deep-sea sediments) with some well-known on-land REE deposits for REEs, based on Equations (1) and (2) [
10], we used two sets of prices. The first set was the average prices in the international market in 2015, and the second one was the recent average prices in the international market at the end of May 2021 [
11].
We used the average prices in 2015, because the international markets for REEs exhibit extraordinary high-level prices between 2011 and 2014. The reason was that since 2011 there has been a squeeze in supply from China, leading to extremely high prices. This turbulence on the REE international markets ceased slowly between 2012 and 2015 when the prices have decreased to levels closer to long-term averages since 2011.
The two sets of prices used are presented in
Table 2.
3. Results
3.1. Pesentation of the Two Case Studies
3.1.1. Nautilus Minerals (TOML), Being Now Part of DeepGreen
According to an unofficial technical note [
11,
12] from the TOML (a personal communication at the end of 2013), the Mn–Fe nodules from the TOML, which is now part of DeepGreen, lies within the CCZ of the North-East Pacific Ocean. This zone (CCZ) of the North-East Pacific Ocean contains total concentrations of REEs of the order of 800 g/t (0.08%) on a dry basis or 600 g/t on a wet basis. This corresponds to an REO content of about 950 g/t or 0.095% on a dry basis. The relative splitting of the REEs is 73% light or relatively light REEs (Ce, La, Nd and Pr), 7% medium REEs (Sm, Eu and Gd) and 10% HREEs (Tb, Dy, Ho, Er, Tm, Yb and Lu) as well as 8% Yttrium (Y) [
11,
12].
According to the same unofficial technical note, the possibilities of the recovery of the REEs should be considered by using a hydrometallurgical test, since there are no analogies of the REEs recovery from land-based deposits. Since the REEs recovery from nodules will be a byproduct of the extraction of the primary metals (Ni, Cu, Co, Mn and Mo), the method of acid leaching under pressure seems to be the most proper one.
Here, it must be stressed that although the potential of the REEs in these nodules should not be overlooked, their relative value will be relatively low if the hydrometallurgical tests are unsuccessful. However, if they are recovered as byproducts from the primary metals of Mn–Fe nodules oxides ((Ni, Cu, Co, Mn and Mo), their economic value will be much higher.
It should be mentioned that the basket price for any REE which can be recovered from Mn nodules, will be higher compared to land-based REEs deposits, since these nodules contain, on average, higher values of critical REEs such as Nd, Pr and HREEs (Dy) compared to terrestrial REEs or deposits.
The total REEs concentrations in these nodules were reasonable to be about 800 g/t (0.08%) on a dry basis or 600 g/t on a wet basis. Their distributions are listed in
Table 3. In the international market, REEs are often reported as REOs, which have a 1.2 mass factor relative to the elements. For the composition shown in
Table 3, of 788 g/t of REEs, the corresponding REOs were 945 g/t [
12].
3.1.2. The Korean Licenses in the CCZ
The second significant case study concerned Mn–Fe nodules and deep-sea sediments within the CCZ by the government of South Korean. This case also offers a significant opportunity to evaluate and compare the well explored and under-exploited terrestrial REEs deposits. Here, it should be stressed that certain deep-sea clay sediments, especially in the Pacific Ocean, seem to be an important source of REEs [
13,
14,
15]. According to Pak et al. [
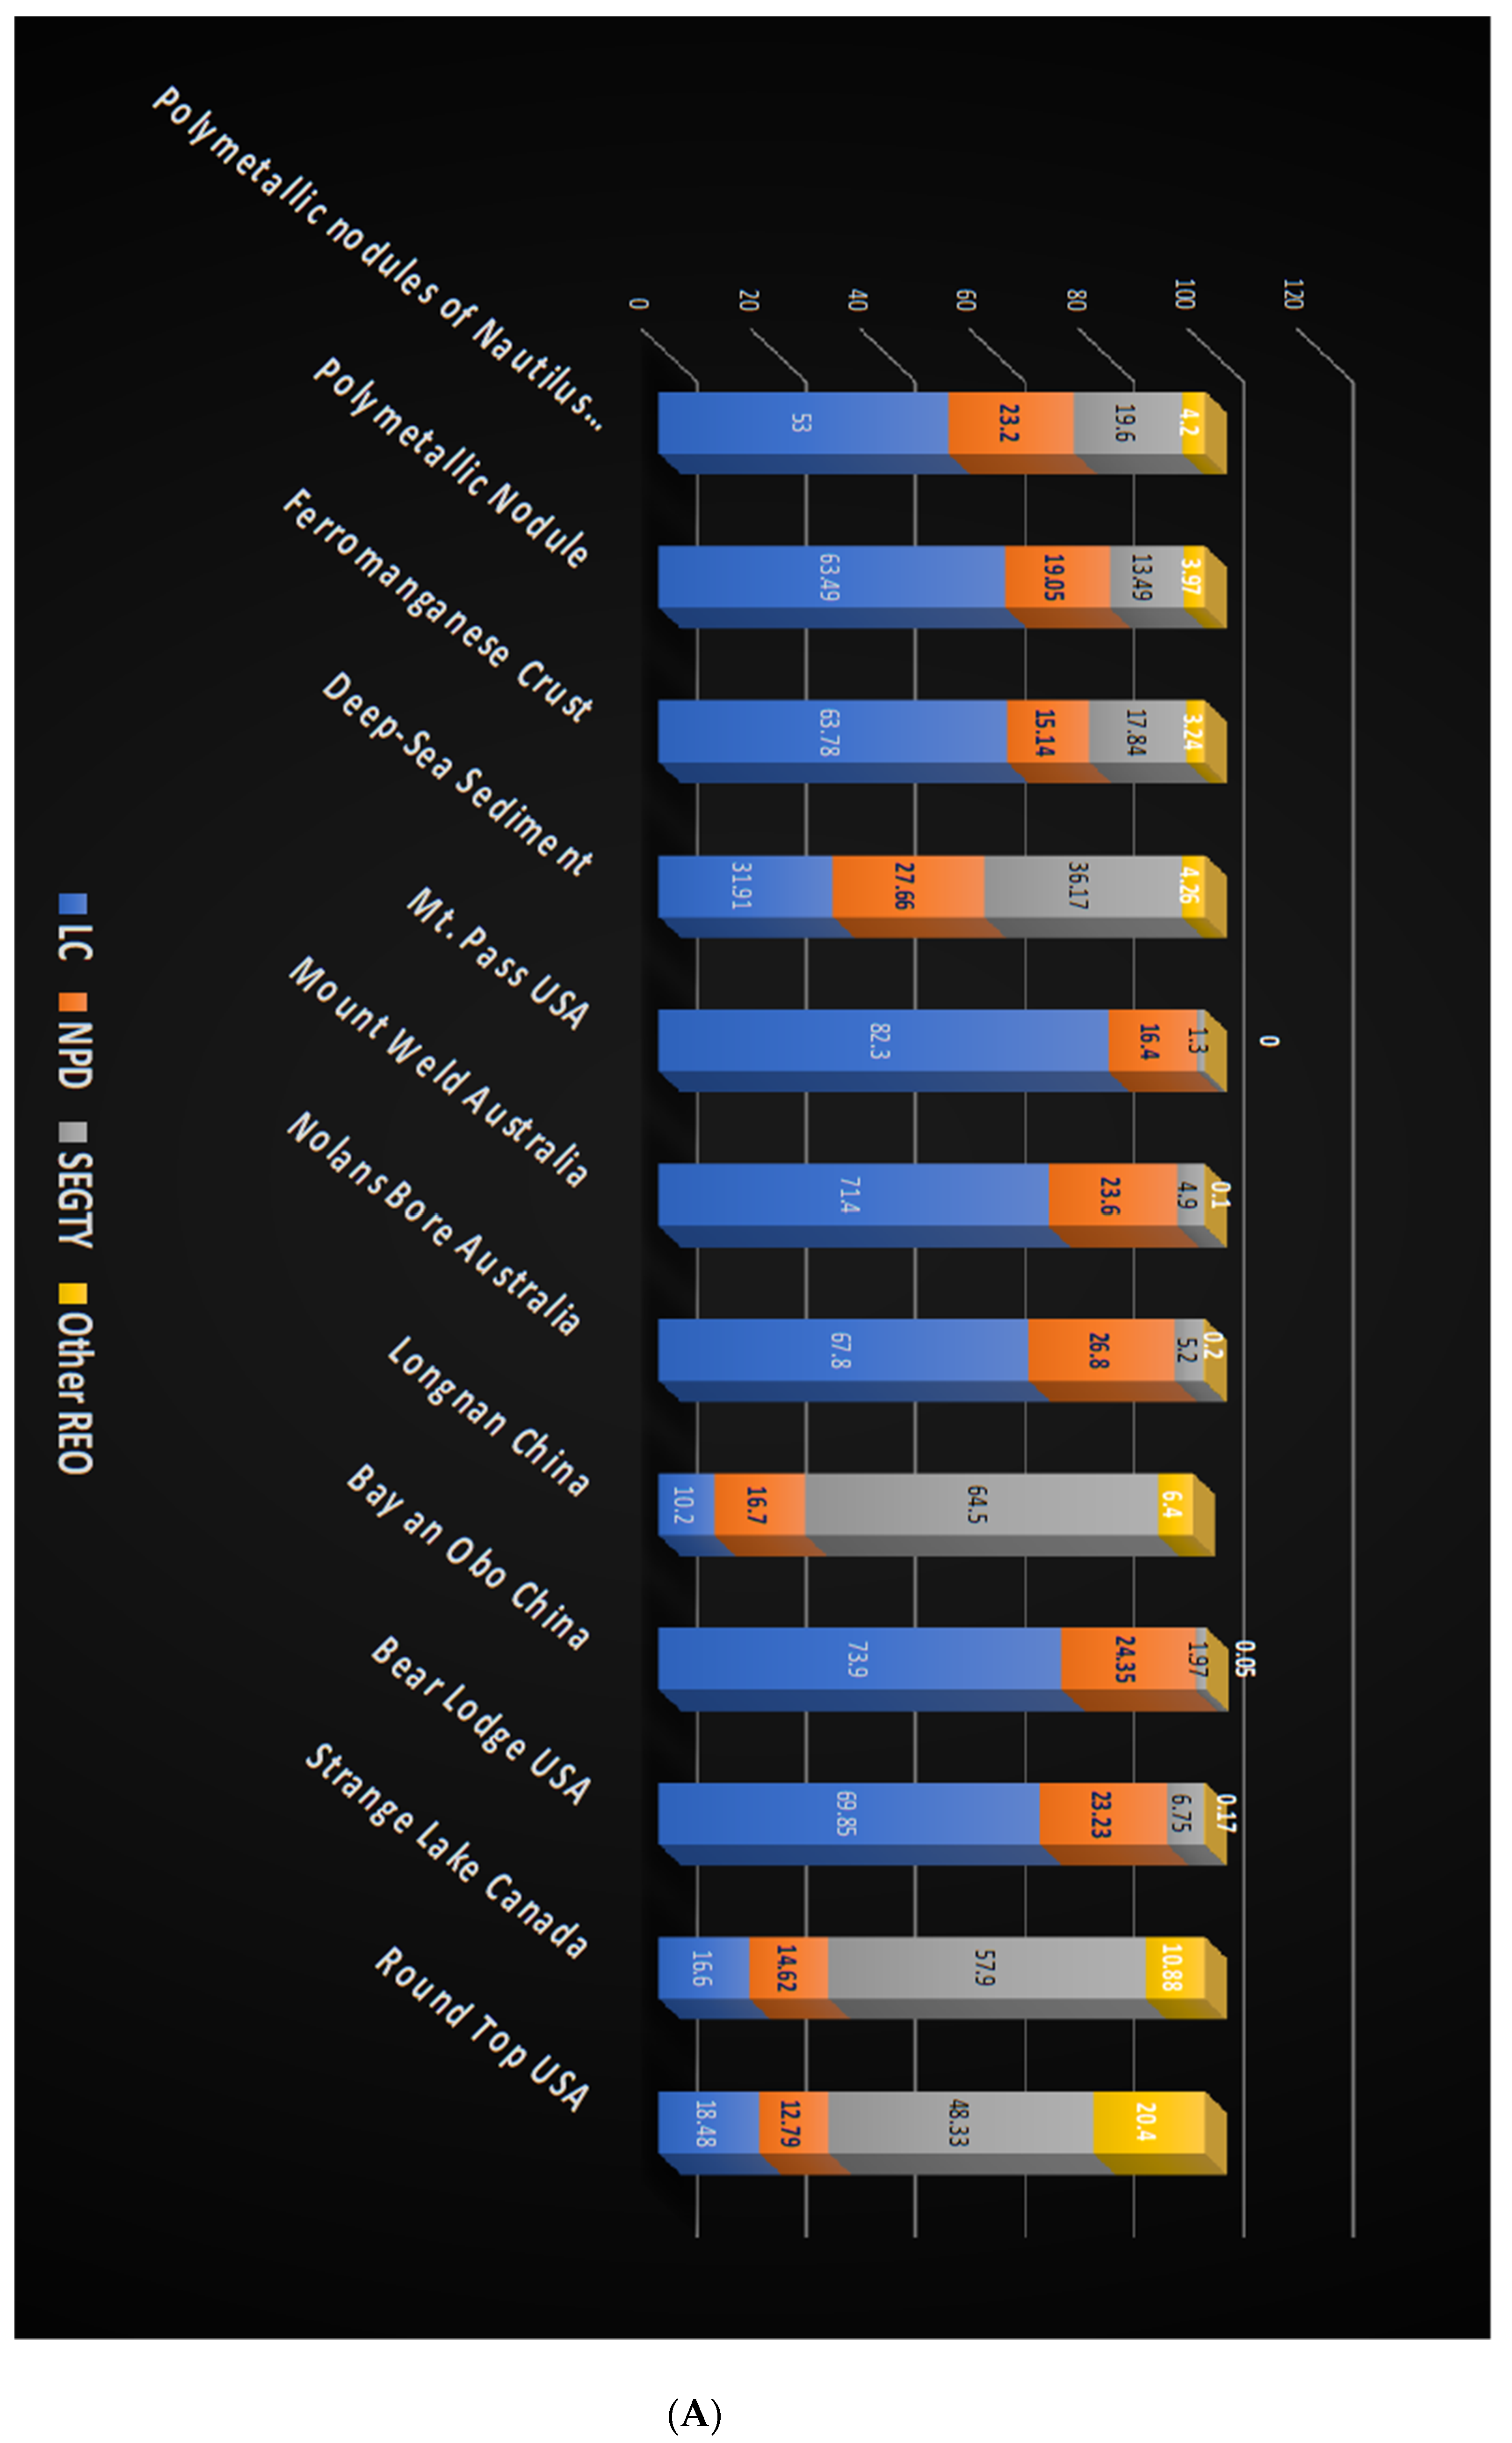
7] from the South Korean Oceanographic Institute, the total REOs content within Mn–Fe polymetallic nodules oxides varied between 0.037% and 0.302%, with an average value of 0.13% (
Table 3). According to the same authors, the distributions of the different REEs within the oxide nodules were as following: 63.6% LC, 19.9% NPD and 16.5% SEGTY. Pak et al. [
7] also reported that Co-rich Fe–Mn crusts contained an average of the total REO of the order of 0.185% with the distribution of REEs oxides as follows: 66.27% LC, 15.63% NPD and18.1% SEGTY (see previous pages for the terms LC, SEGTY and NPD explanations).
In the cases mentioned above, deep-sea sediments (mainly red clay sediments) are within the S. Korean licences in CCZ and promising. They had low total REO contents including 37.33% SEGTY, 29.21% NPD and 33.45% LC. This means that these sentiments were significantly enriched in critical REEs such as Sm, Eu, Gd, Tb, Nd and Pr.
From
Table 4 and Equation (2), the average relative REO distribution (%) were calculated and are shown in
Table 5, together with the median REO content of manganese nodules from the TOML for a comparison. The values concerning the deep-sea sediments from the Korean licences in the CCZ were very close to the values presented by Pac et al. [
7].
The next step was to calculate and afterwards compare the basket price or the contained value of deep-sea deposits mentioned above with some well-known and underexploited REE deposits on land, based on Equation (1) and using the REO prices listed in
Table 2. The results of these calculations are given in
Table 6, and the REEs grouping, i.e., LC, NPD, SEGTY and others described on page 5 (see
Table 6), was used. This is very useful, since it reveals the HREEs contents of the ore deposit.
3.1.3. Deep-Sea Sediments in the Korean Licenses in the CCZ
The study of this particular category of deep-sea sediments (mainly red clay sediments) revealed that, in general, they contain low concentrations of REEs having a range of REOs between 0.015% and 0.115% with an average of about 0.049%. This value is almost 1/3, if we compare the REOs contents of the Mn–Fe polymetallic nodules lying within the Korean licences in the CCZ [
7]. The importance of the sentiments lies in the fact that they show relatively high contents of some very critical REOs such as Sm, Eu, Gd and Y oxides and high Nd, Pr and Dy oxides (
Figure 2A). Therefore, as we can see from
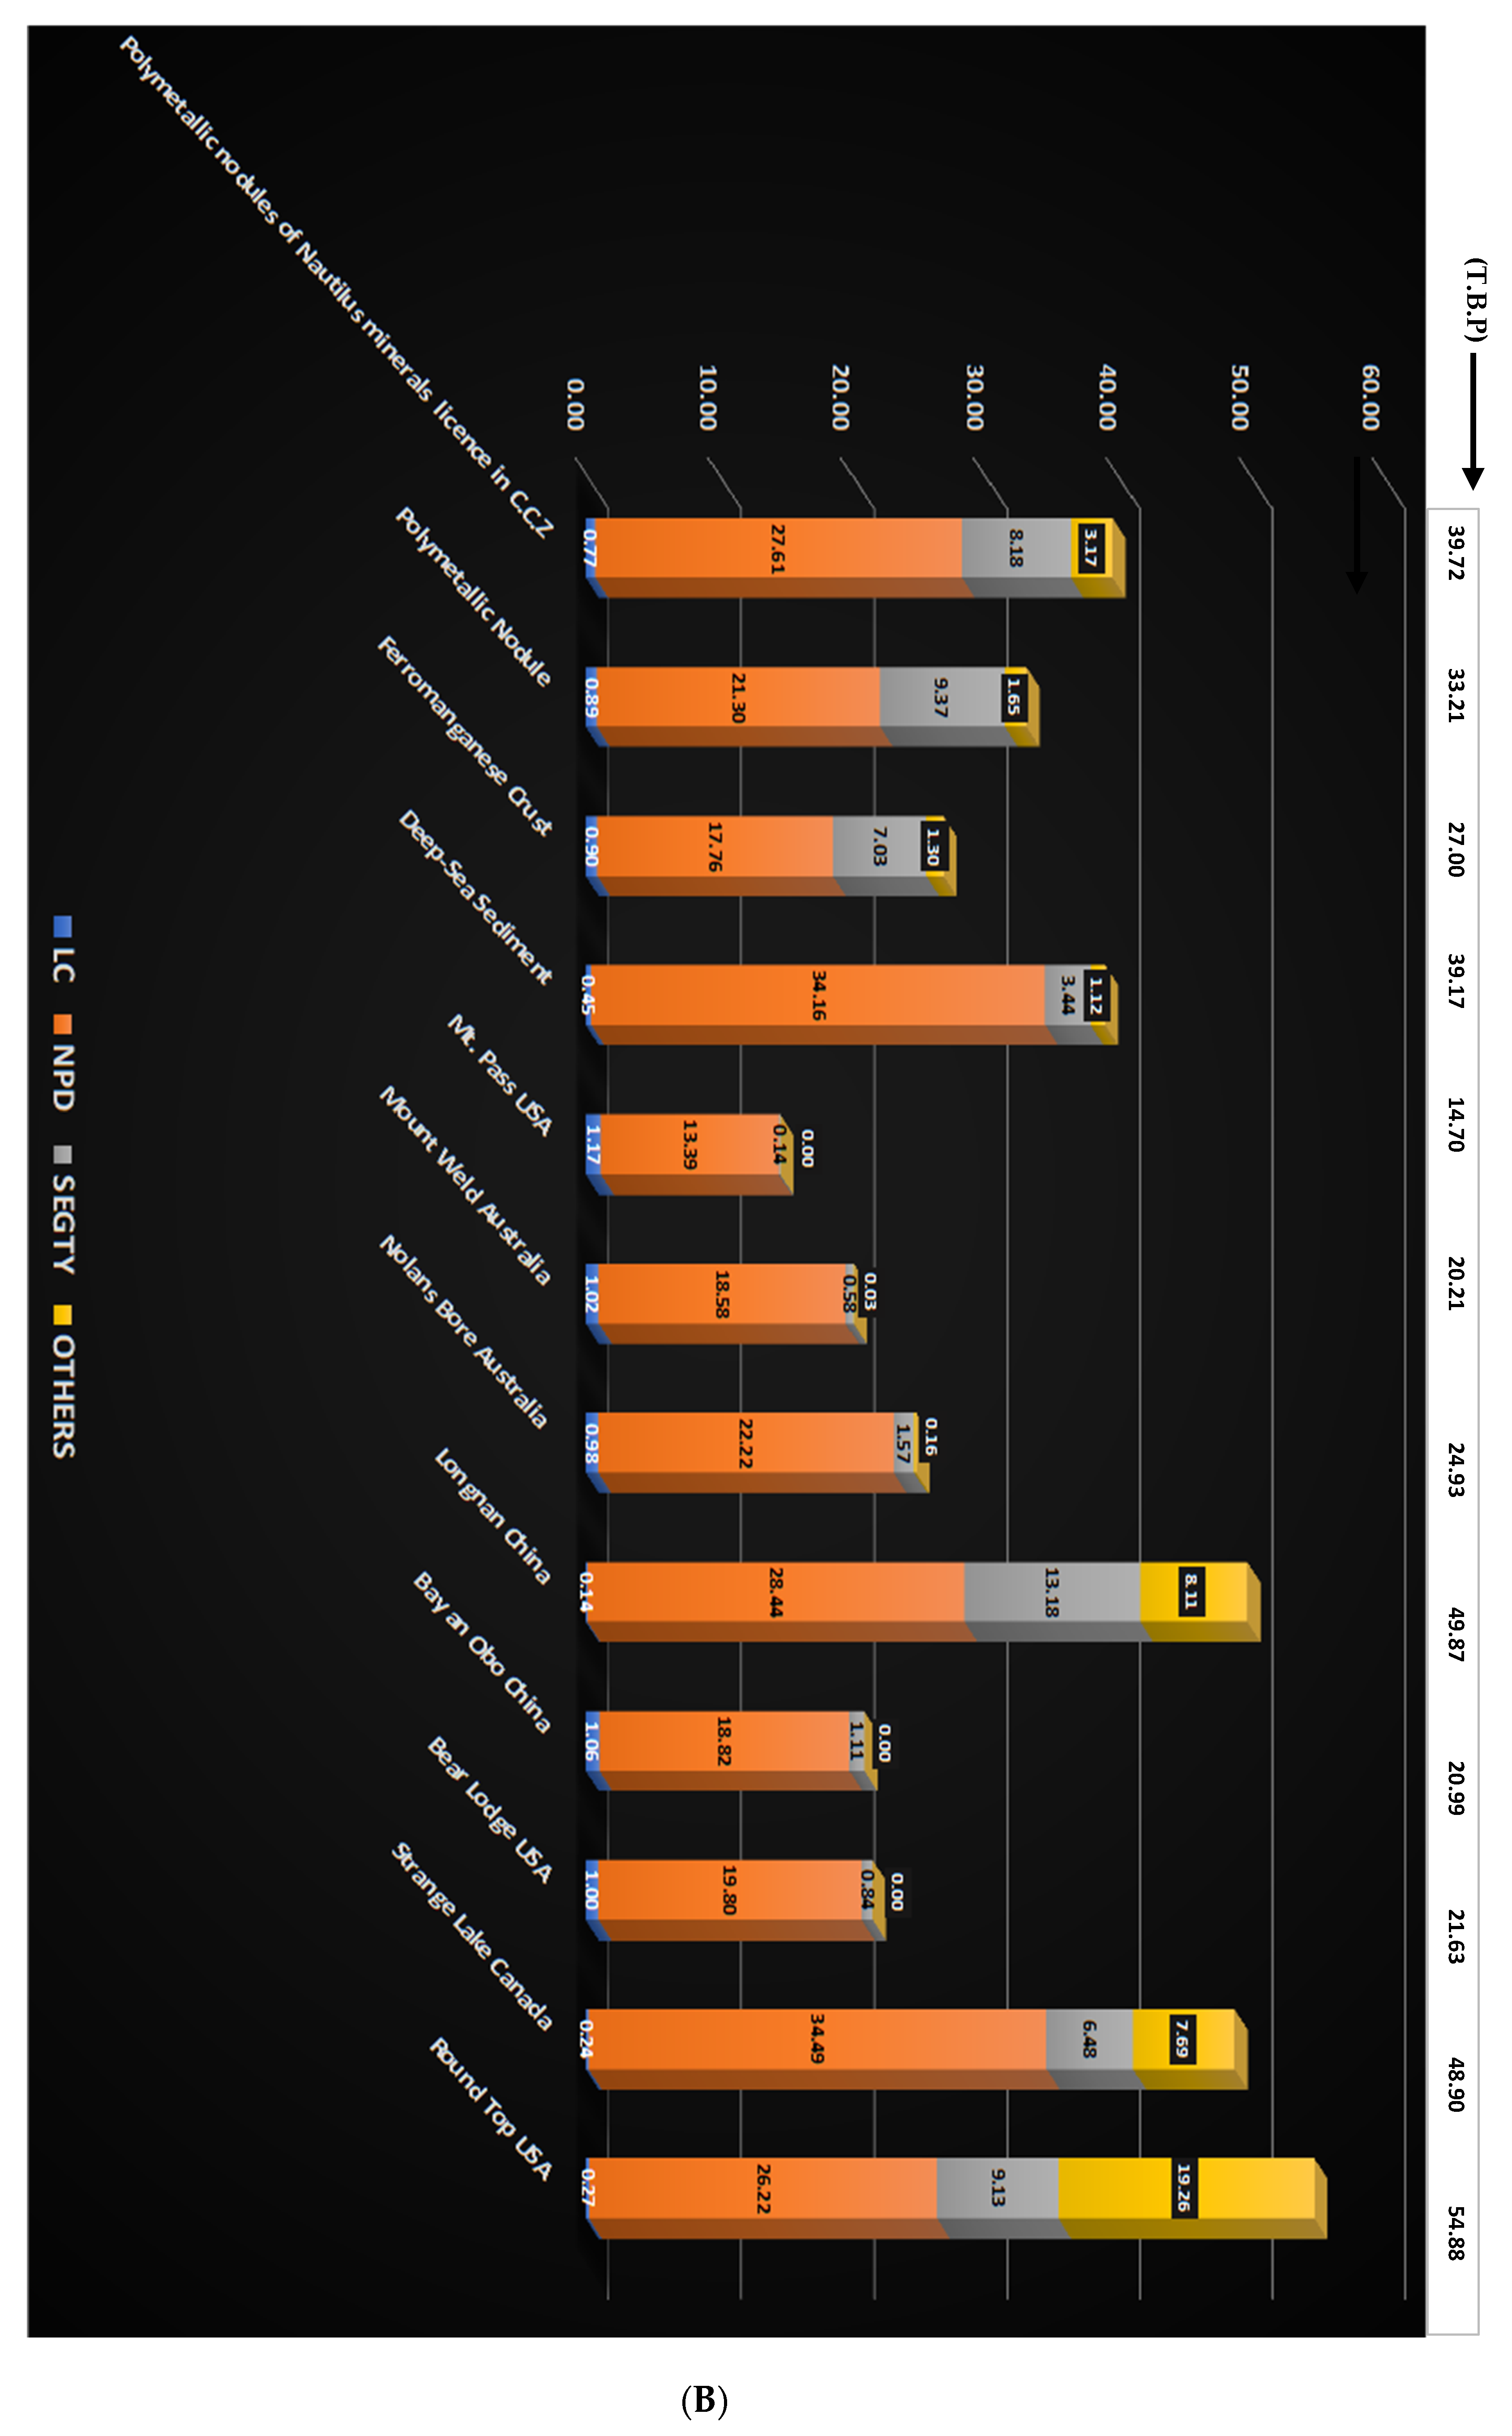
Table 6, the calculated SEGTY and NPD values were 36.17 and 27.66, respectively, which means that although these sediments had a lower average TREO content, at the same time, they showed higher total basket prices (the total contained value), in the prices of REOs in May 2021 compared to Mn–Fe polymetallic nodules and Co-rich crusts within the Korean licenses in the CCZ, except polymetallic nodules of Nautilus (Tonga offshore mining) (
Table 6,
Figure 2B). Knowing that the potential of such deep-sea muds is vast, those formations could indeed be a very important source for REEs in the future.
4. Discussion and Conclusions
Based on the rare earth distributions in the CCZ nodules, the licences of both the studied areas were relatively high in the more critical Nd, Pr, Sm and HREEs (e.g., Dy, Gd, Y and Tb) (
Figure 2A) This is reflected in the current basket prices of the contained REEs, which lies between 39.72 and 27.67 US
$/kg of REOs. Unsurprisingly, this is significantly higher than five out of eight REEs on land under exploited deposits we used for comparisons. From
Table 6, it is evident that only the well-known on-land REE deposits from Lognan in the southeast of Ganzhou, Jiangxi, China, Strange Lake located on the border between Quebec and Labrador(Canada) and Round Top in Hudspeth County, West Texas, USA, exhibit higher basket prices than the studied deep-sea deposits.
Table 6 also shows that the oxides of the rare earth in the polymetallic nodules from Nautilus Minerals (TOML) licences exhibit higher total basket prices than the corresponding polymetallic nodules, Fe–Mn crusts and deep-sea sediments of the Korean licences.
In REEO prices in 2021, the highest (in %) components La
2O
3 and Ce
2O
3 (LC) had the lowest basket brace (0.45–0.92 USD/kg), whereas Nd
2O
3, Pr
2O
3 and Dy
2O
3 (NPD) are the most expensive (18.23 to 34.16 USD/kg;
Table 6). On the contrary, the Sm
2O
3, Eu
2O
3, Gd
2O
3, Tb
2O
3 and Y
2O
3 (SEGTY) group had a considerable high basket price, meaning it had a higher overall value (9.3 USD/kg) than LC, despite its lower abundance (
Table 6;
Figure 2A,B).
From the economic point of view, the virtual content of the critical HREEs is higher in deep seabed deposits than in the most extensive land-based REE mines, for example, the largest REE mine, Obo (China) and the second-largest, MP (U.S.A.) [
7,
17]. Both land-based deposits mentioned above contain less than 1% HREEs (a percentage of the total REE content). In contrast, the CCZ nodules have a relative content of 26% HREEs, and Pacific crusts have an average of more than 18% HREEs [
12].
For example, smaller land-based REE deposits, the ion-adsorption clays in Southern China, have similar HREE concentrations in marine deposits.
Linking CCZ nodules and Pacific prime crusts with these two largest existing land-based REE mines, we concluded that land-based deposits are generally higher in grade but considerably lower in the ore tonnage. However, the contained REEs in the crusts and nodules are comparable and evidently better than those in Obo and MP confirming Hein’s findings in 2012 [
17].
A major advantage of the studied deep-sea deposits is that the SEGTY group (Sm
2O
3, Eu
2O
3, Gd
2O
3, Tb
2O
3 and Y
2O
3) appears to have higher basket prices than six out of the eight studied land-based under-exploited REE deposits (
Table 6; A implying the huge potential of these deep-sea deposits for a future major source of REEs.
5. Concluding Remarks
Our data and calculated evaluation proved that the total basket prices (total contained value) of REOs from the studied two licences in the CCZ were considerably higher than many well-known terrestial REE deposits being under exploitation. These data confirmed the findings of Hein et al. that these types of deep-ocean mineral deposits can be an economically acceptable source of critical metals, especially REEs for high- and green-technology applications, compared with well-known terrestrial REE deposits, for example, Obo in China and MP in the U.S.
Compared with terrestrial REE deposits, these deep-sea mineral deposits were low-grade mineral deposits with a much higher tonnage. In addition, our calculations proved that the relative quantities of the more valuable rare earth components, i.e., NPD and SEGTY, were higher in the nodules and Fe–Mn Co-rich crusts than terrestrial ores. This resulted in a nominal product basket price considerably higher than product mixes from terrestrial deposits. However, it should be stressed that there is no concrete know-how of possible recovery profiles.
The significant advantages in the technology of deep-sea mining and metallurgical treatment of nodules and crusts are in combination with the fact that significant terrestial REE deposits are exhausted due to heavy exploitation, making the whole story economically attractive and promising.
It is essential to mention here that this future economic potential is even more significant if we take into account that the existing fields of Mn nodules and Co-rich crusts with high amounts of REEs in the other areas of the Pacific Ocean (Cook Islands, Peru basin), as well as in the Atlantic and Indian Oceans [
18], have not yet been passed from technical and economic assessment to have a clear view of their economic value in base metals (Ni, Co and Cu) and REEs.
We must clarify that while most terrestrial mines produce REEs as the primary ore, REEs in Fe –Mn nodules and Co-rich crust deposits will be extracted as a byproduct of the principal metals Mn, Ni Cu and Co. Therefore, the costs of mining, transportation, initial ore crunching and tailings dumping are associated with the costs of extracting the four primary target metals. This fact will enhance the economic feasibility of extracting significant commodities.
One significant issue is also that REEs are not part of the crystal lattice of host minerals within deep-sea mineral deposits. This fact makes mining and metallurgical treatment economically favourable. In addition, it means there is no requirement to crush or pulverise REE-bearing host minerals during ore processing, and the very low Th and U concentrations do not pose environmental risks as happens in many well-known land-based REE deposits.
Spiekermann [
19] verified that the metallurgical processing for the extraction of Ni, Cu, Co and Mn (and water) increases the value of HREEs in the manganese nodule byproduct material to
$380/tonne in metals prices in 2012. According to the same author, this is a desirable value, as it is 165% of MP (approximately
$230) and 57% of Kutessay II (
$664) [
13].
The environmental factor is a significant and complicated part of the story. There is no doubt that any mining activity on land or in the sea will have environmental impacts of different kinds. It is also true that the marine environment has been studied less than the terrestrial environment, and it seems to be more fragile compared to the land environments. Therefore, systematic studies and stringent environmental regulations should be applied for the mining companies, which will undertake deep-sea mining. Deep-sea mining certainly will have an impact on the deep-sea environment. The nature and extent of the possible environmental effects remain unknown in many aspects, which is necessary for a cautious approach to the deep sea’s development. However, deep-sea mining might also have positive environmental impacts. For example, according to the research published recently by Canada’s DeepGreen Metals [
20], their project to produce cobalt and other battery metals from mining Co-rich crusts and nodules “generates up to 70% less direct CO
2 emissions, 94% less stored carbon risk, as well as 90% fewer sulphur oxides (SO
x) and nitrogen oxides (NO
x) emissions—air pollution from maritime transportation” [
20].
The ISA has set up some environmental rules and regulations concerning deep-sea mining, which is compulsory for mining companies working in international seas, beyond national jurisdiction.
We also have to clarify that any environmental impact is applicable not only for REEs, but primarily for the main products of manganese nodules and Fe–Mn crusts rich in valuable battery metals, i.e., Ni, Co and Cu.


