Proceeding Paper

Investigating Mesh Sensitivity in Linear and Non-Linear Buckling Analysis of Composite Cylindrical Shells †

by
Shahmeer Khalid Chatha
*,
Muhammad Sher Ali
,
Muhammad Noman Butt
and
Muhammad Usman
Department of Mechanical Engineering, University of Engineering and Technology, GT Road, Lahore 54890, Pakistan
*
Author to whom correspondence should be addressed.
Presented at the 3rd International Conference on Modern Technologies in Mechanical & Materials Engineering (MTME2025), Topi, Pakistan, 16–17 April 2025.
Mater. Proc. 2025, 23(1), 8; https://doi.org/10.3390/materproc2025023008
Published: 31 July 2025

Abstract

This study investigates mesh sensitivity in the buckling analysis of composite cylindrical shells using the finite element methods. Two Carbon Fiber-Reinforced Plastic (CFRP) models with distinct layups were subjected to linear (Eigenvalue) and non-linear (Riks) analyses under axial compression. Mesh sizes ranging from 50 mm to 2.5 mm were tested using Abaqus. The results revealed that the non-linear analysis is more mesh-sensitive and computationally demanding. Model-1 showed better convergence in non-linear analysis, with <1% error, while Model-2 favored linear analysis, with <0.5% error at finer meshes. The comparison of models results with the experimental data highlights the importance of an empirical correction factor. These findings provide practical guidelines for mesh selection in composite shell analysis.

1. Introduction

Buckling of shells refers to structural unsteadiness under specific loading conditions. When subjected to certain loads and boundary conditions, a shell deforms catastrophically [1]. Buckling occurs in a shell when a load exceeds a certain limit. The load at which the shell buckles is called the critical buckling load or the bifurcation load, as the behavior of the shell changes drastically at this point. Equilibrium shifts from stable to unstable at bifurcation. This buckling due to load can result in the collapsing of the shell. The magnitude of load at which the shell starts to buckle is dependent on many factors. These factors are the geometry of the given shell, the material used in the given shell for the analysis, and the properties of those materials. They also depend on the loading method used in analysis. The concept of shell buckling is relevant in mechanical, aerospace, and civil engineering applications [2]. In the early 20th century, thin metal sheets began being used in load-bearing aircraft and rocket-components [3,4]. At that time, engineers looked into the problem of elastic buckling. They analyzed spherical shells when those shells were subjected to uniform external pressure and the cylindrical shells were subjected to uniform axial compression [1]. Thin shells are efficient structures with broad engineering applications. When thin shells are implemented to a compression load, their efficiency is overcome by the phenomenon of buckling. Predicting the onset and extent of buckling is a major engineering concern [5]. Composites offer enhanced mechanical and chemical properties compared to other materials. For large-scale engineering problems, the design and analysis of composite structures are investigated. Anisotropic composite materials provide greater design freedom than other materials. On the other hand, more design parameters complicate the structural analysis [6]. Structure’s buckling may involve global or local deflection, potentially leading to collapse. Therefore, avoiding buckling failure is a matter of concern for engineers [7]. Composites are known for their high strength-to-weight ratio [8]. Determining buckling conditions for the composite laminates is a major research challenge. The finite element method is widely used for the structural analysis of composite laminated structures [9]. In finite element analysis, mesh density is critical for accuracy. Mesh density refers to the number of elements in the model. Finite element analysis deals with nodes, and the analytical results are only present in the nodes [10,11]. Mesh size defines the accuracy of the obtained results and the computing time a system will take to give the required results. In finite element analysis, models with fine mesh, meaning a small element size, are capable of providing better results, but the computing time of such models will be relatively higher. On the other hand, if the model is provided with a coarse mesh, the computing time for it will be relatively low, but the results obtained will not be as accurate as the results obtained from previous conditions [12]. A higher mesh number is implemented when the aim is to obtain more accurate results. Therefore, selecting an optimal mesh density is crucial for accurate FEA results [13].
The study by Wang et al. [14] investigated the buckling behavior of combined cylindrical shells made up of CFRP and aluminum alloy under the conditions of external hydrostatic pressure while focusing on the effects of various factors, such as the thickness-diameter ratio and geometric imperfections, on the buckling characteristics. Experimental tests and numerical analyses were conducted, showing that the buckling load and final collapsed mode of the cylindrical shells were consistent between the numerical and experimental results.
The research work by Choudhary et al. [15] laid the foundation of a novel optimization method that predicted the optimal fiber orientation in composite cylindrical shells, and the study resulted in a significant increase of 94% in buckling strength in comparison to traditionally used laminate orientations.
Taraghi et al. [16] found that various reinforcement layouts using CFRP composites effectively enhanced the buckling stability of cylindrical shells subjected to uniform external pressure, as demonstrated through non-linear stability analyses with the help of the Abaqus finite element package.
This current study describes a mesh sensitivity study of two different CFRP cylindrical shells, conducted to estimate their buckling loads using Eigenvalue analysis (linear analysis) and the Riks method (non-linear analysis). The numerical results are validated by comparing them with experimental and analytical results. This research work contributes to the literature by providing a novel comparative investigation of the linear and non-linear analysis methods across a wide range of mesh densities. Furthermore, the buckling response of two distinct CFRP lay-up patterns, one symmetric and the other asymmetric, under varying mesh conditions is examined in complete detail. The observed divergence in convergence trends emphasized the role of lay-up architecture in simulation stability, which has been less explored in previous research works.

2. Methodology

2.1. Model Description

The model involves two types of CFRP cylindrical shells with lay-up orientations of [45°/−45°] s and [0°/45°/−45°/0°], subjected to a load distributed along one of the edges of both shells. In the context of this study, the former model will be referred to as Model-1, and the latter will be referred to as Model-2. The material properties and the dimensions of the shell are presented in Table 1. All of this data has been borrowed from the experimental study conducted by Bisagni [17].

2.2. Modeling

The geometry described above was modeled as a three-dimensional deformable cylindrical shell in Abaqus with the method of extrusion. A partition was created along the curved surface to aid in the process of meshing. An elastic material was created with the type set to lamina and with the material properties described in Table 1. Two different sections were created for the two CFRP laminates described in Table 1 using the material created. The lay-up orientations were set up as described in the problem description by individually adding layers in the section.

2.3. Meshing

Uniform meshing was conducted on the shells with the mesh type described by element size. Element sizes of 50 mm, 40 mm, 30 mm, 25 mm, 20 mm, 10 mm, 5 mm, and 2.5 mm were used to study the sensitivity of the mesh. The element type assigned to the elements was S4R. These elements are quadrilateral in shape and have linear shape functions, meaning that they have four nodes each. They use the method of reduced integration, which is a technique used to simplify matrices to increase computational efficiency when conducting a finite element analysis. Moreover, these elements use hourglass control, which is a method whereby additional nodes are placed strategically across the shell to prevent any hourglass-shaped distortions which might appear as a consequence of using reduced integration [18]. The selected mesh sizes offer a logarithmic progression in refinement, designed to systematically assess convergence trends. The finest mesh (2.5 mm) was selected to achieve the highest feasibility accuracy within our computational resources, while the coarsest mesh (50 mm) provides insight into the degradation of accuracy with reduced mesh density.

2.4. Setting up Steps

The parts modeled to represent both the shells were used to create assemblies in their respective models, named Model-1 and Model-2. For linear analysis, a step of the category Linear Perturbation was created with the type set to Buckle. Lanczos Eigensolver was used, with the number of Eigenvalues requested set to one. For non-linear analysis, the Static Riks-type set was used from the General category. Non-linear geometry was turned on, and the maximum number of increments was set to 100. The initial and minimum arc length increments were set according to the mesh sizes.

2.5. Application of Loads and Boundary Conditions

Displacement/Rotation boundary conditions were applied along both edges of the shells. On the stationary side, all types of translational and rotational movements were constrained, while on the left side, only translation along the axis of the cylinder was permitted. A distributed load of magnitude 1 N was applied along the entire left edge by using the shell edge load type and using the value obtained by dividing the load by the circumference of the shells.

2.6. Analysis

Two jobs were created, named Job-1 and Job-2, for Model-1 and Model-2, respectively. The jobs were submitted for analysis to generate output databases. The Eigenvalues for different mesh sizes of both models for linear analysis were obtained from the output databases quite easily, as they are displayed on the viewport by default. However, to obtain the Eigenvalues for non-linear analyses, XY Data was created for the Load Proportionality Factor (LPF), and the maximum value of LPF was obtained. All of the data gathered was exported to Excel to create graphs for comparison.

3. Results

3.1. Linear Results

The linear analysis results obtained for the eight different mesh sizes applied to both models are discussed in the following sections. The first Eigenvalues of the critical buckling load obtained for all different models are presented in Table 2.
Using the data presented in Table 2, the following plot was obtained, which showcases how mesh size affects the buckling load of Model-1 and Model-2 (Figure 1).
The effect of mesh size was more prominent for Model-2, whereas Model-1 did not show much change in buckling load. A net change of only 23 kN was observed for Model-1 across different mesh sizes, but Model-2 displayed a much higher change value, 120 kN. However, it must be considered that there was also a huge difference (52 kN) between the buckling load at 50 mm and 40 mm mesh size for Model-2.

3.1.1. Model-1 (Linear Analysis)

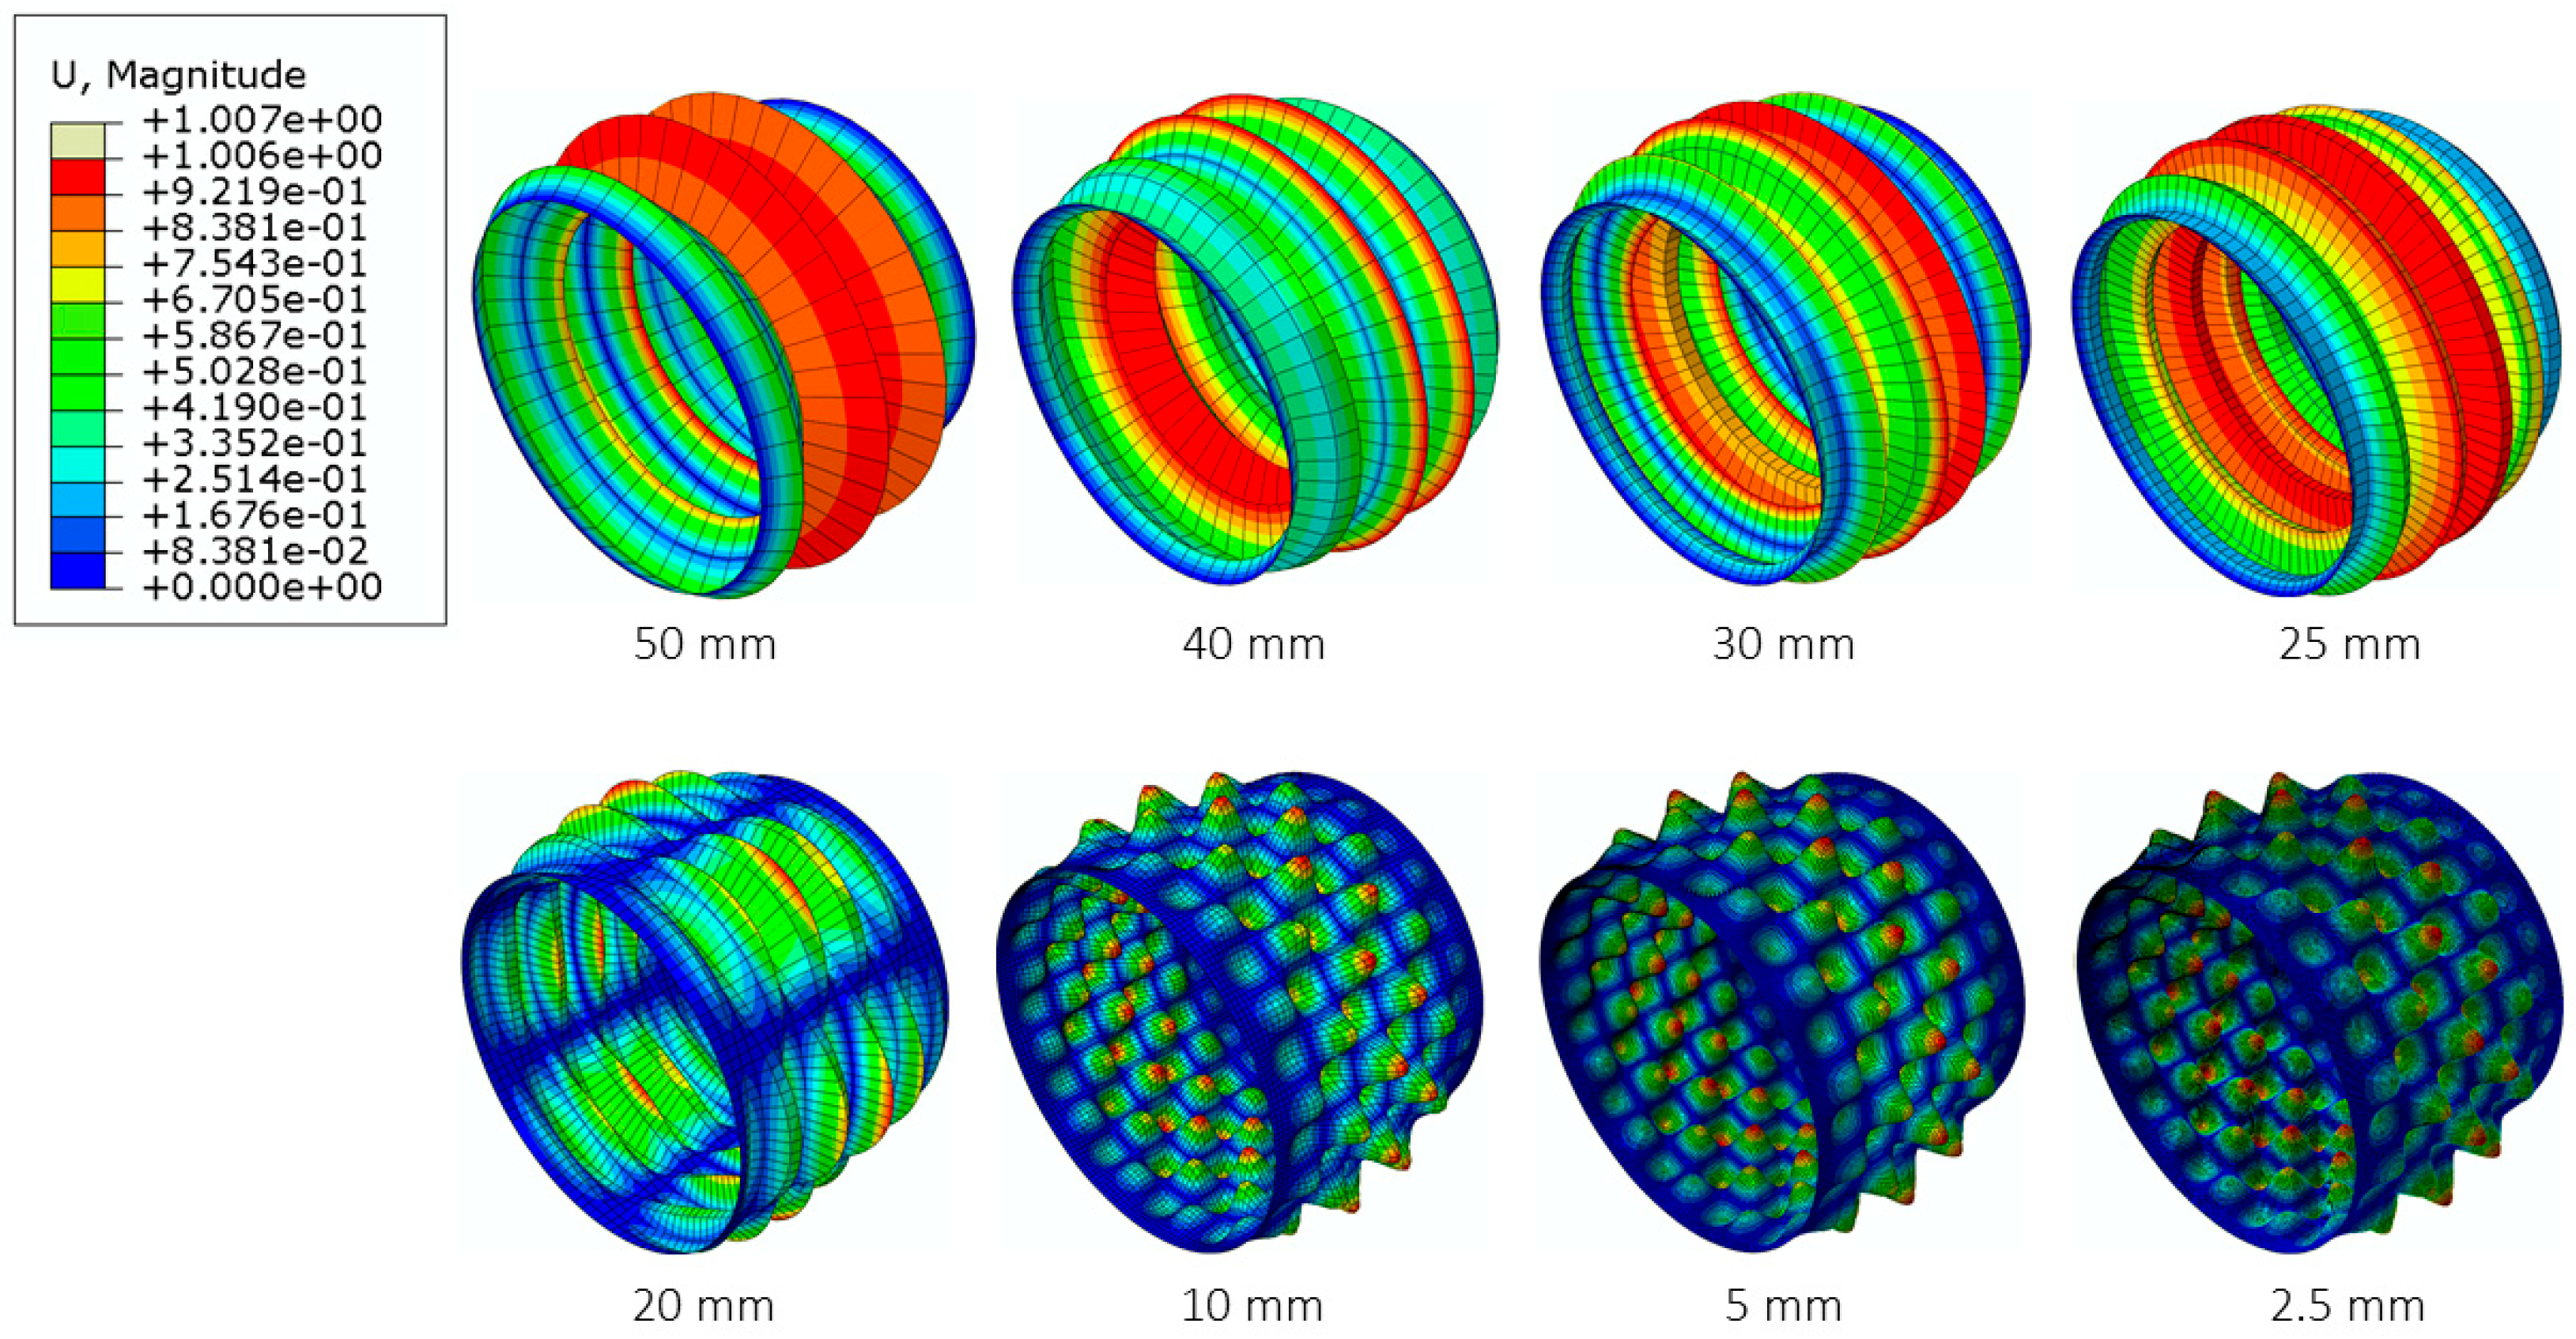
The deformed shapes showcasing the deformation patterns along Model-1 at critical buckling load for various mesh sizes are presented in Figure 2. The Eigenvalue of buckling load for each particular mesh size is also displayed in Figure 2.

3.1.2. Model-2 (Linear Analysis)

The deformed shapes showcasing the deformation patterns along Model-2 at critical buckling load for various mesh sizes are presented in Figure 3. The Eigenvalue of buckling load for the particular mesh size is also displayed in Figure 3.

3.2. Non-Linear Results

The results obtained by non-linear analysis for the eight different mesh sizes applied to both models are discussed in the following sections. The critical buckling loads obtained via the Riks method for all different models are presented in Table 3. It must be noted here that the data for mesh size of 2.5 mm is missing because the computational power required to solve that particular mesh size was beyond the capabilities of the system. Table 3 depicts the buckling loads at varying mesh sizes obtained from non-linear analysis.
Using the data presented in Table 2, the following plot was obtained, which showcases how mesh size affects the buckling load of Model-1 and Model-2 (Figure 4).
The effect of mesh size was far more prominent for Model-2, whereas Model-1 did not showcase much change in buckling load. This trend was almost the same as that found in the linear analysis, but the results of Model-2 at 50 mm mesh size diverged. A net change of only about 27 kN was observed for Model-1 across different mesh sizes, but Model-2 displayed a higher change value, which turned out to be 34 kN, excluding the data at 50 mm mesh size.

3.2.1. Model-1 (Non-Linear Analysis)

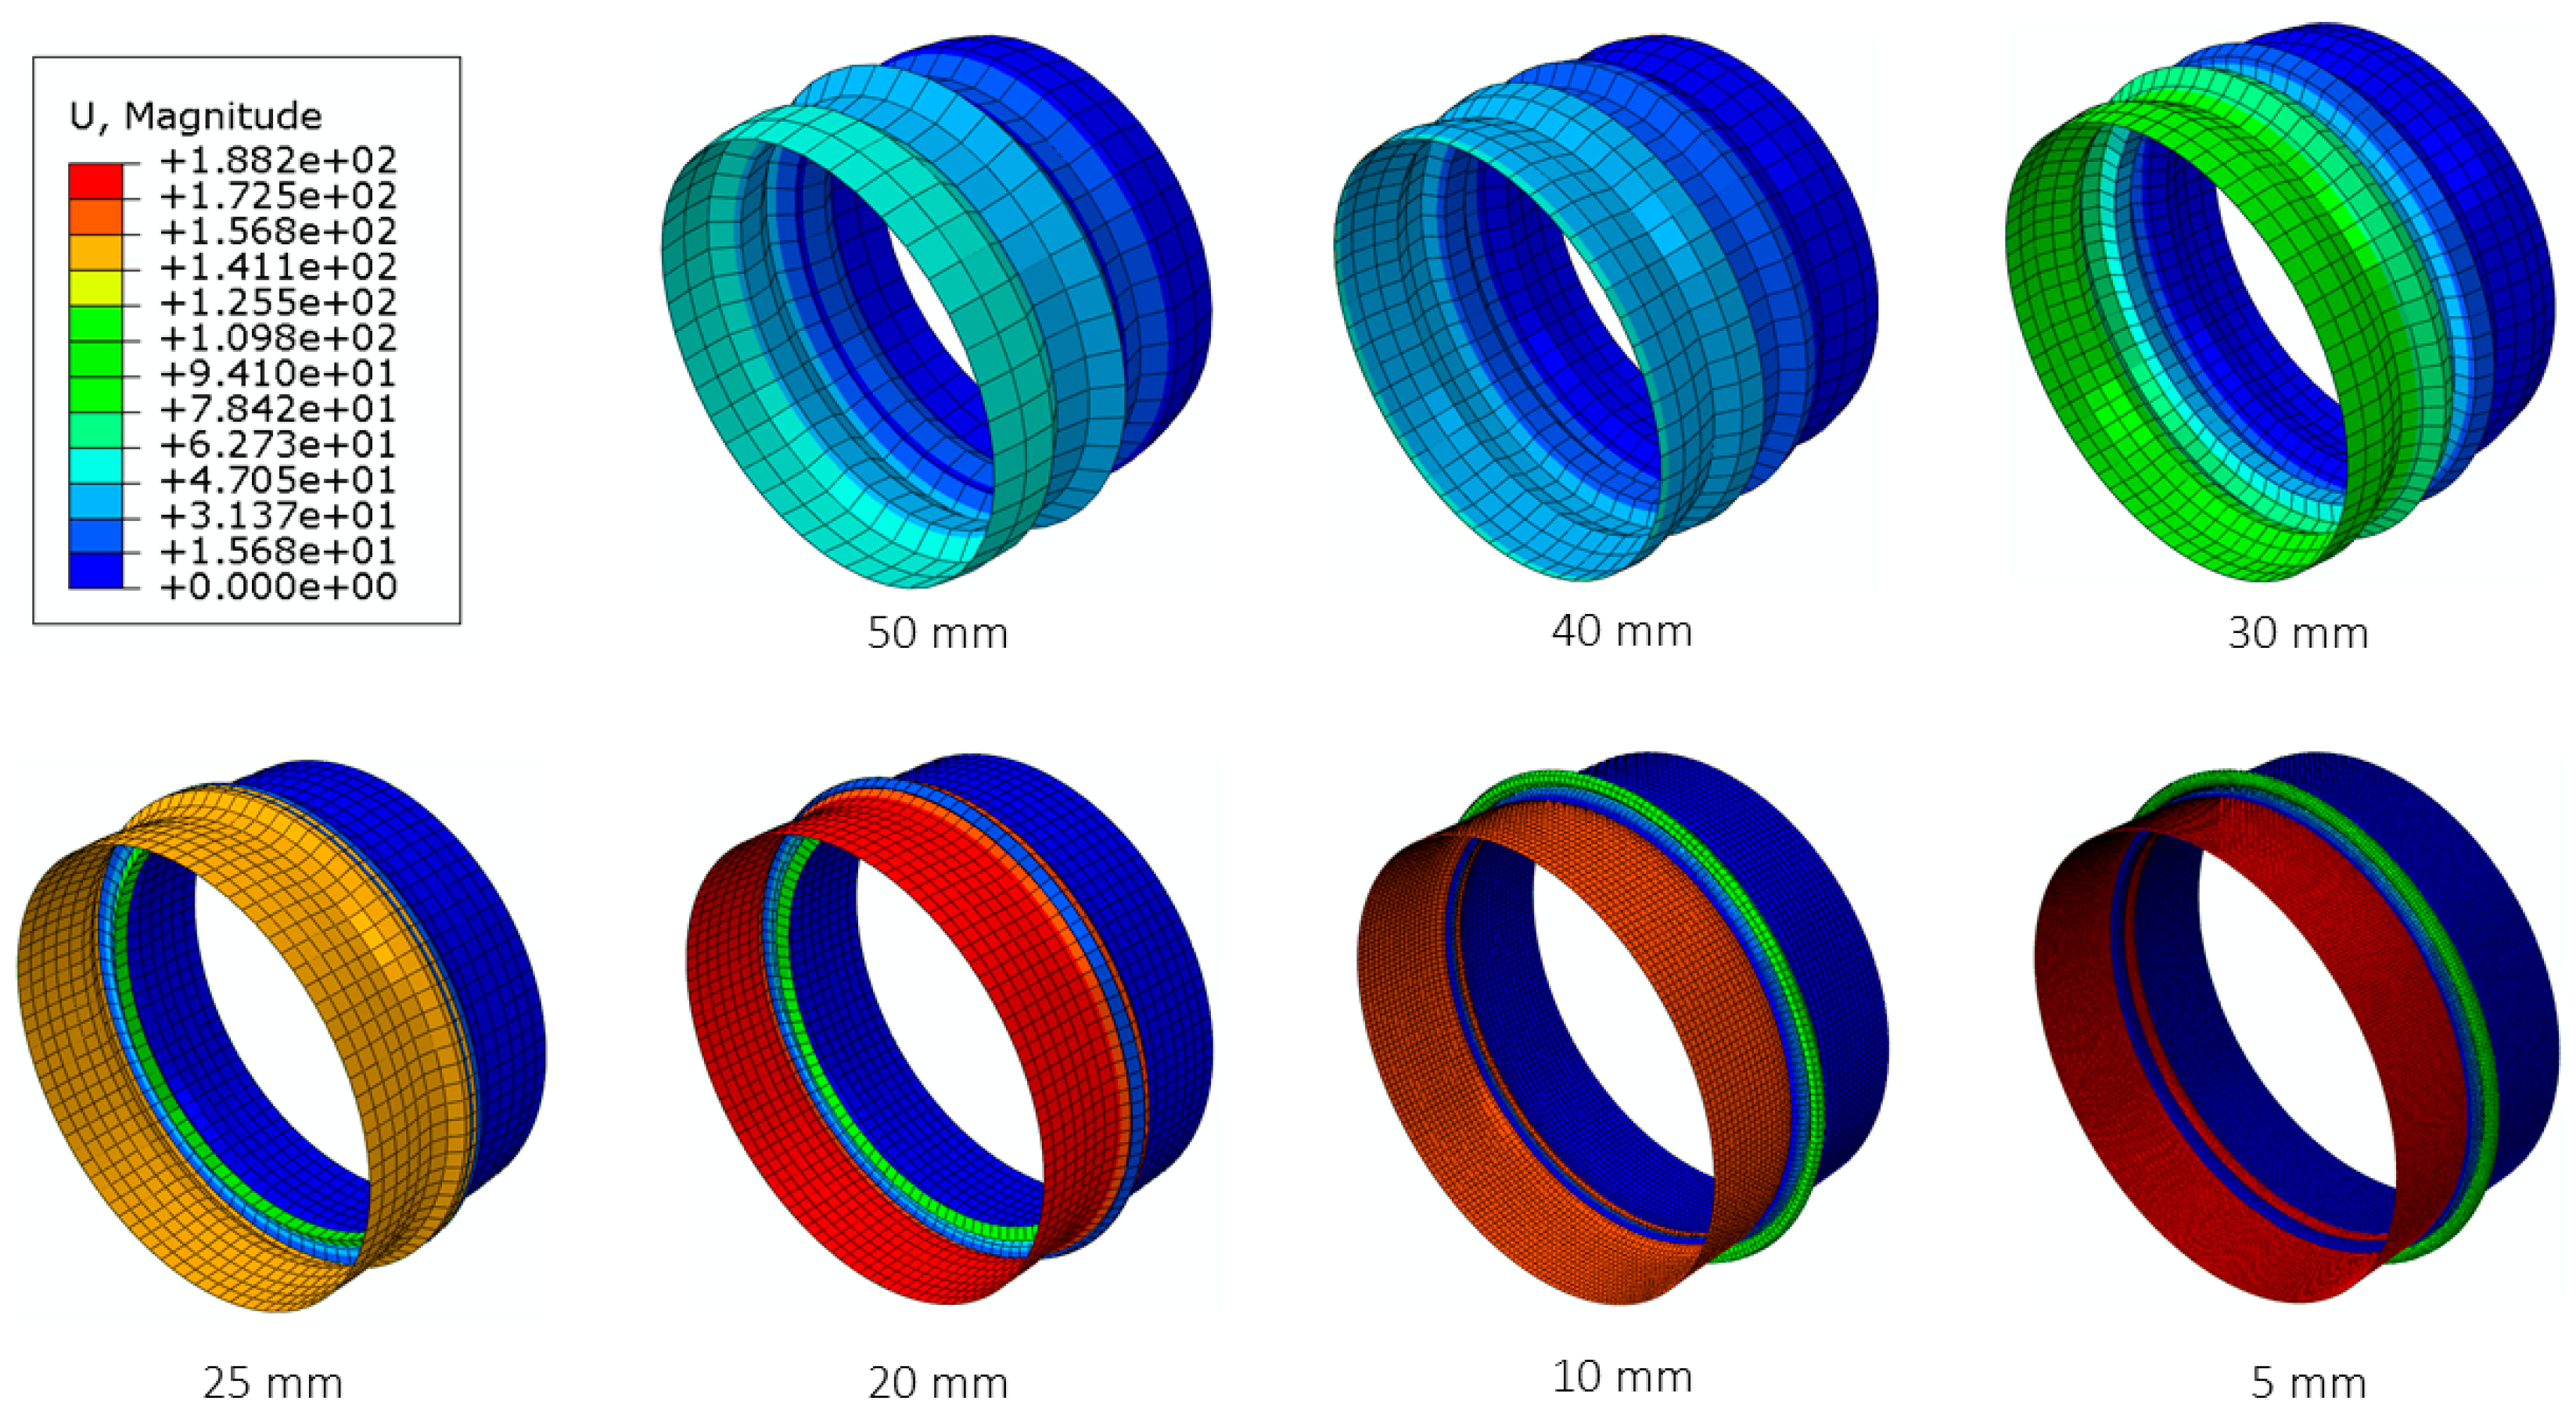
The deformed shapes showcasing the deformation patterns for various mesh sizes are presented in Figure 5. All of the models were solved for a total of 100 increments, but their respective jobs were mostly aborted before that many increments were solved due to the required increment size getting smaller than the minimum size specified. The total number of increments for which the solution was run is displayed alongside the deformed shapes. Generally, each job ran for about 50 increments.

3.2.2. Model-2 (Non-Linear Analysis)

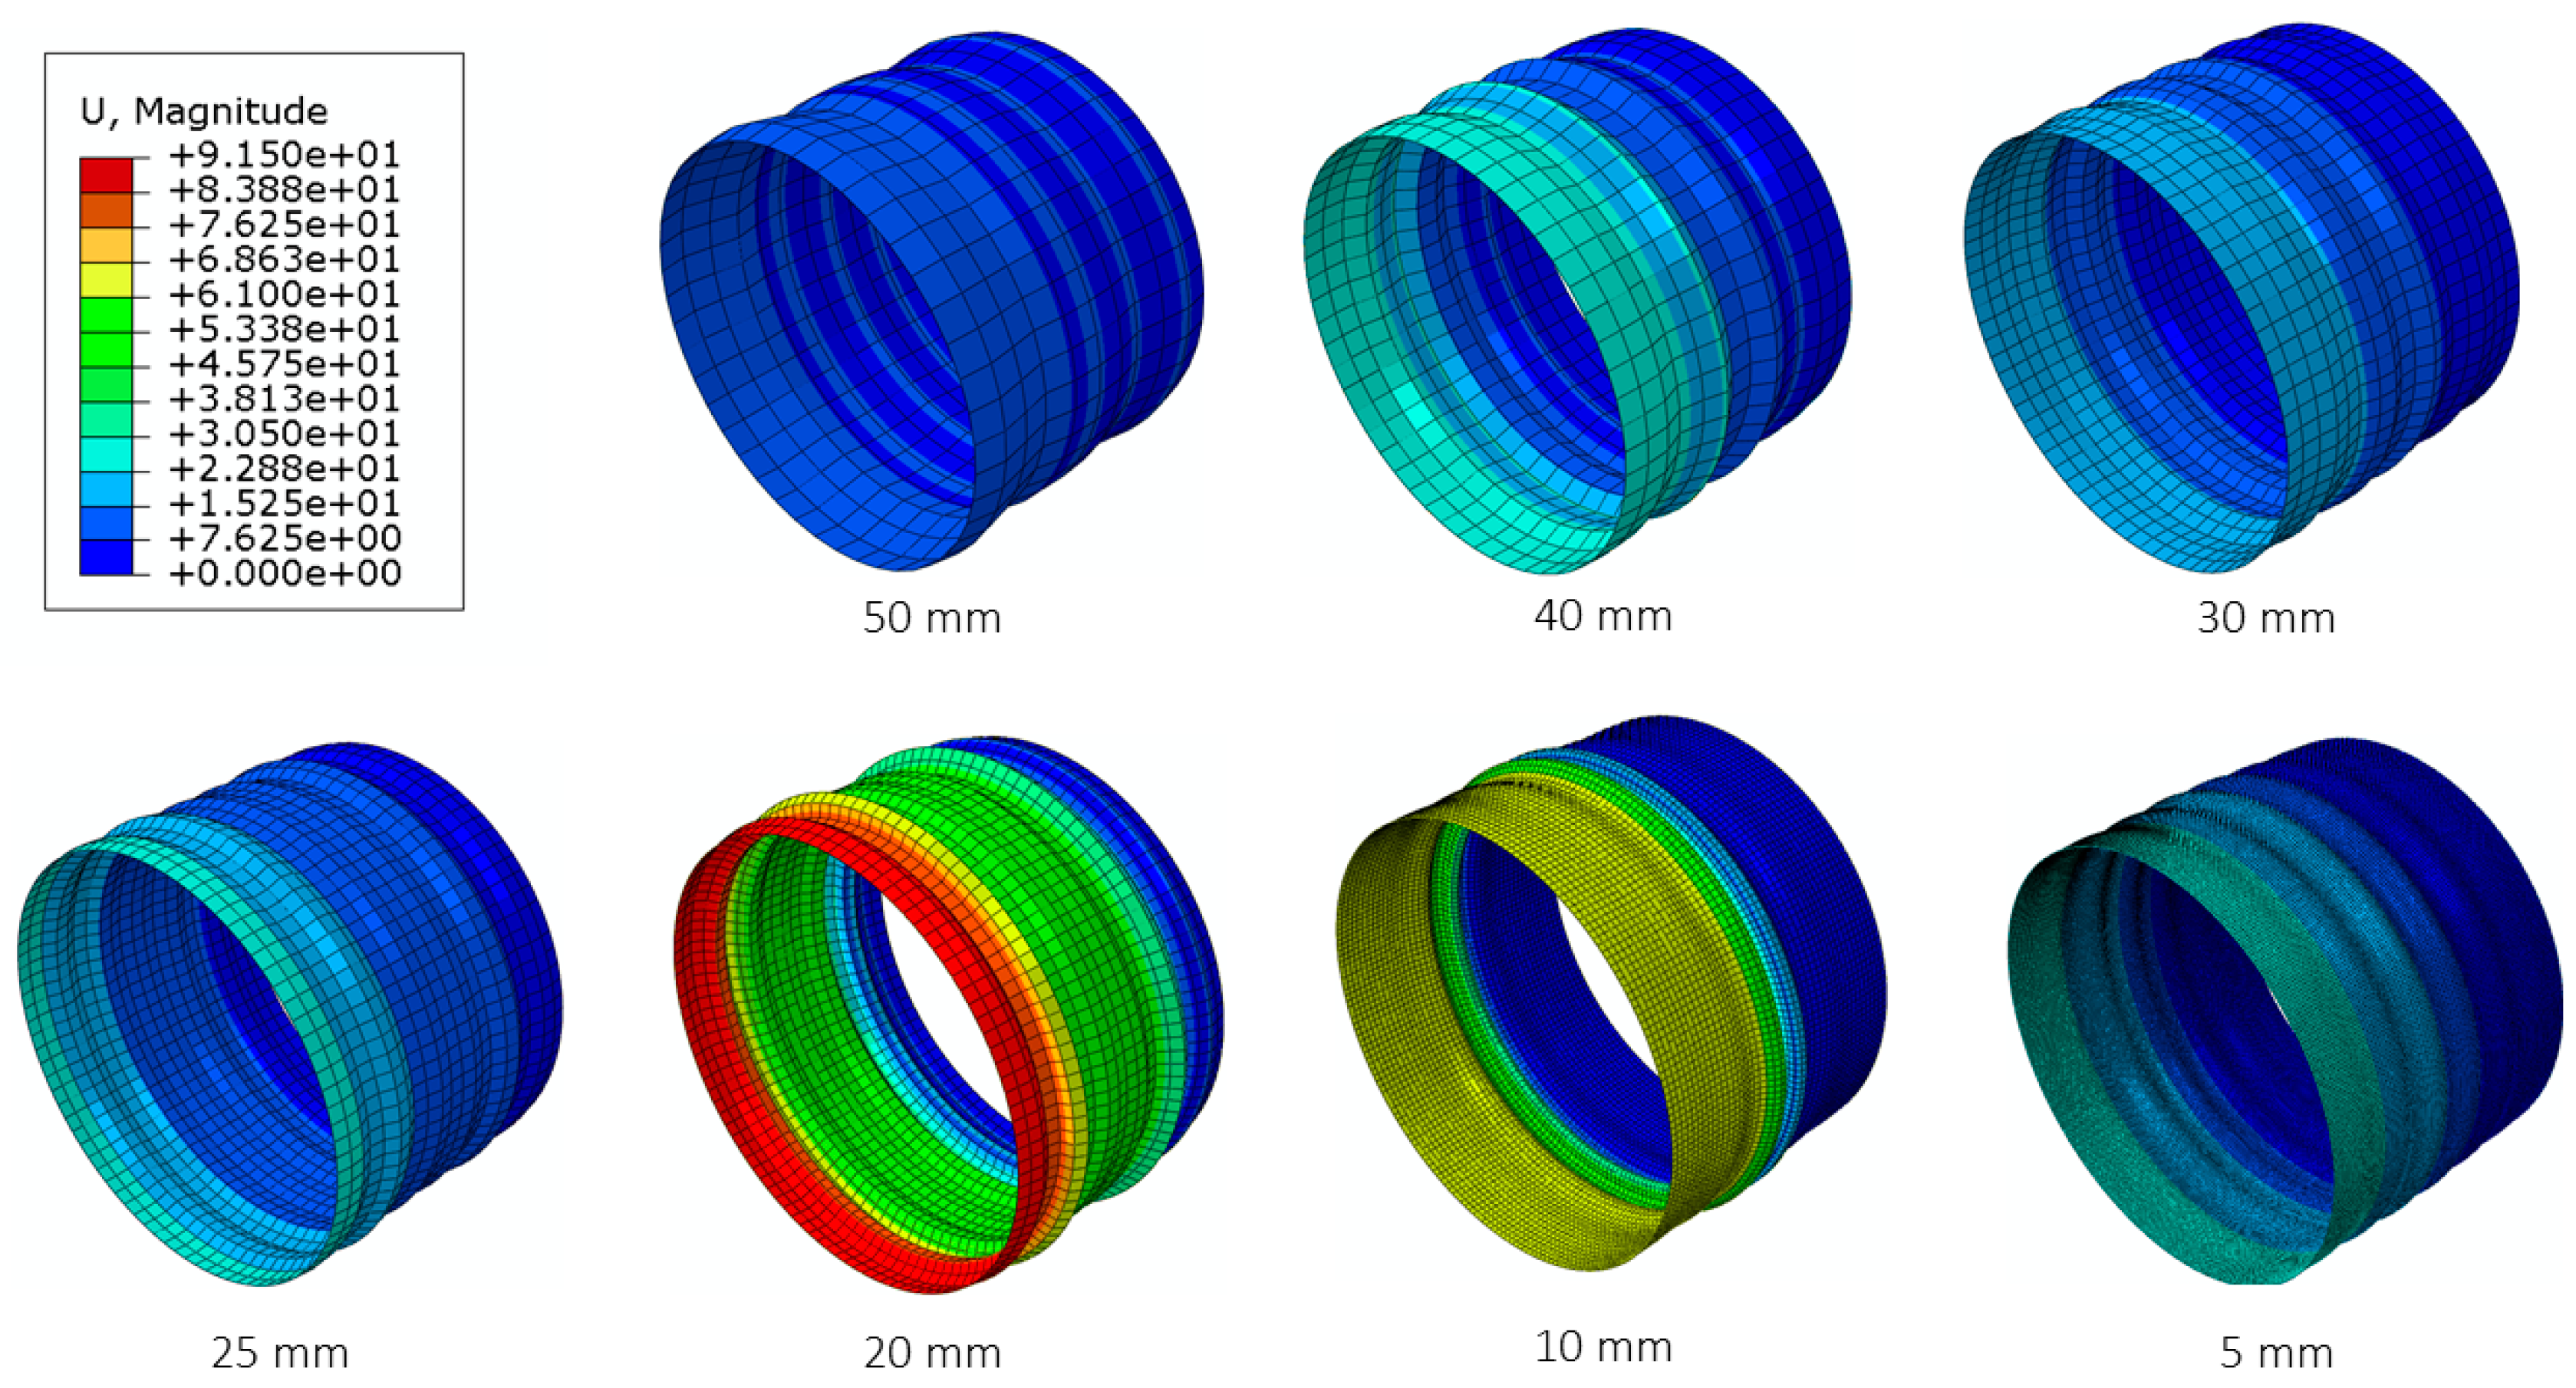
The deformed shapes showcasing the deformation patterns of Model-2 for various mesh sizes are presented in Figure 6. All of the models were solved for a total of 100 increments, but their respective jobs were aborted before that many increments were solved due to the required increment size getting smaller than the minimum size specified. The total number of increments for which the solution was run is displayed alongside the deformed shapes. Generally, each job ran for about 50 increments.

4. Discussion

4.1. Comparison of Numerical Results

This section explores the effects of mesh size on the buckling loads obtained from linear and non-linear methods. Moreover, it also refers to Figure 2 and Figure 3 for linear analysis and Figure 5 and Figure 6 for non-linear analysis, in order to explore the effects of mesh size on the deformation patterns for linear analysis.

4.1.1. Model-1

The buckling loads obtained from linear and non-linear analyses for Model-1 are listed in Table 2 and Table 3. Figure 7 gives a comparison between linear and non-linear analysis across various mesh sizes for Model-1.
It can be observed that the data for both the linear and non-linear analysis shows an exponential curve when plotted against mesh size. The linear analysis starts off with a smaller buckling load at larger mesh size, and its data decreases at a smoother rate, with the curve being flatter than that of non-linear analysis. The non-linear analysis curve starts with a larger value of buckling load, but at the next point of 40 mm mesh size, its value is already lower than for the linear data. The behavior of non-linear analysis is not very smooth, like the linear analysis data, and it also follows a steeper path.

4.1.2. Model-2

Similarly to Model-1, the buckling loads for Model-2 obtained via linear and non-linear analyses have also been listed in the prior sections. Figure 8 gives a comparison between linear and non-linear analysis across various mesh sizes for Model-2.
Figure 8 clearly shows that the buckling load from non-linear analysis at the largest mesh size used (50 mm) is almost double than all other results. This shows that at larger element sizes, the non-linear method can produce unreliable results, and a finer mesh is required to obtain acceptable results using this method. The linear analysis for Model-2 almost follows a linear path with the magnitude of buckling load decreasing at a constant rate with the reduction in element size. Overall, a trend opposite to that depicted in Figure 7 can be observed as the linear analysis data stays lower than the values obtained from non-linear analysis. This showcases that the reliability of results is also dependent on the choice of the material under consideration, along with the mesh size.

4.2. Error Analysis

The errors in the numerical solutions were obtained by comparing them with the analytical results computed by Bisagni [17]. Table 4 shows the error percentages of the results of both models for both linear and non-linear solutions. The results for the analysis of mesh size of 2.5 mm were unable to be computed because of the limited computation power of the software. The error percentage was highest for the mesh size of 50 mm.
It can be clearly observed in Table 4 that Model-1, for all mesh sizes below 30 mm, provides acceptable results with a percentage error of less than 5%, but for Model-2, only linear analysis provides acceptable results at a mesh size of 10 mm and below.

4.3. Comparison with Analytical and Experimental Results

The experimental results referenced in this study were taken from Bisagni [17] and were included solely for validation and comparative analysis purposes to assess the fidelity of our simulation models. Table 5 below summarizes the results.
Table 6 shows the numerical results at the two smallest mesh sizes, along with the analytical and experimental results for Model-1 and Model-2.
The important thing to note here is that the experimental results of Model-2 do not match any numerical or analytical results, further solidifying the need to combine experimental and numerical data for effective design of laminate shell structures. Future extension of this work will involve implementing adaptive mesh refinement AMR techniques based on strain energy gradients and investigating novel hybrid lay-ups combining ± 0 and 0°/90° orientations to optimize buckling performance while maintaining a balance with computational efficiency.

5. Conclusions

The mesh sensitivity analysis for determining the critical buckling loads of two different CFRP cylindrical shell models showed that mesh sensitivity is highly dependent on the method used to obtain the solution. Linear analysis is able to provide better solutions at larger mesh sizes, while non-linear analysis fails to do so. However, at smaller mesh sizes, the performance of the two methods is dependent on the nature of the model. For Model-1, non-linear analysis provided great results, while for Model-2, linear analysis proved to be the better option. Overall, Model-1 showed low levels of mesh sensitivity when compared to Model-2. When compared with analytical results, the finer meshes proved to be great approximations. However, when compared with the experimental data, a huge difference was observed. This can be traced to material imperfections introduced during both material production and laminate assembly. Such a difference between experimental results and numerical results shows that empirical relations based on experimental data are important in studies of materials whereby an imperfection or defect might create a huge impact.

Author Contributions

Conceptualization, S.K.C. and M.S.A.; methodology, S.K.C.; software, M.S.A.; validation, S.K.C., M.S.A., and M.U.; formal analysis, S.K.C.; investigation, S.K.C. and M.N.B.; resources, M.U.; writing—original draft preparation, M.S.A.; writing—review and editing. All authors have read and agreed to the published version of the manuscript.

Funding

This research received no external funding.

Institutional Review Board Statement

Not applicable.

Informed Consent Statement

Not applicable.

Data Availability Statement

Data will be made available on request.

Conflicts of Interest

The authors declare no conflict of interest.

References

  1. Thompson, J.M.T. Advances in shell buckling: Theory and experiments. Int. J. Bifurc. Chaos 2015, 25, 1530001. [Google Scholar] [CrossRef]
  2. Tsien, H.-S. A Theory for the Buckling of Thin Shells. J. Aeronaut. Sci. 1942, 9, 373–384. [Google Scholar] [CrossRef]
  3. Teng, J.G. Buckling of Thin Shells: Recent Advances and Trends. Appl. Mech. Rev. 1996, 49, 263–274. [Google Scholar] [CrossRef]
  4. Barile, C.; Casavola, C. Mechanical characterization of carbon fiber-reinforced plastic specimens for aerospace applications. In Mechanical and Physical Testing of Biocomposites, Fibre-Reinforced Composites and Hybrid Composites; Woodhead Publishing: Cambridge, UK, 2019; pp. 387–407. [Google Scholar]
  5. Mandal, P.; Calladine, C. Buckling of thin cylindrical shells under axial compression. Int. J. Solids Struct. 2000, 37, 4509–4525. [Google Scholar] [CrossRef]
  6. Khayal, O.E.S. Literature review on imperfection of composite laminated plates. J. Microsc. Ultrastruct. 2017, 5, 119–122. [Google Scholar] [CrossRef] [PubMed]
  7. Xu, J.; Zhao, Q.; Qiao, P. A Critical Review on Buckling and Post-Buckling Analysis of Composite Structures. Front. Aerosp. Eng. 2013, 2, 157–168. (In English) [Google Scholar]
  8. Mugahed Amran, Y.H.; Alyousef, R.; Rashid, R.S.M.; Alabduljabbar, H.; Hung, C.-C. Properties and applications of FRP in strengthening RC structures: A review. Structures 2018, 16, 208–238. [Google Scholar] [CrossRef]
  9. Singh, S.K.; Chakrabarti, A. Buckling analysis of laminated composite plates using an efficient C0 FE model. Lat. Am. J. Solids Struct. 2012, 9, 1–13. [Google Scholar] [CrossRef]
  10. Dubey, R.K. Report on studying the effect of mesh density on finite element analysis and establish an optimal mesh density for finite element analysis of a bridge deck under the effect of self-weight and vehicular dynamic load. Int. J. Adv. Res. Ideas Innov. Technol. 2018, 9, 1–9. [Google Scholar]
  11. Zhuang, Z.; Liu, Z.; Cheng, B.; Liao, J. Extended Finite Element Method: Tsinghua University Press Computational Mechanics Series; Academic Press: Cambridge, MA, USA, 2014. [Google Scholar]
  12. Liu, Y.; Glass, G. Effects of mesh density on finite element analysis. In Proceedings of the SAE 2013 World Congress & Exhibition Location, Detroit, MI, USA, 8 April 2013. SAE Technical Paper, 0148-7191. [Google Scholar] [CrossRef]
  13. Ghavidel, A.; Mousavi, S.R.; Rashki, M. The Effect of FEM Mesh Density on the Failure Probability Analysis of Structures. KSCE J. Civ. Eng. 2018, 22, 2370–2383. [Google Scholar] [CrossRef]
  14. Wang, W.; Zhu, Y.; Zhou, L.; Zhang, J. Buckling characteristics of carbon fiber composite/aluminium alloy combined cylindrical shells under external hydrostatic pressure. Int. J. Press. Vessel. Pip. 2024, 208, 105125. [Google Scholar] [CrossRef]
  15. Choudhary, P.K. Optimal design of composite cylindrical shells subject to compression buckling strength. Multidiscip. Model. Mater. Struct. 2023, 19, 829–847. [Google Scholar] [CrossRef]
  16. Taraghi, P.; Zirakian, T.; Karampour, H. Parametric study on buckling stability of CFRP-strengthened cylindrical shells subjected to uniform external pressure. Thin-Walled Struct. 2021, 161, 107411. [Google Scholar] [CrossRef]
  17. Bisagni, C. Experimental Buckling of Thin Composite Cylinders in Compression. AIAA J. 1999, 37, 276–278. [Google Scholar] [CrossRef]
  18. Tahir, Z.U.R.; Mandal, P. Effect of asymmetric meshing on the buckling behavior of composite shells under axial compression. Int. J. Comput. Methods Eng. Sci. Mech. 2017, 18, 47–63. [Google Scholar] [CrossRef]
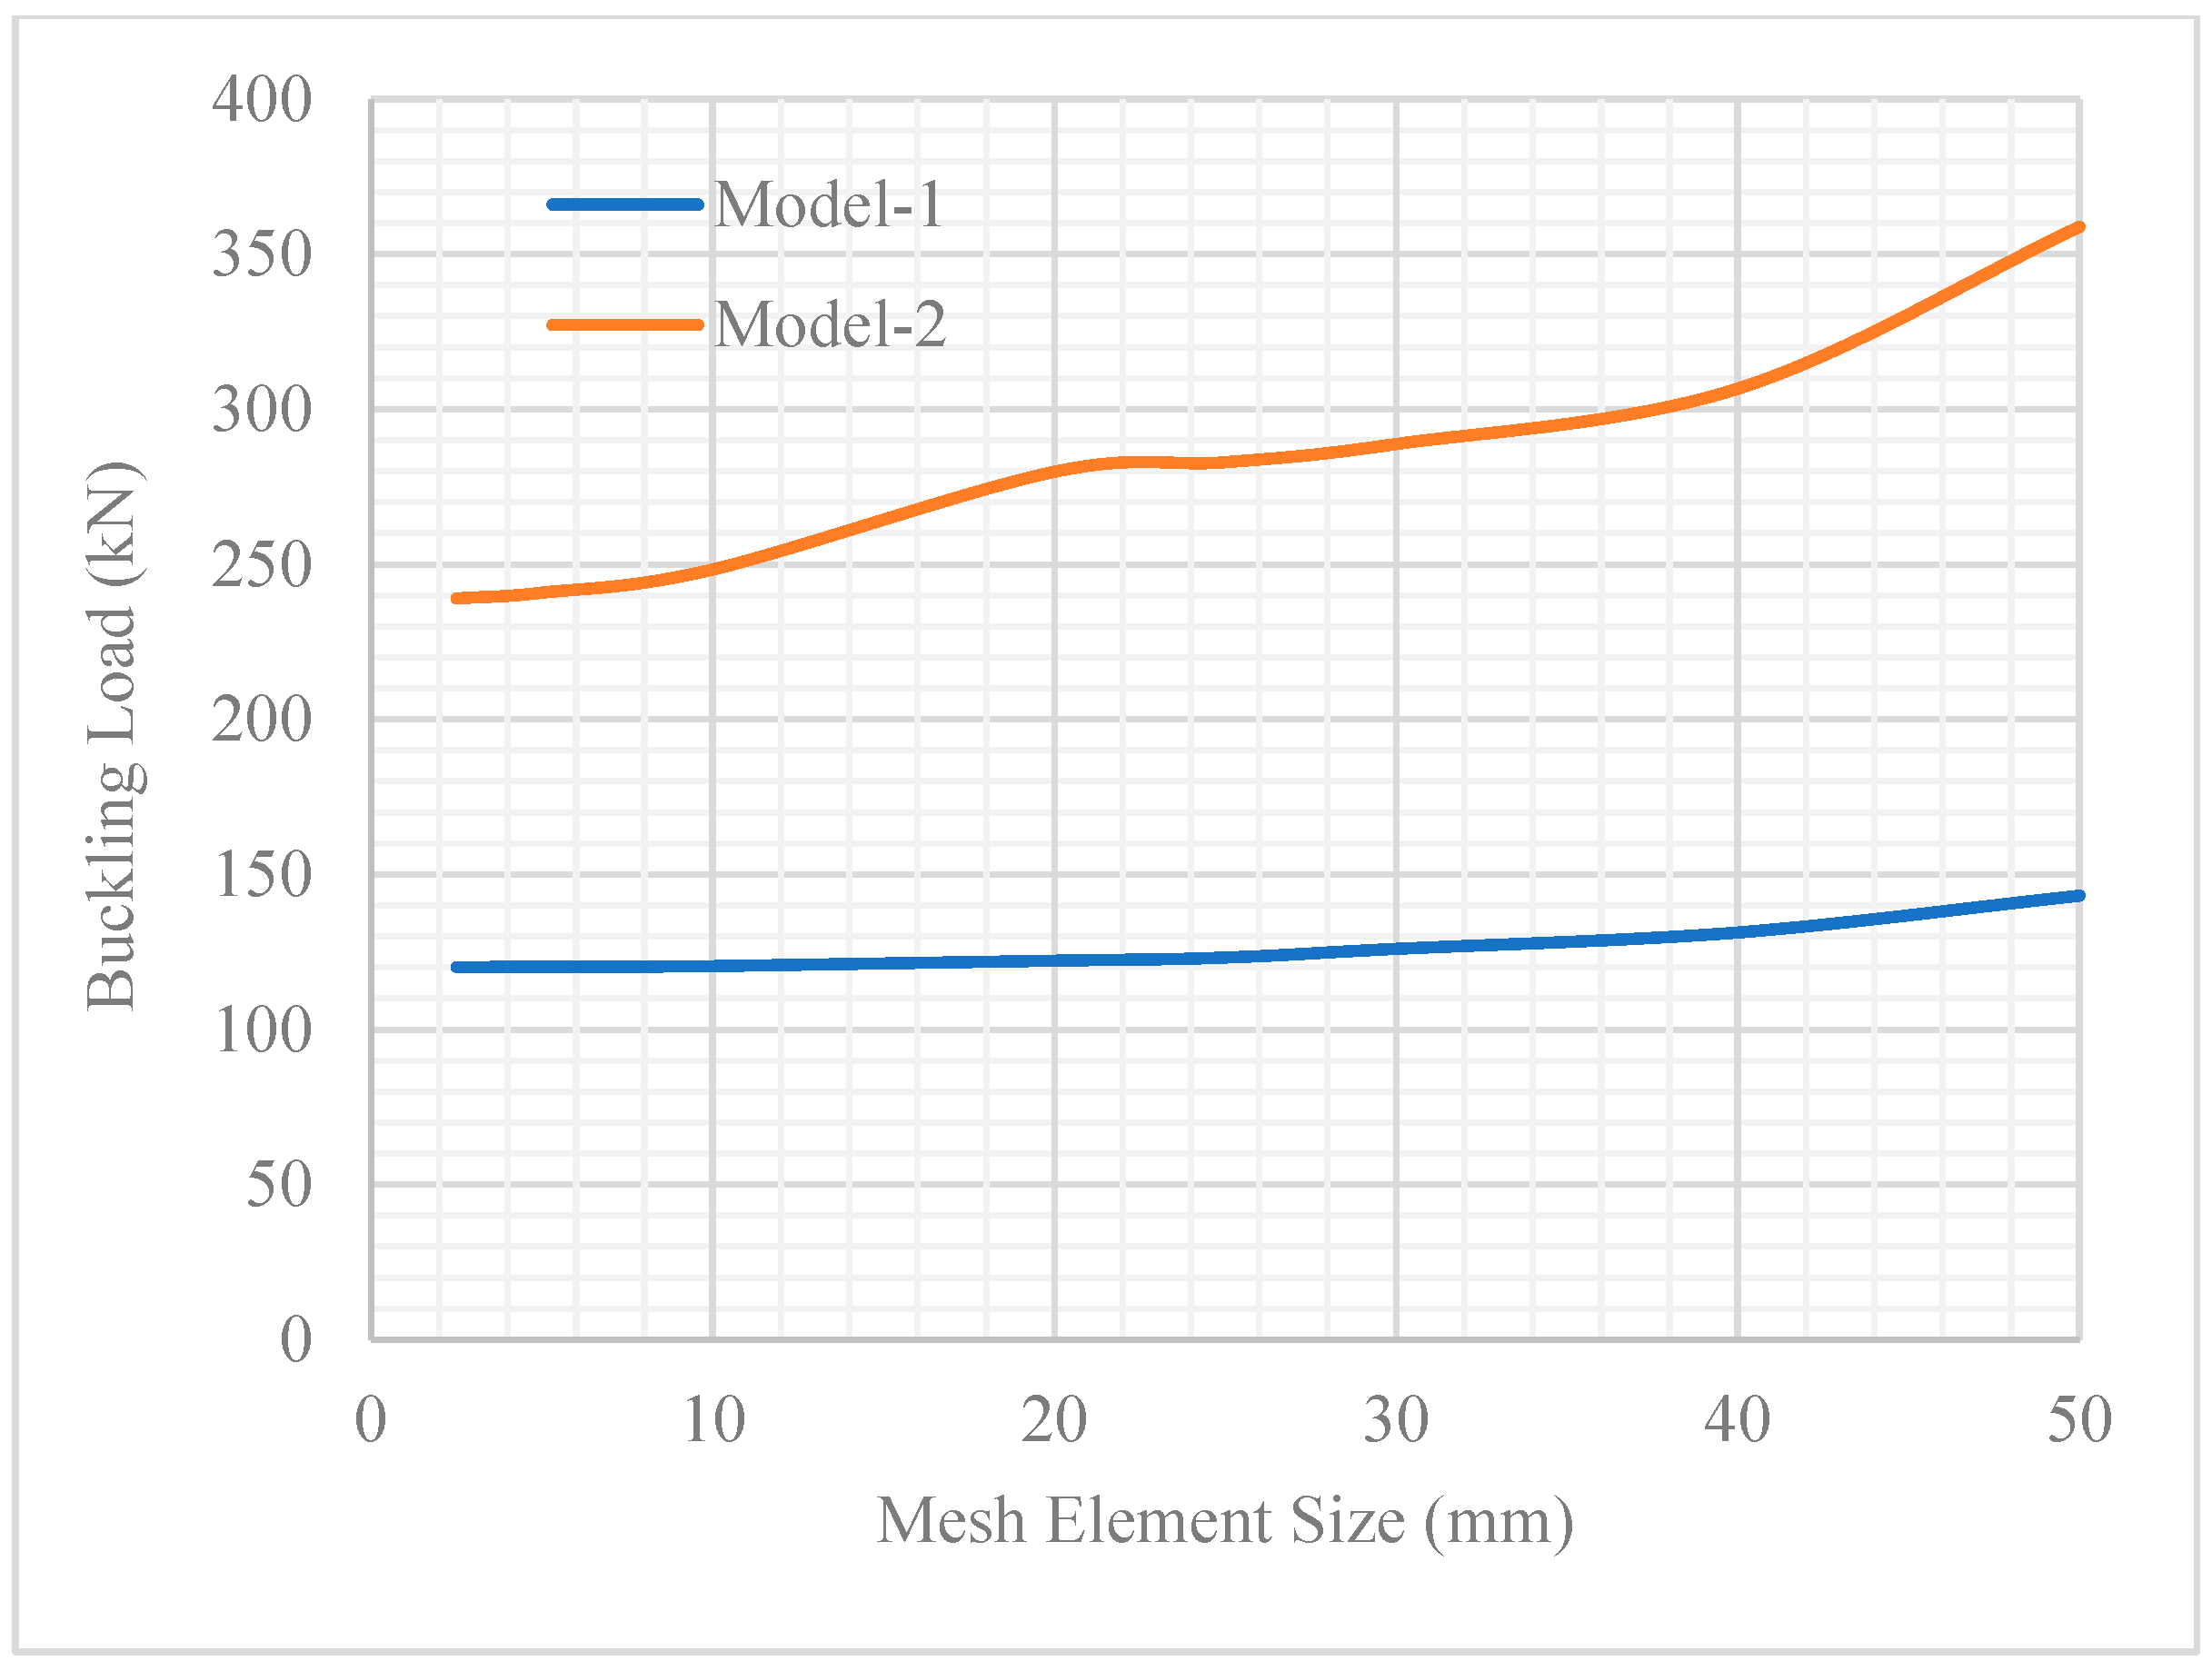
Figure 1. Mesh sensitivity of Model-1 and Model-2 for linear analysis.
Materproc 23 00008 g001
Figure 2. Shapes deformation of Model-1 using linear analysis.
Materproc 23 00008 g002
Figure 3. Shape deformation of Model-2 using linear analysis.
Materproc 23 00008 g003
Figure 4. Mesh sensitivity of Model-1 and Model-2 for non-linear analysis.
Materproc 23 00008 g004
Figure 5. Shape deformation of Model-1 using non-linear analysis.
Materproc 23 00008 g005
Figure 6. Shape deformation of Model-2 using non-linear analysis.
Materproc 23 00008 g006
Figure 7. Comparison of linear and non-linear analysis across different mesh sizes for Model-1.
Materproc 23 00008 g007
Figure 8. Comparison of linear and non-linear analysis across different mesh for Model-2.
Materproc 23 00008 g008
Table 1. Dimensions and material properties of Model-1 and Model-2.
ParameterValues
Elastic Modulus E11 (MPa)52,000
Elastic Modulus E22 (MPa)52,000
Shear Modulus G12 (MPa)2350
Poisson’s Ratio0.302
Length (mm)520
Diameter (mm)700
Overall Thickness (mm)1.32
Single Layer Thickness (mm)0.33
Compressive Load (N)1
Table 2. Buckling loads at different mesh sizes obtained from linear analysis.
Mesh Size (mm)Buckling Load for Model-1 (N)Buckling Load for Model-2 (N)
50143,222358,851
40131,368306,694
30126,116288,828
25123,236282,976
20122,318279,925
10120,551248,417
5120,297240,911
2.5120,236239,080
Table 3. Buckling loads at different mesh sizes obtained from non-linear analysis.
Mesh Size (mm)Buckling Load for Model-1 (N)Buckling Load for Model-2 (N)
50145,654601,515
40130,251309,081
30123,267308,041
25122,242317,257
20121,940301,875
10119,269274,945
5118,842274,858
Table 4. Percentage error in buckling loads calculated numerically.
Mesh Size (mm)%Error for Linear Analysis (Model-1)%Error for Non-Linear Analysis (Model-1)%Error for Linear Analysis (Model-2)%Error for Non-Linear Analysis (Model-2)
5020.7822.8349.52150.63
4010.789.8427.7928.78
306.363.9520.3428.35
253.933.0917.9132.19
203.152.8316.6425.78
101.660.583.5114.56
51.450.220.3814.52
2.51.4-0.38-
Table 5. Buckling loads obtained experimentally for Model-1 and Model-2.
Experiment No.Buckling Load for Model-1 (N)Buckling Load for Model-2 (N)
1120,236172,877
2116,454151,618
3102,447155,676
4112,632164,702
Average112,942161,218
Table 6. Buckling loads for smallest meshes for Model-1 and Model-2.
Result TypeBuckling Load for Model-1 (N)Buckling Load for Model-2 (N)
Numerical Linear (Mesh size 5 mm)120,297240,911
Numerical Linear (Mesh size 2.5 mm)120,236239,080
Numerical Non-Linear (Mesh size 10 mm)119,269274,945
Numerical Non-Linear (Mesh size 5 mm)118,842274,858
Average Experimental112,942161,218
Analytical118,580240,000
Disclaimer/Publisher’s Note: The statements, opinions and data contained in all publications are solely those of the individual author(s) and contributor(s) and not of MDPI and/or the editor(s). MDPI and/or the editor(s) disclaim responsibility for any injury to people or property resulting from any ideas, methods, instructions or products referred to in the content.