Proceeding Paper

FeNiS/PANI Hybrid Composite for Enhanced Electrochemical Energy Storage Performance †

by
Areeba Sajid
,
Yumna Sohail
and
Mohsin Ali Marwat
*
Faculty of Materials & Chemical Engineering, Ghulam Ishaq Khan Institute of Engineering Sciences and Technology, Topi 23640, Pakistan
*
Author to whom correspondence should be addressed.
Presented at the 3rd International Conference on Modern Technologies in Mechanical & Materials Engineering (MTME2025), Topi, Pakistan, 16–17 April 2025.
Mater. Proc. 2025, 23(1), 22; https://doi.org/10.3390/materproc2025023022
Published: 18 August 2025

Abstract

This study focuses on developing FeNiS/PANI composites for supercapacitor applications, leveraging the individual benefits of iron–nickel sulfide (FeNiS) and polyaniline (PANI). FeNiS offers high electrical conductivity and energy density, while PANI contributes enhanced flexibility and pseudocapacitive behavior. The goal is to create a composite with superior electrochemical performance. Synthesis involved chemical oxidative polymerization for PANI and an in situ method for FeNiS, followed by integration. Characterization techniques like XRD, SEM, and EDS confirmed the successful formation and homogeneous elemental dispersion of the composite, showing that PANI formed an interconnected network that improved charge transport. Electrochemical analysis demonstrated significant improvements. Cyclic voltammetry (CV) and galvanostatic charge–discharge (GCD) tests revealed that the FeNiS/PANI composite exhibited a doubled discharge time (159 s vs. 72 s for FeNiS) and a higher specific capacitance (113.5 F/g vs. 51.42 F/g). These results highlight the promise of FeNiS/PANI as an advanced material for efficient and sustainable energy storage.

1. Introduction

Efficient and sustainable energy storage solutions are imperative to meet the 21st century’s global energy demands [1,2,3,4]. Henceforth, transition metal sulfides are propitious materials due to their superior electrical conductivity, high energy density, affordability, mechanical flexibility, and ease of synthesis [5]. These characteristics make them applicable and useful for a range of electrochemical energy storage applications, namely supercapacitors [6]. Iron–nickel sulfide (FeNiS) is a transition metal sulfide (TMSs) that has piqued interest due to its iron and nickel cation combination that enhances its electrochemical performance [5,6,7,8]. However, some intrinsic limitations of individual TMSs, such as moderate electrical conductivity and structural instability during prolonged cycling, can hinder their full potential. Similarly, while conductive polymers like PANI offer excellent pseudocapacitance and flexibility, they often suffer from poor mechanical stability and capacity degradation due to swelling/shrinking during charge/discharge cycles [4].
Addressing these challenges, the synergistic integration of different active materials has emerged as a promising strategy. Combining TMSs with conductive polymers can overcome the limitations of individual components, creating composites with enhanced conductivity, structural integrity, and overall electrochemical performance. While various TMSs and PANI composites have been explored, iron–nickel sulfide (FeNiS), with its unique bimetallic cation combination, presents a compelling opportunity to further enhance electrochemical performance when integrated with PANI [6,8]. In this context, the current work focuses on synthesizing and characterizing a novel FeNiS/PANI composite to develop an advanced electrode material for supercapacitors. This study specifically aims to leverage the inherent benefits of FeNiS, such as its high redox activity and strong conductive framework, and combine them with PANI’s superior pseudocapacitance and mechanical flexibility. The objective is to produce a composite material that exhibits significantly improved specific capacitance, faster charge–discharge kinetics, and enhanced long-term stability, thereby contributing to the development of effective and sustainable energy storage solutions [3,4].

2. Experimental

2.1. Materials

The following chemicals were acquired from Sigma Aldrich: ferric chloride hexahydrate (FeCl3·6H2O; ≥76%), nickel chloride hexahydrate (NiCl2·6H2O; ≥99%), (HCl 37 wt.% in H2O, ≥99.999%), ammonium persulfate (NH4)2S2O8; ≥98%), and sodium sulfide nonahydrate (Na2S·9H2O; ≥99.99%). To improve the final composite’s conductivity and electrochemical characteristics, polyaniline (PANI) was added. DI water and ethanol were locally purchased from Sigma Scientific and were used for dissolution and washing of the precursor.

2.2. Preparation of Fe0.5Ni0.5S/PANI

To synthesize polyaniline via chemical oxidative polymerization, begin by preparing two solutions. A measure of 0.1 M aniline is dissolved in a 1 M hydrochloric acid solution. Separately, 0.1 M ammonium persulfate is dissolved in a similar 1 M hydrochloric acid solution. The polymerization initiates when the ammonium persulfate solution is slowly added to the aniline solution, maintaining continuous stirring. This reaction leads to the precipitation of PANI. The resulting PANI precipitate is then collected through filtration and thoroughly washed with deionized water, followed by ethanol, to remove residual reactants and by products. Finally, the washed PANI is dried, yielding the desired PANI powder.
The preparation method was as follows: a 10:1 mass ratio of Fe0.5Ni0.5S to PANI was used to create the Fe0.5Ni0.5S/PANI composite. The required precursor moles were calculated as n = 0.0223 mol, and the corresponding masses of precursor salts were determined as shown in Table 1.
For homogeneity and uniform dissolution, these precursor salts were dissolved in 100 mL of deionized (DI) water in a glass beaker while being continuously stirred by a magnetic stirrer. A measure of 5.52 g of sodium sulfide nonahydrate (Na2S·9H2O) was added to the solution dropwise to add the sulfide ions. Fe+2 and Ni+2 ions replaced Na+ ions in Na2S during the one-hour reaction that was allowed to proceed at 70 °C with constant stirring, resulting in the in situ formation of Fe-Ni-S species.
The reaction mixture was briefly exposed to ultrasonication, improving dispersion and avoiding particle agglomeration. The resulting precipitate was then cleaned using ethanol and DI water. Following washing, the precipitates were dried in an oven set at 100 °C for 14 h eliminating any remaining solvent and moisture. Next, the dried powder was annealed at 400 °C for four hours in a furnace at a regulated rate of 2 °C per minute. The Fe0.5Ni0.5S material was annealed to maximize its electrochemical properties and increase crystallinity (see Figure 1).

2.3. Electrochemical Analysis

Three-electrode testing accurately determines a working electrode’s electrochemical properties, including capacitance and charge/discharge behavior.

2.3.1. Cyclic Voltammetry

The cyclic voltammogram measures the current at the working electrode in a CV system during the potential scans. Using cyclic voltammetry, the electrode specific capacity is calculated from Equation (1):
Q S = V i V f I   ×   V m   ×   v
whereby the integral represents area under voltammogram, ΔV is the potential operating window, m is the mass of active material (that is, the mass that will behave and show reactive properties), and v is the potential scan rate.

2.3.2. Galvanostatic Charge Discharge

The specific capacity in discharging curve is calculated from Equation (2), where I/m is current density and t is discharging time:
Q s =   ( I   ×   t ) m
Moreover, the specific capacitance was determined by inputting Equation (2) into the following formula:
C S =   Q s V

3. Results and Discussion

3.1. XRD Analysis

Crystallographic and phase characterization was performed using X-ray diffraction analysis, acquired with an AXRD LPD diffractometer manufactured by Proto (AXRD LPD, Proto, UK), 10–90° over 2θ diffraction angle). The X-ray diffraction analysis confirmed the phases of the materials synthesized by matching the diffraction peaks with their standard JCPDS card numbers. In Figure 2a, the observed peaks at (111), (220), and (101) correspond to the JCPDS card No: 42-1449, confirming the formation of FeNiS phase. Furthermore, Figure 2b included the incorporation of polyaniline (PANI), which exhibited an additional peak at (020) and (200). The unidentified XRD peaks can be attributed to the surface oxidation of particles.

3.2. SEM

Characterization of the Fe0.5Ni0.5S and Fe0.5Ni0.5S-PANI composites’ surface morphologies and elemental compositions was performed via SEM and EDS, utilizing a ZEISS EVO 15 system. For SEM analysis, particles were coated with Au to achieve better interaction to prevent surface charging. The morphology of Fe0.5Ni0.5S in Figure 3a–d revealed an agglomerated structure with smaller, sharp-edged particles. With the incorporation of PANI, a morphological change was observed, as shown in Figure 3e,f. PANI formed a network, bridging FeNiS particles and enhancing interconnectivity, thus expected to improve composite electrical conductivity. Moreover, the development of these interconnected networks is confirmed by the presence of PANI fibers, which are shown in the shaded areas. The reduction in sharp edges and the smaller particles contributed to better electrochemical performance by optimizing the charge transport pathways. This structural modification made Fe0.5Ni0.5S/PANI a more feasible option as a material for energy storage applications.

3.3. EDS Elemental Mapping

The elemental area mapping of Fe0.5Ni0.5S and Fe0.5Ni0.5S /PANI is shown in Figure 4, via the use of EDS analysis. It is inferred that the synthesis is successful due to the homogeneity of elemental dispersion, which contributed to enhancing electrochemical performance.

3.4. EDS Spectra

The EDX spectra provides elemental composition analysis, with the different curves representing the elements detected in each sample. In Figure 5a for Fe0.5Ni0.5S, the EDX spectrum confirms the presence of iron, nickel, and sulfur, indicating their presence in the material made. There are some extra peaks due to the conductive coating for sample preparation purposes. The EDX spectrum in Figure 5b for Fe0.5Ni0.5S/PANI has additional peaks corresponding to carbon and nitrogen, which confirms the presence of polyaniline, which successfully verifies its incorporation, expected to enhance its electrochemical properties.

3.5. CV Curves

The analysis encompassed scan rates from 2 to 50 mV/s. The sample of Fe0.5Ni0.5S (P1) had redox peaks representing faradaic processes occurring on the cyclic voltammogram in Figure 6a. Consequently, the oxidation peak for P1 was at 30.29 mA and the reduction peak was −23.25 mA at 10 mv/S. For Fe0.5Ni0.5S/PANI (P2) at 10 mV/s, the oxidation peak was 38.55 and reduction peak was −30.47 in Figure 6b. Furthermore, a notable increase in the area under the curve was observed, reflective of an increase in capacitance. The shape of the curve indicated hybrid behavior, with the lower region of the curve representing EDLC-like behavior and the above region indicating pseudocapacitive behavior. To facilitate a comparative analysis of these values, a visual representation is provided in Figure 6c.

3.6. GCD Profiles

The GCD profiles in Figure 7a,b reveal the characteristics of electrodes through 0.5–4 A/g current densities in a 0–0.5 potential window. Moreover, there is a notable increase in the discharge time from 72 s to 159 s. P2 exhibits a significantly extended discharge duration and a shallower discharge curve slope compared to P1, signifying a higher specific capacitance and lower equivalent series resistance (ESR), respectively. As a result, the specific capacitance was determined at the scan rate of 10 mV/s and calculated by using Equation (3), and the values were as follows 51.42 F/g for P1 and 113.5 F/g for P2.

3.7. Nyquist Plots

Electrochemical impedance spectroscopy (EIS) tests provide precise and quantitative information about important electrode characteristics, particularly electrical resistance. The electrochemical impedance spectroscopy (EIS) results presented in Figure 8 reveal that both the solution resistance (Rs) and charge transfer resistance (Rct) for electrodes P1 and P2. This lower resistance suggests the formation of highly conductive interface between the electrode materials and the electrolyte, implying negligible ohmic drop and instantaneous electron transfer kinetics. Consequently, the observed impedance behavior is dominated solely by the Warburg impedance (W), indicating that the electrochemical process is primarily controlled by the diffusion of ions. The significantly higher Warburg impedance observed for P2 (W = 5.442 Ω) compared to P1 (W = 1.595 Ω) highlights a substantial difference in diffusion characteristics, with P2 exhibiting slower diffusion or longer diffusion paths.

4. Conclusions

In this study, the synthesis and characterization of FeNiS and FeNiS/PANI provided insights into their electrochemical performance. The SEM images showed conductive pathways in the FeNiS/PANI composite, enabling effective charge transport, while XRD analysis validated the material’s phases and crystallinity. Additionally, the specific capacitance and energy performance were significantly improved and the discharge time more than doubled for the composite (P2). Cyclic voltammetry showed a larger area of curve indicating increased specific capacitance for FeNiS/PANI. PANI’s addition increased overall electrochemical activity by improving electron transport. FeNiS/PANI is a promising material for advanced energy storage applications due to these effects, leading to higher specific capacitance and longer discharge duration.

Author Contributions

Conceptualization, A.S., Y.S., and M.A.M.; methodology, A.S.; software, A.S. and Y.S.; writing—original draft preparation, A.S., Y.S., and M.A.M.; writing—review and editing, A.S., Y.S., and M.A.M. supervision, M.A.M. All authors have read and agreed to the published version of the manuscript.

Funding

We thank the GIK Institute and HEC (NRPU Project No. 16196) for their financial support.

Institutional Review Board Statement

Not applicable.

Informed Consent Statement

Not applicable.

Data Availability Statement

Data will be made available by the first author upon reasonable request.

Conflicts of Interest

The authors declare no conflicts of interest.

References

  1. Reenu; Sonia; Phor, L.; Kumar, A.; Chahal, S. Electrode materials for supercapacitors: A comprehensive review of advancements and performance. J. Energy Storage 2024, 84, 110698. [Google Scholar] [CrossRef]
  2. Hamayun, U.; Marwat, M.A.; Abdullah, S.M.; Ullah, R.; Humayun, M.; Bououdina, M.; Karim, M.R.A.; Khan, M.Z.; Hanif, M.B. Synergistic integration of Ag@Fe0.67Cu0.22Co0.11S core-shell nanostructures and SWCNTs for improved supercapacitor performance. J. Alloys Compd. 2025, 1012, 178422. [Google Scholar] [CrossRef]
  3. Shariq, M.; Alhashmialameer, D.; Adawi, H.; Alrahili, M.R.; Almashnowi, M.Y.; Alzahrani, A.; Sharma, M.; Ali, S.K.; Slimani, Y. Advancements in transition metal sulfide supercapacitors: A focused review on high-performance energy storage. J. Ind. Eng. Chem. 2025, 144, 269–291. [Google Scholar] [CrossRef]
  4. Marwat, M.A.; Ishfaq, S.; Adam, K.M.; Tahir, B.; Shaikh, M.H.; Khan, M.F.; Karim, M.R.A.; Din, Z.U.; Abdullah, S.; Ghazanfar, E. Enhancing supercapacitor performance of Ni–Co–Mn metal–organic frameworks by compositing it with polyaniline and reduced graphene oxide. RSC Adv. 2024, 14, 2102–2115. [Google Scholar] [CrossRef] [PubMed]
  5. Liu, L.; Li, H.; Jiang, S.; Zhao, Q.; Jiang, T. Design of high-performance transition metal sulfide electrode materials and its application in supercapacitors. J. Power Sources 2024, 606, 234560. [Google Scholar] [CrossRef]
  6. Marwat, M.A.; Zhang, H.; Humayun, M.; Xie, B.; Ashtar, M.; Bououdina, M.; Rehman, M.U.; Ishfaq, S. High discharge energy density in rationally designed graphene oxide@zinc oxide/polymer blend-polyetherimide heterostructured bilayer nanocomposites. J. Energy Storage 2024, 79, 110125. [Google Scholar] [CrossRef]
  7. Yan, J.; Lu, J.; Sheng, Y.; Sun, Y.; Zhang, D. Research Progress in the Preparation of Transition Metal Sulfide Materials and Their Supercapacitor Performance. Micromachines 2024, 15, 849. [Google Scholar] [CrossRef] [PubMed]
  8. Marwat, M.A.; Khan, M.F.; Humayun, M.; Ali, S.; Karim, M.R.A.; Shah, S.S.; Bououdina, M.; Din, Z.U.; Adam, K.M.; Abdullah, S.M. Novel NiCoMn MOFs/Ag citrate nanocomposites for high-performance asymmetric supercapacitor applications. Electrochim. Acta 2025, 511, 145373. [Google Scholar] [CrossRef]
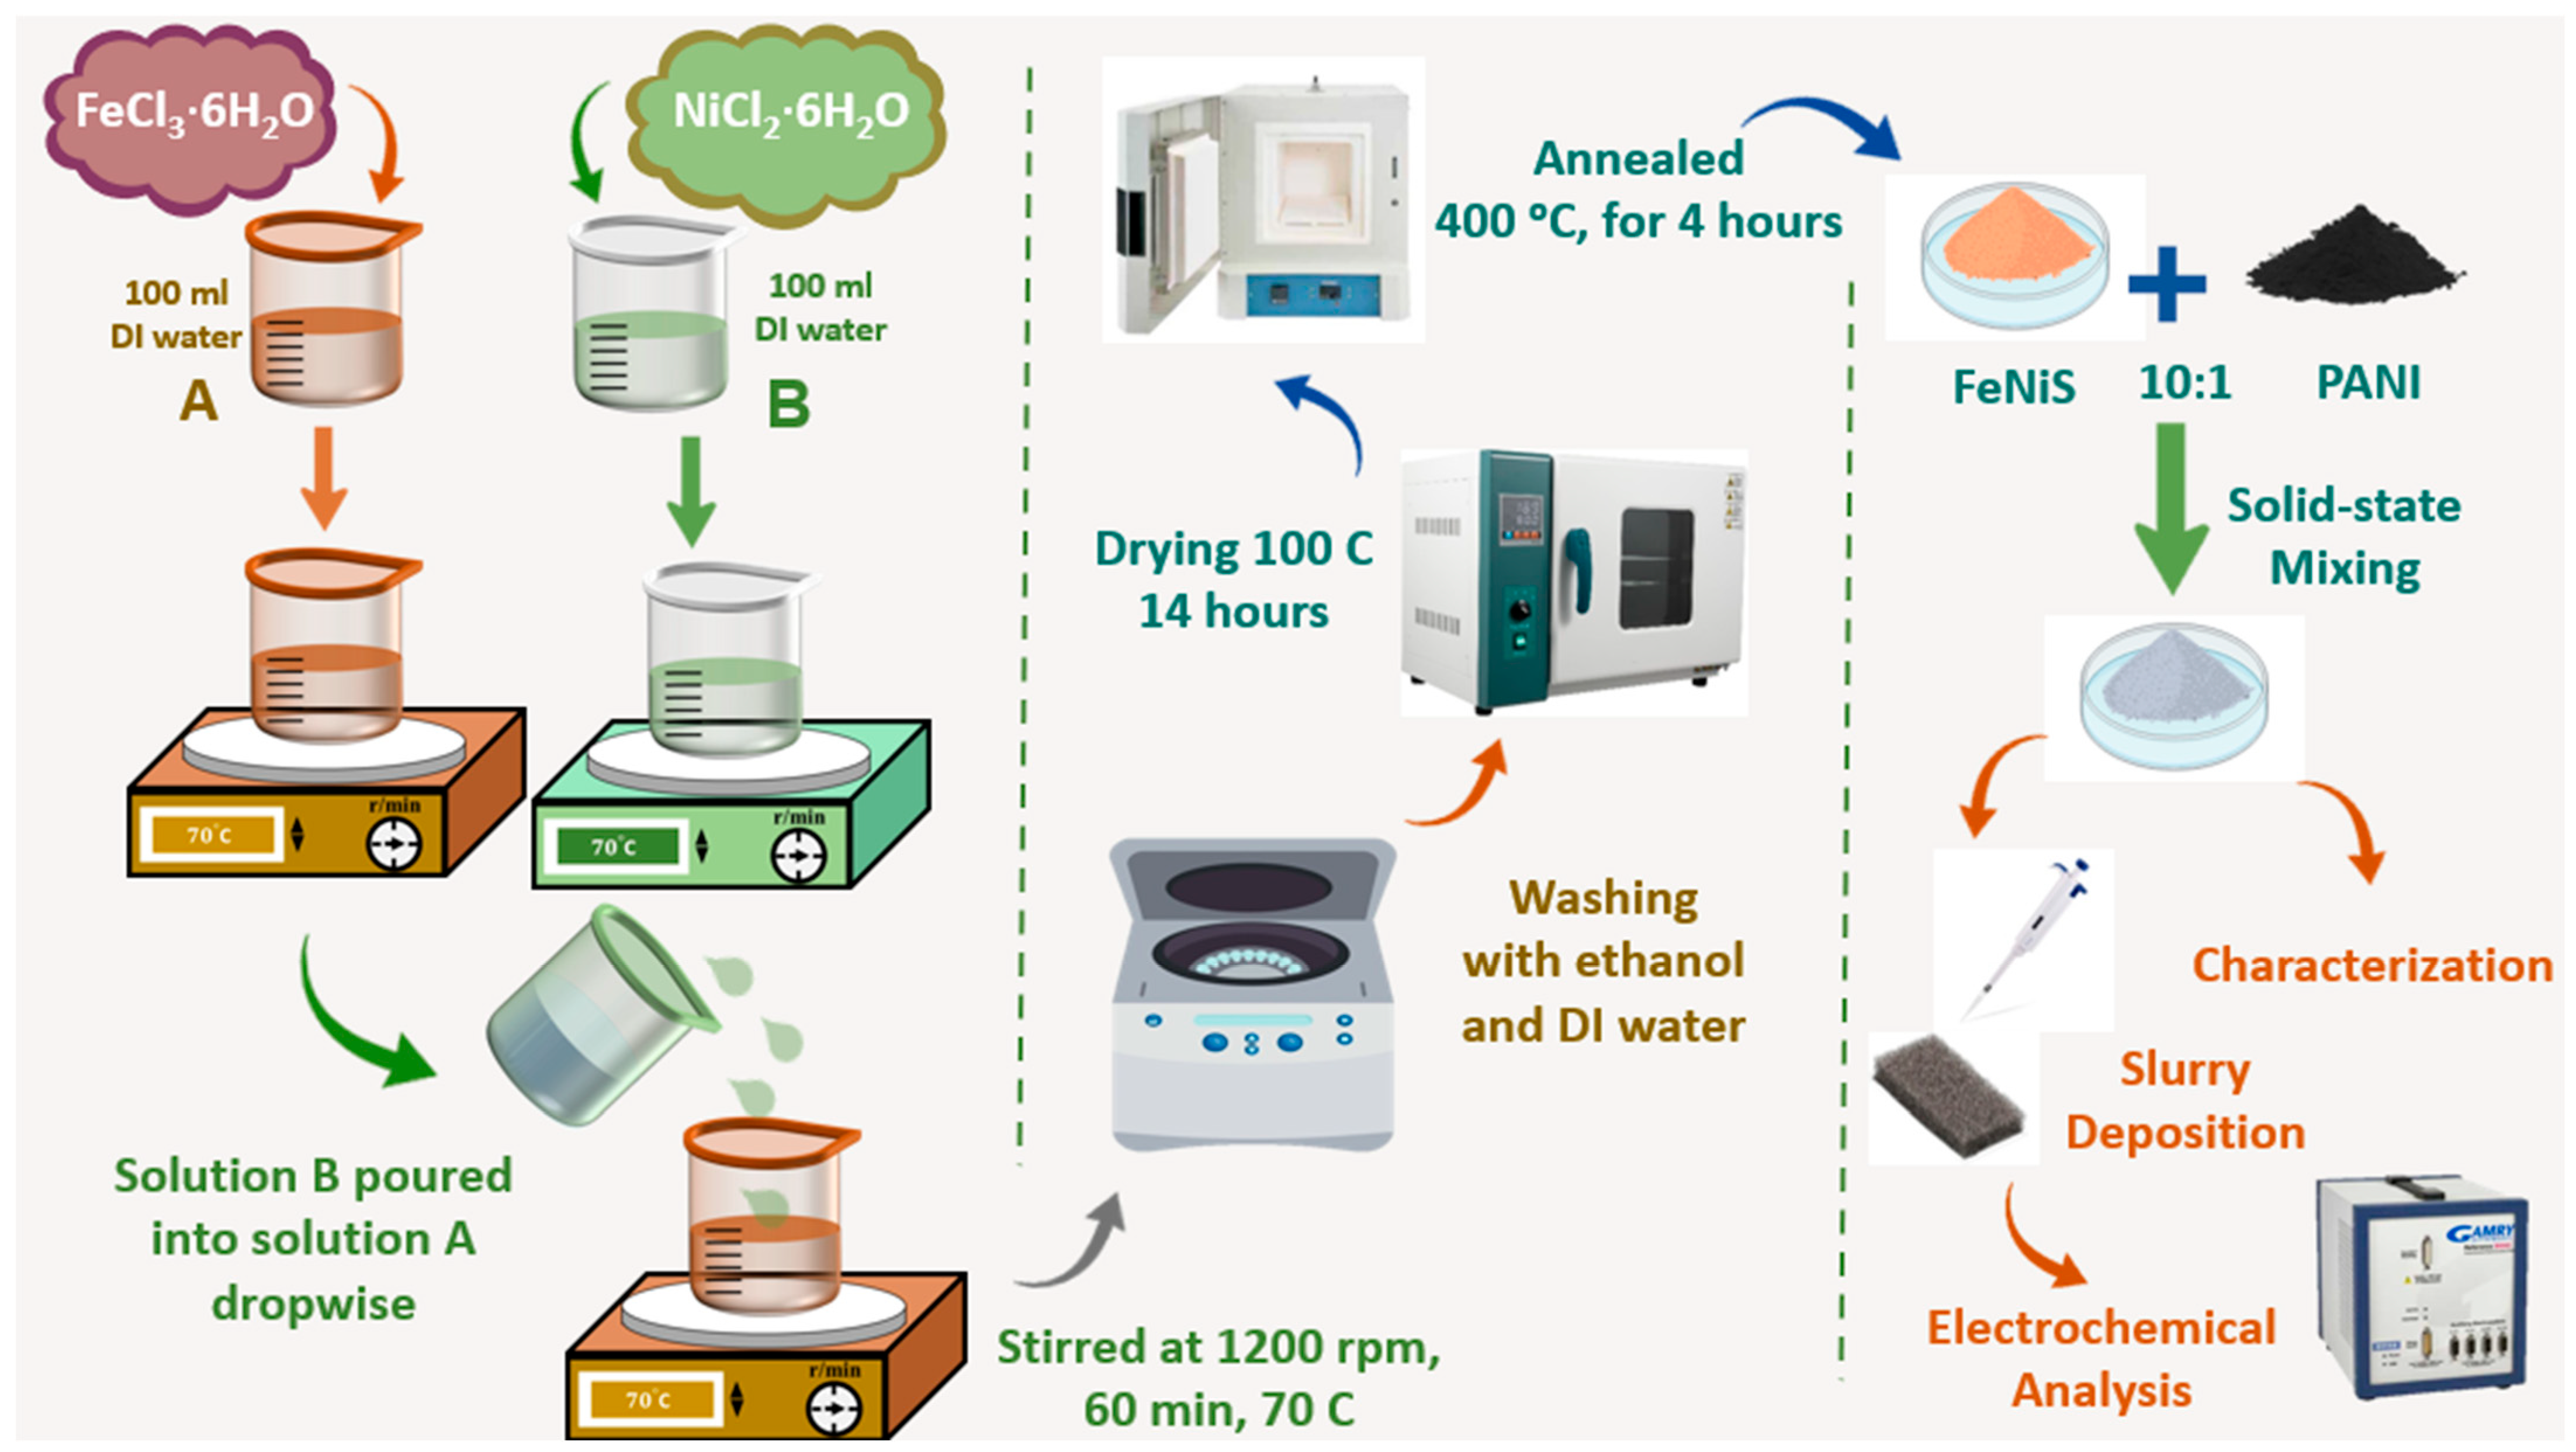
Figure 1. Methodology to synthesize Fe0.5Ni0.5S/PANI.
Materproc 23 00022 g001
Figure 2. XRD spectra of (a) Fe0.5Ni0.5S and (b) of Fe0.5Ni0.5S.
Materproc 23 00022 g002
Figure 3. SEM micrographs at various magnifications Fe0.5Ni0.5S (ad) and Fe0.5Ni0.5S/PANI (eh).
Materproc 23 00022 g003
Figure 4. EDS mapping of Fe0.5Ni0.5S (a1d1) and Fe0.5Ni0.5S/PANI (a2f2).
Materproc 23 00022 g004
Figure 5. EDS spectra of (a) Fe0.5Ni0.5S and (b) Fe0.5Ni0.5S/PANI.
Materproc 23 00022 g005
Figure 6. CV curves from 2 to 50 mv/s for (a) Fe0.5Ni0.5S (P1) and (b) Fe0.5Ni0.5S/PANI (P2) and (c) comparative plot of P1 and P2.
Materproc 23 00022 g006
Figure 7. Discharge curves at various sweep rates of (a) Fe0.5Ni0.5S and (b) Fe0.5Ni0.5S/PANI and (c) comparative plot of P1 vs. P2.
Materproc 23 00022 g007
Figure 8. Nyquist plots obtained over a range of frequencies for (a) FeNiS and (b)FeNiS/PANI. (c) Comparison of FeNiS and FeNiS/PANI Nyquist plots.
Materproc 23 00022 g008
Table 1. The mass of iron and nickel sources used in synthesis.
SourceMass
Iron 2.97 g of ferric chloride hexahydrate (FeCl3·6H2O)
Nickel 2.62 g of nickel chloride hexahydrate (NiCl2·6H2O)
Disclaimer/Publisher’s Note: The statements, opinions and data contained in all publications are solely those of the individual author(s) and contributor(s) and not of MDPI and/or the editor(s). MDPI and/or the editor(s) disclaim responsibility for any injury to people or property resulting from any ideas, methods, instructions or products referred to in the content.