Proceeding Paper

Design and Performance Optimization of Battery Pack with AI-Driven Thermal Runaway Prediction †

by
Jalal Khan
1,
Sher Jan
1,
Sami Ifitkhar
2,
Ajmal Yaqoob
2,
Ubaid Ur Rehman
3,
Taqi Ahmad Cheema
1,
Shahid Alam
2 and
Usman Habib
4
1
Faculty of Mechanical Engineering, Ghulam Ishaq Khan Institute of Engineering Sciences and Technology, Topi, Swabi 23460, Pakistan
2
Faculty of Electrical Engineering, Ghulam Ishaq Khan Institute of Engineering Sciences and Technology, Topi, Swabi 23460, Pakistan
3
DICE Energy and Water Unit, DICE Foundation USA, Canton, MI 48000, USA
4
Faculty of Engineering Sciences, Ghulam Ishaq Khan Institute of Engineering Sciences and Technology, Topi, Swabi 23460, Pakistan
Presented at the 3rd International Conference on Modern Technologies in Mechanical & Materials Engineering (MTME2025), Topi, Pakistan, 16–17 April 2025.
Mater. Proc. 2025, 23(1), 17; https://doi.org/10.3390/materproc2025023017
Published: 8 August 2025

Abstract

Battery thermal management is a critical factor in ensuring the performance, safety, and longevity of electric vehicle (EV) battery packs. This study investigates the effectiveness of a forced air convection cooling system, optimized cell spacing and suitable configuration in maintaining optimal battery cell temperatures. A 3D computational model was developed to analyze the temperature distribution of a battery pack under varying airflow velocities, cell spacings and configurations. The numerical simulations were validated through experimental testing, demonstrating a strong correlation between simulated and measured results. The findings reveal that with a 2 m/s velocity of the fan, the battery’s maximum temperature is reduced by 7% compared to the case of natural convection, while the fan consumed only 4% of the battery pack available capacity. An AI algorithm was trained on the experimental data obtained to perform data-driven predictions of failures. The results provide valuable insights for optimizing air cooling systems in EV applications. Future work will explore the effect of non-uniform air flow distribution in reducing the risk of thermal runaway and avoiding hot spots in the battery pack for optimal performance.

1. Introduction

Thermal condition management of batteries is critical to lithium-ion (Li-ion) battery performance, safety, and longevity, particularly in high-power applications like electric vehicles (EVs). Due to their high energy density, extended lifespan, and minimal natural decay characteristics, Li-ion batteries function as the main choice for EV power storage systems. Nevertheless, their performance and reliable operation rely heavily on the heat evolved in charge and discharge modes. The literature shows that capacity degradation of Li-ion batteries is accelerated once temperatures exceed 40 °C, with the risk of thermal runaway—a condition where runaway reactions are initiated by overheat—increasing the battery pack temperatures dramatically above 60 °C [1]. Furthermore, even when thermal runaway is prevented, temperature cycling in a battery module leads to non-uniform aging rates in individual cells, ultimately endangering both performance and longevity [2]. Thus, a highly efficient battery thermal management system (BTMS) is essential in minimizing risk of temperature variations and maintaining uniform heat distribution across the battery cells. Different cooling approaches have been explored in battery systems, including liquid cooling, phase-change materials (PCMs), and air cooling, each with strengths and weaknesses. While liquid cooling is very efficient, it is linked with high costs, complexity, and significant weight additions to battery modules, which makes it less attractive for compact electric vehicle (EV) battery designs. Phase-change materials (PCMs) are effective in passive heat absorption; however, they are prone to encounter low thermal conductivity and long-term stability issues [3]. Due to its cost, simplicity, and low energy consumption, air cooling is one of the most widely used BTMS solutions in EV applications [4].
Air cooling is advantageous but also has some major issues, particularly when batteries are being heavily used, resulting in a substantial amount of heating. Natural or forced air is used by air-cooled systems to shed heat, but natural air alone is generally insufficient for high-power battery packs. This can lead to overheating of parts of the batteries and uneven temperatures [5]. Forced air cooling utilizes fans or blowers to facilitate the removal of heat better, and its improvement has been widely explored by research all over the world. Researchers have examined the air flow rates, optimized design of cooling channels, and explored positioning of the fan to improve the performance of an air-cooled BTMS. An uneven airflow can generate different temperatures in battery packs, which can influence its performance [6]. Research indicates that making the air flow can quickly reduce the peak temperatures by as much as 23%, but excessive airflow can consume more power and reduce cooling efficiency, so the optimization of BTMS is required for this trade-off [7].
In addition to the air flow approach, the battery pack design itself also plays a critical role in cooling. The distance between cells, arrangement of cells being stacked in series or in parallel, and material used for the exterior casing all influence the dissipation of the heat. Earlier research indicates that creating more distance between cells can increase cooling by 6.5%, but excess distance can cause battery modules to become larger and more difficult to fit into EVs [3,7]. Also, using outer casing materials which are better suited for heat-conductivity can allow heat to naturally escape, which reduces the need for active cooling strategies. Among the key influences on heat generation within batteries is the discharge rate, which dictates the rate of energy extraction from the battery. Increasing discharge rates promote increased internal resistance losses, resulting in excess heat that needs to be efficiently eliminated to prevent overheating. In previous research, it has been shown that a battery’s surface temperature rises as much as 45% with a change in discharge rate from 1 C to 2 C, corresponding to the excessive thermal stress brought about by high-power demands [8]. While most prior research has highlighted the thermal behavior of batteries for moderate discharge rates (typically less than 1.5 C), relatively limited research has explored the performance of forced air cooling under heavy discharge conditions (≥2 C), where conventional air-cooling techniques may prove inadequate in maintaining safe operating temperatures [1].
In this study, we aim to bridge these research gaps by improving the performance of a fan-cooled air-cooled BTMS under a 1.5 C discharge rate. Our investigation experimentally compares the impact of battery pack configuration, airflow optimization, and casing material selection on cooling performance, particularly in high-power applications where effective heat removal is critical. Unlike previous studies focused primarily on moderate discharge conditions, this study provides real-world assessment of forced air cooling under demanding operating conditions. The findings of this study justify further development of compact, efficient, and cost-effective air-cooled BTMS solutions for future EV battery systems, with improved thermal stability and battery life in high-performance applications.

2. Literature Review

The optimal performance, protection and durability of Li-ion batteries in electric vehicles (EVs) demands effective thermal condition management systems. High temperatures can result in a loss of performance, increased internal resistance, and severe issues like thermal runaway. Lightning and cycling through energy outside the optimum temperature range of 15 °C to 40 °C yields unfavorable results. Research indicates that a temperature shift within a battery pack exceeding 10°C has the potency to accelerate aging processes and cause a decrease in cycle life by close to 50%, which highlights the significance of advanced cooling systems [9].
The designed BTMS utilizes air cooling as a distinctive method because it provides effective cooling while requiring minimal energy expenditure and construction complexity compared to liquid cooling systems. The forced air cooling performs exceedingly well while uniformly dispersing and equalizing the battery pack temperature, with routinely maintaining high discharge rates. Various criteria, for example, the air flow rate, the position of the fan, the configuration of the cooling ditch, and the structure of the battery pack, set adiabatic boundaries of cooling effectiveness. This section covers major developments in air cooling methods, the effect of battery pack design on thermal management, and the effect of high discharge rates on cooling effectiveness.

2.1. Air Cooling Methods for Battery Thermal Control

Air cooling methods can either operate via natural or forced convection. Forced convection cooling is suitable for ease and can be energy efficient; however, it has a low heat transfer coefficient which does not provide sufficient energy for high power output scenarios. Studies have shown that when relying on natural convection in isolation, the battery components become systematically overheated after enduring high discharge currents due to overheating and insufficient temperature diversity [10]. Unlike conventional methods, forced air cooling does not employ blowers or fans; instead, it passively ventilates the rechargeable batteries by actively blowing air over the battery cells to improve overall convection cooling. Forced air cooling design relies on multiple features such as air flow patterns, directions, velocities, and target zones. Several researchers have focused their interests on the perpendicular diverging and converging air stream zones that increase the thermal energy outflow from the component. In battery modules, the fan position and airflow direction of vertical battery cooling modules can have a significant effect [11]. Top–down airflow provides the best results due to a large increase in temperature uniformity. Likewise, analysis of different air inlet and outlet locations confirms that staggered inlets increases the cooling efficiency at the same time when airflow resistance was reduced [12]. Through CFD simulations, an increasing airflow velocity from 2 m/s to 5 m/s resulted in a 23% decrease in peak battery temperatures, thus underlining the significance of optimizing steam and airflow velocity for load thermal management [13].
While forced air cooling has been effective, its design can impact the performance of a BTMS. Improper airflow can cause hotspots and individual battery cells may become much hotter than neighboring cells, which may lead to uneven aging and capacity loss. Thus, the need is to ensure that all battery cells are capable of dissipating heat equally through the integration of optimized ventilation channels and cooling paths within the battery modules.

2.2. Effect of Battery Pack Design on Thermal Management Effectiveness

Battery pack configuration is a critical thermal management aspect as the position and spacing of the cells affect the ease of heat dissipation. Cell-to-cell thermal conduction, air flow circulation, and contact resistance all affect cooling performance, and therefore battery configuration is a key design parameter in air-cooled BTMS design. It has been demonstrated that thermal performance of cylindrical battery module improves by 6.5% when cell spacing is increased from 0 to 4 mm because of better airflow circulation through the cells [14]. However, excessive spacing increments may result in larger module sizes, which could be inadmissible for compact EV battery design. In addition, comparison of different battery pack configurations like honeycomb, rectangular, and staggered arrangements showed that honeycomb arrangement provided the most even temperature distribution due to optimized airflow channels [15]. A study on impact of battery connections in series and in parallel on thermal properties revealed that parallel arrangements provided lower temperature gradients, thereby improving thermal balance within the module [16].
These studies emphasize that battery pack structure needs to be well-engineered in a manner where airflow distribution is maximized, thus improving the cooling performance. Modules that are not well designed tend to have trapped heat between adjacent cells, potentially elevating the risk of thermal runaway. Ventilation paths, cell orientation, and cell-to-cell distance are thus critical components in designing a high-performance air-cooled BTMS.

2.3. Effect of High Discharge Rates on Thermal Regulations

The battery temperature increases directly with the discharge rate because high discharge rates lead to higher internal resistance losses and increased heat generation. At high discharge, the battery cells experience high levels of energy conversion, and this raises thermal stress and the possibility of overheating. The relationship between the temperature increases and the rate of discharge has been studied regarding the effectiveness of air cooling for high-power applications. The surface temperature of the battery rises 45% when transitioning from 1 C to 2 C discharge rate but exhibits a non-linear temperature increase during discharge. Above a discharge rate of 2 C, a simple air cooling design on its own is not adequate due to natural convection [17]. The excessive temperature increases from discharge rates in excess of 2 C need to be controlled by using specially designed air-cooling channels with high flow rates to avoid overheating the system. Furthermore, an assessment of the effect of high discharge rates on the thermal uniformity of battery modules found that patterned higher discharge rates lead to higher imbalance in temperatures of the module cells, generating a higher risk for localized overheating. From the results, an increased air flow speed, better positioned fans, more advanced case structures with high thermal conductivity for heat sinks, and improved cooling systems were suggested to be mandatory for high-discharge applications [18].
Since this work is performed at 1.5 C discharge rate, it is a real-world assessment of forced air cooling under heavy duty operating conditions. Although earlier research has examined each component of air cooling, fewer have examined combined effects of battery pack configuration, airflow strategies, and discharge rate under such severe thermal loads, which is the main contribution of this work. Previously reported works have mostly been performed at lower discharge rates, whereas this research is performed at a 1.5 C discharge rate per cell, thus being one of the few examining forced air-cooling effectiveness under such high-energy demands. By examining the interaction of airflow optimization, battery pack design, and thermal control, this research helps to improve air-cooled BTMS performance in high-power EV applications and provides useful insight into optimizing compact and efficient BTMS.

2.4. Effect of Busbars Material on Battery Thermal Performance

In an EV battery, busbars play a critical role in ensuring efficient power distribution within the battery pack, directly impacting electrical resistance, heat generation, and thermal management. The material, thickness, and length of the busbar significantly affect energy losses, particularly during high-current discharges. Copper (Cu) and aluminum (Al) are widely used in EV battery busbars due to their low resistivity and high conductivity. However, alternative materials such as nickel (Ni), titanium (Ti), stainless steel, and graphene-based conductors are also being explored to enhance performance, reduce weight, and minimize connection resistance issues in high-power battery packs. Busbar thickness and length influence resistance and power dissipation. A longer busbar increases resistance, leading to higher voltage drop and greater heat generation. Conversely, a thicker busbar reduces resistance, improving current-carrying capacity and lowering energy losses. However, in EV applications, increasing thickness adds weight, which affects vehicle efficiency and range. Therefore, the cross-sectional area of the busbar requires optimization because it directly affects conductivity and both weight and heat dissipation rates. The choice of material also affects connection resistance, which arises at the interface between busbars, battery terminals, and interconnects [19]. Poor electrical contact leads to localized heating, accelerating thermal degradation and increasing battery aging. Figure 1 summarizes the key considerations in design of busbars as a current collector for an EV battery.
Figure 2 shows a comparative analysis of copper and aluminum busbars in a 3s3p battery pack (consisting of MKEPA 18650 3.7 V 2550 mAh Lithium-ion ICR cells from China) configuration conducted using MATLAB (R2024a) simulations to evaluate voltage drop, power loss, and temperature rise. The results indicate that aluminum busbars exhibit higher voltage drop, power loss, and temperature rise compared to copper due to their higher electrical resistivity and lower thermal conductivity. As seen in the simulation results, copper busbars effectively reduce resistive losses and maintain a lower operating temperature, making them a superior choice for efficient thermal and electrical management in high-power applications. This study underscores the importance of material selection in optimizing the performance and longevity of battery packs in electric vehicles.
The analysis of busbar materials in a 3s3p square battery configuration reveals significant differences between copper and aluminum in terms of electrical and thermal performance. The voltage drop across the aluminum busbar is noticeably higher compared to copper due to its greater resistivity, leading to increased power losses and reduced efficiency in the battery pack. Additionally, aluminum exhibits a significantly higher temperature rise under the same discharge conditions, as seen in the comparison graph, which can lead to thermal management challenges. While aluminum remains a cost-effective and lightweight alternative, copper is the superior choice for minimizing energy losses and maintaining thermal stability in EV battery systems, making it the preferred option where performance outweighs cost concerns. The detailed properties of different materials to be used as busbars are mentioned in Table 1.

2.5. Thermal Runaway in Lithium-Ion Batteries

The main challenge in lithium-ion battery systems emerges from thermal runaway, which creates a self-sustaining failure process that activates fast exothermic reactions leading to gas venting and fire and explosion risks. This occurs when a battery cell’s internal temperature exceeds a critical threshold, typically between 120 and 150 °C, leading to the uncontrolled breakdown of key battery components. Studies show that once a single cell enters thermal runaway, the heat spreads within milliseconds, increasing the risk of a chain reaction across battery packs [20,21].
AI and machine learning have proven to become essential tools which detect thermal runaway along with its prevention mechanisms. By analyzing real-time sensor data, ML models can identify early warning signs such as unusual temperature spikes, voltage fluctuations, and rising internal resistance. Advanced algorithms like XGBoost and neural networks have demonstrated high accuracy in predicting thermal anomalies before traditional sensors can detect them [22]. AI-powered fault detection systems can trigger pre-emptive cooling measures or isolate failing cells, reducing the chances of failure spreading. Additionally, AI-based state-of-health (SOH) models continuously track battery degradation, allowing for dynamic cooling adjustments to minimize risks [23]. Integrating AI-driven thermal prediction models with real-time BTMS can significantly improve battery safety and reliability. Future advancements, such as embedded AI chips for onboard fault detection and automated response mechanisms, could revolutionize EV battery safety by reducing failure rates and enhancing thermal stability.

3. Methodology

This research implements both battery pack simulation and experimental setup validation to test its findings. The experimental platform intends to evaluate how well air-cooling controls temperature levels of 18650 lithium-ion battery cells.

3.1. Simulation of the Battery Module

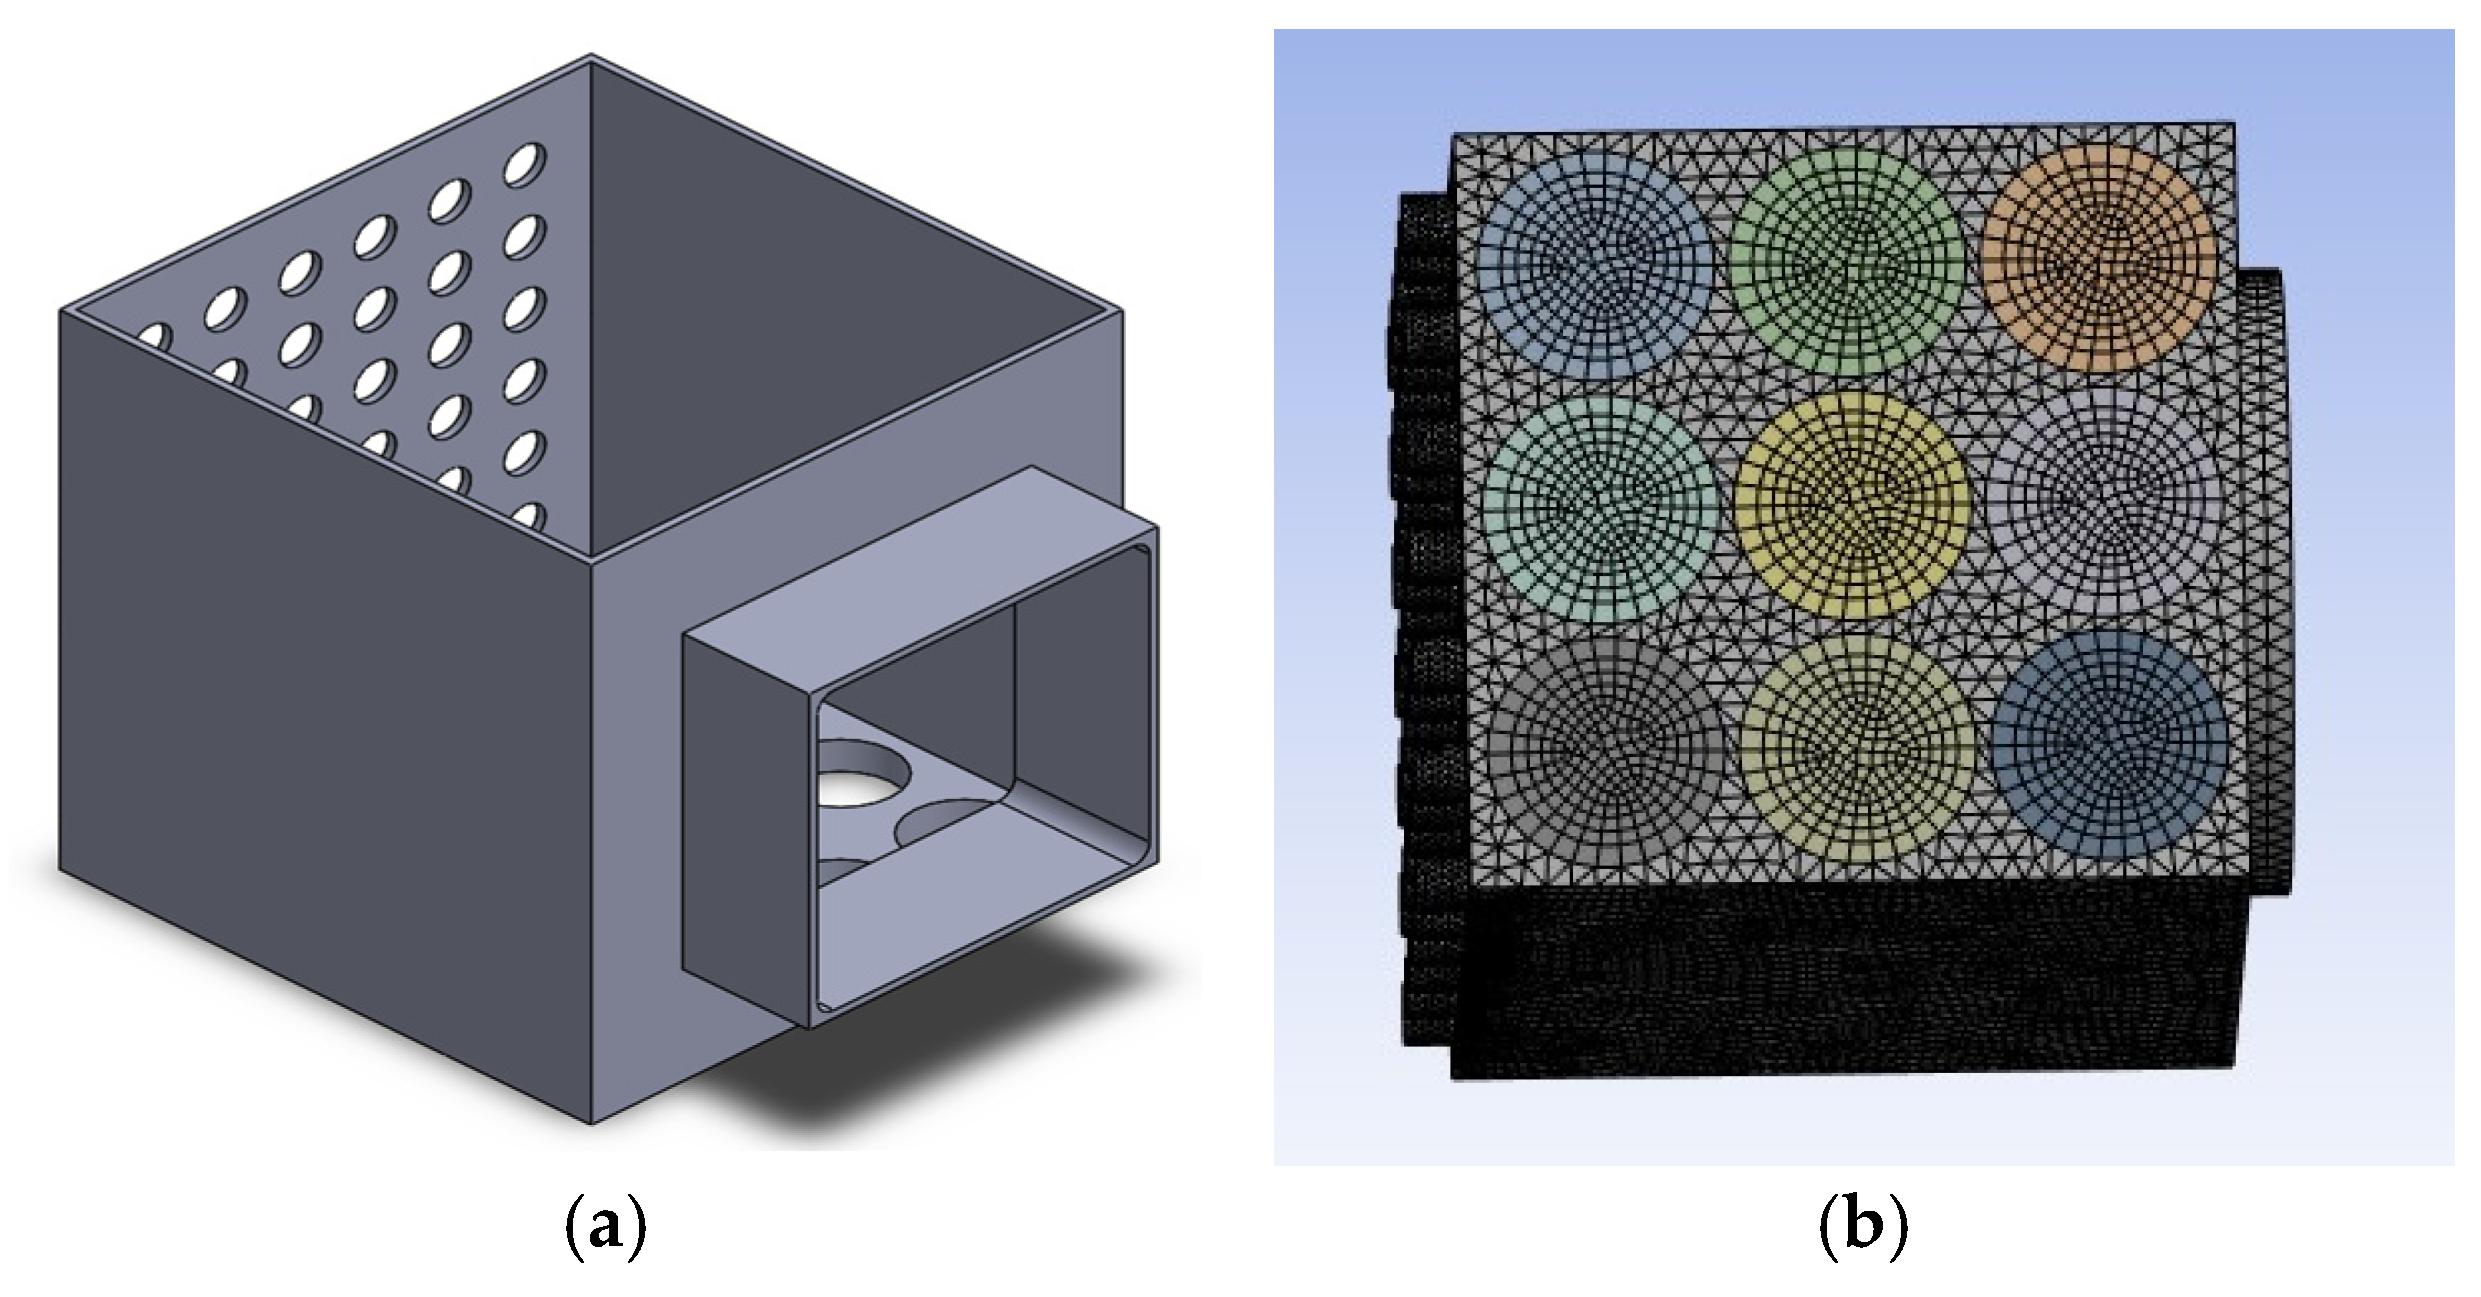
This study utilized ANSYS (2024 R1) software to conduct battery module simulation and perform surface temperature distribution analysis. Both simulation results underwent comparison against experimental data that include natural and forced convection measurements. The 3s3p battery pack design along with its casing was designed in SolidWorks (2024 version SP5 release). The CAD design was then imported to ANSYS, and a mesh was generated. Figure 3 shows the isometric view of the battery pack casing and the mesh generated for simulations.

3.2. Governing Equations

While taking u as the air velocity, ρ as the density of air, p as the pressure, μ as the air viscosity, and gi as the considered body force in natural convection, the continuity and momentum equations can be stated as follows [11]
u i x i = 0
ρ u i t + ρ u j u i x j = p x i + μ 2 u i x j 2 + ρ g i
Similarly, the energy equation can be given as follows
ρ C p T t + ρ u j T x j = λ 2 T x j 2 + q ˙
where Cp is the specific heat capacity, λ is the heat generation and the term q ˙ represents the heat generation rate per unit volume in battery cells, expressed as follows:
q ˙ = R I 2 V
where R is the equivalent internal resistance of the battery module, I represents the electrical current, and V is the volume of the battery cells.

3.3. Heat Dissipation Model

An increase in airflow velocity enhances heat dissipation efficiency, and the variations in airflow speeds between cooling channels correspond to temperature difference among battery units. Following assumptions have been used in our model:
  • Each battery cell follows a simplified assumption of uniform temperature distribution, which allows calculation of average temperatures for each unit [12].
  • The physical parameters of battery components are calculated through weighted average methodology [13].
  • Heat exchange occurs solely within the cooling channels, simplifying the model by excluding other interactions between the air and the battery [12].
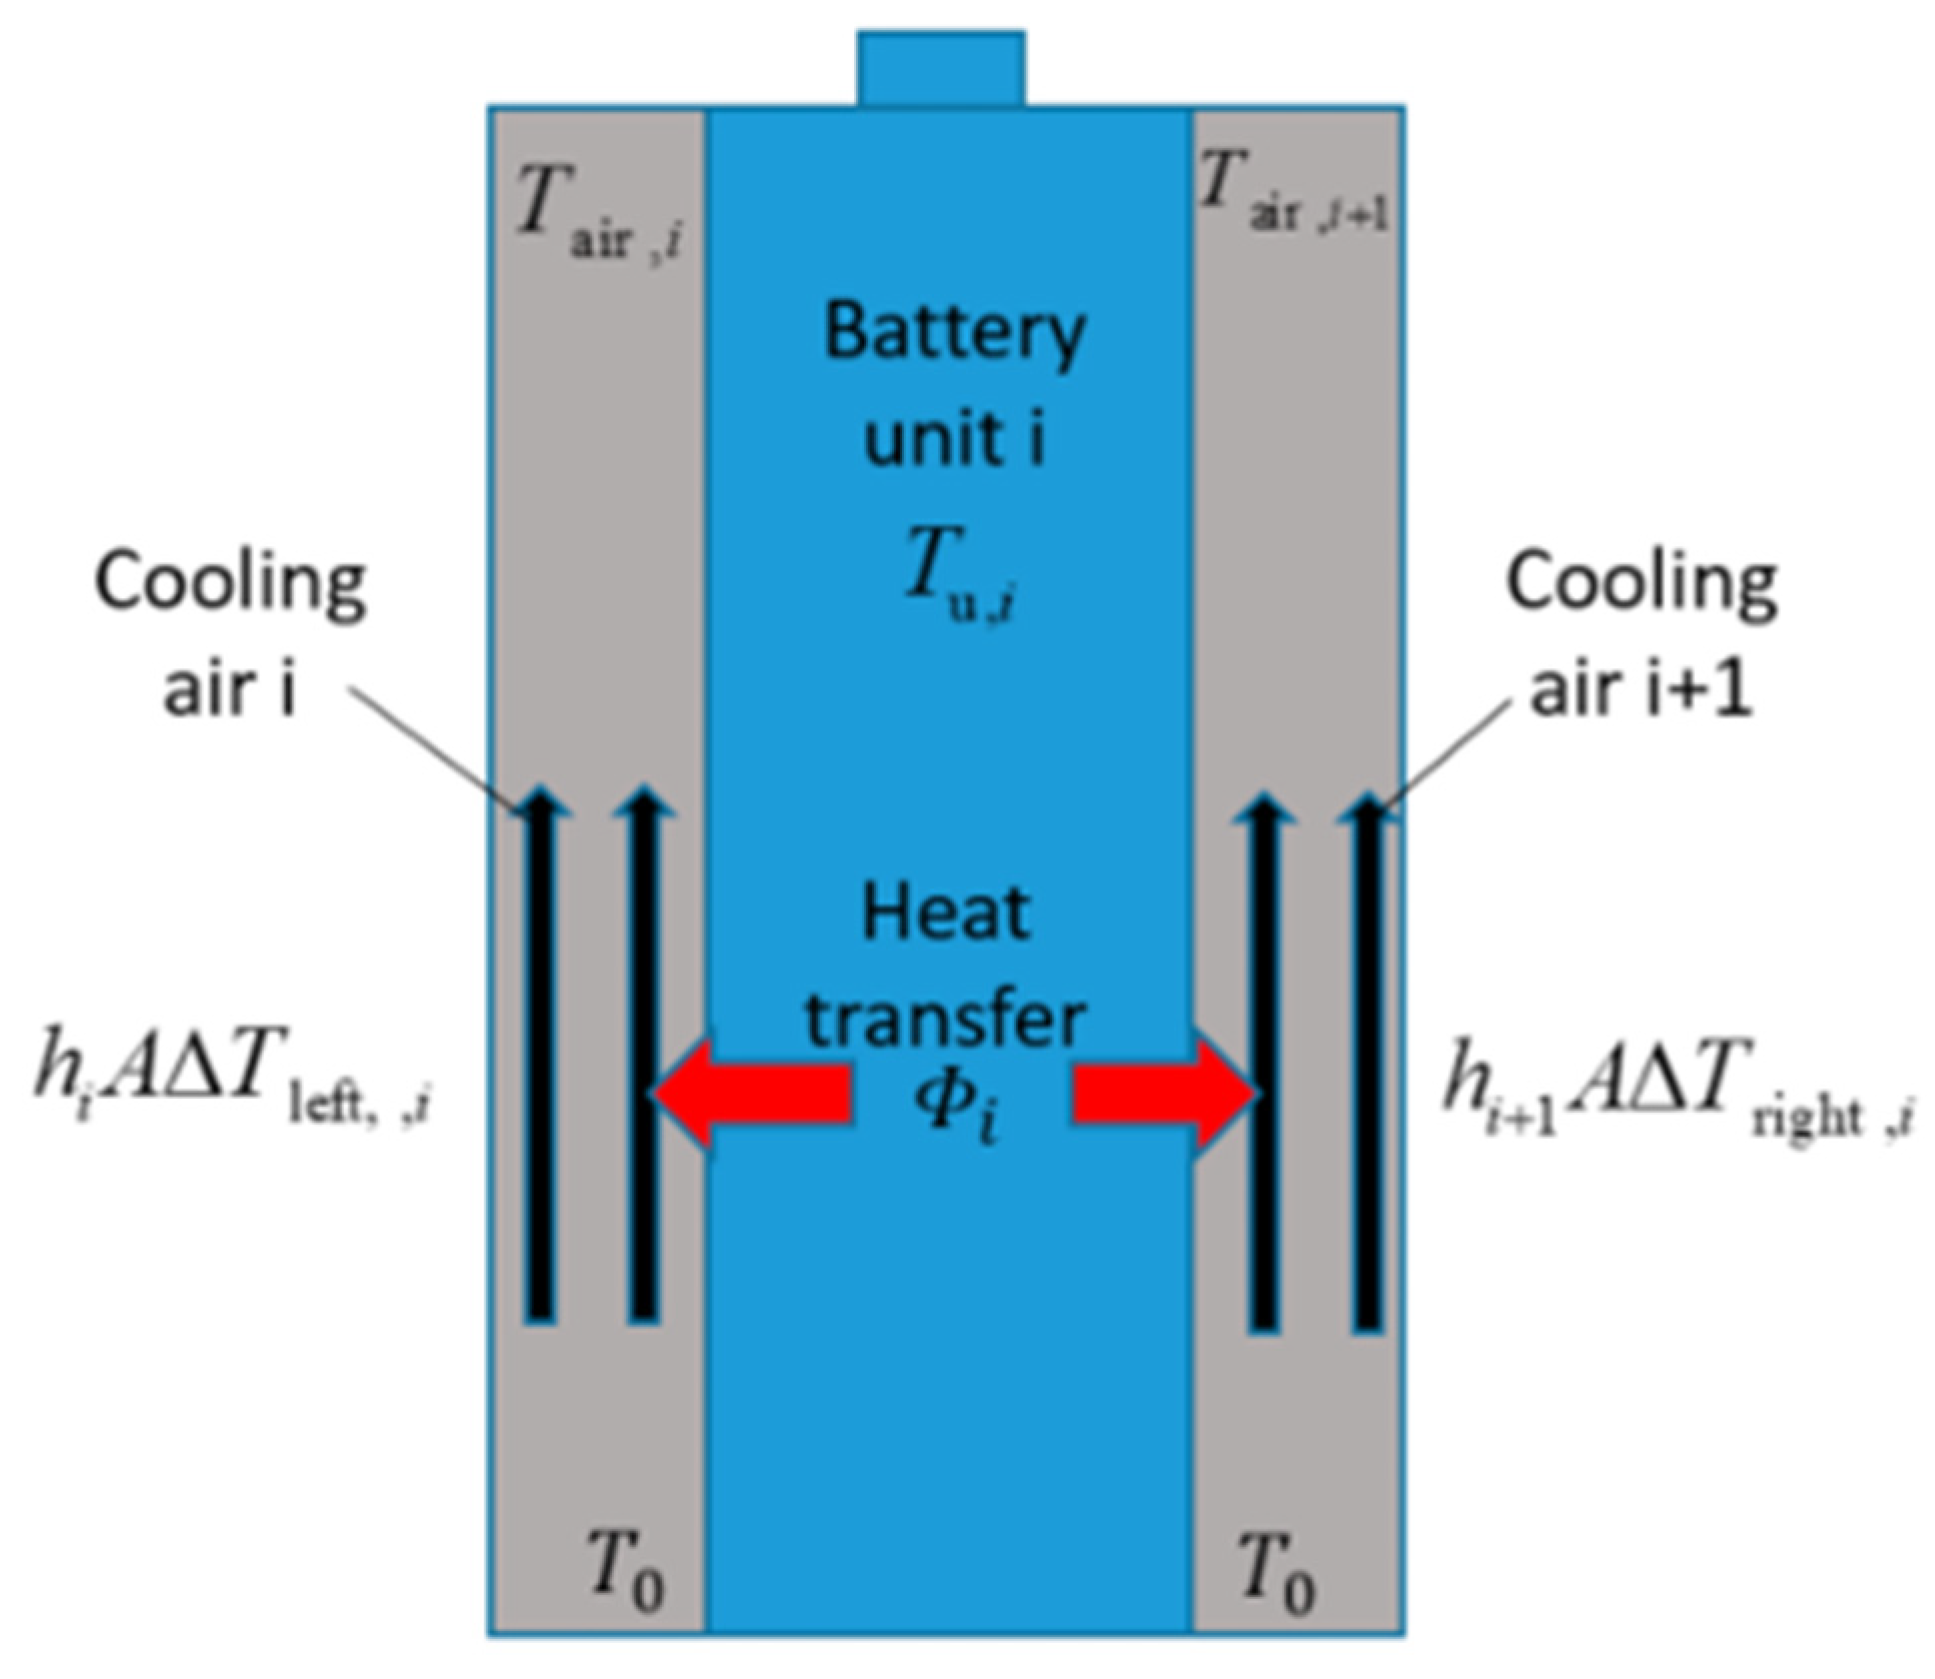
As illustrated in Figure 4, the cooling channel directs incoming air to transport heat produced by the left and right battery unit regions and lowers the battery unit’s temperature.
The governing equations for heat dissipation are as follows [14]:
ϕ i     h i A Δ T l e f t , i + Δ T r i g h t , i = 0
C p , a i r   ρ a i r   Q cc , i T a i r , i T 0 = h i A Δ T l e f t , i + Δ T r i g h t , i
where ϕ i is the thermal power production by the battery unit, h i is the convective heat transfer coefficient between the cooling air and the surface of the battery unit, A is the contact area between the air and the battery unit, Q c c , i is the airflow rate, and Δ T l e f t , i and Δ T r i g h t , i are the temperature difference between the battery unit and both sides of the air. The following logarithmic formulas determine the cooling air temperatures on both sides of the battery unit by measuring the temperature gap between the air and battery unit [14].
  T l e f t , i = T a i r , i T 0 l n T u , i T 0 T u , i T a i r , i
  T r i g h t , i = T a i r , i + 1 T 0 l n T u , i T 0 T u , i T a i r , i + 1
where T u , i , is the volume averaged temperature of the battery unit. The heat transfer coefficient for convection, h , is key to relating the flow resistance model to the heat dissipation model. The Reynolds number (Re) and Prandtl number (Pr) of the air is utilized to calculate the convective heat transfer coefficient, h . The equation for h is as follows [14]:
  h = k a i r d c Y R e y P r 1 / 3
where k a i r is the thermal conductivity of the air, d c is the diameter of the battery cell, Pr is the Prandtl Number of air, and Y and y are empirical parameters.
As Reynolds numbers (Re) increase between 1 and 250,000 both parameters Y and y show a downward trend for Y and upward trend for y . The Y value starts at 0.989 during Re = 1–4 and reaches 0.0266 when Re = 40,000–250,000, while y increases from 0.330 to 0.805 within this same range [14].

3.4. Initial and Boundary Conditions

A laminar flow model was designed for numerical simulation to evaluate how the battery module interacts thermally. The computational domain was discretized into 112,100 nodes and 271,479 elements, with an element size of 2 mm to ensure an optimal balance between accuracy and computational efficiency. The boundary conditions included a specified inlet velocity for the airflow and an outlet pressure condition to maintain flow continuity. The air velocity was set to 1 m/s, 2 m/s, and 3 m/s, and the corresponding maximum temperature values were recorded. The battery cells were modeled with a uniform volumetric heat generation rate of 48,750 W/m3 to replicate real operational conditions [15]. A simulation temperature of 298 K combined with 1 s time steps and 200 maximum iterations per step was used for numerical stability and convergence purposes. These initial and boundary conditions were defined to accurately capture the thermal and flow characteristics of the cooling system.

3.5. AI Model Development

To achieve early warning of thermal runaway, we developed a unified model by combining our in-lab temperature–voltage measurements of a 3s3p lithium-ion battery pack (we sampled at 1 Hz) with the existing mechanically induced thermal runaway dataset of Lin et al. using the XGBoost classifier [23]. Having concatenated the two sources into one CSV file, we engineered five consecutive lags for each raw signal (voltagelag1lag5, temperaturelag1lag5) and dropped all rows with empty entries to obtain ten time-history predictors for each sample.
All features were min–max normalized before stratified splitting of the data by class (faulty versus non-faulty) into 80% train and 20% test sets. To compromise between bias and variance, we set the XGBoost (version 2.1 2024) classifier to 100 trees, a learning rate of 0.1, and maximum depth of five. A small internal validation fold was used to apply early stopping to avoid overfitting. The performing model provides a binary label and a probability score for each test sample and supports threshold tuning in real-time alarm applications.

4. Experimental Setup

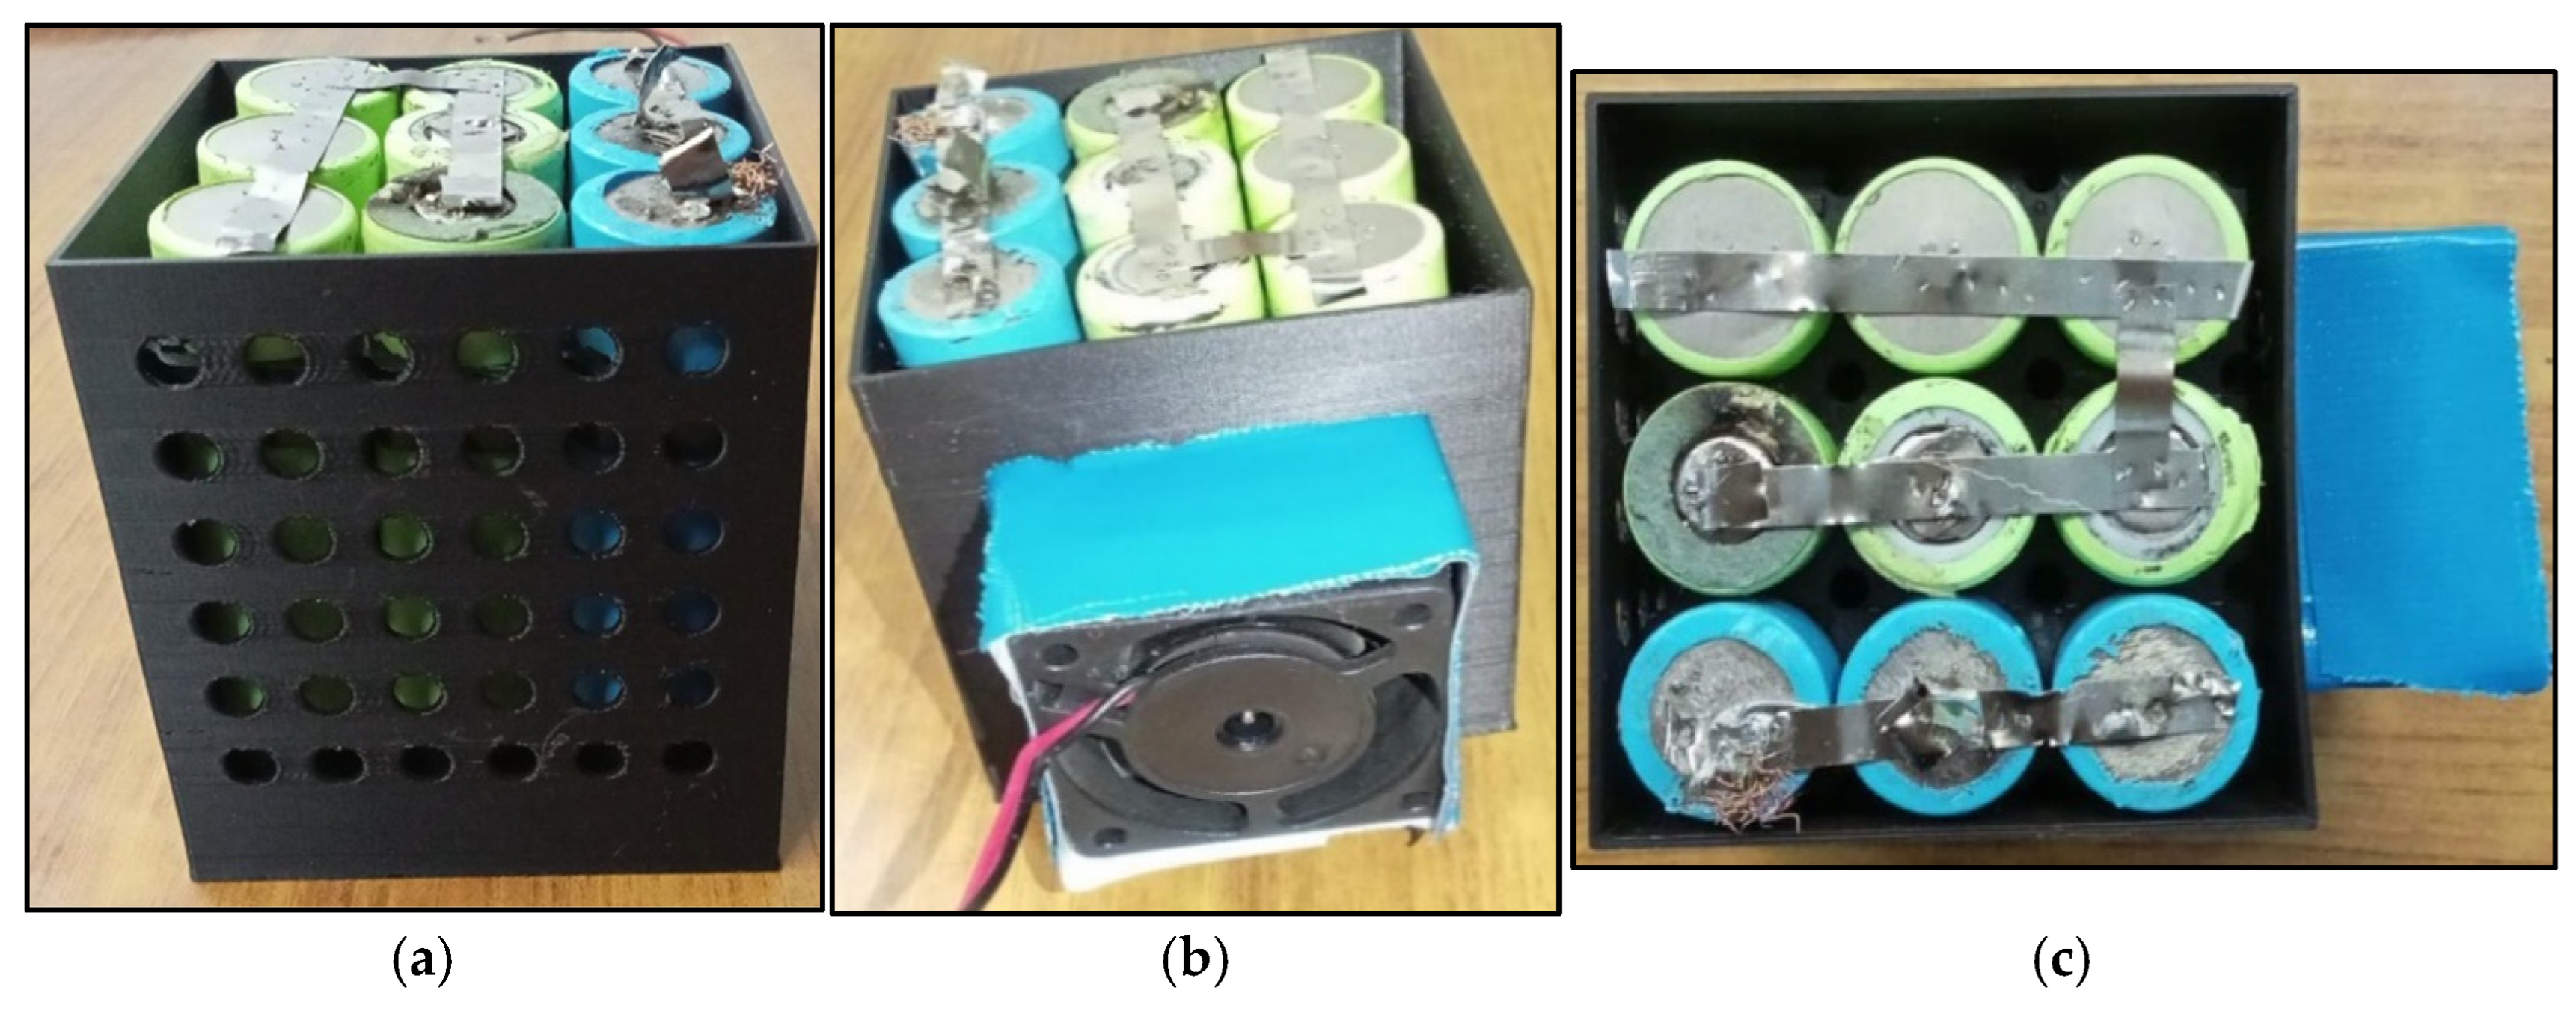
The research battery pack contains three cells series-connected to three cells parallel-connected (3s3p). The setup for this experiment includes a 3s3p battery pack, PLA casing, a power supply, cooling fan, thermocouple, Arduino UNO, and a personal computer. The battery pack was initially designed with 1 mm spacing between the battery cells. The experimental system serves to examine how air cooling affects thermal management for 18,650 battery cells. Figure 5 shows the flow path for cooling air along with the cooling fan installation.
Additionally, voltage and temperature data from the 3s3p battery pack were recorded at one-second intervals during different discharge experiments to capture its normal operating conditions. To enhance fault detection capabilities, an external dataset was incorporated, containing both faulty and non-faulty battery conditions [23]. A collective dataset was then created for training an AI-based classification model. A list of electrical and thermophysical properties for these battery cells appears in Table 2.
For the air-cooling system, there are 36 holes (6 rows × 6 columns) for the air inlet to enhance the air-cooling effect, each with a diameter of 5 mm. The outlet of the air is a suction fan with the dimensions 40 mm × 40 mm, controlled by an adapter through Arduino. The airflow velocity of the fan is directly proportional to the voltage supplied. The experimental testing was based on the three-dimensional temperature distribution model of the battery module. The initial value of temperature and inlet velocity were 26 °C and 2 m/s, respectively. The cooling fan used for forced air cooling had the parameters shown in Table 3.
The discharge rate, internal electrochemical reaction and resistances are the prime causes of the temperature rise in the battery module. The heat generated (q) can be calculated as follows [3]:
q = I V o c V T V o c T a
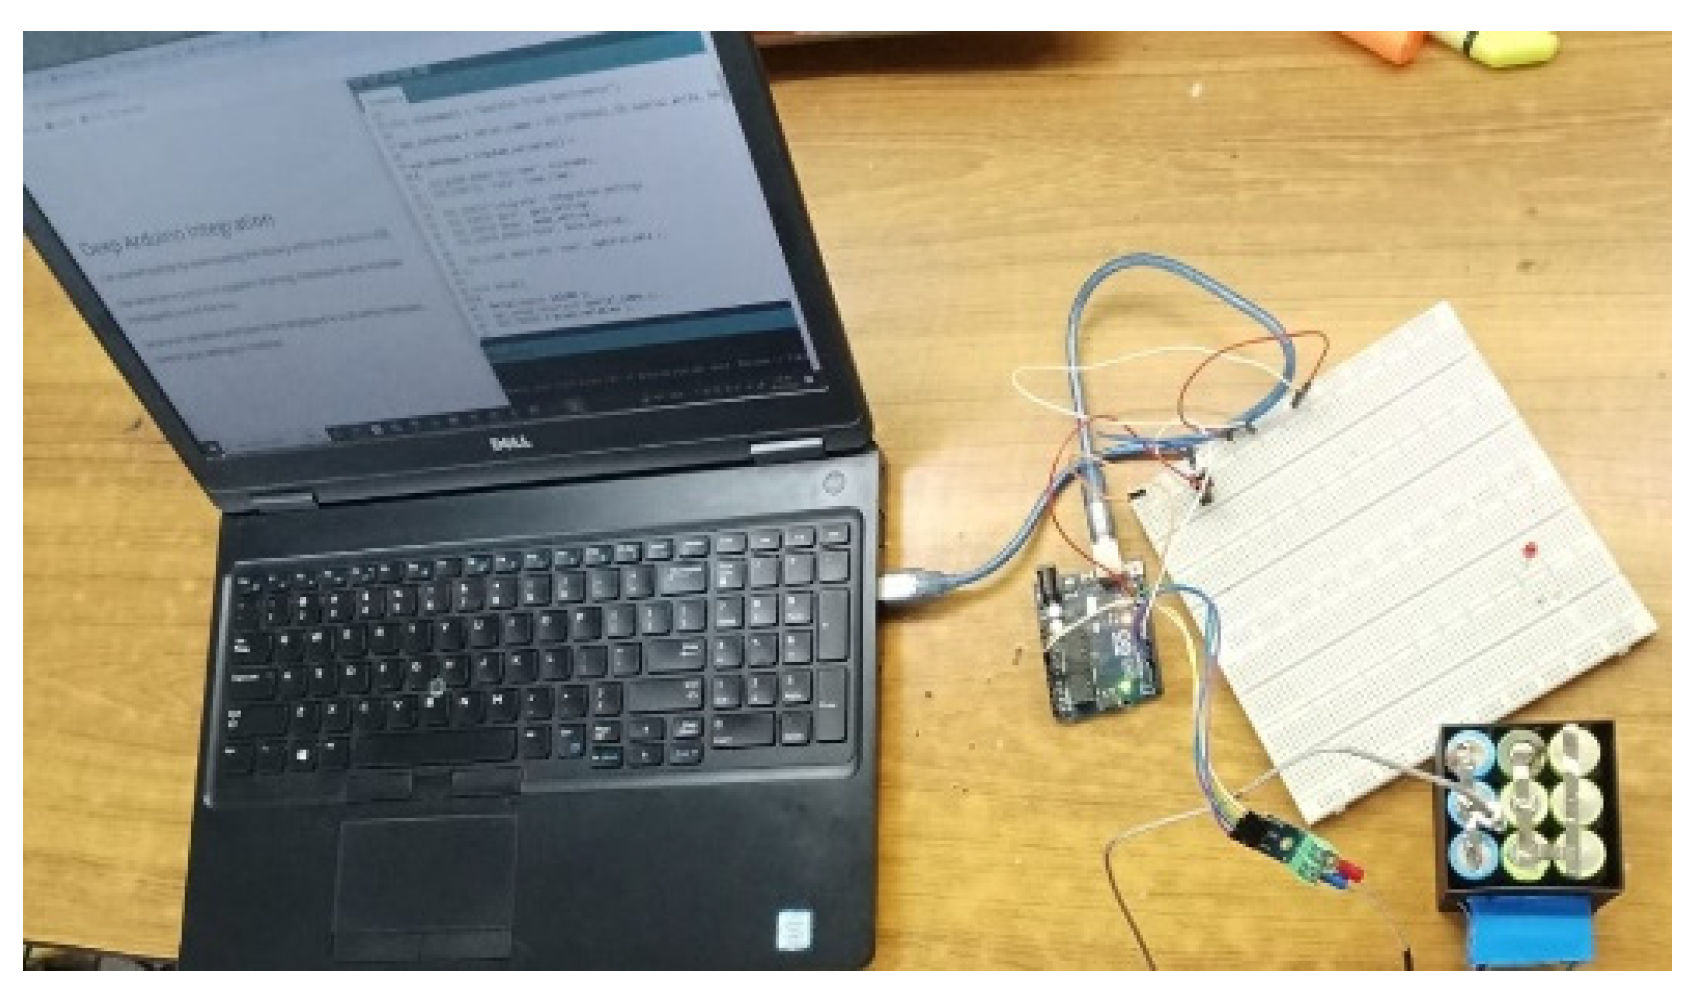
where I, Voc, T and V are the discharge current, open-circuit voltage, temperature, and operating voltage of the battery, respectively. The simulation of the battery module uses a uniform and constant heat generation of 48,750 W   m 3 because of the 1.5 C discharge rate. The test bench operation requires connecting the battery module to the load that has been calculated to achieve 1.5 C discharging of the battery module. A thermocouple is attached to the battery pack at a central location and is connected to the Arduino UNO and PC to record the temperature values at each instance. Figure 6 shows the experimental setup with an Arduino attached to a PC for measurements.

5. Results and Discussion

5.1. Simulation Results

5.1.1. Air Cooling with Different Pack Configuration

Based on the simulation results, the square configuration appears to have several advantages over the nested configuration. These include an improved level of uniform temperature distribution and better cooling efficiency. In the square configuration, the heat distribution appears more evenly spread across all cylinders, whereas in the nested configuration, some cylinders have higher temperature variations. Moreover, the square configuration allows for more even cooling as the spaces between the cylinders provide better airflow or heat dissipation pathways when the peak temperature is 313 K. The nested configuration might have localized hot spots due to restricted heat transfer in the inner cylinders, as can be seen by a peak temperature of 314 K in Figure 7. As a next step, a square configuration was selected and analyzed for different inlet velocities.

5.1.2. Air Cooling with Different Inlet Velocity

The research evaluates how different inlet velocities affect both cooling effectiveness and temperature distribution within the battery module. A parametric numerical study utilized ANSYS simulation software to analyze airflow velocity and maximum temperature effects through different inlet velocity inputs. These results indicate a reduction in local temperature with increasing airflow velocity, demonstrating an inverse correlation between inlet velocity and the module’s peak temperature. Figure 8 illustrates the velocity contours for each case. The highest battery cells’ temperature was 319 K, 313 K, and 312 K for the air velocities of 1 m/s, 2 m/s, and 3 m/s, as shown in Figure 8a, Figure 8b and Figure 8c respectively. Furthermore, a further increase in the velocity may result in diminishing returns because of the increased power consumption while not reducing the battery temperature significantly. Therefore, optimizing the balance between the inlet velocity and the cooling efficiency is essential. Additionally, if the ambient temperature exceeds the standard range, keeping effective and uniform cooling necessitates increasing the inlet air velocity.

5.1.3. Air Cooling with Different Cell Spacing

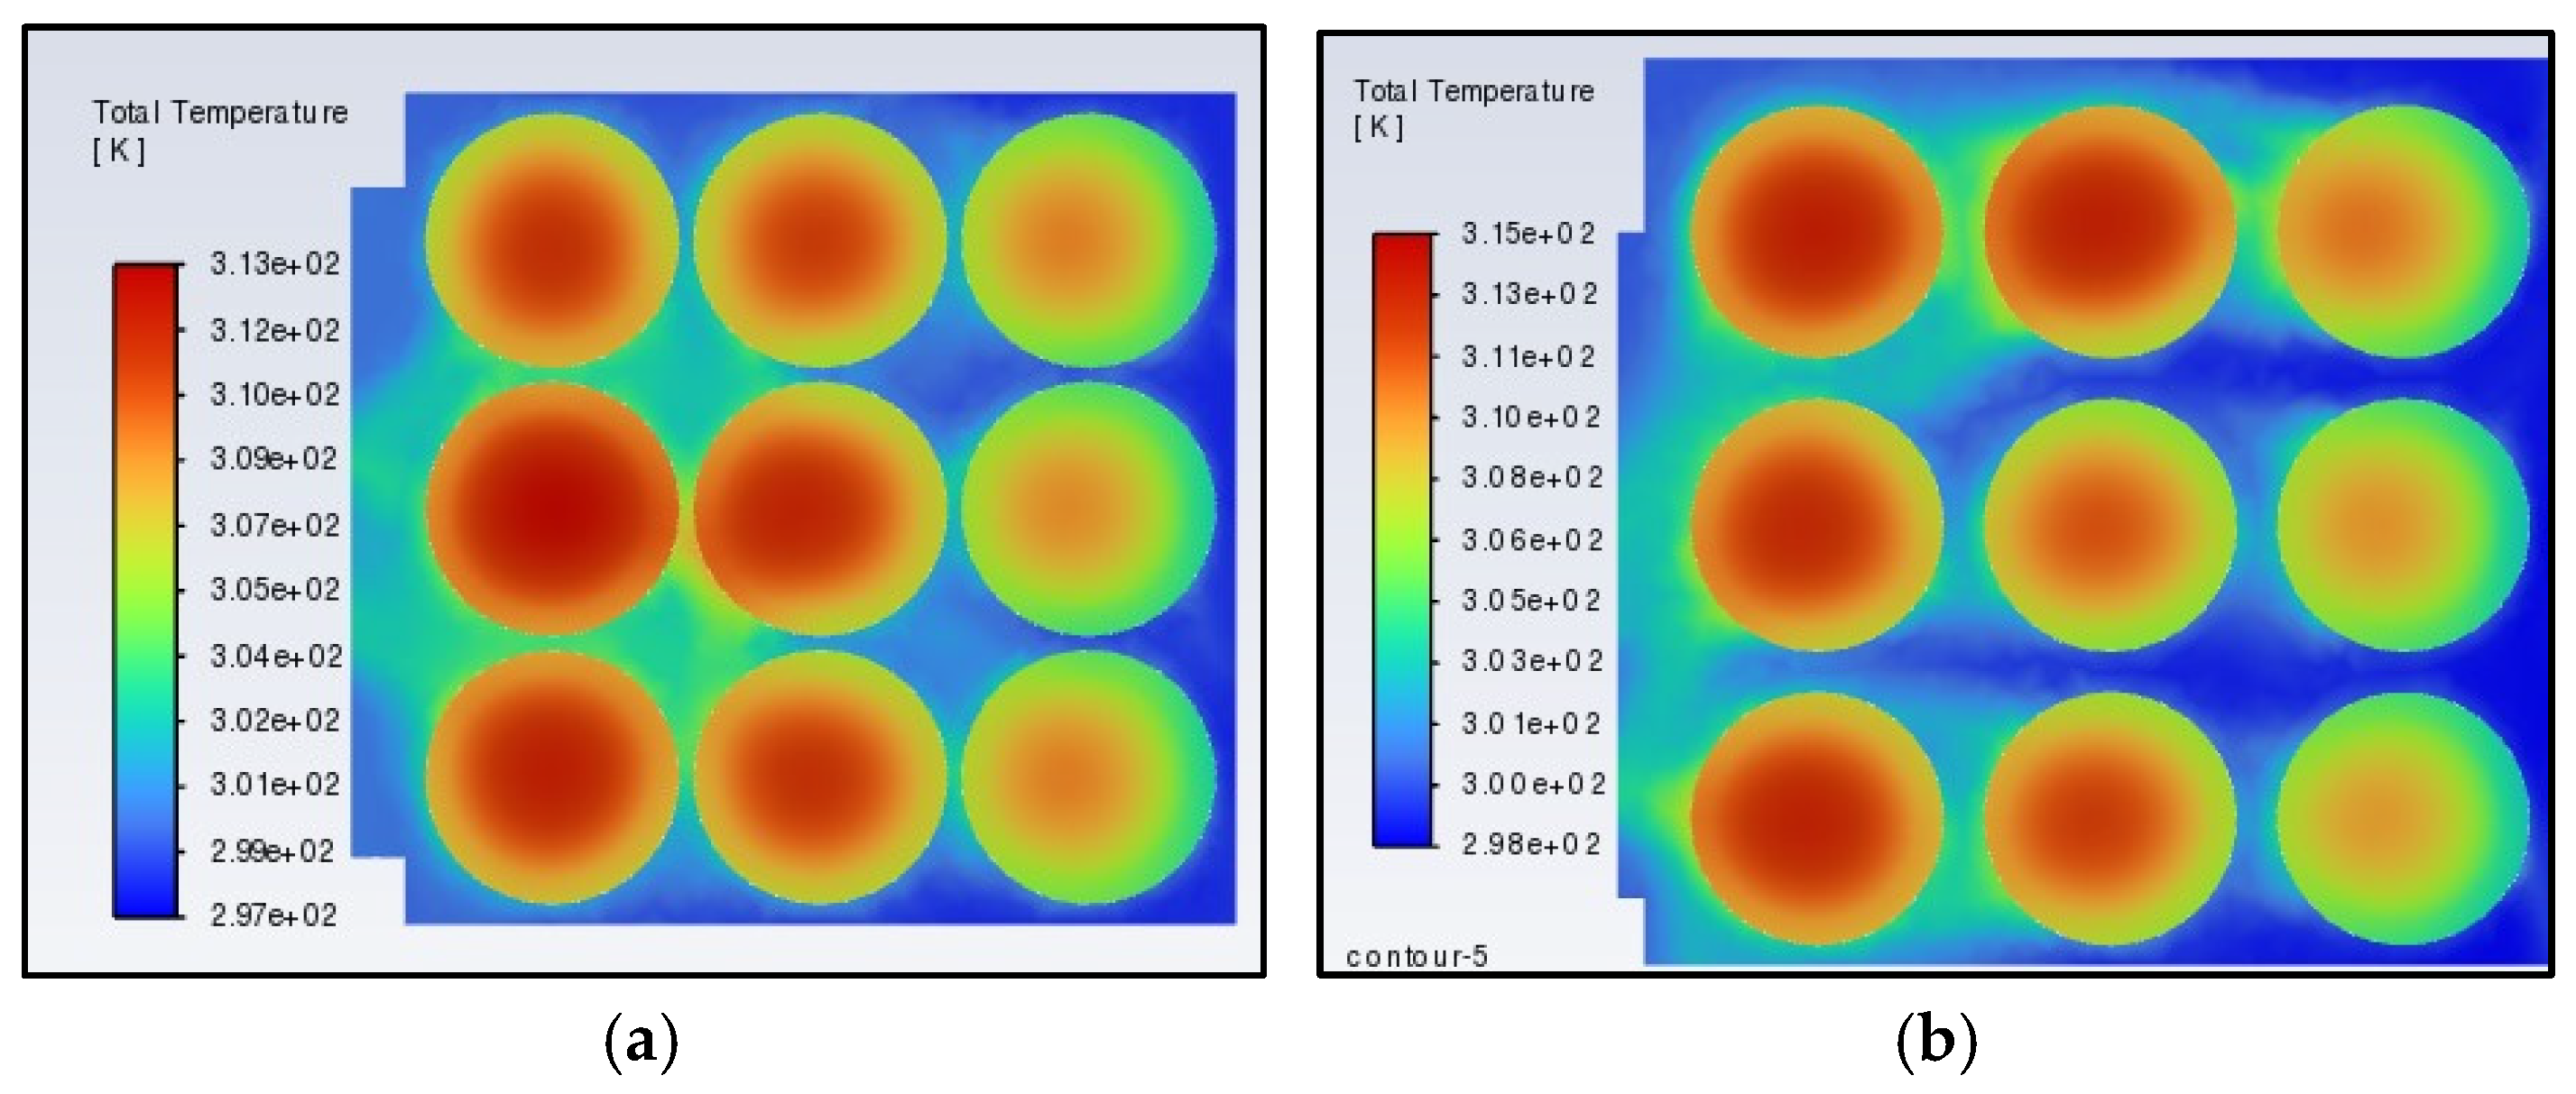
Figure 9 shows the impact of cell spacing on battery’s cooling performance. The cells spaced 2 mm apart reach a maximum temperature of 313 K as shown in Figure 9a. When the spacing between the cells is increased to 4 mm, the value of maximum temperature becomes 315 K, rising by 2 degrees as shown in Figure 9b. This shows that further increasing the cell spacing only increases the system volume with no positive effect on the heat transfer from battery cells. This is because the flowing air hardly achieves any contact with the battery cells due to large spacing. Wider gaps allow air to pass through more freely and reduce the contact time with the battery cells. Also, the increased cell spacing creates stagnant air zones in the battery module. The battery cells experience poor heat dissipation because hot air pockets form inside the battery pack. At very small spacings, thermal boundary layers from adjacent cells overlap, creating low-velocity regions and reducing effective heat transfer. Therefore, optimal spacing should avoid both excessive gaps and overly tight configurations. Thus, as per the above analysis, increasing the spacing between the cells beyond 2 mm would not be a good option.

5.2. Experimental Results

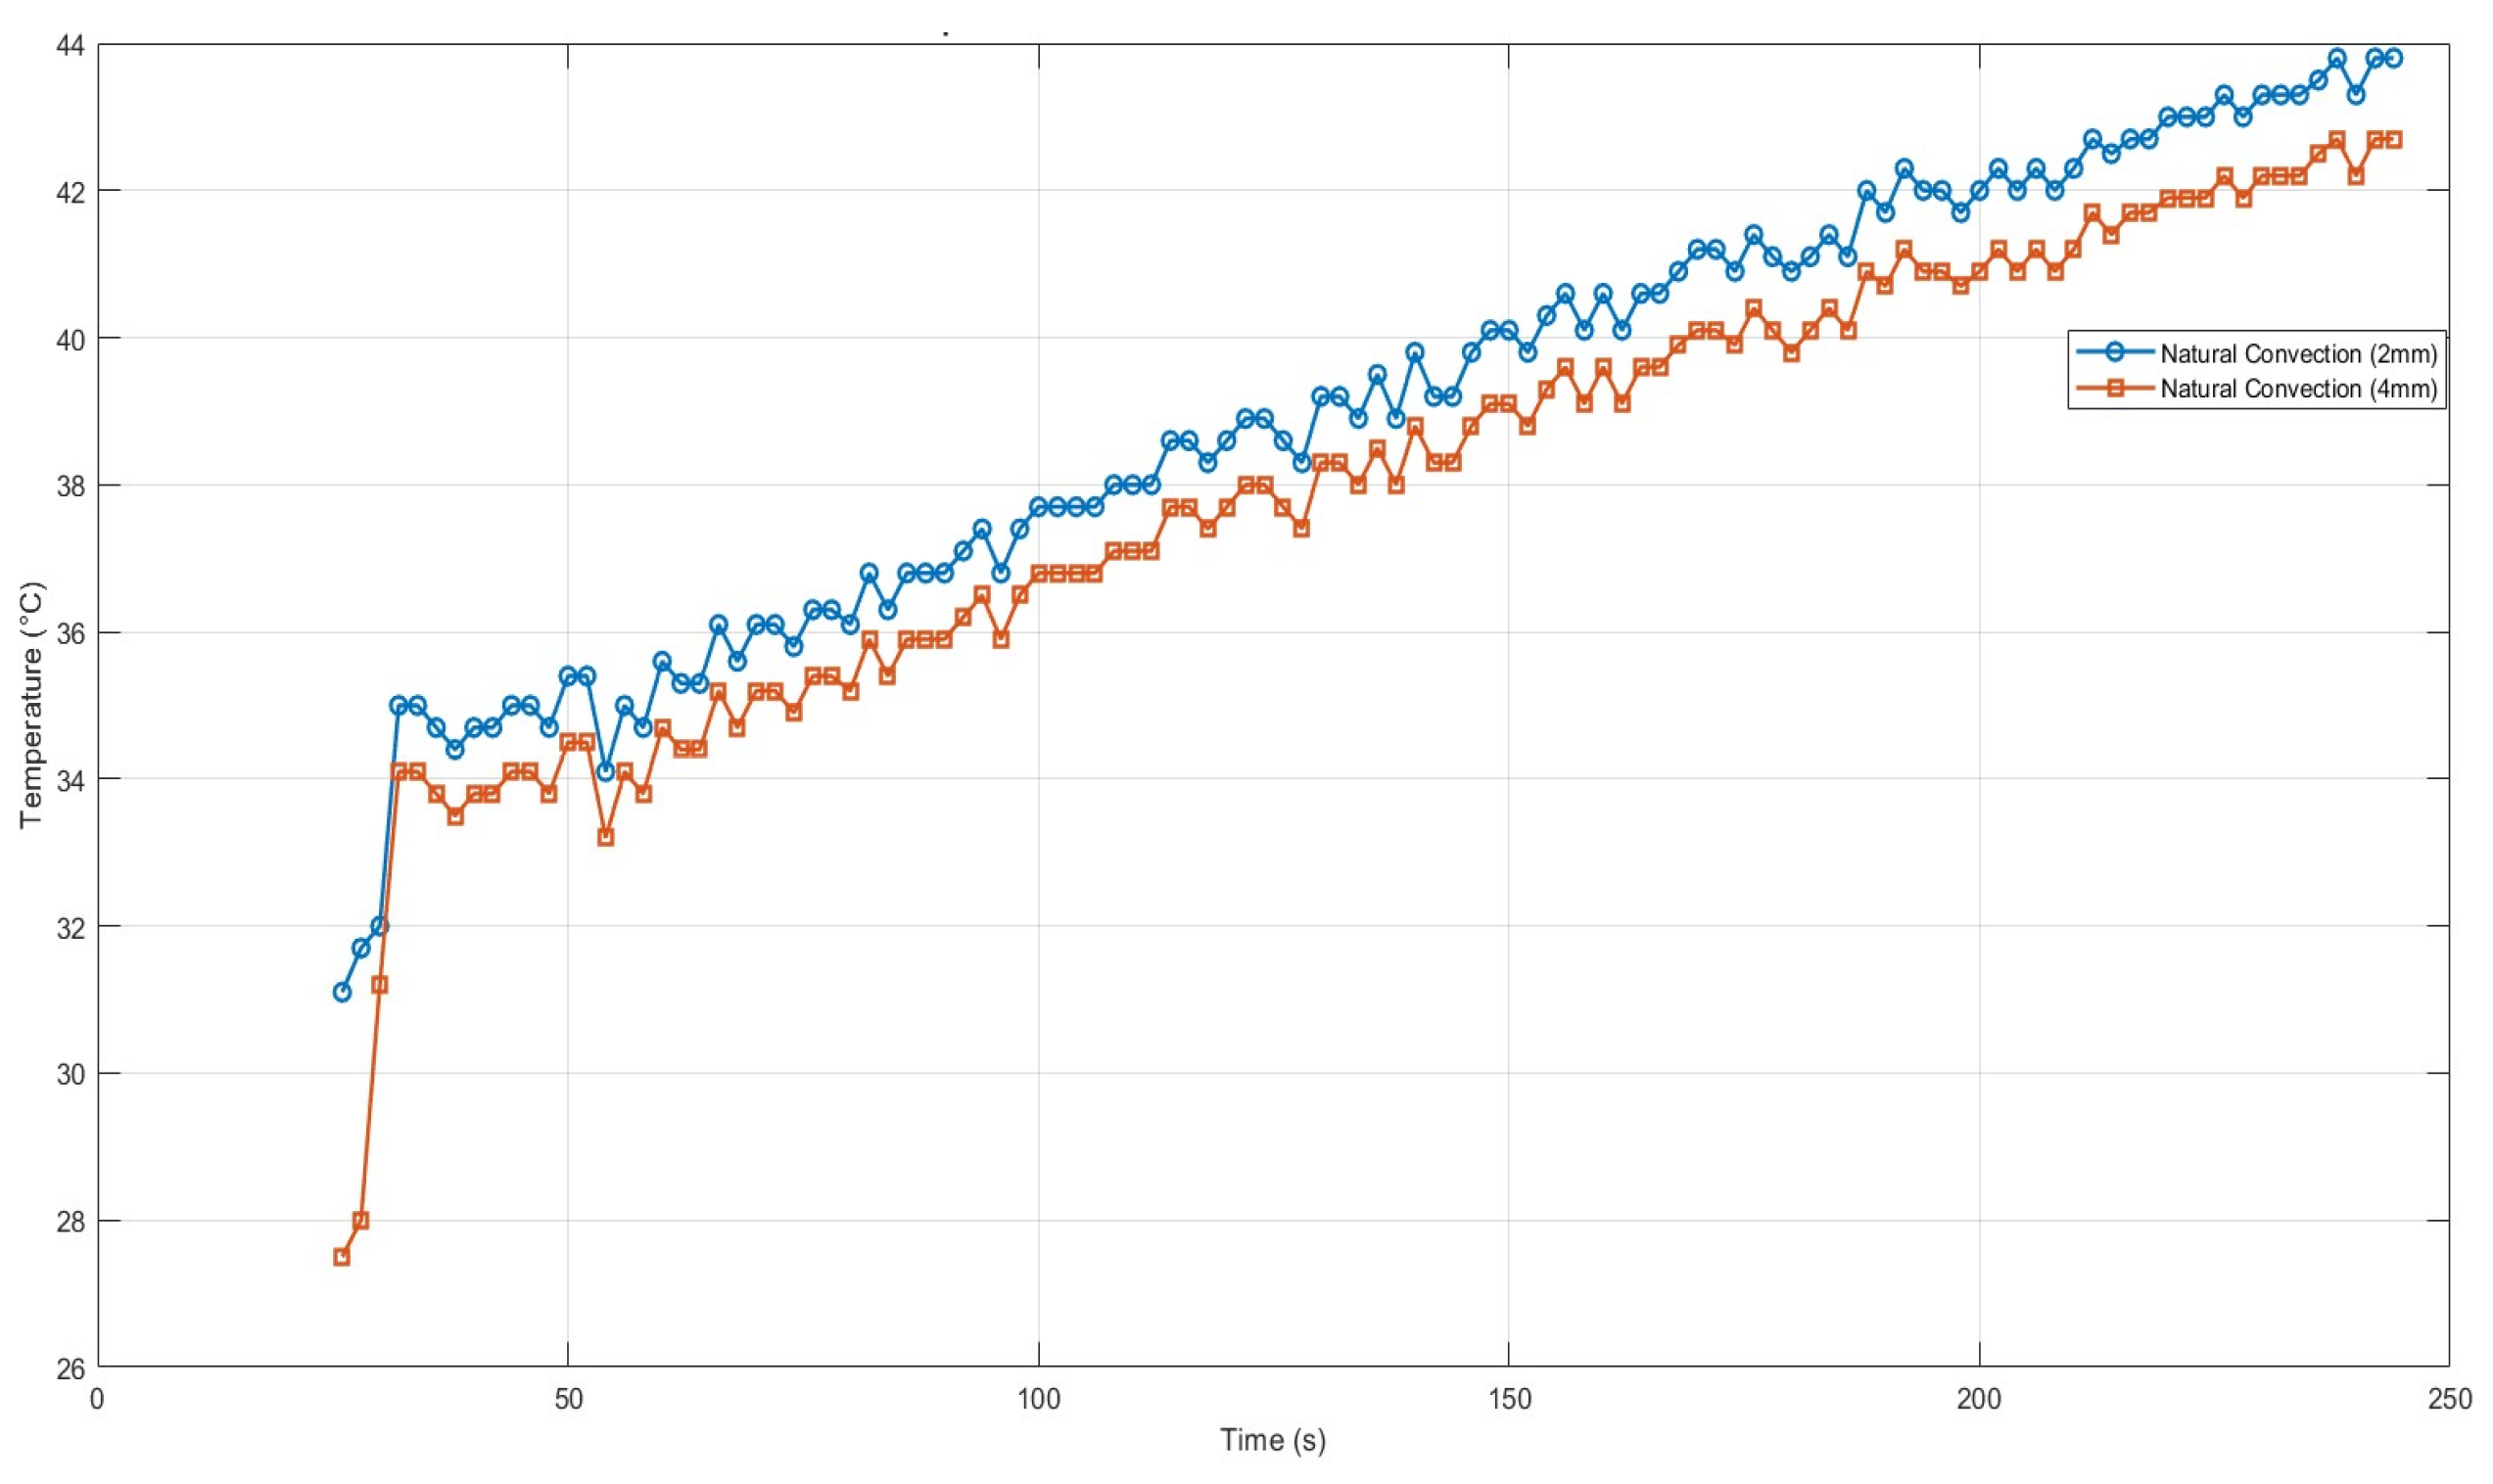
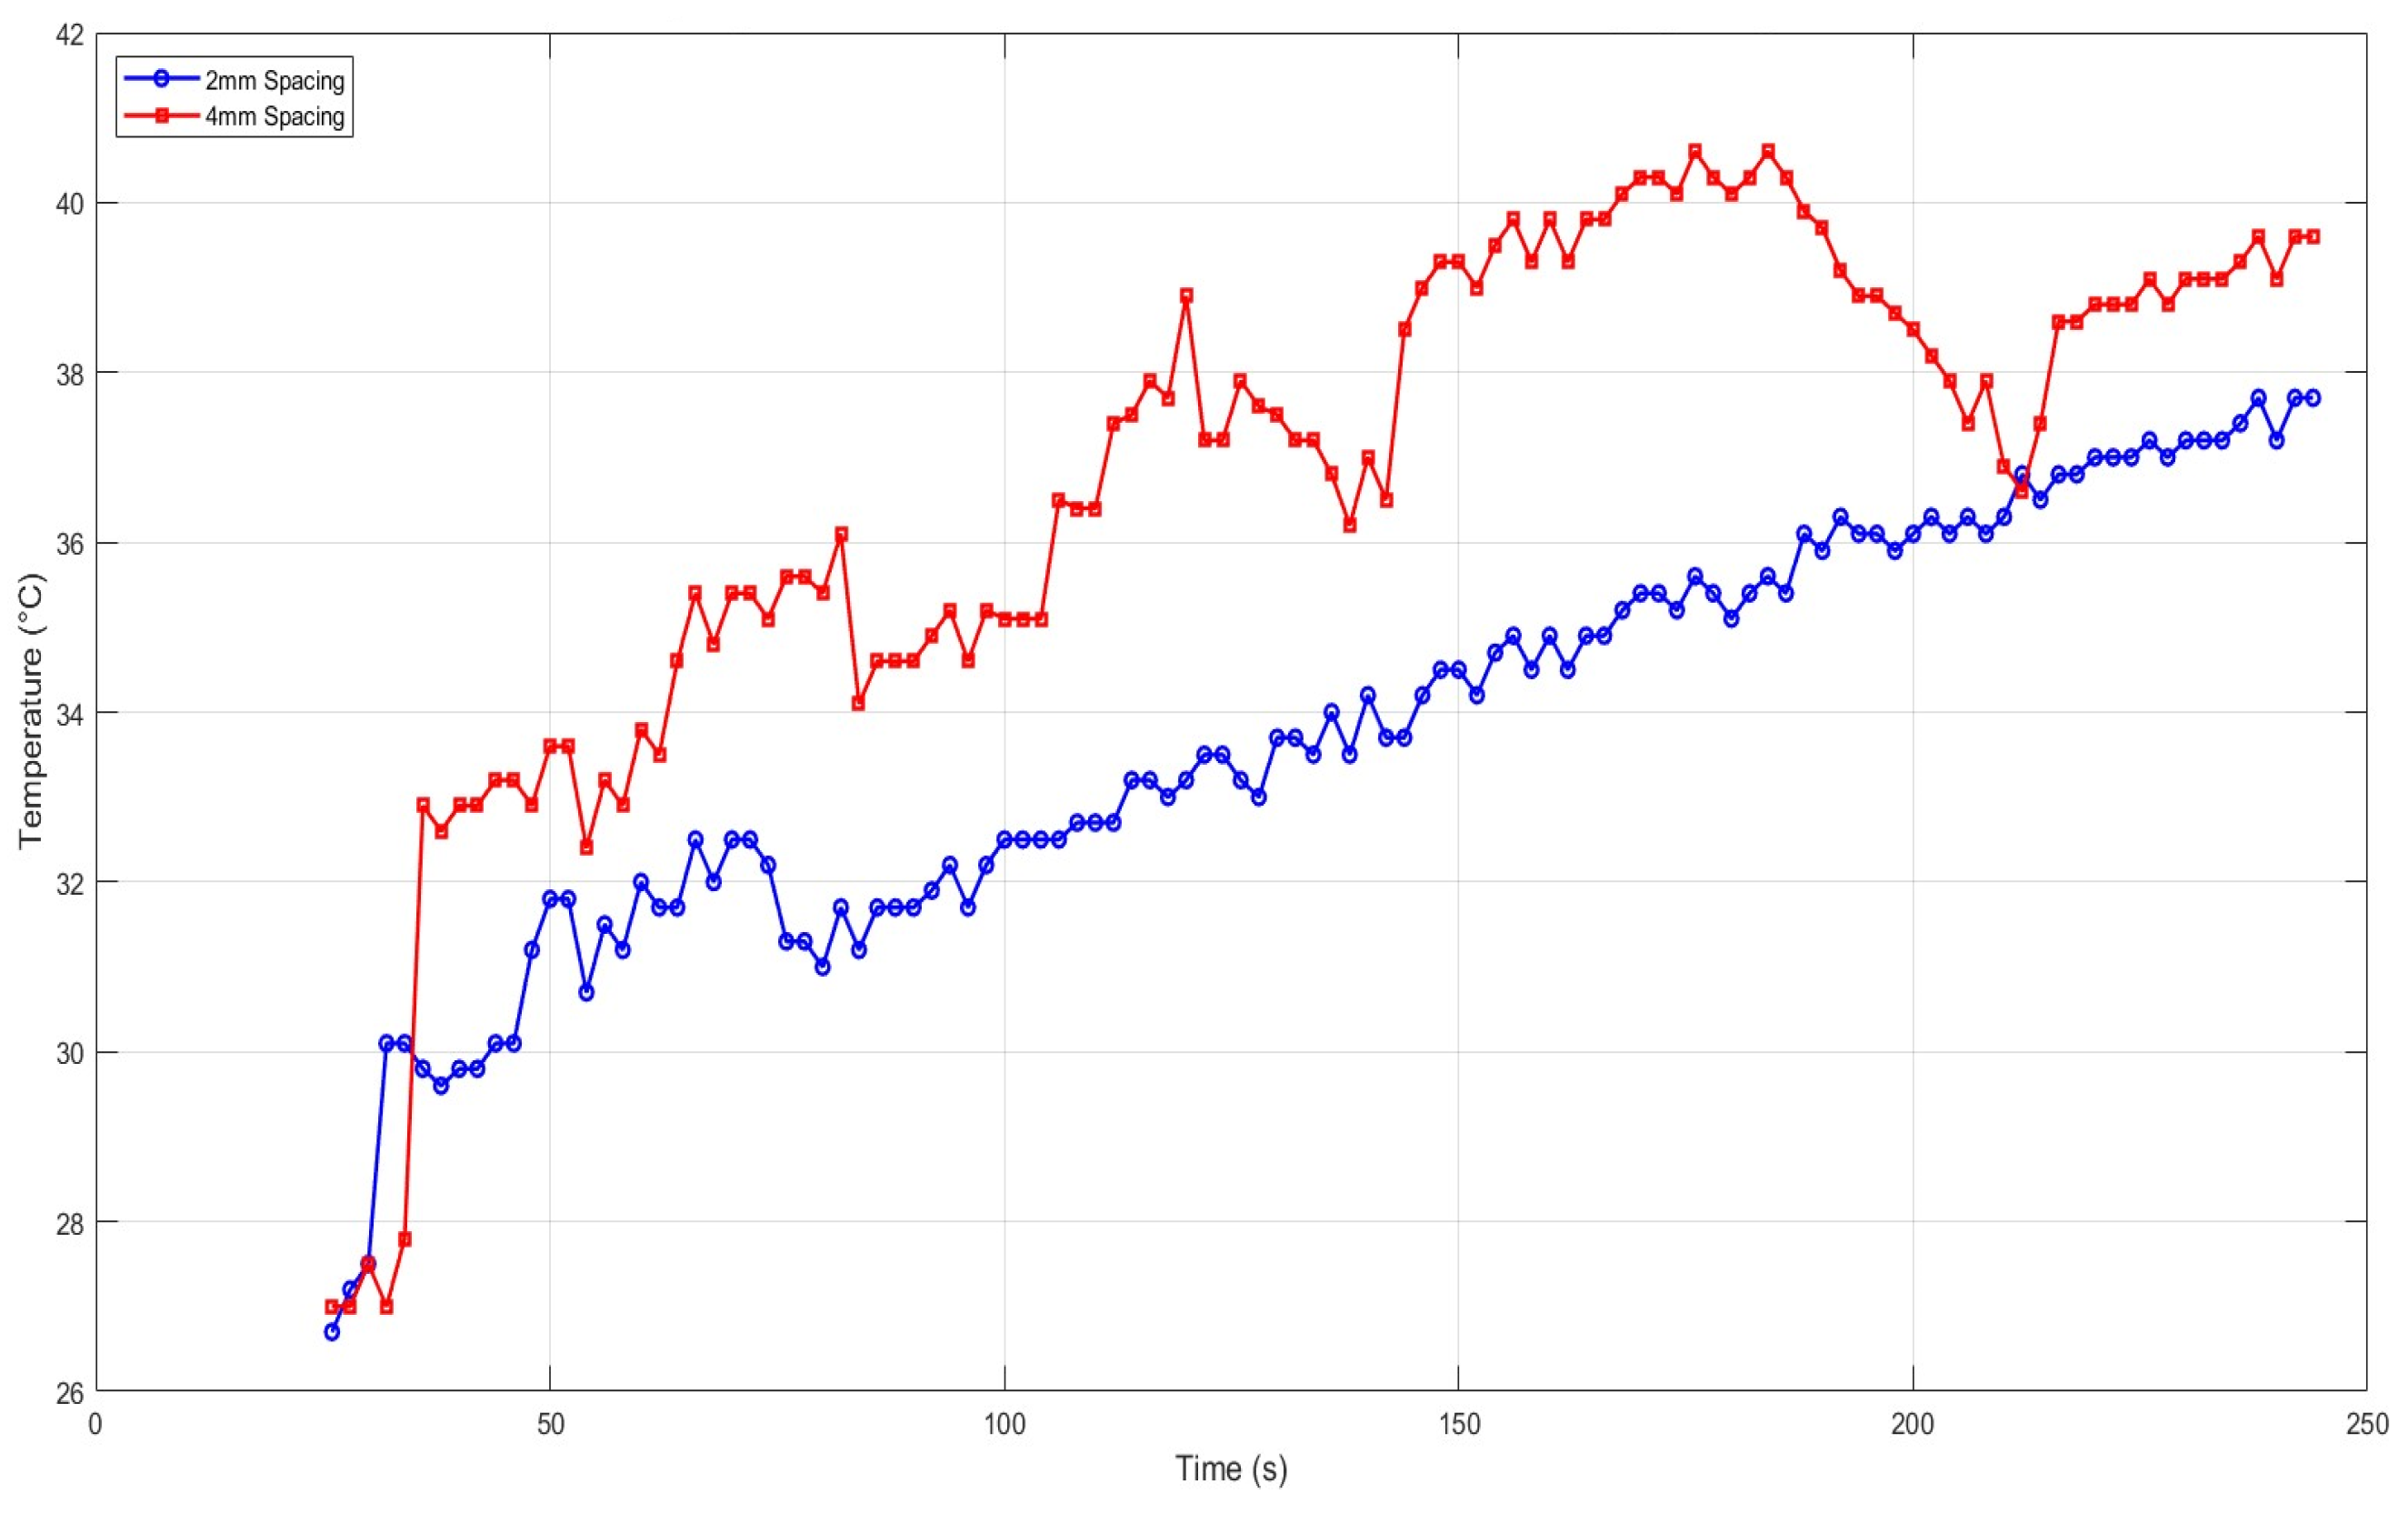
Experiments were performed using the test bench shown previously in Figure 6. The battery module was discharged at 1.5 C. First, the battery module was discharged with only natural air convection. The temperature values were noted down using thermocouples for two cases of 2 mm and 4 mm spacing between the battery cells. The results of change in temperature with the time are shown in Figure 10 for both natural and forced convection. The battery module was discharged for 230 s at 1.5 C discharge rate and the maximum temperature of the battery pack achieved without air cooling was 44 °C (317 K) for 2 mm spacing and approximately 42 °C (315 K) for 4 mm spacing between the cells. The battery pack module was then discharged at the same discharge but with forced air convection. The air velocity was maintained at 2 m/s. The temperature values are noted down the same way as for the first case. The highest temperature recorded among the battery module cells reached 38 °C (311 K) when the cells were spaced 2 mm apart and 40 °C for cells spaced 4 mm apart. The highest temperature value for the forced air convection case was lower than that for natural convection. This is because the forced convection offers a higher convection coefficient than natural convection. Also, it can be observed that natural convection is more effective in the case of 4 mm spacing between the cells. Because a larger surface area is in contact with the ambient air, the heat transfer from the battery cells improves. But it can also be observed that in case of the forced convection, 2 mm spacing has a lower highest temperature in the module compared to the 4 mm spacing. This is because in forced convection, the larger spacing between the cells offers lower resistance to the flow of air and air passes between the cells without significant contact area and time with the battery cells. This reduces the heat transfer from cells to the forced cooling air. However, the experimental results are in accordance with the simulation results, which show a decrease in the battery module temperature in forced air convection compared to natural convection. Figure 11 shows a comparison of the experimental results for different cell spacings, showing a great deal of agreement with the simulation results. Thus, it was found that for the optimal spacing of 2 mm, the highest battery temperature is 313 K, which is the lowest among all the other configurations used in this study. Air cooling alone is generally insufficient to maintain battery temperatures within the optimal range; however, under the identified optimal cell spacing conditions, it performs at its maximum potential.

5.3. Fault Detection and Machine Learning Analysis

To complement the thermal observations, a fault detection model was trained on battery sensor data to predict potential failures. The confusion matrix, as shown in Figure 12, demonstrates the model’s ability to classify faulty and non-faulty conditions with high accuracy. The model successfully identified 405 true negatives and 349 true positives, with minimal false misclassifications (41 false positives and 37 false negatives).
The results expressed within our confusion matrix correspond to an accuracy of 0.94, a precision of 0.89, a recall of 0.90, an F1 score of 0.90, a Cohen’s kappa of 0.87, and a Matthews correlation coefficient of 0.88. These values confirm that the XGBoost classifier reliably captures the key electrical and thermal precursors to battery faults.
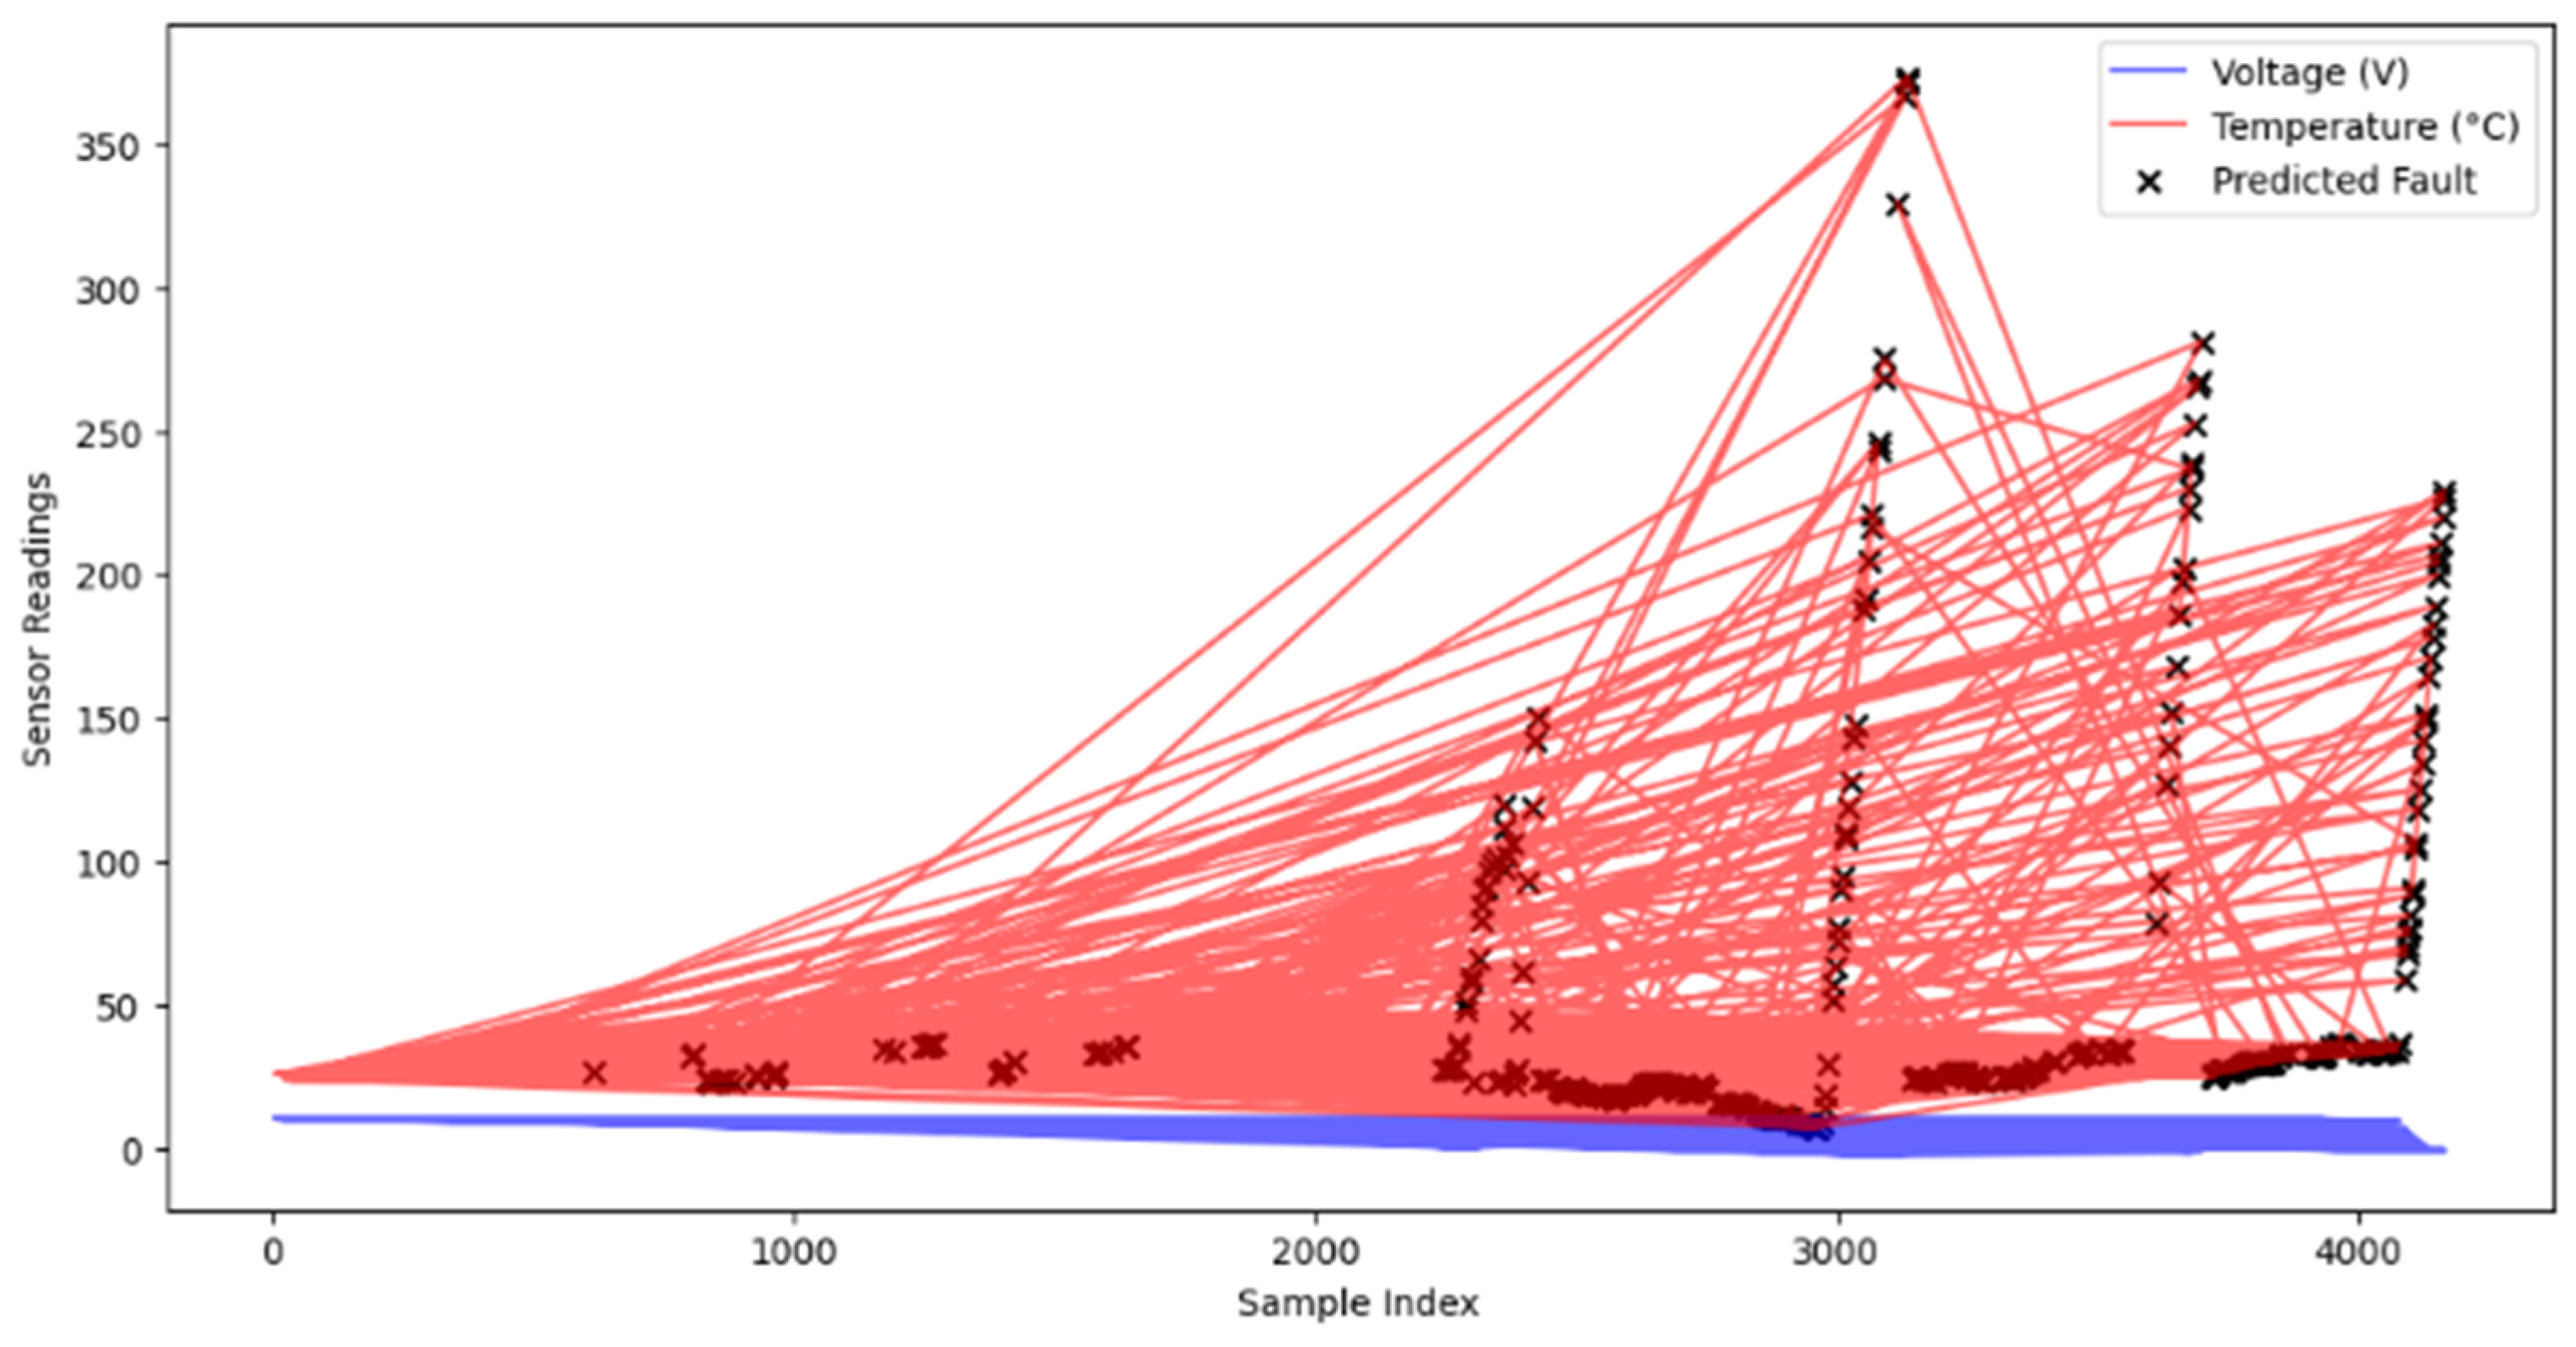
To gain further insight into how battery conditions correlate with fault predictions, a graphical visualization was generated, as shown in Figure 13. This plot displays sensor readings of voltage and temperature along with the model’s fault predictions. It can be observed that temperature fluctuations strongly influence fault occurrences, reinforcing the idea that thermal anomalies are a primary trigger for battery faults.

6. Conclusions

This study investigated the impact of the cell configuration, air flow velocity, and cell spacings on the battery temperature control using both simulations and experimental work. The results in both cases confirmed that with the proposed battery design of 3s3p size with air cooling, the battery temperature remains in the safe region for up to 1.5 C discharge rate. The findings of this study are valuable in the improvement of battery thermal management for electric vehicles. This study investigated the upper limit of the discharge rate at which the battery temperature could be kept in safe regions. Thus, this study also contributes to the safety and reliability of electric vehicles, where lithium-ion batteries are mostly used. An AI model was trained on the obtained data and projections were made for data-driven prediction of thermal runaway. Further work needs to be performed on investigating the effect of non-uniform air flow distribution on thermal runaway, in which certain battery cells are cooled better than others due to variations in air flow distribution. This leads to hotspots in the battery module, which accelerates battery degradation and increases the risk of thermal runaway. Thus, optimization is required for air flow through the battery module.

Author Contributions

Conceptualization, J.K. and U.U.R.; methodology, T.A.C. and S.A.; software, S.J.; validation, T.A.C. and J.K.; formal analysis, S.I. and A.Y.; investigation, U.H.; resources, U.H. and U.U.R.; data curation, J.K. and S.I.; writing—original draft preparation, S.J. and A.Y.; writing—review and editing, T.A.C.; visualization, S.A.; supervision, U.H.; project administration, T.A.C.; funding acquisition, U.U.R. All authors have read and agreed to the published version of the manuscript.

Funding

This work is funded by DICE Foundation via DICE-GIKI project ORIC/PRF/27-DICE. DICE Foundation is a US based non-profit, tax-exempt organization registered in Michigan USA under ID # 71303A. Tax Exempt EIN 46-2001934.

Institutional Review Board Statement

Not applicable.

Informed Consent Statement

Not applicable.

Data Availability Statement

The data presented in this study are available on request from the corresponding author.

Acknowledgments

We are grateful to Ali Turab Jafry, GIK Institute, for providing the technical support and thermal camera for the experimental setup.

Conflicts of Interest

The authors declare no conflicts of interest.

Abbreviations

The following abbreviations are used in this manuscript:
BTMSBattery Thermal Management System
EVElectric Vehicle
AIArtificial Intelligence
SOHState-Of-Health
PCMPhase-Change Materials

References

  1. Tomaszewska, A.; Chu, Z.; Feng, X.; O’Kane, S.; Liu, X.; Chen, J.; Ji, C.; Endler, E.; Li, R.; Liu, L.; et al. Lithium-ion battery fast charging: A review. eTransportation 2019, 1, 100011. [Google Scholar] [CrossRef]
  2. Arora, S. Selection of thermal management system for modular battery packs of electric vehicles: A review of existing and emerging technologies. J. Power Sources 2018, 407, 536–552. [Google Scholar] [CrossRef]
  3. Zhao, J.; Rao, Z.; Huo, Y.; Liu, X.; Li, Y. Thermal management of cylindrical power battery module for extending the life of new energy electric vehicles. Appl. Therm. Eng. 2015, 85, 33–43. [Google Scholar] [CrossRef]
  4. Saw, L.H.; Ye, Y.; Tay, A.A.O.; Chong, W.T.; Kuan, S.H.; Yew, M.C. Computational fluid dynamic and thermal analysis of Lithium-ion battery pack with air cooling. Appl. Energy 2016, 177, 783–792. [Google Scholar] [CrossRef]
  5. Peng, X.; Ma, C.; Garg, A.; Bao, N.; Liao, X. Thermal performance investigation of an air-cooled lithium-ion battery pack considering the inconsistency of battery cells. Appl. Therm. Eng. 2019, 153, 42–51. [Google Scholar] [CrossRef]
  6. Wang, T.; Tseng, K.J.; Zhao, J.; Wei, Z. Thermal investigation of lithium-ion battery module with different cell arrangement structures and forced air-cooling strategies. Appl. Energy 2014, 134, 229–238. [Google Scholar] [CrossRef]
  7. Jiaqiang, E.; Zhan, Z.; Qian, Z.; Fan, J.; Jiang, Z.; Yang, J.; Wei, X. Effects of the different air cooling strategies on cooling performance of a lithium-ion battery module with baffle. Appl. Therm. Eng. 2018, 144, 236–246. [Google Scholar] [CrossRef]
  8. Gao, T.; Wang, Z.; Chen, S.; Guo, L. Hazardous characteristics of charge and discharge of lithium-ion batteries under adiabatic environment and hot environment. Int. J. Heat Mass Transf. 2019, 141, 672–683. [Google Scholar] [CrossRef]
  9. Feng, X.; Zheng, S.; He, X.; Wang, L.; Zhang, X.; Ouyang, M. Thermal runaway propagation model for designing a safer battery pack with 25Ah LiNixCoyMnzO2 large format lithium-ion battery. Appl. Energy 2015, 154, 554–565. [Google Scholar] [CrossRef]
  10. Sabbah, R.; Kizilel, R.; Selman, J.R.; Al-Hallaj, S. Active (air-cooled) vs. passive (phase change material) thermal management of high power lithium-ion packs: Limitation of temperature rise and uniformity of temperature distribution. J. Power Sources 2008, 182, 630–638. [Google Scholar] [CrossRef]
  11. Behi, H.; Chen, C.; Jiang, J.; Zhang, W.; Wang, Y.; Ma, L. A new concept of thermal management system in Li-ion battery using air cooling and heat pipe for electric vehicles. Appl. Therm. Eng. 2020, 174, 115280. [Google Scholar] [CrossRef]
  12. Chen, K.; Wang, S.; Song, M.; Chen, L. Configuration optimization of battery pack in parallel air-cooled battery thermal management system using an optimization strategy. Appl. Therm. Eng. 2017, 123, 1322–1333. [Google Scholar] [CrossRef]
  13. Saw, L.H.; Ye, Y.; Tay, A.A.O. Electrochemical-thermal analysis of 18650 Lithium Iron Phosphate cell. Energy Convers. Manag. 2013, 75, 162–174. [Google Scholar] [CrossRef]
  14. Chen, J.; Xuan, D.; Wang, B.; Jiang, R. Structure optimization of battery thermal management systems using sensitivity analysis and stud genetic algorithms. Appl. Sci. 2021, 11, 7440. [Google Scholar] [CrossRef]
  15. Li, A.; Zhao, B.; Zhang, S.; Luo, Z.; Zhang, G.; Wei, H. Thermal propagation modelling of abnormal heat generation in various battery cell locations. Batteries 2022, 8, 216. [Google Scholar] [CrossRef]
  16. Spinner, N.S.; Hinnant, K.M.; Mazurick, R.; Brandon, A.; Rose-Pehrsson, S.L.; Tuttle, S.G. Novel 18650 lithium-ion battery surrogate cell design with anisotropic thermophysical properties for studying failure events. J. Power Sources 2016, 312, 172–183. [Google Scholar] [CrossRef]
  17. Finegan, D.P.; Darcy, E.; Keyser, M.; Tjaden, B.; Heenan, T.M.M.; Jervis, R.; Brett, D.J.L. In-operando high-speed tomography of lithium-ion batteries during thermal runaway. Nat. Commun. 2015, 6, 6924. [Google Scholar] [CrossRef]
  18. Feng, X.; Ouyang, M.; Liu, X.; Lu, L.; Xia, Y.; He, X. Thermal runaway mechanism of lithium-ion battery for electric vehicles: A review. Energy Storage Mater. 2018, 10, 246–267. [Google Scholar] [CrossRef]
  19. Song, L.; Zheng, Y.; Xiao, Z.; Wang, C.; Long, T. Review on thermal runaway of lithium-ion batteries for electric vehicles. J. Electron. Mater. 2022, 51, 30–46. [Google Scholar] [CrossRef]
  20. Ruiz, V.; Pfrang, A.; Kriston, A.; Omar, N.; Van den Bossche, P.; Boon-Brett, L. A review of international abuse testing standards and regulations for lithium-ion batteries in electric and hybrid electric vehicles. Renew. Sustain. Energy Rev. 2018, 81, 1427–1452. [Google Scholar] [CrossRef]
  21. Lin, L.S.; Li, J.L.; Fishman, I.M.; Torres-Castro, L.; Preger, Y.; De Angelis, V.; Lamb, J.; Zhu, X.Q.; Allu, S.; Wang, H. Mechanically induced thermal runaway severity analysis for Li-ion batteries. J. Energy Storage 2023, 61, 106798. [Google Scholar] [CrossRef]
  22. Townsend, D.I.; Tou, J.C. Thermal hazard evaluation by an accelerating rate calorimeter. Thermochim. Acta 1980, 37, 1–30. [Google Scholar] [CrossRef]
  23. Lin, L.; Wang, H.; Li, J.; Torres-Castro, L.; Preger, Y.; De Angelis, V. Mechanically induced thermal runaway for Li-ion batteries. Mendeley Data 2023. [Google Scholar] [CrossRef]
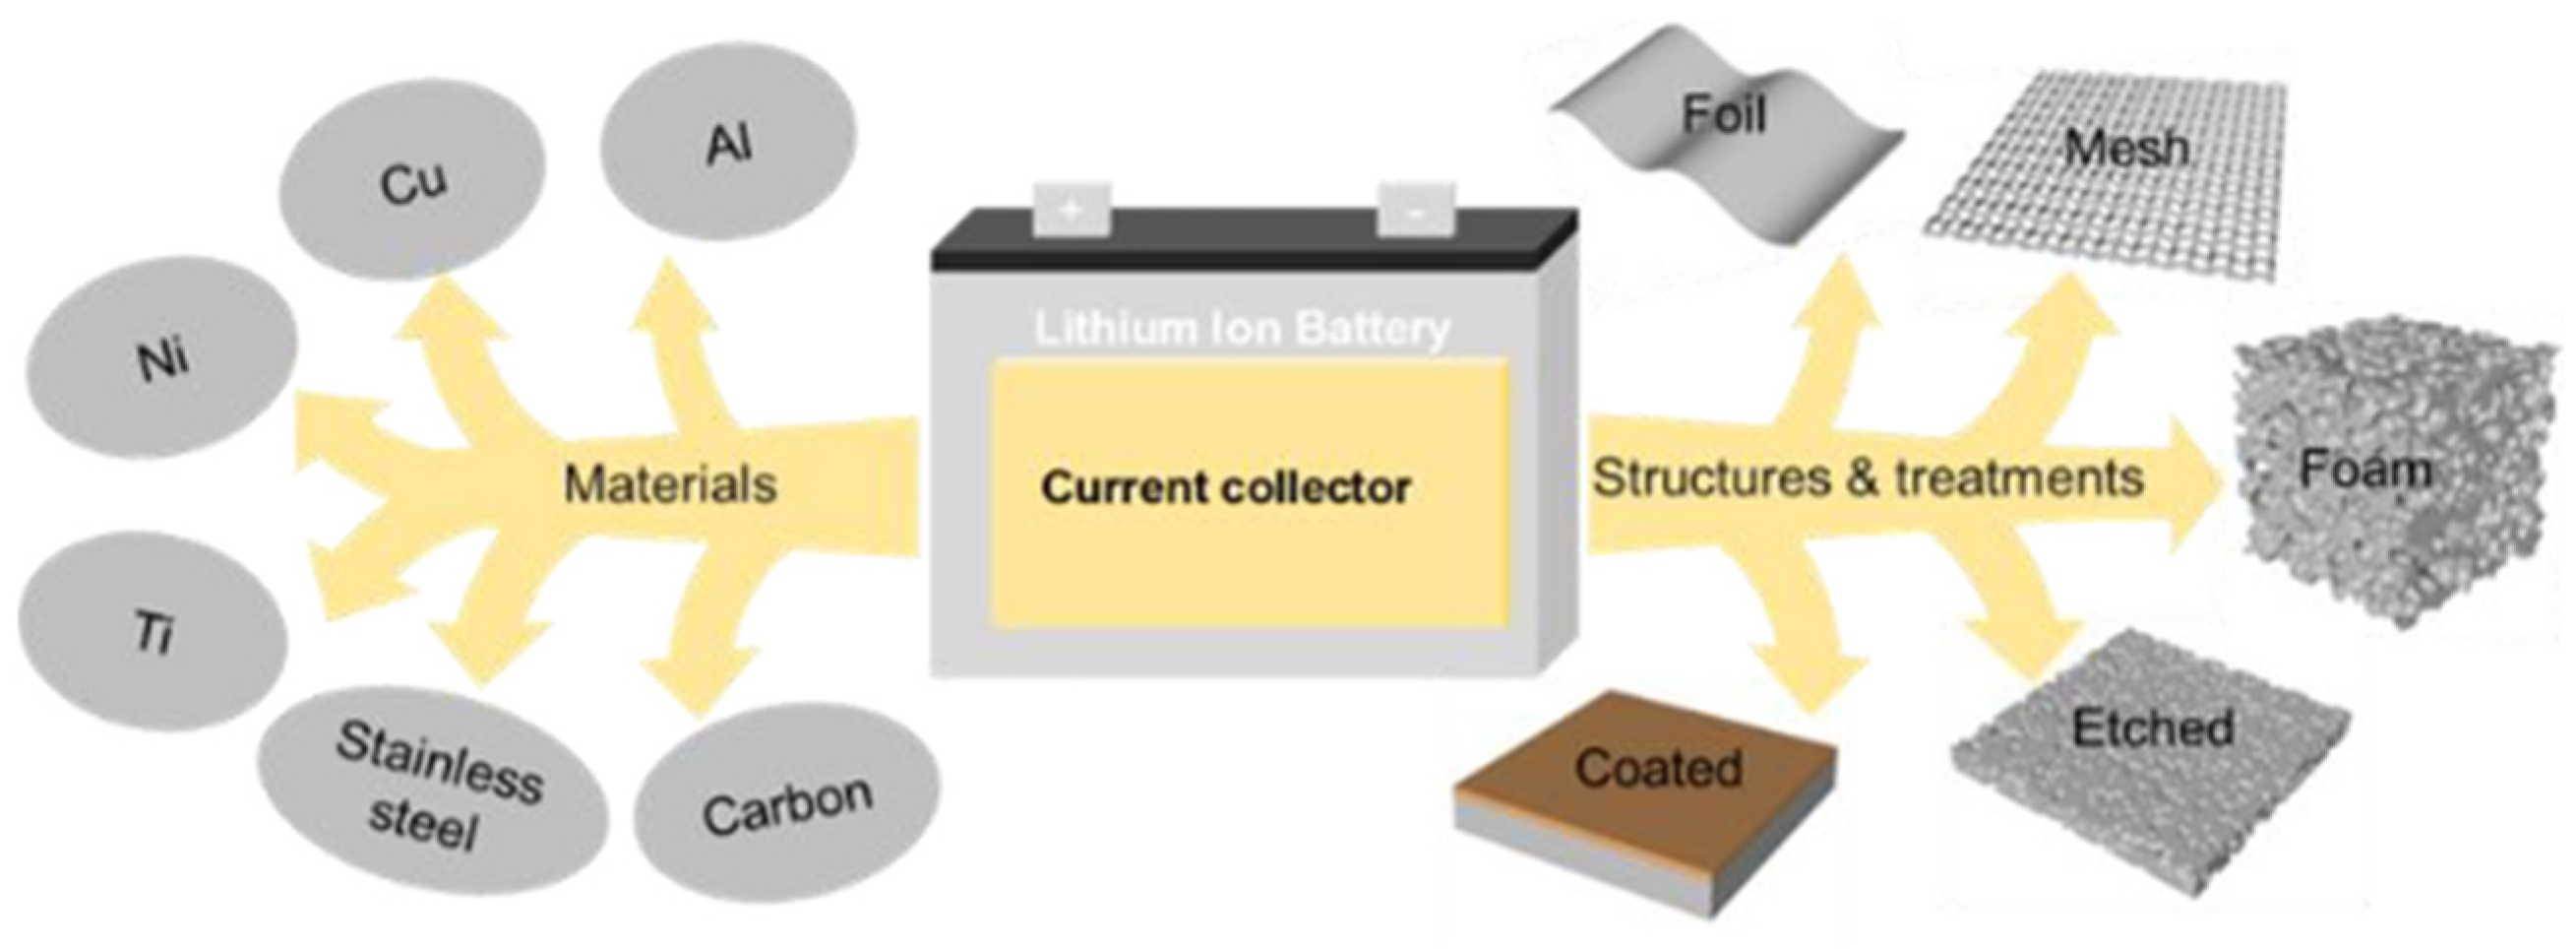
Figure 1. Set of materials and structures for current collector.
Materproc 23 00017 g001
Figure 2. Comparison of copper v/s aluminum busbars in 3s3p battery configuration.
Materproc 23 00017 g002
Figure 3. (a) Battery pack casing; (b) mesh generated in ANSYS.
Materproc 23 00017 g003
Figure 4. Heat transfer between the battery unit and the air.
Materproc 23 00017 g004
Figure 5. Experimental setup (a) inlet, (b) outlet through cooling fan, and (c) battery module connections.
Materproc 23 00017 g005
Figure 6. Experimental setup.
Materproc 23 00017 g006
Figure 7. Nested configuration temperature distribution.
Materproc 23 00017 g007
Figure 8. Temperature distribution with different inlet velocities: (a) 1 m/s, (b) 2 m/s, (c) 3 m/s.
Materproc 23 00017 g008
Figure 9. Battery temperature distribution for (a) 2 mm cell spacing and (b) 4 mm spacing.
Materproc 23 00017 g009
Figure 10. Natural and forced convection results.
Materproc 23 00017 g010
Figure 11. Comparison of different cell spacings in 3s3p configuration.
Materproc 23 00017 g011
Figure 12. Confusion matrix for the conditions of faulty and non-faulty systems.
Materproc 23 00017 g012
Figure 13. Graphical visualization of fault prediction using AI.
Materproc 23 00017 g013
Table 1. Comparison of different busbar materials.
Electrical Conductivity (MS/m)Resistivity (Ω·m × 10−8)Density (g/cm3)Thermal
Conductivity (W/m·K)
Weight
Considerations for EVs
Impact on Heat DissipationSuitability for High-Current EVs
Copper (Cu)58.01.688.96401Heavy, adds weightExcellent, low heat accumulationIdeal for high-power EVs
Aluminum (Al)37.72.652.70237Lightweight, reduces weightModerate, needs better coolingGood for moderate-power EVs
Nickel (Ni)14.36.848.9090Heavy, corrosion-resistantPoor, increases battery temperatureNot ideal for high discharge
Titanium (Ti)2.442.04.5121.9Moderate weightPoor, increases energy lossNot suitable for EVs
Stainless Steel1.469.07.8016Heavy, robustVery poor, requires advanced coolingNot recommended for EVs
Carbon-based (Graphene, CNTs)Variable (10–30)Variable (3–10)Low-ModerateVariable (100–200)Very light, flexibleGood, reduces hot spotsPromising for next-gen EVs
Table 2. Electrical and thermophysical properties of the battery cells.
Parameter Value ParameterValue
Nominal Voltage, (V)3.7Nominal Capacity, (A)2.5
Mass, (kg)0.045Diameter, (mm)18
Length, (m)65Thermal Conductivity, ( W · m 1 · K 1 ) K r = 0.2 , K z = 37.6 [16]
Density, ( k g   m 3 ) 2722Specific Heat Capacity, ( J · k g 1 · K 1 )1200
Table 3. Properties of the fan used for air cooling of battery pack.
Parameter Value ParameterValue
Outer diameter, (mm)50Module case size (Length × width × height), (mm)62 × 62 × 65
Inlet air temperature, (°C)26Inlet air velocity at 12 V, (m·s−1)2
Disclaimer/Publisher’s Note: The statements, opinions and data contained in all publications are solely those of the individual author(s) and contributor(s) and not of MDPI and/or the editor(s). MDPI and/or the editor(s) disclaim responsibility for any injury to people or property resulting from any ideas, methods, instructions or products referred to in the content.