1. Introduction
According to the World Health Organization (WHO), 3.8 million people lose their lives annually due to adverse effects of a polluted indoor atmosphere [
1]. The increasing use of modern appliances, cooking, smoking, and no-ventilation spaces in offices and residential areas reduce indoor breathing quality, which greatly affects human well-being. Numerous systems have been proposed to measure air quality parameters. In India, a system [
2] was designed to collect the composition of carbon monoxide (CO), temperature, and humidity in the air and predict if the air is safe to breathe. It utilized a 9 V battery and LM7805 regulator to power the MQ7 sensor. This paper also highlighted that the output voltage levels may fluctuate due to inadequate power supply when both sensors are active, potentially impacting the accuracy of the readings. Another air quality monitoring system was proposed in Indonesia in which the PMS5003 sensor was utilized to measure the PM2.5 levels in poorly ventilated village homes [
3]. The research discusses the dependency on IoT, emphasizing that it requires a stable internet connection, which may be a challenge in rural areas. Moreover, poorly ventilated village homes may be affected by a range of air pollutants beyond just PM2.5. The paper cited in [
4] developed an indoor monitoring system to detect PM2.5, PM10, and PM1. The research was conducted in a closed chamber with a space to permit the air for the system to detect the PM concentrations. A vacuum cleaner was also utilized if the concentrations exceeded the defined level. However, this chamber-based study reflects a more idealized setup rather than typical indoor environments, which often have varying ventilation rates and pollutant levels. Moreover, this study focuses solely on a vacuum cleaner, which may not represent the full range of available air purifiers. Another research study [
5] was also conducted in Pekanbaru, Indonesia. An air monitoring system was introduced to measure the temperature, humidity, and carbon monoxide using DHT11 and MQ135 sensors, respectively. However, the research did not properly address the sensor’s placement and coverage for real-time data collection. The above-proposed mechanisms are developed to predict air quality based on the data collected from sensors. However, the reliability of these studies’ results is questionable due to the lack of sensor calibration before the data collection. Moreover, most of the proposed systems are only confined to measuring the concentrations of temperature, humidity, CO, and CO
2 while ignoring the other harmful pollutants affecting human health.
Based upon the discussed research gaps and to fill them, this research is conducted to propose an air quality monitoring device that is efficient at displaying real-time results. The system is designed to detect the concentrations of temperature, humidity, carbon monoxide (CO), methane (CH4), and PM2.5 from the indoor atmosphere while displaying the results on the ThingSpeak IoT platform of MathWorks (Portola Valley, CA, USA). Unlike conventional air monitoring systems that merely collect and display pollutant data, the proposed system features a relay interface that enables seamless integration with any standard air purifier. When pollutant levels exceed the predefined safety thresholds, the system automatically activates the air purifier, providing an active response to improve indoor air quality while also consuming power through automatic operation. This proactive approach enhances indoor air quality by reducing harmful gases in real time, making the system more effective at preventing long-term health risks.
2. Materials and Methods
In the system, the Esp32, 30-pin by Espressif Systems, Shanghai, China, module was used, which comes with built-in Wi-Fi and Bluetooth capacity to ensure seamless cloud connections. As seen in
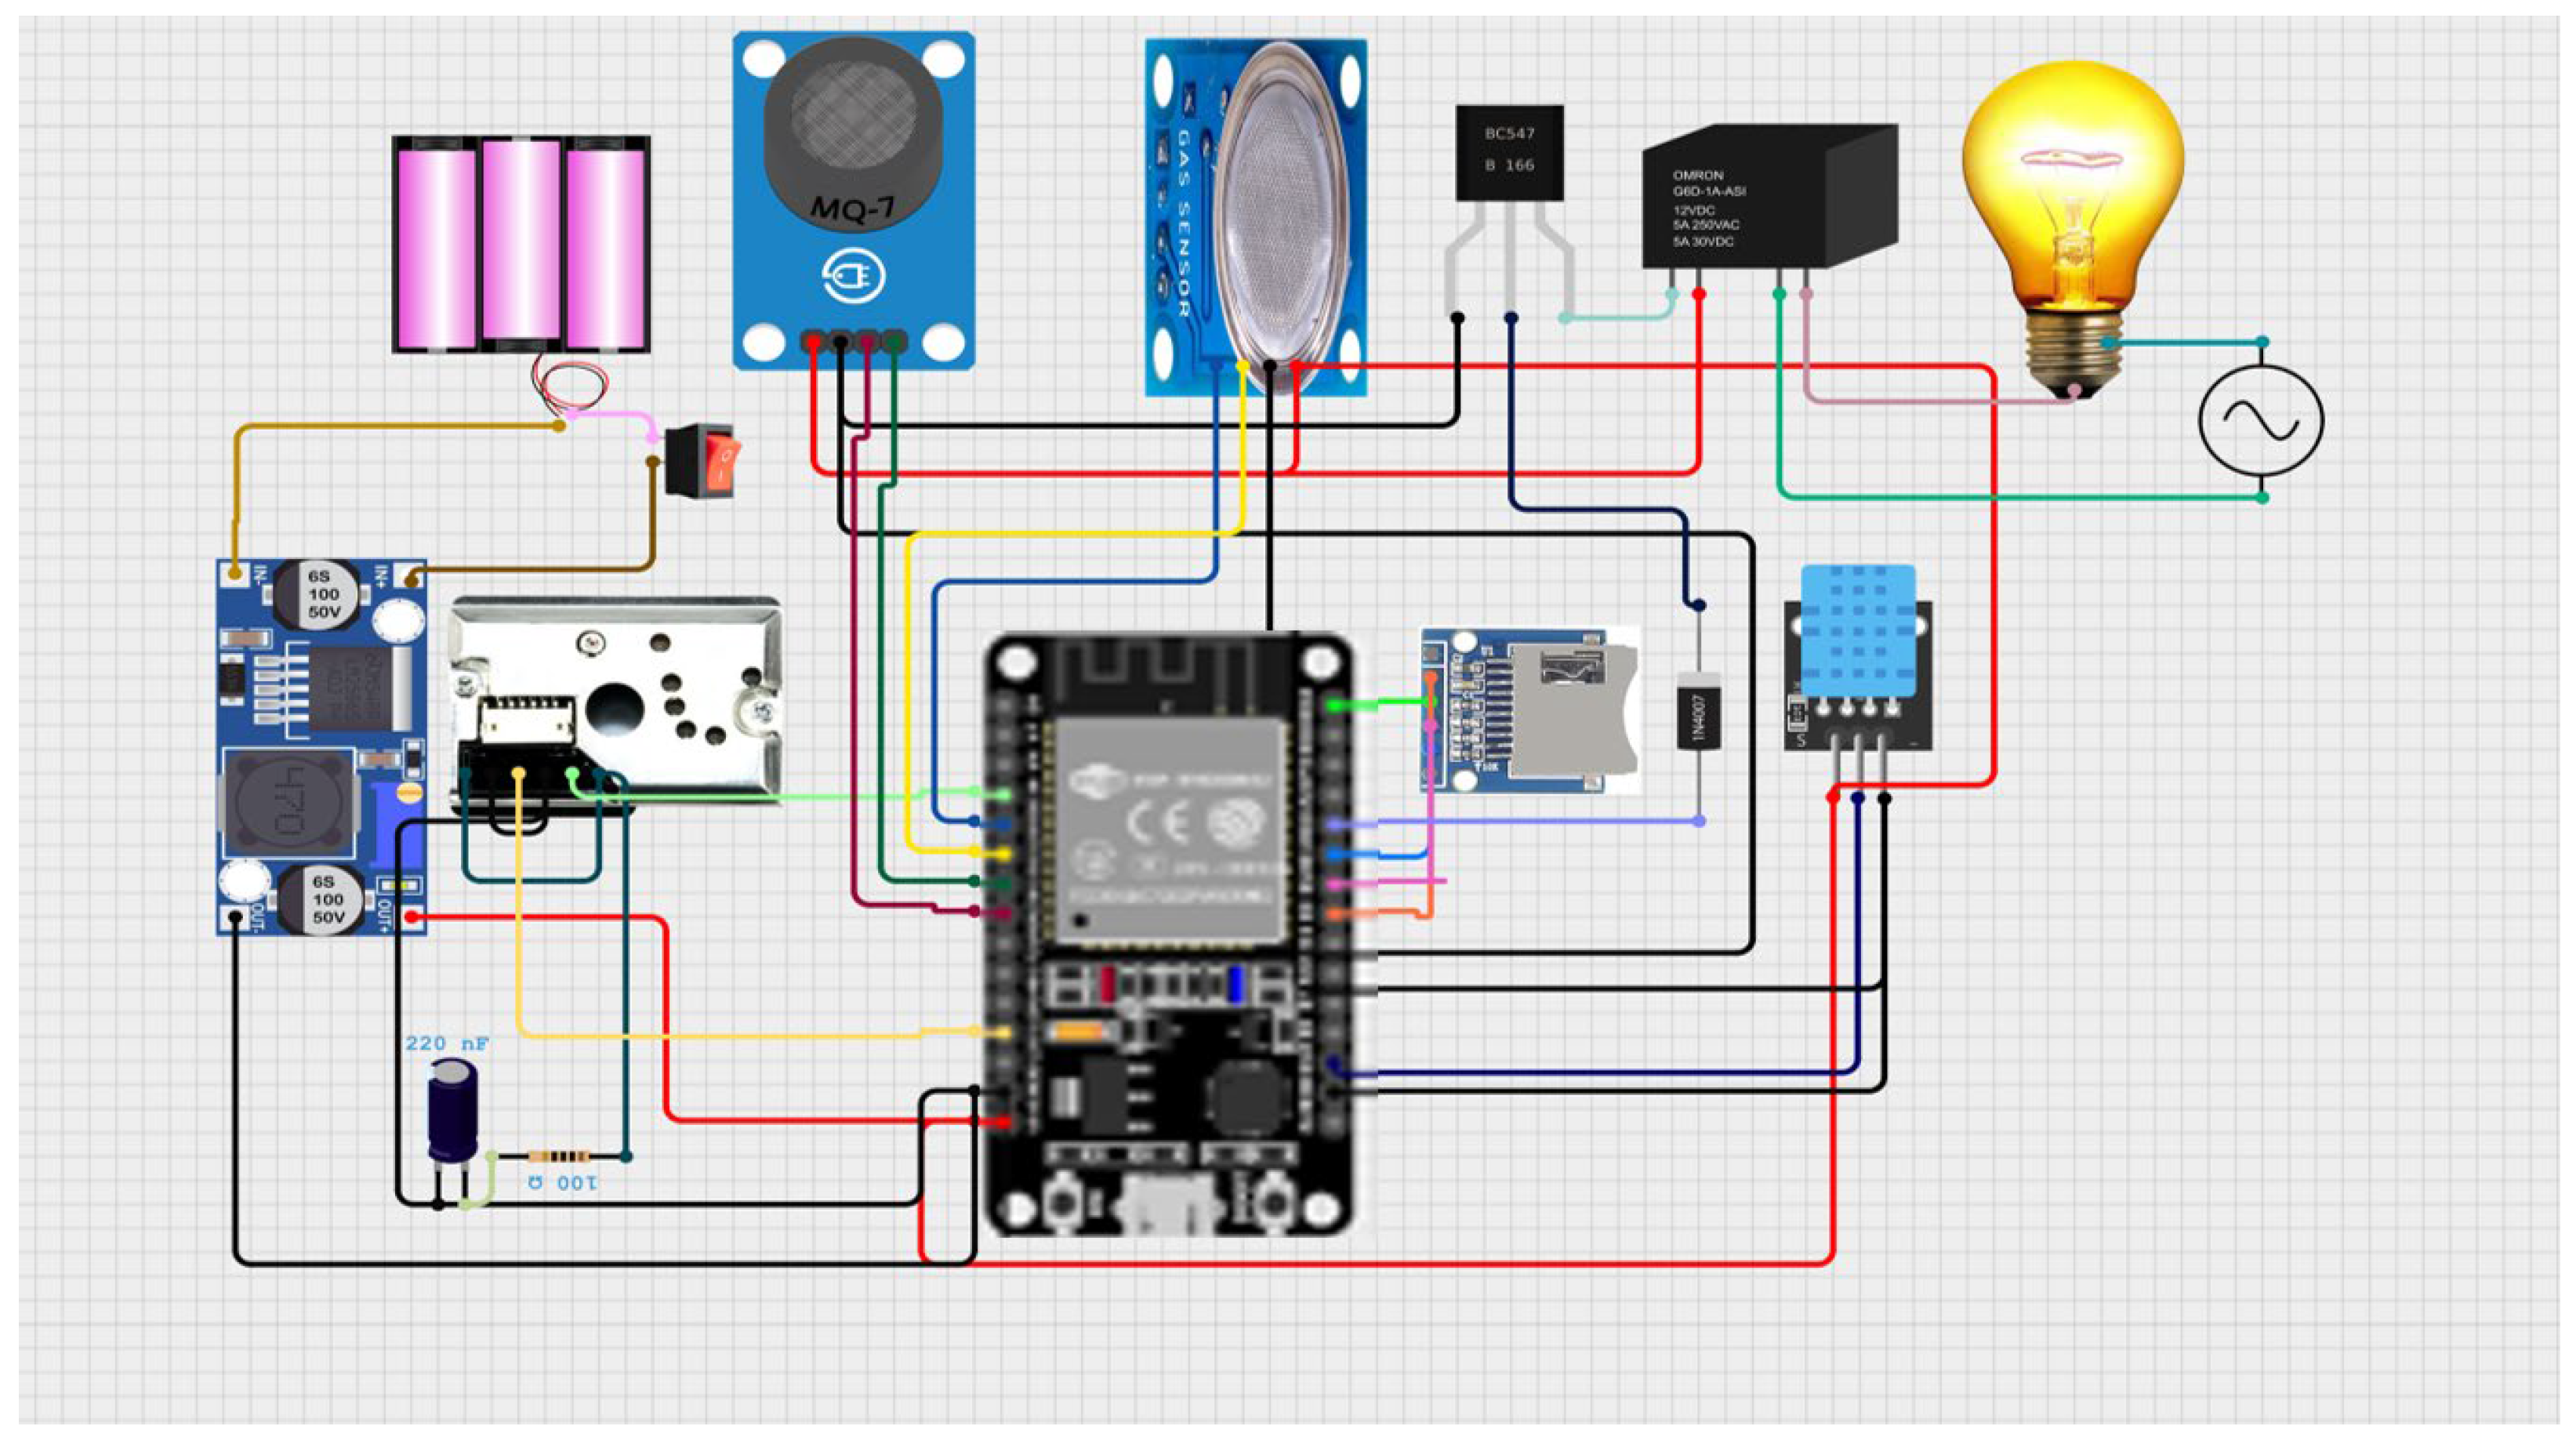
Figure 1, the MQ-2 sensor by Zhengzhou Winsen Electronics Technology Co., Ltd, Zhengzhou, China is linked to pin-9, the MQ-7 sensor by Hanwei Electronics Group Corporation, Zhengzhou, China is attached to pin-11, the DHT11 by Aosong Electronics Co., Ltd, Guangzhou, China sensor is attached to pin-8, and the dust sensor GP2Y1010AU0F by Sharp Microelectronics, Osaka, Japan is connected to the number 2 pin of the ESP32 microcontroller by Espressif Systems, Shanghai, China. To power up the circuit, a 12v adaptor was used with a power jack; however, since ESP32 does not tolerate voltages exceeding 5v, the voltage was stepped down to 5v using an LM2596 buck converter by Texas Instruments, Dallas, TX, USA. The relay is connected to pin-13 of ESP32, which further incorporates a bulb as a space for an air purifier.
The MQ7 is primarily used for detecting carbon monoxide (CO), also considered a hidden danger to human health, under a specified range of 20 to 2000 parts per million (ppm) [
6]. It also responds to some other gases in the environment, though to a lower extent, proving to only measure CO gas. To ensure accurate readings, all sensors were calibrated before deployment. The MQ7 and MQ2 sensors were calibrated using a reference gas chamber with known CO and CH
4 concentrations. The GP2Y1010AU0F sensor was validated against a precision particle counter, while the DHT11 sensor was cross-checked with a digital hygrometer and thermometer. Multiple calibration tests ensured accuracy and minimal deviation from standard devices. When the data were collected by the MQ7 and MQ2 sensors, it was observed that the sensors were giving raw values. The raw analog values from the MQ7 and MQ2 sensors are read as a 12-bit ADC output (ranging from 0 to 4095) on the ESP32. Since the sensor’s response is proportional to the detected gas concentration, the conversion Formulas (1) and (2) scale the raw values to ppm based on sensor sensitivity. Factor 1000 aligns with the calibration data from the sensor’s datasheet, ensuring accurate readings.
For monitoring PM2.5, the GP2Y1010AU0F sensor was utilized. PM2.5 signifies the particulate matter with a 2.5 μm diameter or even smaller (≤2.5 µm) [
7]. Being tiny, these particles enter the respiratory and cardiovascular systems, causing major health issues to people sensitive to these systems. To measure the temperature and humidity levels, the DHT11 sensor was used. It is designed to measure temperatures between 0 and 50 °C and humidity from 20% to 90%. The World Health Organization’s (WHO) comprehensive guidelines for acceptable concentrations of various indoor air pollutants were assisted to ensure the standard data collection of the proposed device [
8]. According to the WHO, carbon monoxide (CO) should be between 25 and 35 ppm. If the level exceeds this range, it can cause headache and nausea; however, if not controlled, it can lead to reduced oxygen levels in the body, causing hypoxia [
9]. The maximum allowable amount of PM2.5 is 15 µg/m
3; otherwise, it can prove to be a major health risk to the elderly, children, and pregnant women, leading to premature deaths. Likewise, humidity for the indoor atmosphere must be less than 50%. The acceptance level of methane (CH
4) for an enclosed space should be 10,000; exposure to more than this limit can cause headaches and loss of consciousness. When the sensors were integrated, the program was compiled containing the acceptance ranges of every sensor, as described above. The relay, a space for a standard air purifier, was set to change the states if any of the parameters’ concentrations exceed the defined level as an indication to turn on the air purifier and shut off automatically once the air is clean, hence consuming less power [
10]. The SD card module was used to keep a record of the readings of every sensor [
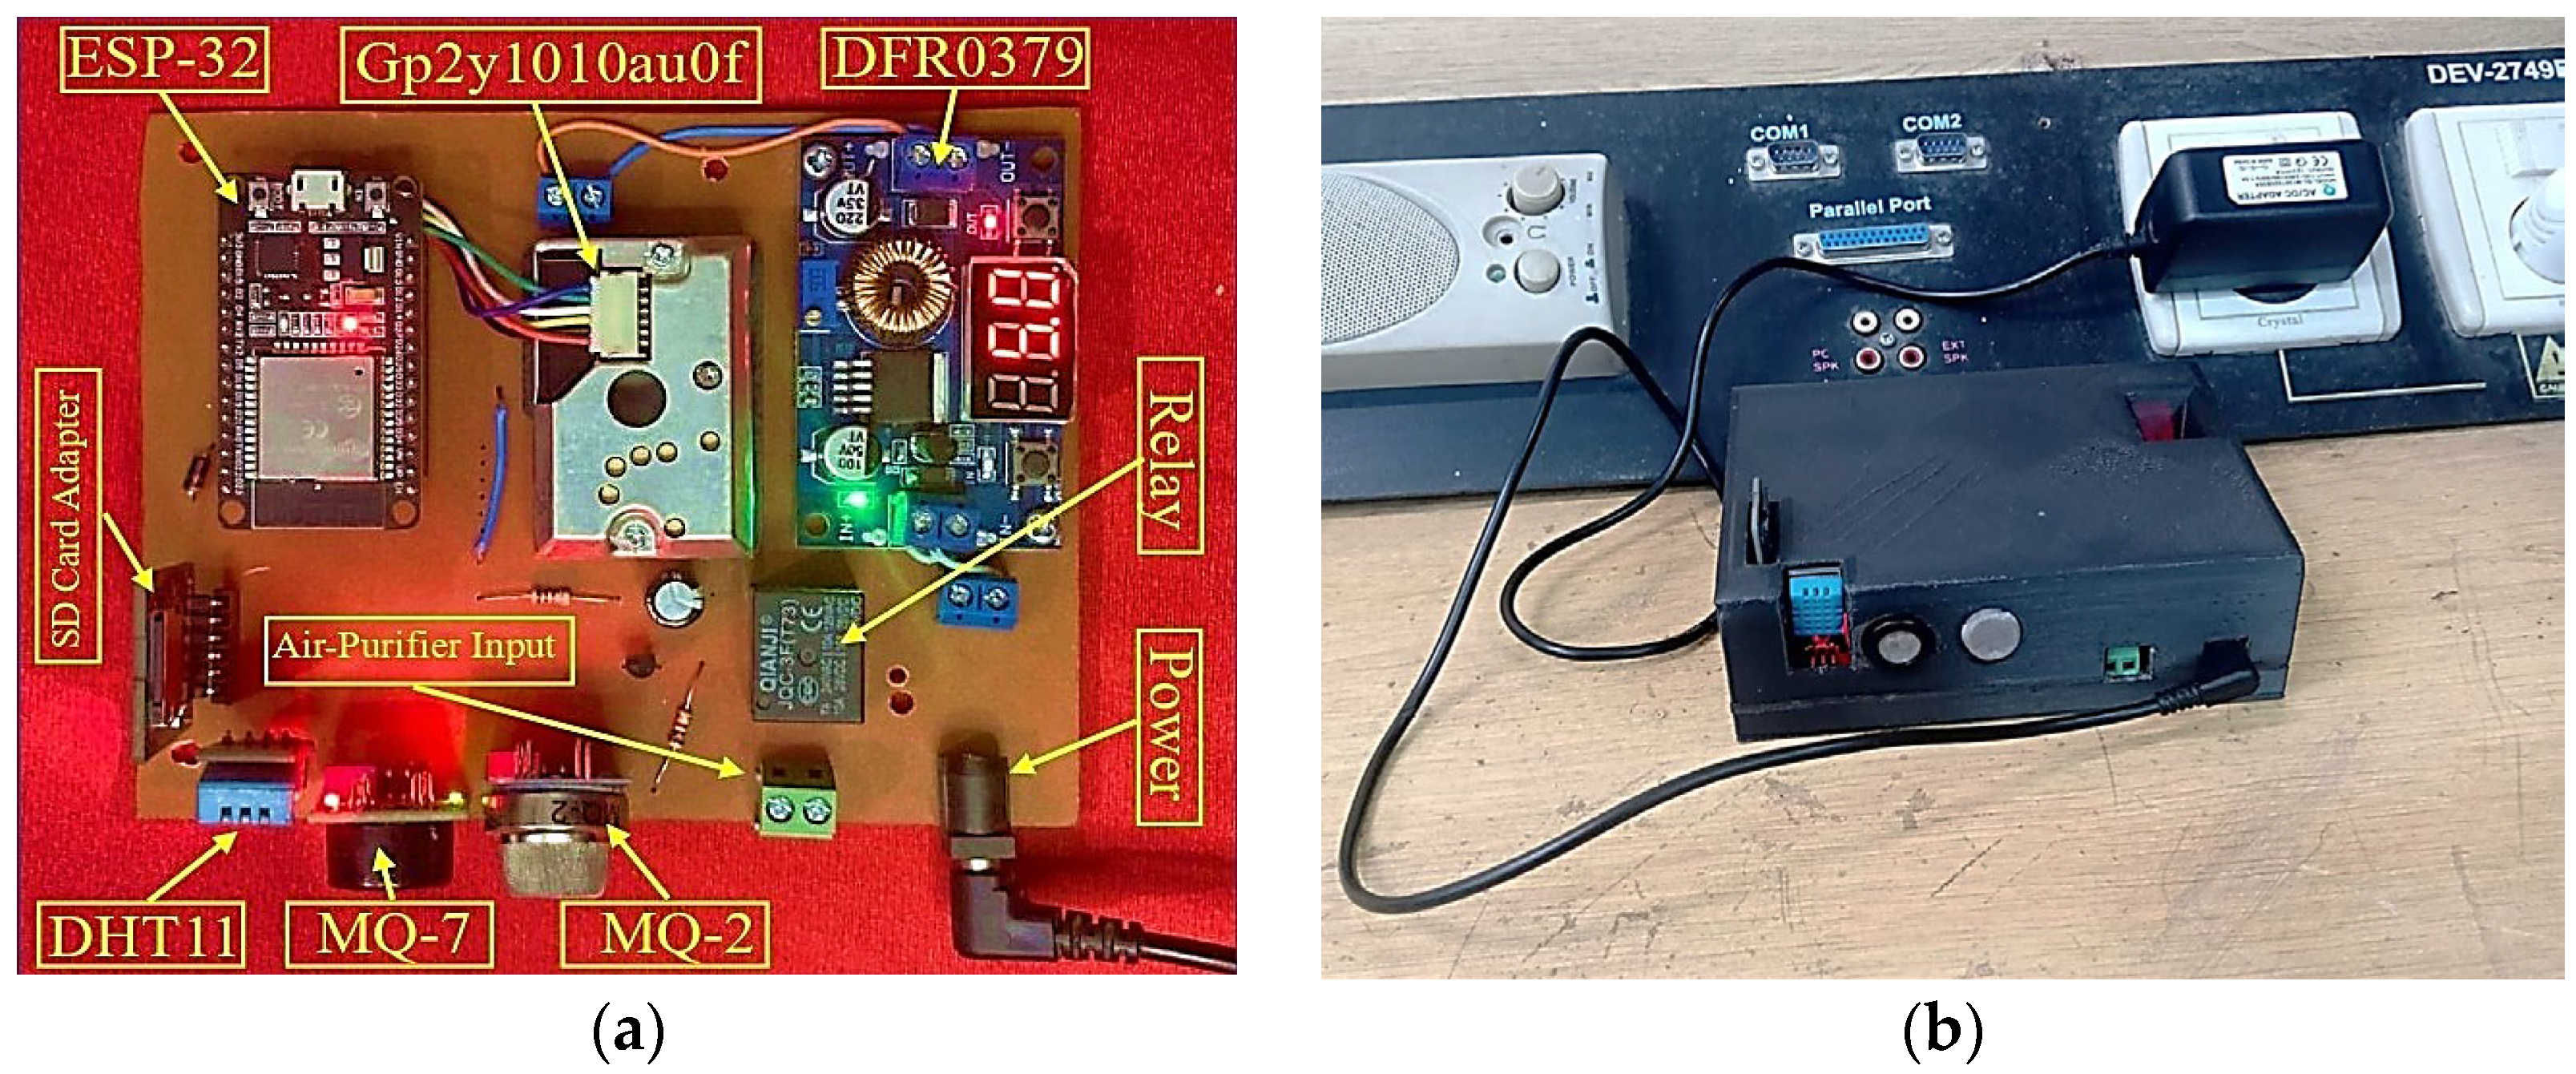
11]. The module enabled the efficient storage of real-time data to provide systematically recorded measurements for further analysis and improvement in the indoor environment. The system was further tested with strong, moderate, and weak Wi-Fi signals to ensure the reliability of Wi-Fi connectivity and data logging due to varying indoor locations. As the proposed device is designed to be mounted anywhere, a protective case was designed using SOLIDWORKS software of version 2023, shown in
Figure 2, to minimize potential damage and provide incorporated features for convenient installation while ensuring the long-term data acquisition of the sensors [
12].
The material chosen for the case was polylactic acid (PLA) due to its eco-friendly, fine finishing, and cost-effective properties. The PCB board was measured with the components inserted. The openings of the sensors, SD card module, buck converter, and power jack were cut to improve the engagement of the device with the environment. The ventilation slots prevent the overheating of the circuit.
Figure 3 shows the final assembled and working hardware with the 3D-printed protective case.
3. Results
After ensuring the smooth connections of a complete circuit, the program was uploaded to ESP32 to enable the sensors to search for the data. ESP32 was further connected to the ThingSpeak IoT platform after feeding the provided API key to the code [
13]. As stated before, to obtain a measurable amount of data from the atmosphere, different locations were selected depending on the primary source of the emission of every parameter. The first location was an average indoor living room. The device was mounted at a safe place in the room. The GP2Y1010AU0F sensor activated and detected 3 µg/m
3 of PM2.5, while the incomplete combustion produced a large amount of carbon monoxide (CO) of 29.4 ppm, as shown in
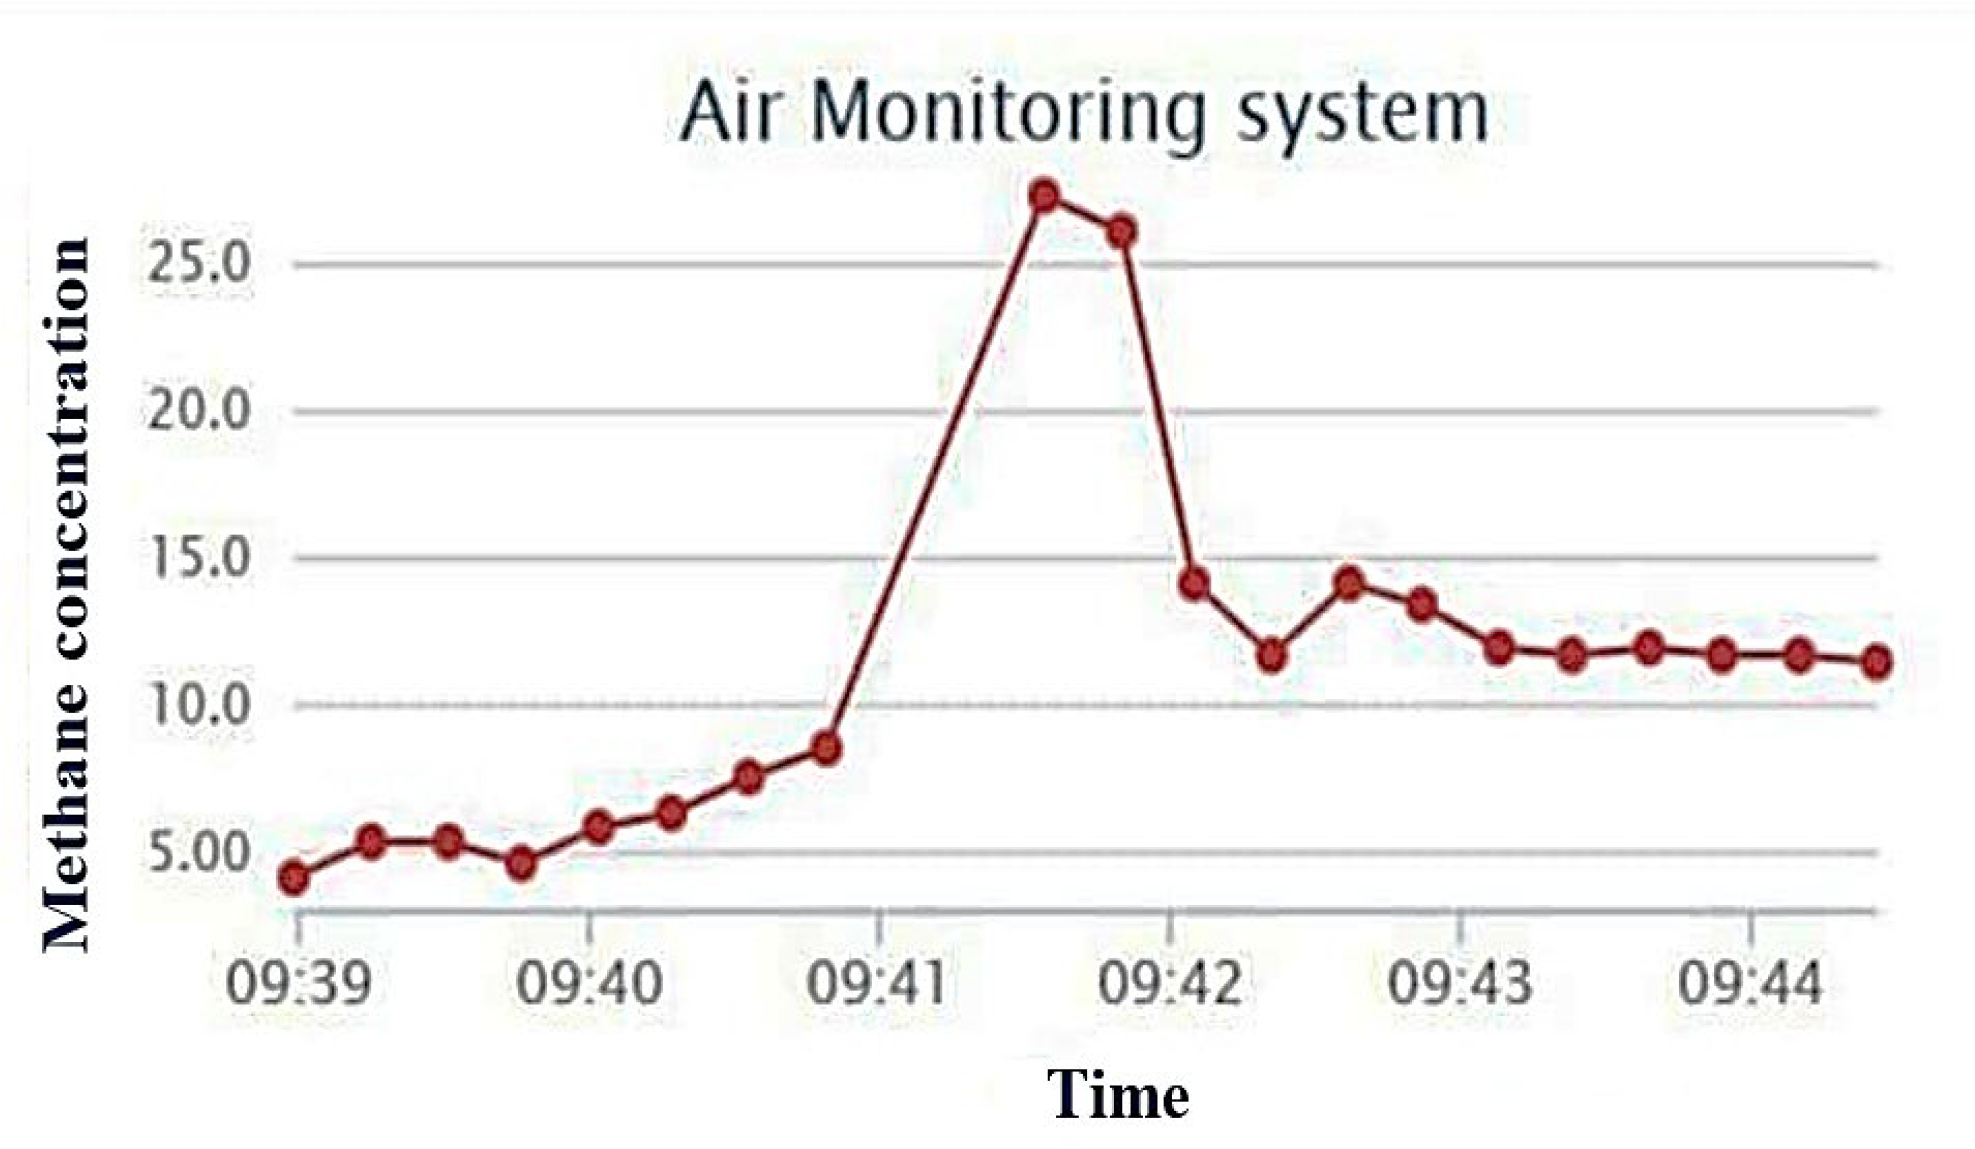
Figure 4. The system detected methane (CH
4) at 10.9 ppm, as shown in
Figure 5.
Figure 6 illustrates the data of temperature and humidity as 35 °C and 48% from a crowded office space.
To evaluate the accuracy of the proposed system, a widely used air monitoring device from a trusted brand ASHIQI (Shenzhen, China) assisted. The trusted device detected PM2.5 of around 3.11 µg/m
3, while the proposed system displayed 3 µg/m
3. Similarly for other parameters, the trusted device detected CO, CH
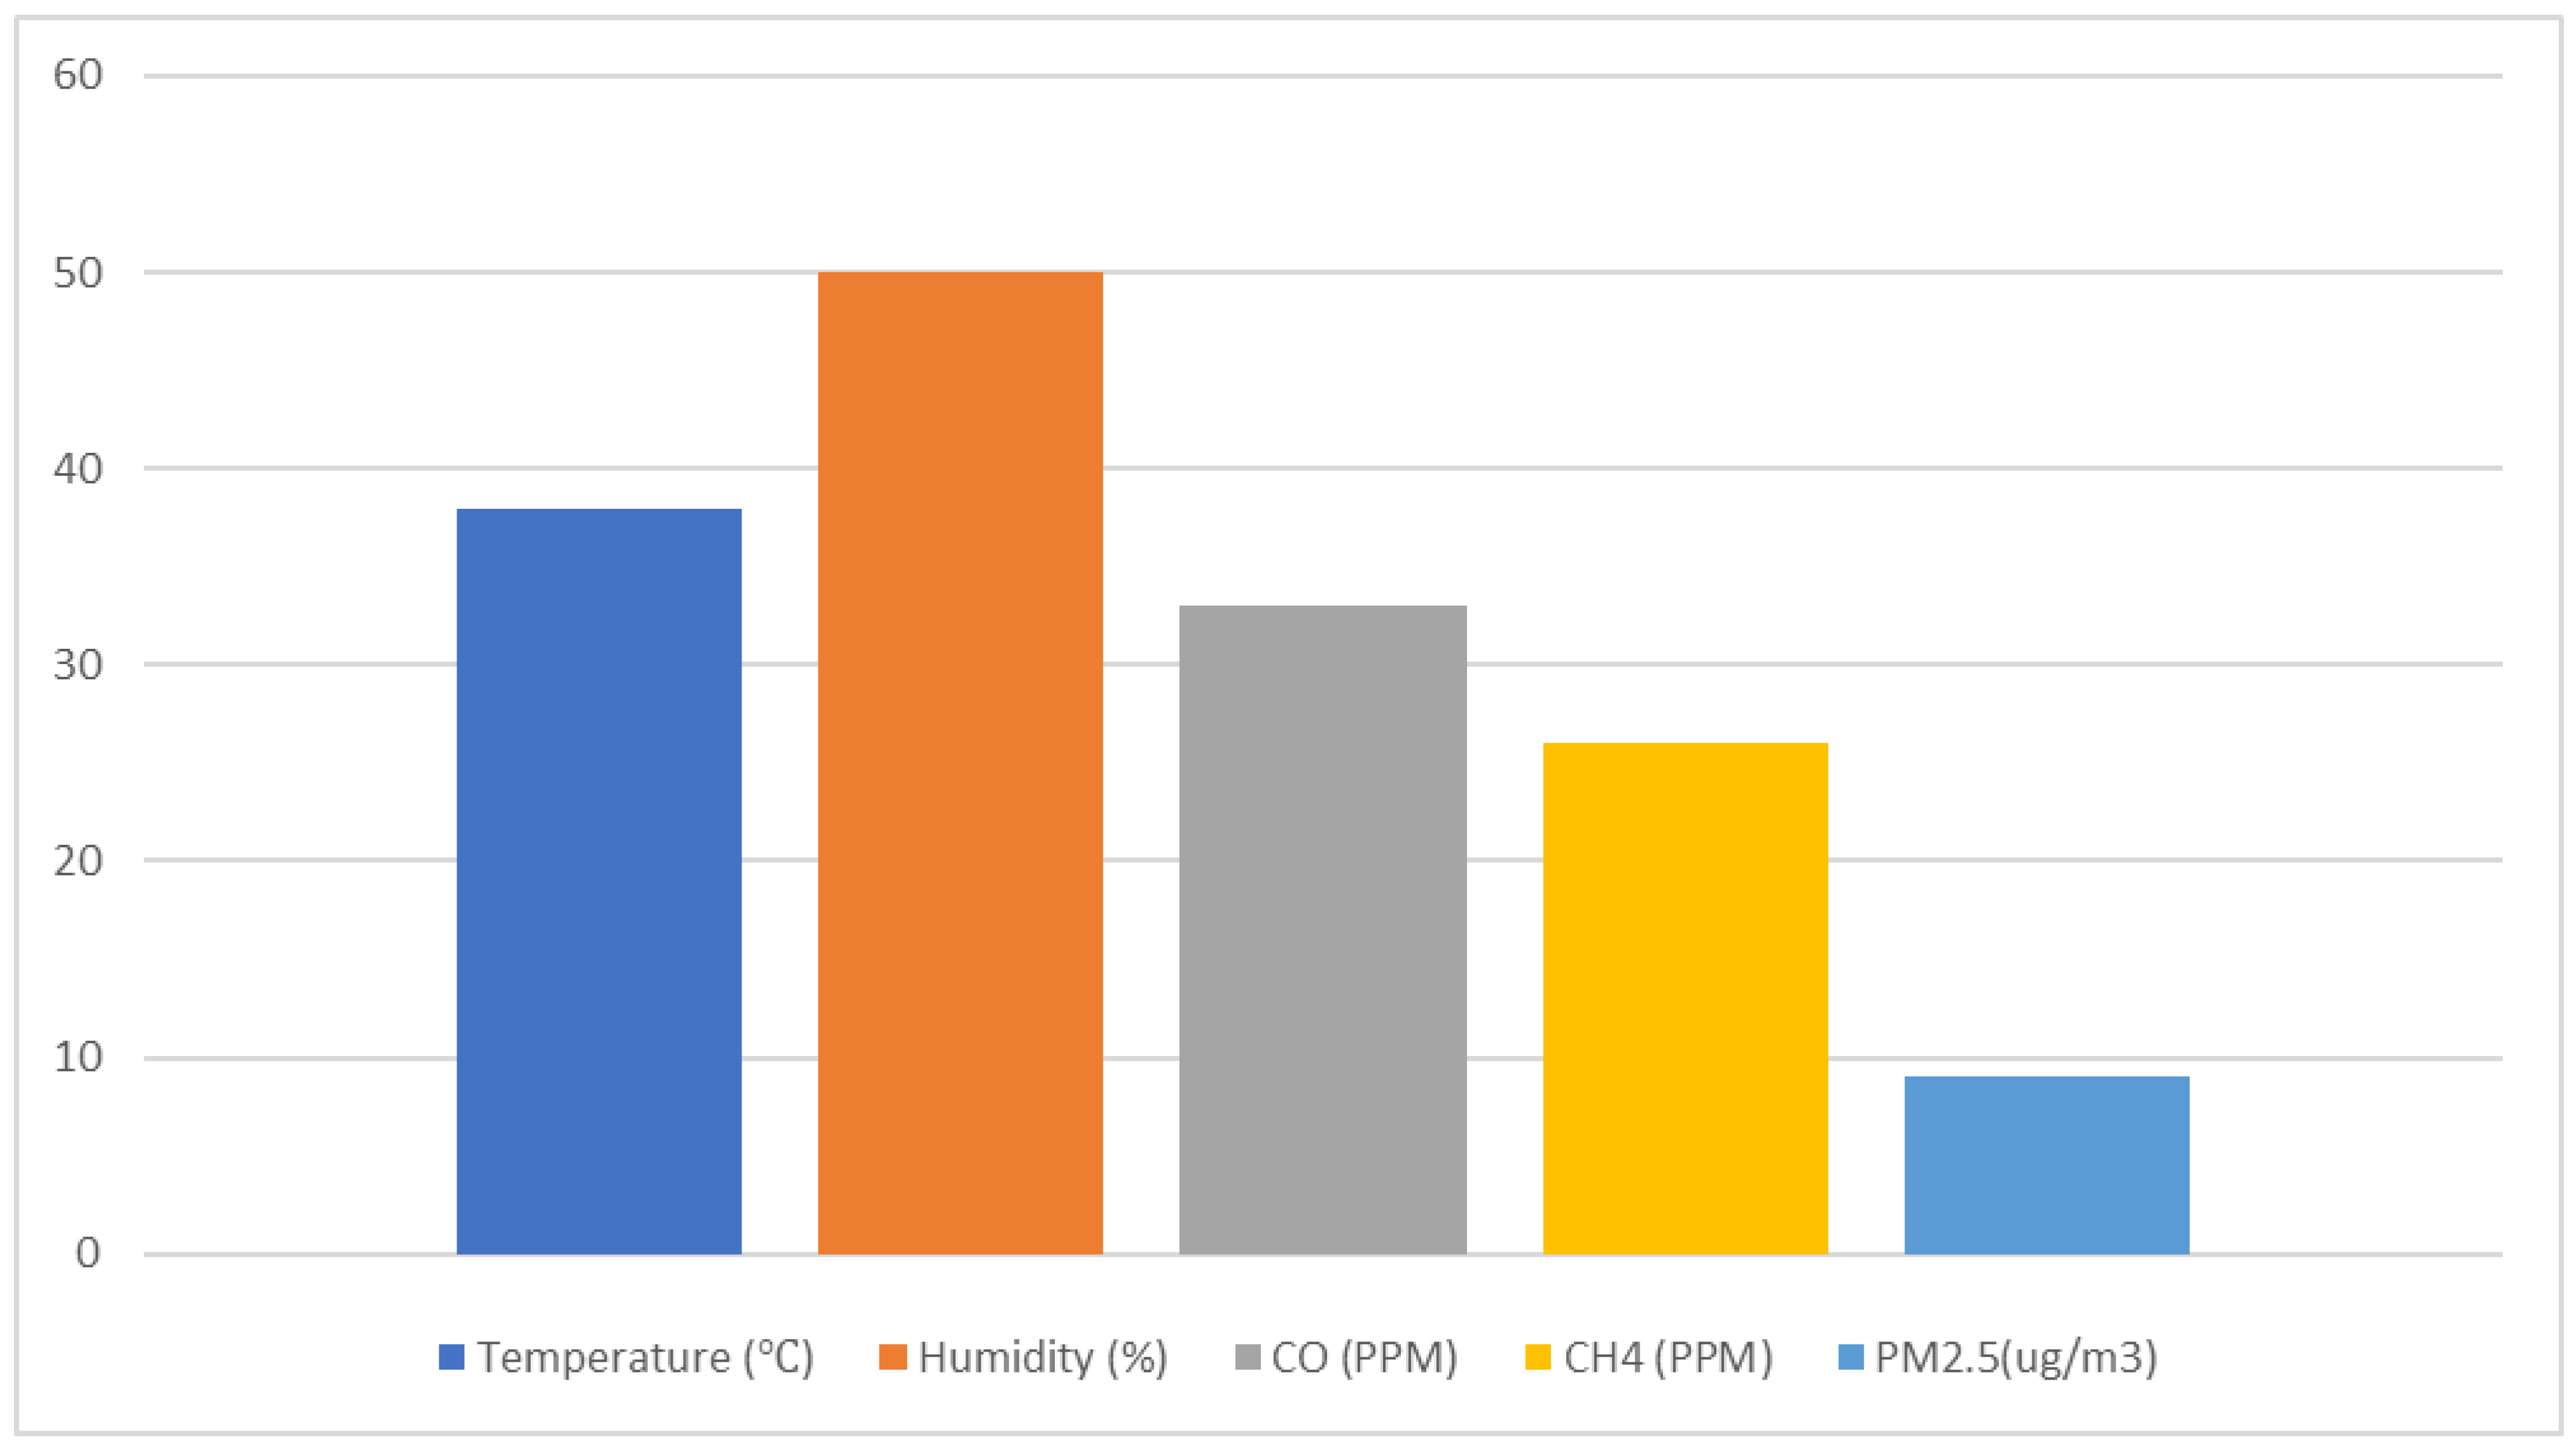
4, temperature, and humidity to be 30.2 ppm, 11.7 ppm, 38 °C, and 50%, respectively. When the data collected by both devices were analyzed and evaluated, the proposed air monitoring device was found to be 95% accurate in comparison with the trusted device. As the device was programmed to write the real-time data onto the SD card by creating a CSV file, the data were displayed in spreadsheet format with each parameter occupying a separate column and providing readings accordingly. The spreadsheet was converted into a column chart for better visualization, as illustrated in
Figure 7; it represents the environmental data recorded and stored in the SD card. This figure highlights the system’s ability to log sensor data for offline analysis and long-term environmental monitoring. During testing, when the CO levels exceeded 35 ppm, the relay successfully triggered the air purifier, reducing the CO concentration to 20 ppm within 15 min. Similarly, the PM2.5 levels dropped from 18 µg/m
3 to 10 µg/m
3 within 30 min of activation. These results demonstrate that the relay interface significantly enhances the system’s effectiveness in maintaining safer indoor air conditions.
4. Discussion
To monitor air quality, recent studies have integrated the MQ7 sensor [
2], PMS5003 (Nanchang Panteng Technology, Nanchang, China), to monitor PM2.5 [
3]. If the concentration of harmful air pollutants exceeds a certain level, a vacuum cleaner is also used for air purification [
4], and to keep track of temperature, humidity and carbon monoxide DHT11 and MQ135 are used in this study [
5]. The monitoring of limited air pollutants with no standard integration of an air purifier with the system can lead to the incomplete monitoring of the indoor environment, leading to potential breathing hazards.
The proposed system is efficiently designed to capture the real-time concentrations of harmful air pollutants, e.g., carbon monoxide (CO), methane (CH4), and PM2.5, while also accounting for temperature and humidity. It utilizes calibrated MQ7, MQ2, GP2Y1010AU0F, and DHT11 sensors. To facilitate seamless air quality tracking, the system integrates with the ThingSpeak IoT platform. It is well designed to accommodate a standard air purifier to activate the air cleaning process when pollutant concentrations exceed safe limits. Further, to ensure consistent air tracking and safe mounting, the device comes with a protective case.
This study has few limitations, including that it primarily focuses on monitoring PM2.5 dust particles while not accounting for dust particles of other sizes, e.g., PM10 and PM1. The IoT platform is not supportive of improving user interaction by enabling mobile alerts when bad air is predicted. For future experiments, these limitations will be accounted for, along with a thought to monitor harmful air pollutants, e.g., VOCs. Introducing machine learning algorithms could also help to predict long-term air quality trends.


