Abstract
A computational fluid dynamics-based study of a corrugated wing section inspired by the dragonfly wing was performed for a low Reynolds number (10’000), focusing on gliding flight. The aerodynamic characteristics are compared to those of a typical technical aerofoil (NACA 0009). The objective of this study is to develop a simulation tool for the design and development of corrugated wings for aerospace applications and to gain a better understanding of the flow over corrugated wing sections. The simulation results were verified using a convergence study and validated by an angle of attack study and comparison with experimental results. The results demonstrated the simulations capability of predicting key flow features but there were some discrepancies from the experimental observations, mainly the prediction of the critical angle of attack. Overall, the simulation results demonstrated a comparable, if not better, aerodynamic performance compared to the technical aerofoil.
1. Introduction
The tandem and corrugated wing configuration of dragonflies has been the subject of extensive research [1], but there is no agreement on how the corrugation affects the aerodynamic performance [2]. Early wind tunnel experiments [3,4,5], along with the numerical study of [6], suggests that corrugation has no aerodynamic significance. However, other wind tunnel experiments [7] and numerical studies [8] of corrugated wings in gliding conditions suggests an enhanced lift/drag ratio compared to that of a flat plate or technical aerofoils. Overall, there is a consensus in the literature that corrugated wings provide structural benefits, allowing for a low mass yet stiff structure [8]; however, the question remains regarding the aerodynamic benefits. In addition, low Reynolds number effects remain an active research topic owing to the complexity of the flow physics in the flow regime considered here, but it has become widely accepted that simple shapes (e.g., a flat plate) have better aerodynamic performance compared to technical aerofoils, see [9].
The aim of the current research is to use numerical simulations to study the aerodynamic performance of a dragonfly corrugated wing compared to a standard NACA aerofoil for a fixed Reynolds number of 10’000. The main motivation is to develop a numerical tool for the design and development of corrugated wing sections for fixed-wing flying robots and to gain a better understanding of the flow physics.
2. Methods
The simulations in this study were carried out using COMSOL Multi-Physics. The corrugated wing geometry considered here is profile 1 from [7], with a chord length of 76 mm and a flow Reynolds number of 10’000. The wing was placed in a two-dimensional rectangular fluid domain where the width was 30 times the chord length and the height was 10 times the chord length. The wing was placed in the middle of the domain with a distance of 10 times the chord length from the inlet. The following boundary conditions were used: velocity inlet, pressure outlet, and wall (no-slip).
2.1. Governing Equations
The unsteady Navier–Stokes equations are solved in the following general form [10] for momentum
and continuity
where is the density of the fluid, is the velocity vector, p is the pressure, is the viscous stress tensor, and is the volume force vector. To close the equation system, constitutive relations are needed. For a Newtonian fluid, which has a linear relationship between stress and strain, the following expression is used:
where is the dynamic viscosity of the fluid and is the strain rate tensor.
The momentum equation is a (nonlinear) convection–diffusion equation. Such equations can easily become unstable if discretised using the Galerkin finite element method. Stabilised finite element methods are usually necessary in order to obtain physical solutions. By default, the following stabilisation techniques are applied: streamline and crosswind diffusion. The formulation of these techniques is described in [11,12].
2.2. Solver Setup
The default time-dependent solver for Navier–Stokes is the backward differentiation formula (BDF) method, with the maximum order set to two [10]. The time stepping used in the analysis is as follows: for the flow start up (0–3.4 s), a time step of 0.2 s was used to speed up the simulation before decreasing the time step to 0.02 s for the remainder of the simulation (3.5–7 s).
3. Results and Analysis
3.1. Verification and Validation
A grid convergence study for a total of eight grids from coarse to fine was used for the verification of the model, where the lift and drag coefficients were calculated using the standard formulae from the lift (L) and drag (D) forces, inlet velocity (u), and chord length (Lc):
The results shown in Table 1 only show the three finest grids where the finest model (149,886 degrees of freedom) was used in this work. The purpose of the verification is to ensure that the minimum grid requirements and convergence criteria are met.

Table 1.
Verification results, where DoF is the degrees of freedom, E is the difference between each successive solution, and R is the convergence ratio.
Here, the convergence ratio was used as the criteria, which is estimated using the following relation:
where the subscript donates the refinement level; for example, is the difference between grid 3 and grid 2. The criterium applied here is that the magnitude of R should be below 1. The results show that the lift coefficient meets this criteria (0.03), while the drag coefficient does not (−3.5). This implies oscillatory divergence of the drag coefficient solution. Nevertheless, the value predicted in Table 2 is very close to the experimental value.
Table 2.
Validation results for the lift and drag coefficients compared to the experiments of [7].
The model validation was conducted using an angle of attack (AoA) study for the range shown in Table 2. The results demonstrate the capability of the model in predicting the lift and drag coefficients with reasonable accuracy for most cases compared to the results from [7]. However, a few discrepancies were observed, mainly for a 5, 15, and 20 angle of attack. This could be due to the discrepancy in the setup of experiment and simulation (channel height is smaller in the experiment), the time averaging used to obtain the results, and/or the ability to predict flow transition characteristics. As a result, the model was not able to predict the critical angle of attack accurately, as show in Figure 1.
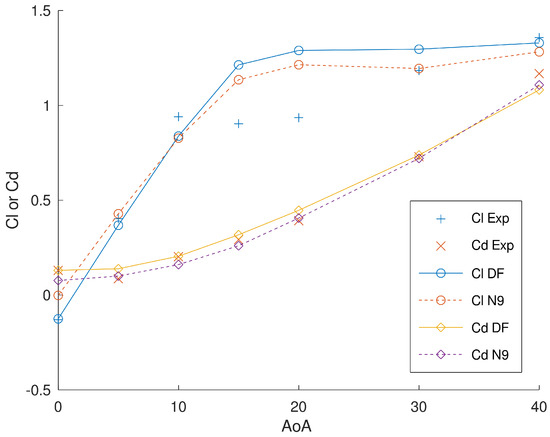
Figure 1.
Angle of attack study for the corrugated wing (DF) compared to the NACA0009 aerofoil (N9).
Overall, the model was capable of predicting the following key observations from experiment [7]: the negative lift generated at 0 angle of attack, and that there is no decrease in lift generation beyond a 20 degree angle of attack, which is typical in flows with a higher Reynolds number.
3.2. Angle of Attack Study
Here, we compare the results from the simulations of the corrugated wing and the NACA 0009 aerofoil. The angle-of-attack study, see Figure 1, shows little difference in the shape of the lift and drag coefficient curves.
This suggests that despite the non-streamline shape of the corrugated wing profile, its performance is comparable to that of a technical aerofoil. Moreover, our simulation results show a slight increase in Cl at a higher angle of attack compared to that of the NACA aerofoil. Similar observations were made in [8] for a slightly different corrugated profile. Another interesting observation was the reduction in skin friction drag compared to the technical aerofoil. The skin friction coefficient was calculated using the following equation:
where is the wall shear stress, u is the inlet velocity, and L is the chord length. A comparison between the corrugated wing and the NACA0009 aerofoil, see Table 3, demonstrates the substantial reduction in the skin friction coefficient.
Table 3.
Comparison of the skin friction coefficient between the corrugated wing and the NACA 0009 aerofoil.
Our analysis suggest that this is due to the local flow recirculation in the corrugated sections of the wing. These flow structures are presented in the next section.
3.2.1. Angle of Attack = 0 Degrees
The flow around the corrugated section is visualised using velocity streamlines. Here, we observe quasi-steady local recirculation regions on the upper and lower surfaces of the wing section, see Figure 2.
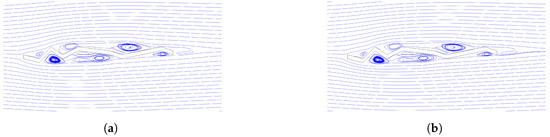
Figure 2.
Velocity streamlines at AoA = 0 degree for (a) Time step = 6 s (b) Time step = 6.3 s.
As a result, these recirculation regions act as a buffer between the wing surface and the freestream that reduces the skin friction drag over the body. A similar observation is reported in [8]. In addition, these recirculation regions indicate flow separation and the onset of a von Karman vortex street.
3.2.2. Angle of Attack = 10 Degrees
A steady leading-edge vortex is observed at this angle of attack with quasi-steady recirculation at the lower surfaces and rolling vorticies on the upper surface, see Figure 3.
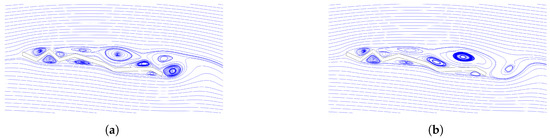
Figure 3.
Velocity streamlines at AoA = 10 degrees for (a) time step = 6.6 s and (b) time step = 6.7 s.
The vortex shedding at the trailing edge is more pronounced with a wider vortex street. It was observed here that the leading edge vortex influences the dynamics of the rolling vortices, which in turn affects the vortex shedding.
3.2.3. Angle of Attack = 30 Degrees
Here, we observe a twin vortex system at the leading edge with large rolling vortices on the upper surface and quasi-steady recirculation on the lower surface, see Figure 4.
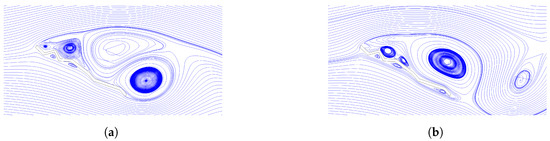
Figure 4.
Velocity streamlines at AoA = 30 degrees for (a) time step = 6.46 s and (b) time step = 6.6 s.
The vortex dynamics are dominated by the interaction between the leading and trailing-edge vortices. The interaction of the large vortical structures that are formed on the upper surface results in a very wide vortex street.
A key observation that was made from the angle-of-attack study is that the corrugation plays an important role in controlling the size and interaction of the recirculating and rolling eddies formed over the wing surface. The large laminar separation bubble that dominates the flow over the NACA aerofoil at this Reynolds number [9] is essentially trapped in the corrugated section of the wing. This in turn makes the boundary layer more energetic, reducing the adverse effects of flow separation.
3.3. Pressure Distribution
A comparison of the pressure distribution at a 10 degree angle of attack is plotted in Figure 5. The distribution over the NACA aerofoil matches the theoretical expectations and measurements from [13], where the profile is smooth with a large pressure gradient at the leading edge, and there is almost zero pressure at the trailing edge. By comparison, the profile over the corrugated wing is irregular. The upper surface is close to the aerofoil distribution, but the lower surface shows localised acceleration/deceleration of the flow caused by the rolling vortices. In addition, the stagnation pressure region at the leading edge extends to approximately 20% of the chord length over the corrugated wing.
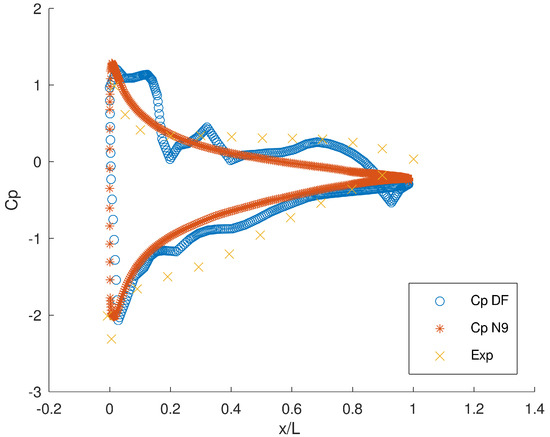
Figure 5.
Pressure distribution over the corrugated wing (DF) compared to NACA 0009 (N9) aerofoil at AoA = 10 deg and measurements for a typical aerofoil reported in [13].
These observations suggest that the corrugated wing produces a more favourable pressure gradient compared to the technical aerofoil.
4. Conclusions
In this work, we have developed a numerical application based on the finite element method to simulate the flow over a corrugated wing. This was verified by calculating the convergence ratio from three different grids. Validation was conducted using an angle-of-attack study and comparison with experimental results. The results show that the model was not capable of predicting the critical angle of attack accurately. However, it was capable of capturing key flow features, which included the negative lift at zero angle of attack and the stall delay at angles of attack larger than 20 degrees.
The flow visualisations provide insight into the reduction in skin friction drag observed for the corrugated wing compared to the NACA0009 aerofoil. A comparison of the pressure distribution suggests localised acceleration/deceleration of the flow over the corrugated wing and the stagnation pressure extends to approximately 20% of the chord length from the leading edge.
In conclusion, the developed application is capable of simulating the flow physics with reasonable accuracy. The application is particularly useful for conducting rapid design studies, which in the future will be used to extend our analysis to the full range of dragonfly profiles outlined in [7] to enhance our understanding of the flow features over the various corrugated profiles and apply them to the design and development of fixed-wing flying robots.
Author Contributions
Conceptualization, A.A.; methodology, A.A.; software, A.A.; validation, A.A. and T.S.; formal analysis, A.A.; investigation, A.A.; resources, A.A.; data curation, A.A.; writing—original draft preparation, A.A.; writing—review and editing, T.S.; visualization, A.A.; supervision, T.S.; project administration, A.A. All authors have read and agreed to the published version of the manuscript.
Funding
This research revived no external funding.
Institutional Review Board Statement
Not applicable.
Informed Consent Statement
Not applicable.
Data Availability Statement
The data presented in this study are available upon request from the corresponding author.
Conflicts of Interest
The authors declare no conflicts of interest.
References
- Shyy, W.; Lian, Y.; Tang, J.; Viieru, D.; Liu, H. Aerodynamics of Low Reynolds Number Flyers, 1st ed.; Cambridge University Press: Cambridge, UK, 2009; pp. 22–77. [Google Scholar]
- Zhang, Q.; Xue, R.; Li, H. Aerodynamic Exploration for Tandem Wings with Smooth or Corrugated Surfaces at Low Reynolds Number. Aerospace 2023, 10, 427. [Google Scholar] [CrossRef]
- Rees, C. Form and function in corrugated insect wings. Nature 1975, 256, 200–203. [Google Scholar] [CrossRef]
- Rees, C. Aerodynamic properties of an insect wing section and a smooth aerofoil compared. Nature 1975, 258, 141–142. [Google Scholar] [CrossRef] [PubMed]
- Rudolph, R. Aerodynamic properties of Libellula quadrimaculata L. (Anisoptera: Libelludidea), and the flow around smooth and corrugated wing section models during gliding flight. Odonatologica 1977, 7, 49–58. [Google Scholar]
- Meng, X.; Sun, M. Aerodynamic effects of corrugation in flapping insect wings in forward flight. J. Bionic Eng. 2011, 8, 140–150. [Google Scholar] [CrossRef]
- Kessel, A. Aerodynamic Characteristics of Dragonfly Wing Sections Compared with Technical Aerofoils. J. Exp. Biol. 2000, 203, 3125–3135. [Google Scholar] [CrossRef] [PubMed]
- Vargas, A.; Mittal, R.; Dong, H. A computational study of the aerodynamic performance of a dragonfly wing section in gliding flight. Bioinspir. Biomim. 2008, 3, 026004. [Google Scholar] [CrossRef] [PubMed]
- Winslow, J.; Otsuka, H.; Govindarajan, B.; Chopra, I. Basic Understanding of Airfoil Characteristics at Low Reynolds Numbers (104–105). J. Aircr. 2018, 55, 1050–1061. [Google Scholar] [CrossRef]
- COMSOL Multiphysics® v. 5.0. CFD Module User’s Guide; COMSOL AB: Stockholm, Sweden, 2014; pp. 116–151. [Google Scholar]
- Hughes, T.; Mallet, M. A New Finite Element Formulation for Computational Fluid Dynamics: III. The Generalized Streamline Operator for Multidimensional Advective-Diffusive System. Comput. Methods Appl. Mech. Eng. 1985, 58, 305–328. [Google Scholar] [CrossRef]
- Hauke, G.; Hughes, T. A Unified Approach to Compressible and Incompressible Flows. Comput. Methods Appl. Mech. Eng. 1985, 113, 389–395. [Google Scholar] [CrossRef]
- Schlichting, H.; Gersten, K. Boundary Layer Theory, 8th ed.; Springer: Delhi, India, 2011; pp. 16–18. [Google Scholar]
Disclaimer/Publisher’s Note: The statements, opinions and data contained in all publications are solely those of the individual author(s) and contributor(s) and not of MDPI and/or the editor(s). MDPI and/or the editor(s) disclaim responsibility for any injury to people or property resulting from any ideas, methods, instructions or products referred to in the content. |
© 2025 by the authors. Licensee MDPI, Basel, Switzerland. This article is an open access article distributed under the terms and conditions of the Creative Commons Attribution (CC BY) license (https://creativecommons.org/licenses/by/4.0/).