Proceeding Paper

Sensitivity of CO2 Flow in Production/Injection Wells in CPG (CO2 Plume Geothermal) Systems †

by
Sofianos Panagiotis Fotias
1,* and
Vassilis Gaganis
1,2
1
Mining and Metallurgical Engineering, National Technical University of Athens, 15773 Athens, Greece
2
Institute of Geoenergy, Foundation for Research and Technology, 73100 Chania, Greece
*
Author to whom correspondence should be addressed.
Presented at the 2nd International Conference on Raw Materials and Circular Economy “RawMat2023”, Athens, Greece, 28 August–2 September 2023.
Mater. Proc. 2023, 15(1), 95; https://doi.org/10.3390/materproc2023015095
Published: 19 March 2025

Abstract

:
Geothermal energy is typically produced from underground reservoirs using water as the working fluid to transfer heat energy to surface and eventually to the delivery point. CO2 has been proposed as an alternative working fluid due to its improved mobility, density and its supercritical phase state, leading thus to so-called CPG (CO2 Plume Geothermal) systems. As a positive side effect, the injected CO2 mass circulation in the reservoir can be considered a CO2 storage mechanism, which, depending on the size of the porous medium, may account for few millions of CO2 tons. Moreover, the thermosiphon effect, owned to the significant change of fluid density between the injection (cold) and the production wells (hot) as well as to its change along the wells, significantly reduces the need for pumping, hence the operating costs. In this work, we setup a mathematical model that fully describes flow in the production/injection wells doublet as well as in the geothermal reservoir. Subsequently, the model is used to evaluate the sensitivity of the beneficial effects of circulating CO2 rather than water. Parameters such as reservoir properties, injection temperature and thermal effects, are tweaked to demonstrate the sensitivity of each one to the system performance. The results can be utilized as a guideline to the design of such systems and to the emphasis needed to be paid by the engineers.

1. Introduction

Geothermal power plants harness the temperature difference between the Earth’s hot subsurface rock and the cooler surface to generate electricity. These systems transport thermal energy from underground to the surface using a working fluid, which then undergoes a partial conversion of thermal energy to electricity in a power plant. The cooled working fluid is typically reinjected into a subsurface reservoir to maintain the system pressure. Conventional geothermal energy technologies use naturally existing hot brine as the working fluid, and subsequently, the power plants are often installed in active tectonic or volcanic regions where the temperature gradient is abnormally high [1]. However, such thermal resources are limited in size and location, necessitating the development of new technologies to harness the vast amount of thermal energy available in the Earth’s crust.
Enhanced or Engineered Geothermal Systems (EGS) have been proposed as a solution to increase access to the geothermal resource base by artificially creating reservoirs in areas where flow favorable conditions are missing [2]. These systems typically utilize cold pressurized water injection for hydraulic fracturing of a subsurface formation. The injected water absorbs heat and is pumped back to the surface. Carbon dioxide (CO2) has also been proposed as the working fluid [3] as it is non-toxic, abundant, and non-flammable. However, the challenges associated with using it in EGS, such as its decreasing density in reservoir conditions and environmental impact in case of leakage, require advancements in its research and development. As a response to risks associated with using CO2 in EGS, CO2 Plume Geothermal (CPG) energy systems have been recently proposed and even developed [4]. CPG systems differ from conventional hydrothermal and EGS approaches in that they use CO2 as the primary working fluid and circulate it through naturally permeable sedimentary formations, creating a large-scale CO2 plume without facing risks associated with fracking.
Sedimentary basins suitable for CPG systems can be found worldwide [5]. These basins often consist of saline aquifers with high salinity, which makes them unsuitable for potable or industrial water resources. They can also include partially depleted oil and gas fields used for Enhanced Oil Recovery (EOR) operations [6]. In a CPG system, the buoyant CO2 must be confined by low-permeability or impervious caprock layers that overlay the permeable reservoir. CPG systems can be combined with CO2 Capture and Storage (CCS) sites [7,8], allowing for the simultaneous production of electricity and heat while sequestering CO2. This integration ensures reservoir integrity by mitigating overpressurization associated with CCS operations, which could induce seismicity and CO2 leakage. Additionally, a joint CPG-CCS system can enhance the profitability of CCS, thus advancing global efforts to mitigate climate change.
In geothermal systems that use CO2 as the subsurface working fluid, a buoyancy- driven thermosiphon can be created by taking advantage of density variations between the injection and production wells, see Figure 1. This eliminates the need for costly pumping commonly encountered in traditional hydrothermal installations. Brine does not exhibit considerable density variations, resulting in a similar pressure gradient between the injection and production wells which translates to similar wellhead pressures for both injection and production. In comparison, supercritical CO2 (SCCO2), which is typically present throughout the operating conditions of a CPG system, exhibits enhanced density variability. This allows for a thermosiphon to be generated by considering the smaller pressure gradient of the “hot” produced fluid compared to the larger gradient of the “cold” returning fluid that is injected after energy production. Consequently, the wellhead pressure of the production well is significantly higher than that of the injection one, facilitating the spontaneous fluid motion from the first to the latter, also known as a thermosiphon.
The generation of electricity from geothermal energy can be accomplished through direct or indirect methods [9]. Indirect systems are more suitable when there is a small pressure difference between the production and injection wellheads, along with a high temperature difference between the fluid exiting the production well and surface. In such situations, a secondary Rankine cycle is used to extract heat from the working fluid. On the other hand, direct systems are more beneficial when there is a significant pressure difference, as the main working fluid is expanded through turbines to produce electricity. Although CO2-based geothermal systems predominantly employ an indirect configuration, there is potential for a controlled direct configuration, offering increased capacity and flexibility. This study focuses on analyzing the sensitivity of CO2 flow in a closed overpressured overheated reservoir system with steady-state flow, considering various flow rates and the assumption of adiabatic injection/production to assess their impact on the thermosiphon effect. Calculating fluid flow involves numerically solving the mass, momentum and energy differential equations in wells and utilizing a linear IPR curve in the reservoir. However, several analytical solutions have also been proposed to address issues such as cap rock uplift [10], plume pressure buildup [11] and flow regime analysis [12]. These solutions have been validated through numerical simulations.
The equations governing single-phase flow in the well simulators are presented in Section Subsequently, sensitivity analysis scenarios are run in Section 3. The discussion of the results is facilitated in Section 4. Finally, conclusions are drawn in Section 5.

2. System Description

2.1. The System

The system consists of a large, homogeneous, isotropic and close reservoir of small relative thickness with an abnormally high temperature due to magmatic activity in the crust and a constant pressure. Additionally, there are two vertical wells in the system: one functioning as a producer and the other as an injector. These wells are positioned far apart, ensuring that they do not interact. Furthermore, miscibility effects are not considered, so there is no risk of fingering effects that may lead to water cut. The system has been in operation for an extended period, allowing the CO2 plume from the injector well to reach and fully saturate the surrounding drainage area around the production well. At this stage, the system can be characterized as being in a steady state, indicating a balance between the injection and extraction processes.

2.2. Inflow Performance

The assumption of single-phase flow allows for the definition of the injectivity I Equation (1) that depends solely on the reservoir’s characteristics [13,14] similar to the productivity index J in oil-producing systems [15]
I = k μ 2 π h ln r e r w
where k is the permeability, h is the reservoir’s thickness, µ is the viscosity and re, rw are the drainage area and well radius, respectively. The selected values used to calculate I are presented in Table 1. Injectivity I relates pressure difference between the bottomhole Pbh and the reservoir Pe pressures to the flow q that will occur inside the well [16] Equation (2).
q = I · (PePbh)

2.3. Wellbore Flow

Single-phase flow in the wellbore can be described by the principles of conservation of mass, momentum and energy. The conservation of mass is stated in Equation (3)
d m ˙ d z = 0 d d z ρ u = 0 u ρ P d P d z + ρ h d h d z + ρ d u d z = 0
where ρ is the CO2 density which is considered as a function of (P, h), with P being the pressure, h the specific enthalpy, is the mass flow rate, z is the depth and u is the fluid velocity. The conservation of energy can be written as Equation (4)
d d z m ˙ u 2 2 + g z + h + Q ˙ = 0     m u ˙ d u d z + m ˙ d h d z + m g ˙ + Q ˙ = 0
where g is the gravity constant and Q ˙ is the pipe heat loss which for the case of an adiabatic process is set to zero. Finally, momentum conservation is derived from Newton’s second law and expressed in Equation (5)
ρ u d u d z + d P d z + ρ g + ρ f 2 d | u | u = 0
where d is the pipe diameter (d = 2rw) the friction factor f is derived from Blasius relation for smooth pipes Equation (6)
f = 0.316 R e 1 / 4 ,   Re = ρ u d μ
Equations (3)–(5) may be assembled to the following system Equation (7) [17]
ρ u ρ P u ρ h m u ˙ 0 m ˙ ρ u 1 0   d d z   u P h   +   0 m ˙ g + Q ˙ ρ g + ρ f 2 d | u | u   =   0 0 0
which can be easily solved using a suitable numerical approach.

3. Sensitivity Analysis

To strengthen the steady-state hypothesis, the mass flow rate produced will match the mass flow rate that is injected into the system. This means that flow properties remain constant over time, with no net accumulation or depletion of mass Equation (8). CO2 thermodynamic properties such as viscosity, density and enthalpy throughout this work are calculated using the software CoolProps 6.7.0 [18].
m ˙   inj   =   m ˙   prod     ρ ˙ inj q ˙ inj   =   ρ ˙ prod q ˙ prod
Sensitivity analysis will be conducted on the base case, which comprises vertical wells with specific parameters outlined in Table 1. The analysis aims to investigate the impact of varying parameters on the mass flow rate-total available energy curve. The calculation of total available energy involves assessing the enthalpy differences between the injected and produced fluids at the wellheads, considering their respective thermodynamic properties. This evaluation extends up to a predetermined point of interest. However, the mass flow rate is subject to a constraint described by Equation (2). According to this equation, increasing the mass flow rate leads to a simultaneous decrease in production pressures and an increase in injection pressures. This dynamic results in similar wellhead pressures for both wells at a certain threshold, effectively halting the thermosiphon effect. To quantify the ideal power output E, Equation (9) is employed. This equation provides an estimation of the optimal power output considering the given well parameters and operational conditions.
E = ( h p r o d w h h p r o d w h ) m ˙
The parameters selected for adjustment are the injection temperature, the adiabatic hypothesis, and the reservoir permeability. Those parameters were selected due to their optimization capabilities (injection temperature) or their uncertain nature (permeability, adiabatic hypothesis). Analyzing the injection temperature is of utmost importance as it provides insights into the anticipated power loss when the fluid is not adequately cooled before injection, relative to the ambient temperature. Relaxing the adiabatic hypothesis is expected to yield significant shifts in the results. By introducing Q ˙ (heat exchange) into the system, the density variations within the wells become more pronounced due to the fluid’s exposure to more substantial temperature changes. Additionally, tweaking the permeability parameter will shed light on the significance of I in a CPG system. This adjustment will help assess the importance of fluid flow characteristics in relation to the overall performance of the system.

4. Results/Discussion

In this section, the sensitivity analysis results are presented for three key parameters: injection temperature, reservoir permeability and the adiabatic assumption (represented by the heat loss coefficient). The figures throughout this section each show four key variables plotted against the mass flow rate :
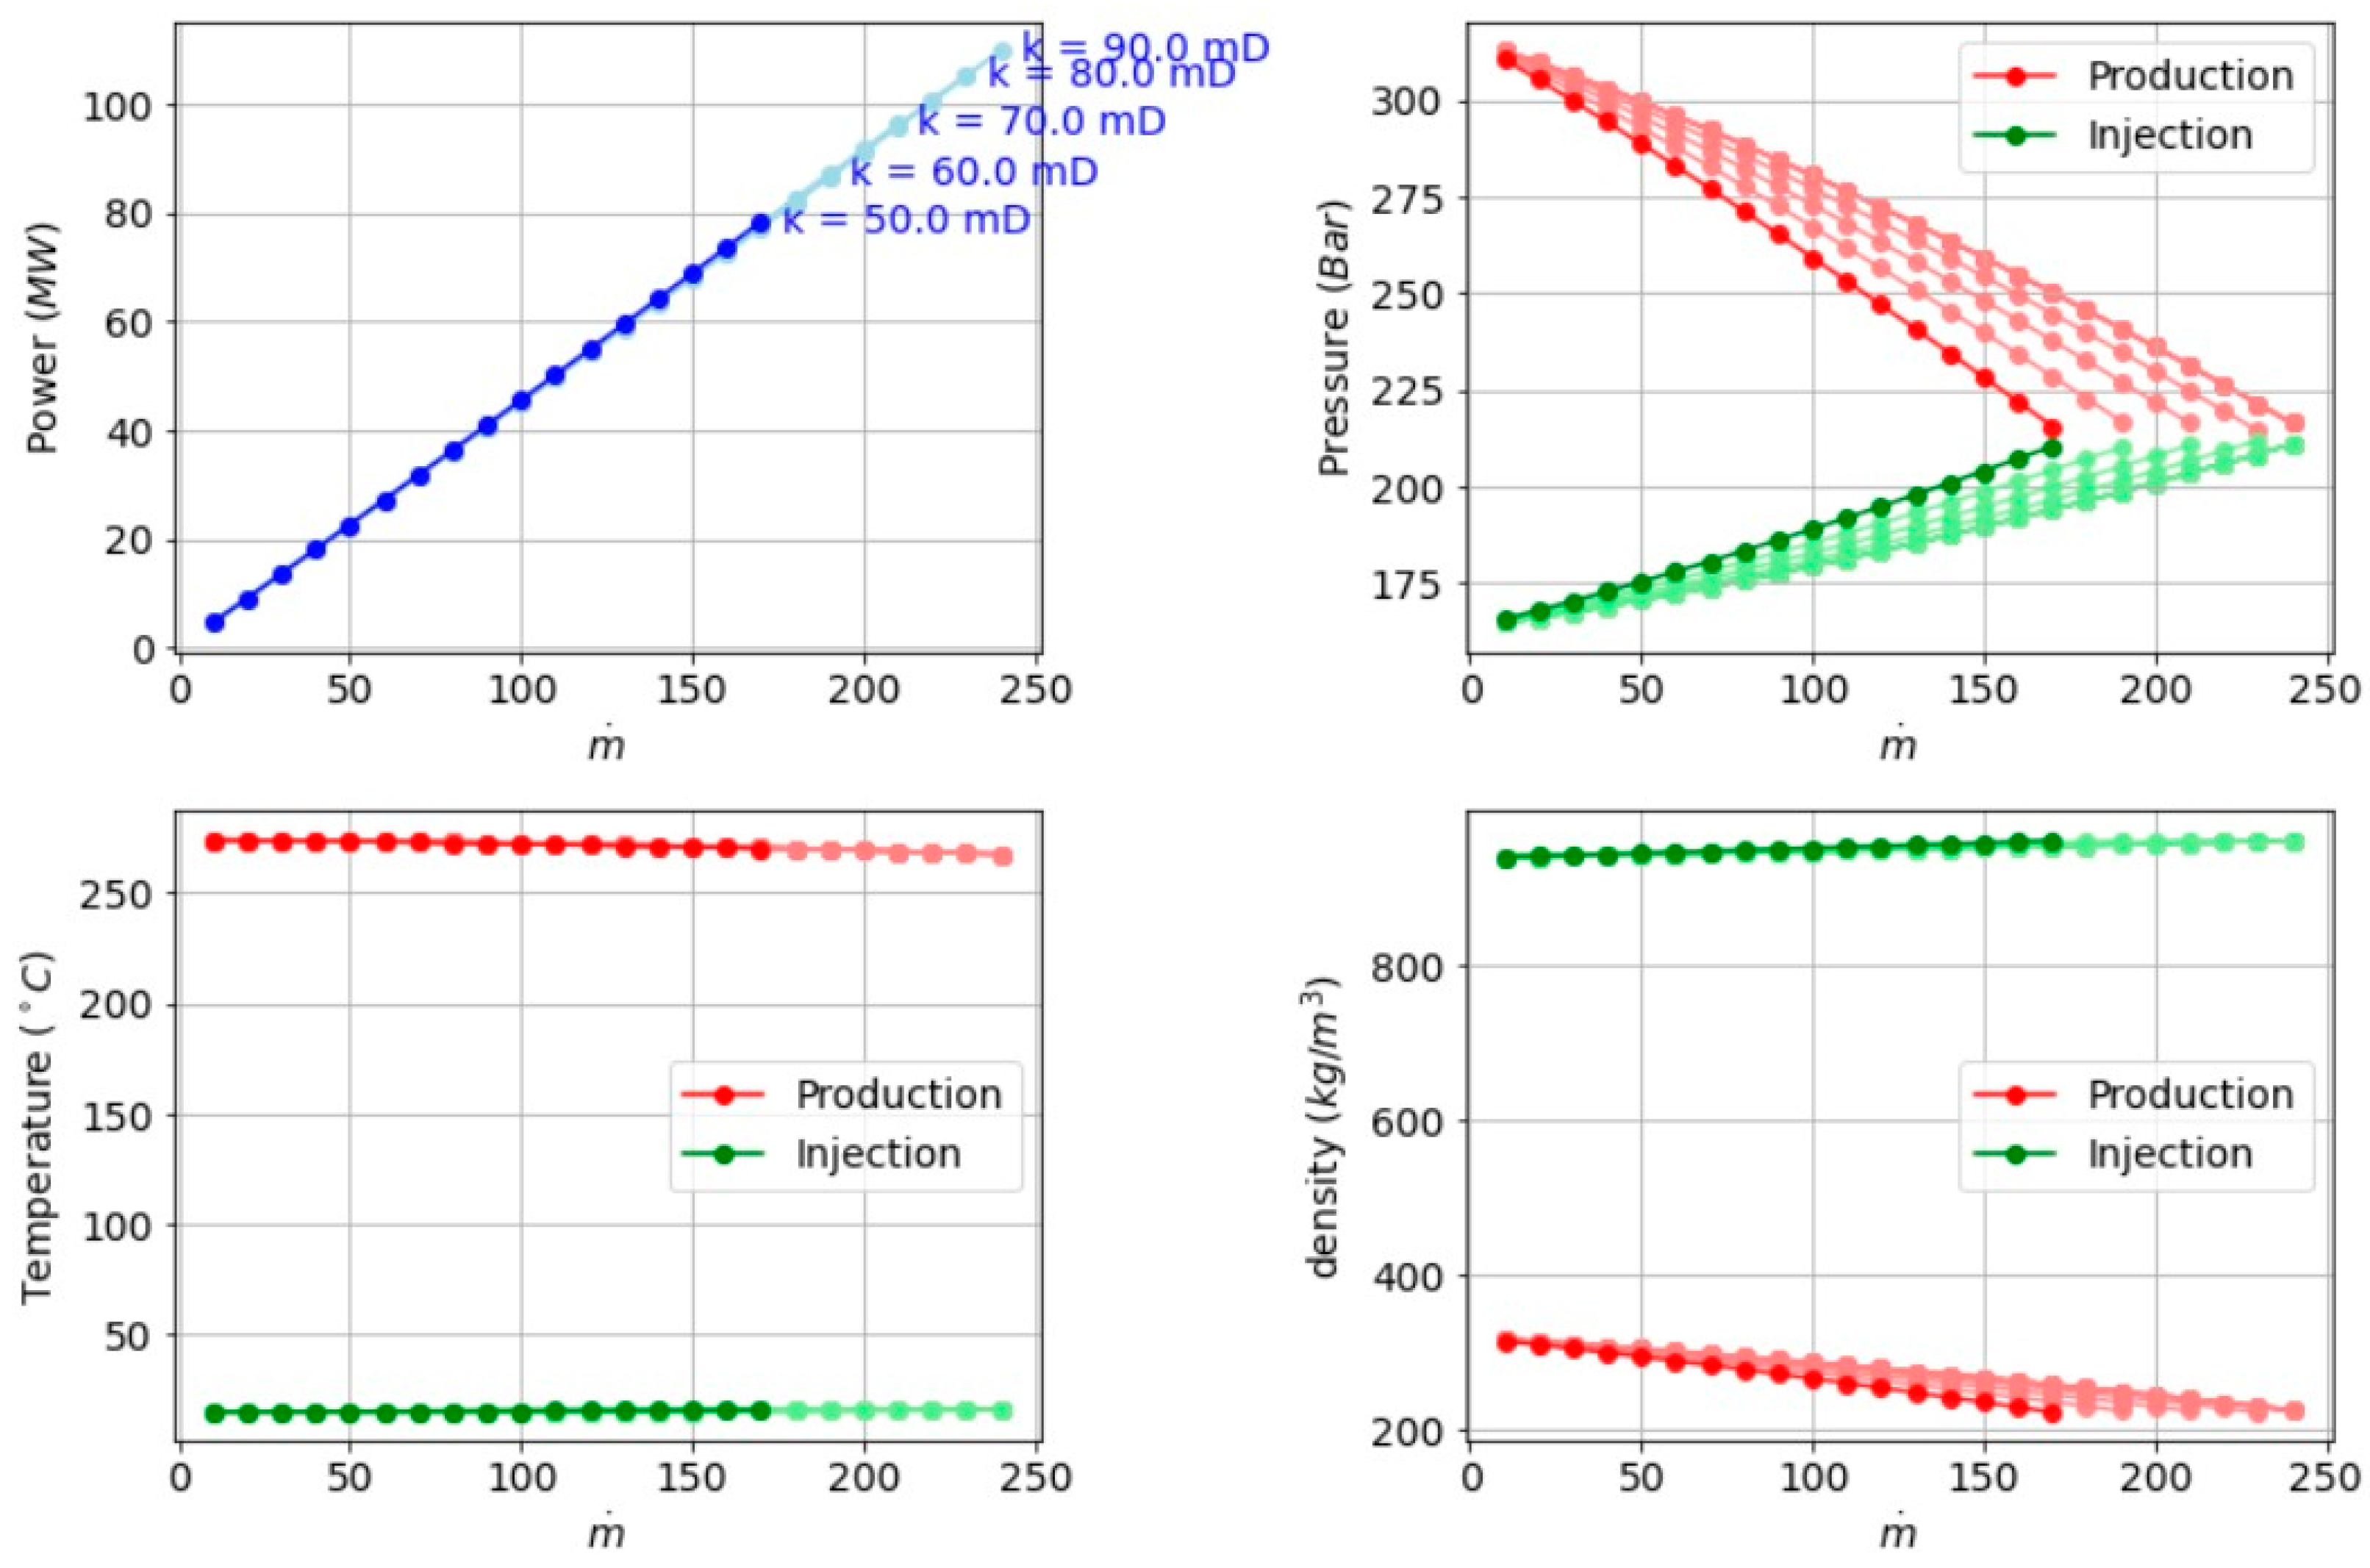
  • Power (top-left): The net power output at the surface.
  • Pressure (top-right): The injection and production wellhead pressures.
  • Temperature (bottom-left): The injection and production wellhead temperatures.
  • Density (bottom-right): The injection and production wellhead fluid densities. These variables provide insight into how operating conditions (e.g., flow rate) and reservoir properties affect thermodynamic behavior and overall system performance.

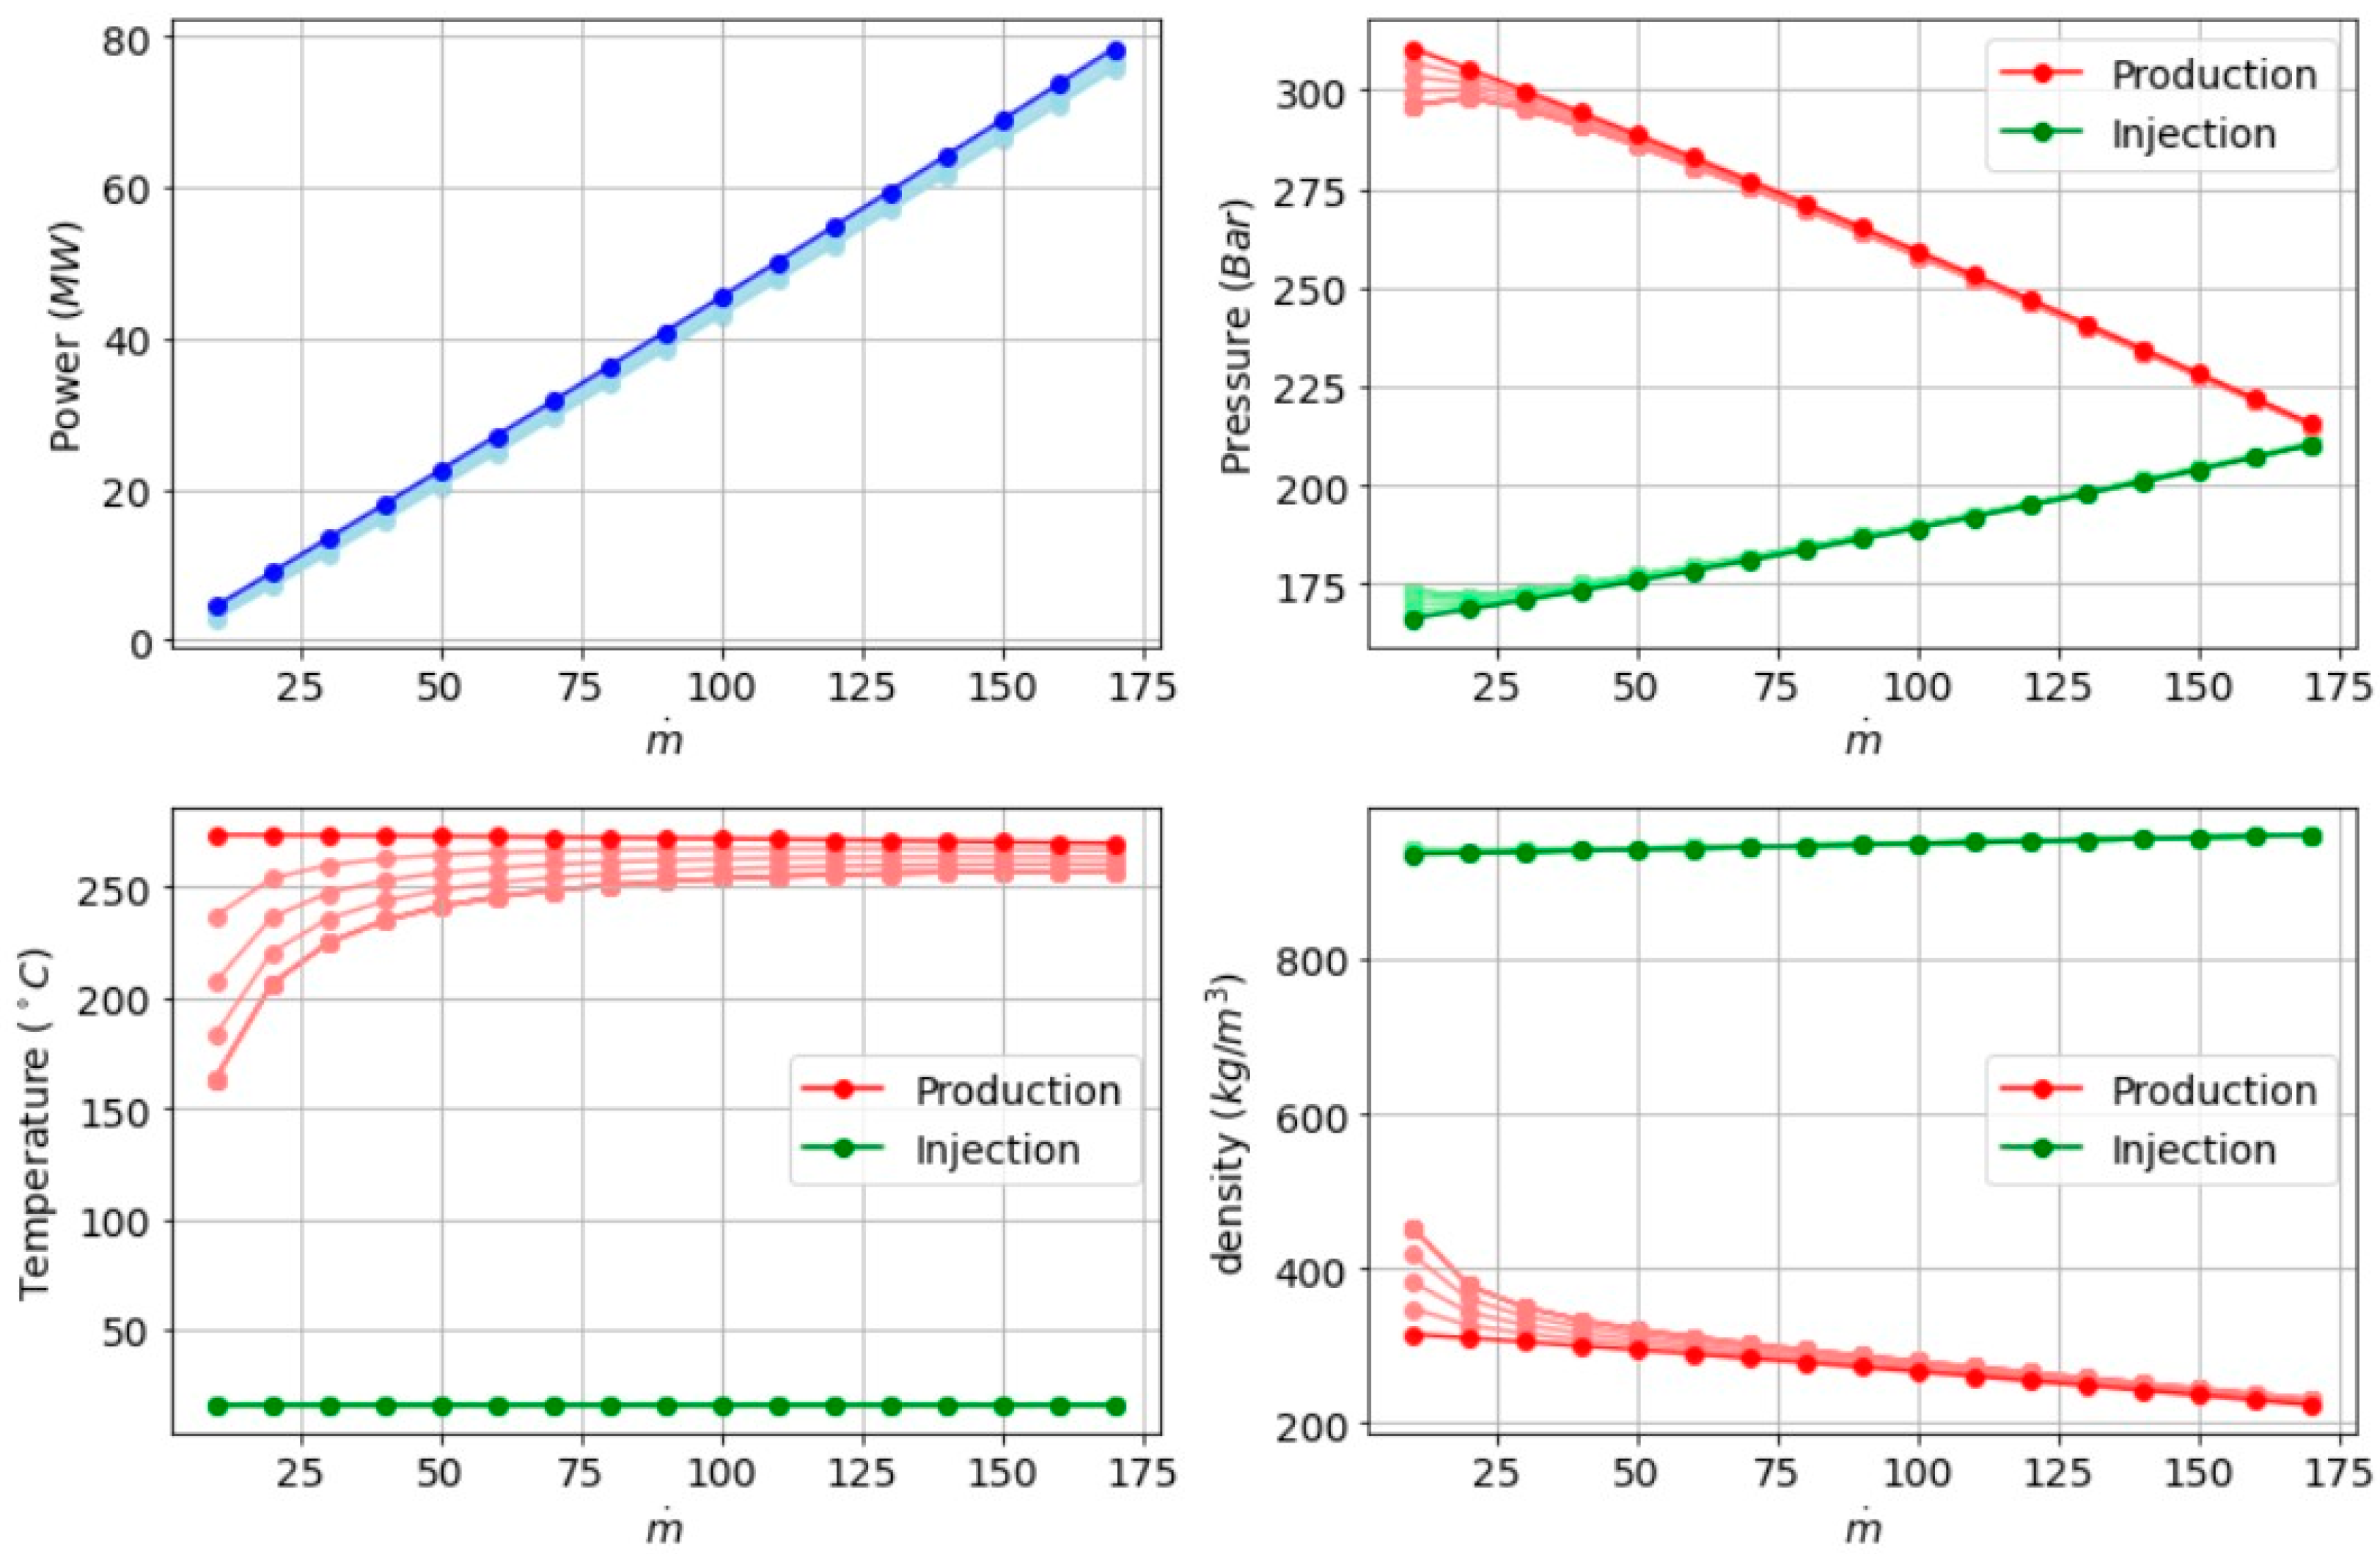
4.1. Sensitivity to Injection Temperature

Figure 2 depicts the impact of increasing the injection temperature in roughly 8–9 °C increments:
  • Power vs. Mass Flow: Higher injection temperature diminishes the available temperature (and thus density) contrast between injected and produced fluid. Consequently, the thermosiphon effect weakens, and both the achievable flow rate and resulting power can be lower. The drop in maximum power is about 10% per temperature step in these simulations.
  • Wellhead Pressures: As the injection fluid warms, its density drops. The injection wellhead pressure must increase to maintain the same flow rate. This more rapid rise in injection pressure reduces the pressure differential driving flow, limiting the upper bound of .
  • Wellhead Temperatures: The production temperature remains fairly constant at the reservoir’s high temperature (around 250 °C), but the injection temperature steps (16, 24, 33, 42, 51 °C) appear distinctly in the bottom-left plot. This widening gap in the 178 temperature lines reveals the increasing mismatch in thermodynamic conditions that 179 hamper the natural circulation.
  • Densities: Each injection temperature increment causes a reduction of about 20 kg/m3 in injection fluid density at the wellhead. Since buoyancy (driven by the density difference) is critical to the thermosiphon effect, these density shifts significantly curtail the maximum possible flow rate.
Figure 2. Sensitivity analysis of power, pressure, temperature, and density under varying injection temperatures (16–51 °C).
Materproc 15 00095 g002

4.2. Permeability

Figure 3 demonstrates how different reservoir permeabilities (50, 60, 70, 80, and 90 mD) affect wellhead conditions across a range of flow rates:
  • Power vs. Mass Flow: As permeability increases, the system can sustain higher flow rates before reaching a pressure limit. This allows the linear portion of the power-vs.- mass-flow curve to extend further to the right, increasing the maximum achievable power.
  • Pressures at Production and Injection Wells: With higher permeability, the production wellhead pressure decreases more slowly (or from a higher baseline), and the injection wellhead pressure grows more gradually. This indicates lower flow resistance through the reservoir and delayed convergence between injection and production pressures.
  • Temperatures: Wellhead temperatures do not change drastically with permeability, because the reservoir heat source remains effectively the same. However, at very high flow rates, higher permeability can permit slightly faster fluid cycling, potentially leading to marginally lower production temperature if residence times in the reservoir drop.
  • Densities: Production fluid density generally follows the trend of decreasing with increased flow (due to increased production temperature and expansion). Injection fluid density remains relatively stable but may shift slightly as wellhead pressure changes. Higher permeability primarily manifests as pressure differences rather than large shifts in wellhead temperatures or densities.
Figure 3. Sensitivity analysis for reservoir permeability variations, results presented at the wellhead.
Materproc 15 00095 g003

4.3. Adiabatic Hypothesis

In Figure 4, we explore how increasing the heat transfer coefficient ( Q ˙ ) in steps of 0.3 W/m2/K along the wellbore affects system performance. Even small heat-transfer coefficients can produce noticeable consequences:
  • Temperature Drop at Low Flow: When is small, fluid velocity through the wellbore is low, allowing more time for heat exchange with surrounding formations. As a result, the production fluid temperature can drop significantly before reaching the surface, leading to a higher fluid density and reduced buoyant driving force.
  • Mitigation at High Flow: At higher , the fluid transits the wellbore more rapidly, reducing heat losses. This preserves a larger fraction of the fluid’s thermal energy and density contrast, mitigating the detrimental effect on thermosiphon circulation.
  • Implications for Power Output: Excessive heat losses in the wellbore can weaken or even disrupt the naturally driven flow, particularly at lower mass flow rates. In practical systems, wellbore insulation (or maintaining higher injection temperature) may be essential to minimize these losses and maintain robust power output.
Figure 4. Sensitivity analysis for injection temperature variations, results presented at the wellhead.
Materproc 15 00095 g004

4.4. Overall Observations and Practical Insights

The combined sensitivity analyses underscore that geothermal power systems driven by thermosiphon effects depend critically on both reservoir characteristics (e.g., permeability) and thermodynamic contrasts (e.g., injection vs. production temperature). Small changes in injection temperature or wellbore heat loss can significantly affect density contrasts, thereby limiting mass flow and power generation potential. Meanwhile, higher reservoir permeability extends the range of feasible flow rates and supports higher power outputs. Designers and operators should thus carefully balance:
  • Reservoir Permeability: Choosing formations of sufficient permeability to handle desired flow rates without excessive pressure buildup.
  • Injection Temperature and Wellbore Insulation: Preserving a strong temperature (and density) difference to maximize thermosiphon-driven flow.
  • Operational Flow Rates: Avoiding very low flow rates that amplify wellbore heat losses and degrade the thermosiphon effect.
These findings provide a basis for further optimization and can guide practical decisions—such as selecting operating conditions, employing insulation strategies, or refining reservoir development—to achieve robust and efficient geothermal power generation.

5. Conclusions

Overall, this analysis provides valuable insights into the behavior and performance of the thermosiphon-based geothermal power generation system. The results highlight the importance of optimizing injection temperature, considering uncertain conditions such as reservoir permeability and understanding the effects of heat exchange. These findings highlight the effect of some parameters on power output and can therefore guide system design, operation and optimization to maximize power output and ensure the long-term sustainability of geothermal energy production.

Author Contributions

Conceptualization, S.P.F. and V.G.; methodology, S.P.F.; software, S.P.F.; validation, S.P.F. and V.G.; writing—original draft preparation, S.P.F.; writing—review and editing, S.P.F. and V.G.; visualization, S.P.F. All authors have read and agreed to the published version of the manuscript.

Funding

This research received no external funding.

Institutional Review Board Statement

Not applicable.

Informed Consent Statement

Not applicable.

Data Availability Statement

Data sharing is not applicable to this article.

Conflicts of Interest

The authors declare no conflicts of interest.

References

  1. DiPippo, R. Geothermal Power Plants: Principles, Applications, Case Studies and Environmental Impact; Butterworth-Heinemann: Oxford, UK, 2012. [Google Scholar]
  2. Breede, K.; Dzebisashvili, K.; Liu, X.; Falcone, G. A systematic review of enhanced (or engineered) geothermal systems: Past, present and future. Geotherm. Energy 2013, 1, 4. [Google Scholar] [CrossRef]
  3. Brown, D.W. A hot dry rock geothermal energy concept utilizing supercritical CO2 instead of water. In Proceedings of the Twenty-Fifth Workshop on Geothermal Reservoir Engineering, Stanford University, Stanford, CA, USA, 24–26 January 2000; pp. 233–238. [Google Scholar]
  4. Adams, B.M.; Kuehn, T.H.; Bielicki, J.M.; Randolph, J.B.; Saar, M.O. A comparison of electric power output of CO2 Plume Geothermal (CPG) and brine geothermal systems for varying reservoir conditions. Appl. Energy 2015, 140, 365–377. [Google Scholar] [CrossRef]
  5. Langenfeld, J.K.; Bielicki, J.M. Assessment of sites for CO2 storage and CO2 capture, utilization, and storage systems in geothermal reservoirs. Energy Procedia 2017, 114, 7009–7017. [Google Scholar] [CrossRef]
  6. Freifeld, B.; Zakim, S.; Pan, L.; Cutright, B.; Sheu, M.; Doughty, C.; Held, T. Geothermal energy production coupled with CCS: A field demonstration at the SECARB Cranfield Site, Cranfield, Mississippi, USA. Energy Procedia 2013, 37, 6595–6603. [Google Scholar] [CrossRef]
  7. Global CCS Institute. Global CCS Institute 2022 Status Report. 2022. Available online: https://status22.globalccsinstitute.com/2022-status-report/introduction/ (accessed on 1 July 2023).
  8. Lau, H.C.; Ramakrishna, S.; Zhang, K.; Radhamani, A.V. The role of carbon capture and storage in the energy transition. Energy Fuels 2021, 35, 7364–7386. [Google Scholar] [CrossRef]
  9. Adams, B.M.; Kuehn, T.H.; Bielicki, J.M.; Randolph, J.B.; Saar, M.O. On the importance of the thermosiphon effect in CPG (CO2 plume geothermal) power systems. Energy 2014, 69, 409–418. [Google Scholar] [CrossRef]
  10. Gravanis, E.; Sarris, E. A working model for estimating CO2-induced uplift of cap rocks under different flow regimes in CO2 sequestration. Geomech. Energy Environ. 2023, 33, 100433. [Google Scholar] [CrossRef]
  11. Sarris, E.; Gravanis, E. Flow regime analysis of the pressure build-up during CO2 injection in saturated porous rock formations. Energies 2019, 12, 2972. [Google Scholar] [CrossRef]
  12. Ernestos, S.; Elias, G.; Panos, P. Investigation of self-similar interface evolution in carbon dioxide sequestration in saline aquifers. Transp. Porous Media 2014, 103, 341–359. [Google Scholar] [CrossRef]
  13. Kovscek, A.R. Screening criteria for CO2 storage in oil reservoirs. Pet. Sci. Technol. 2002, 20, 841–866. [Google Scholar] [CrossRef]
  14. Leaver, J.D. Injectivity and Productivity Estimation in Multiple Feed Geothermal Wells; Technical report; Department of Petroleum Engineering, Stanford University: Stanford, CA, USA; Ministry of Works: Auckland, New Zealand, 1986. [Google Scholar]
  15. Guo, B. Well Productivity Handbook: Vertical, Fractured, Horizontal, Multilateral, Multi-Fractured, and Radial-Fractured Wells; Gulf Professional Publishing: Cambridge, MA, USA, 2019. [Google Scholar]
  16. Ahmed, T. Reservoir Engineering Handbook; Gulf Professional Publishing: Cambridge, MA, USA, 2018. [Google Scholar]
  17. Guðmundsdóttir, H. A coupled wellbore-reservoir simulator utilizing measured wellhead conditions. Master’s Thesis, University of Iceland, Reykjavík, Iceland, October 2012. [Google Scholar]
  18. Bell, I.H.; Wronski, J.; Quoilin, S.; Lemort, V. Pure and Pseudo-pure Fluid Thermophysical Property Evaluation and the Open-Source Thermophysical Property Library CoolProp. Ind. Eng. Chem. Res. 2014, 53, 2498–2508. [Google Scholar] [CrossRef] [PubMed]
Figure 1. A heatmap depicting the density distribution of CO2 in the geothermal system. The arrow highlights the transition from optimal production conditions to optimal injection conditions, showcasing how this transition can be achieved through both direct and indirect configurations.
Materproc 15 00095 g001
Table 1. Reservoir and well parameters.
ParameterValueUnits (SI)
Pressure (Pe)4 × 10⁷Pa
Temperature (T)573.15K
Depth2.5 × 103m
permeability (k)5 × 10⁻¹⁴m2
thickness (h)50m
viscosity (µ)5.5 × 10⁻⁵Pa s
Formation radius (re)1000m
Well radius (rw)0.1m
Injectivity/Productivity (I)4 × 10⁻⁸m3/s/Pa
Disclaimer/Publisher’s Note: The statements, opinions and data contained in all publications are solely those of the individual author(s) and contributor(s) and not of MDPI and/or the editor(s). MDPI and/or the editor(s) disclaim responsibility for any injury to people or property resulting from any ideas, methods, instructions or products referred to in the content.

