1. Introduction
In smart manufacturing, reducing waste, improving production efficiency, and accurately predicting processing times are critical. Traditional production processes are constrained by the uncertainty of processing time, leading to delays and resource wastage. However, the application of smart technology in traditional production processes is hindered as firms must optimize their value stream to enhance the processing time prediction. Through a literature review and system simulation, a reliable method for forecasting and planning production can be developed to enhance the overall economic performance. The model also supports effective informed policymaking.
VSM was used to improve automotive parts processing to reduce inventory waste and lead time. It reduced the production time by 7% and increased workstation efficiency by 10% [
1]. Combined VSM and system simulation enabled line balancing, reduced inventory waste, and shortened production lead time from 26.6 to 17.4 days [
2]. VSM was also used to analyze the state of small-batch production and formulate transfer strategies by addressing high on-site inventory issues. The CONWIP system was used for production output control and resulted in a 22.7% reduction in lead time and a 48.2% reduction in the work-in-progress (WIP) inventory [
3].
VSM has been used for current-state analysis and the design of improvement plans based on ideal-state mapping. 5S representing “sort, set-in-order, shine, standardize, and sustain” for workspace layout improvements and single-minute exchange of die (SMED) for die changeover in injection molding are widely used. These measures eliminated defects, such as spots, stains, and cracks, and introduced error-proofing to address product inspection issues, reduced cycle time, and improved personnel efficiency [
4]. VSM is also used to analyze the processes of an automotive parts manufacturing plant and establish standard operation procedures (SOPs) for standardized production with Kanban systems to identify necessary parts. By employing a positional weighting method, transportation time between stations can be reduced. Standardized work practices decreased the cycle time by 350 s and setup time by 1500 s, reducing total production time from 5780 s to 3946 s [
5]. To identify waste in processes, 5S is implemented to address issues with inventory replenishment and tool identification, and Kaizen is applied to lower separators’ heights for workers. These improvements successfully reduced overall lead time by 3.4% [
6].
2. Materials and Methods
A company in Taiwan’s central region specializing in surface treatment processing was selected for a case study. Their processed items include water hardware and metal components, utilizing advanced vacuum coating technology. This value-added process enhances the surface properties of products, achieving high hardness, superior wear resistance (low friction coefficient), corrosion resistance, and chemical stability. Additionally, their coating technology significantly improves the esthetic appeal of the workpieces. However, due to the diversity of products and the prevalence of customized orders, blind spots and inefficiencies in the current process are difficult to accurately identify and address.
2.1. Manufacturing Process
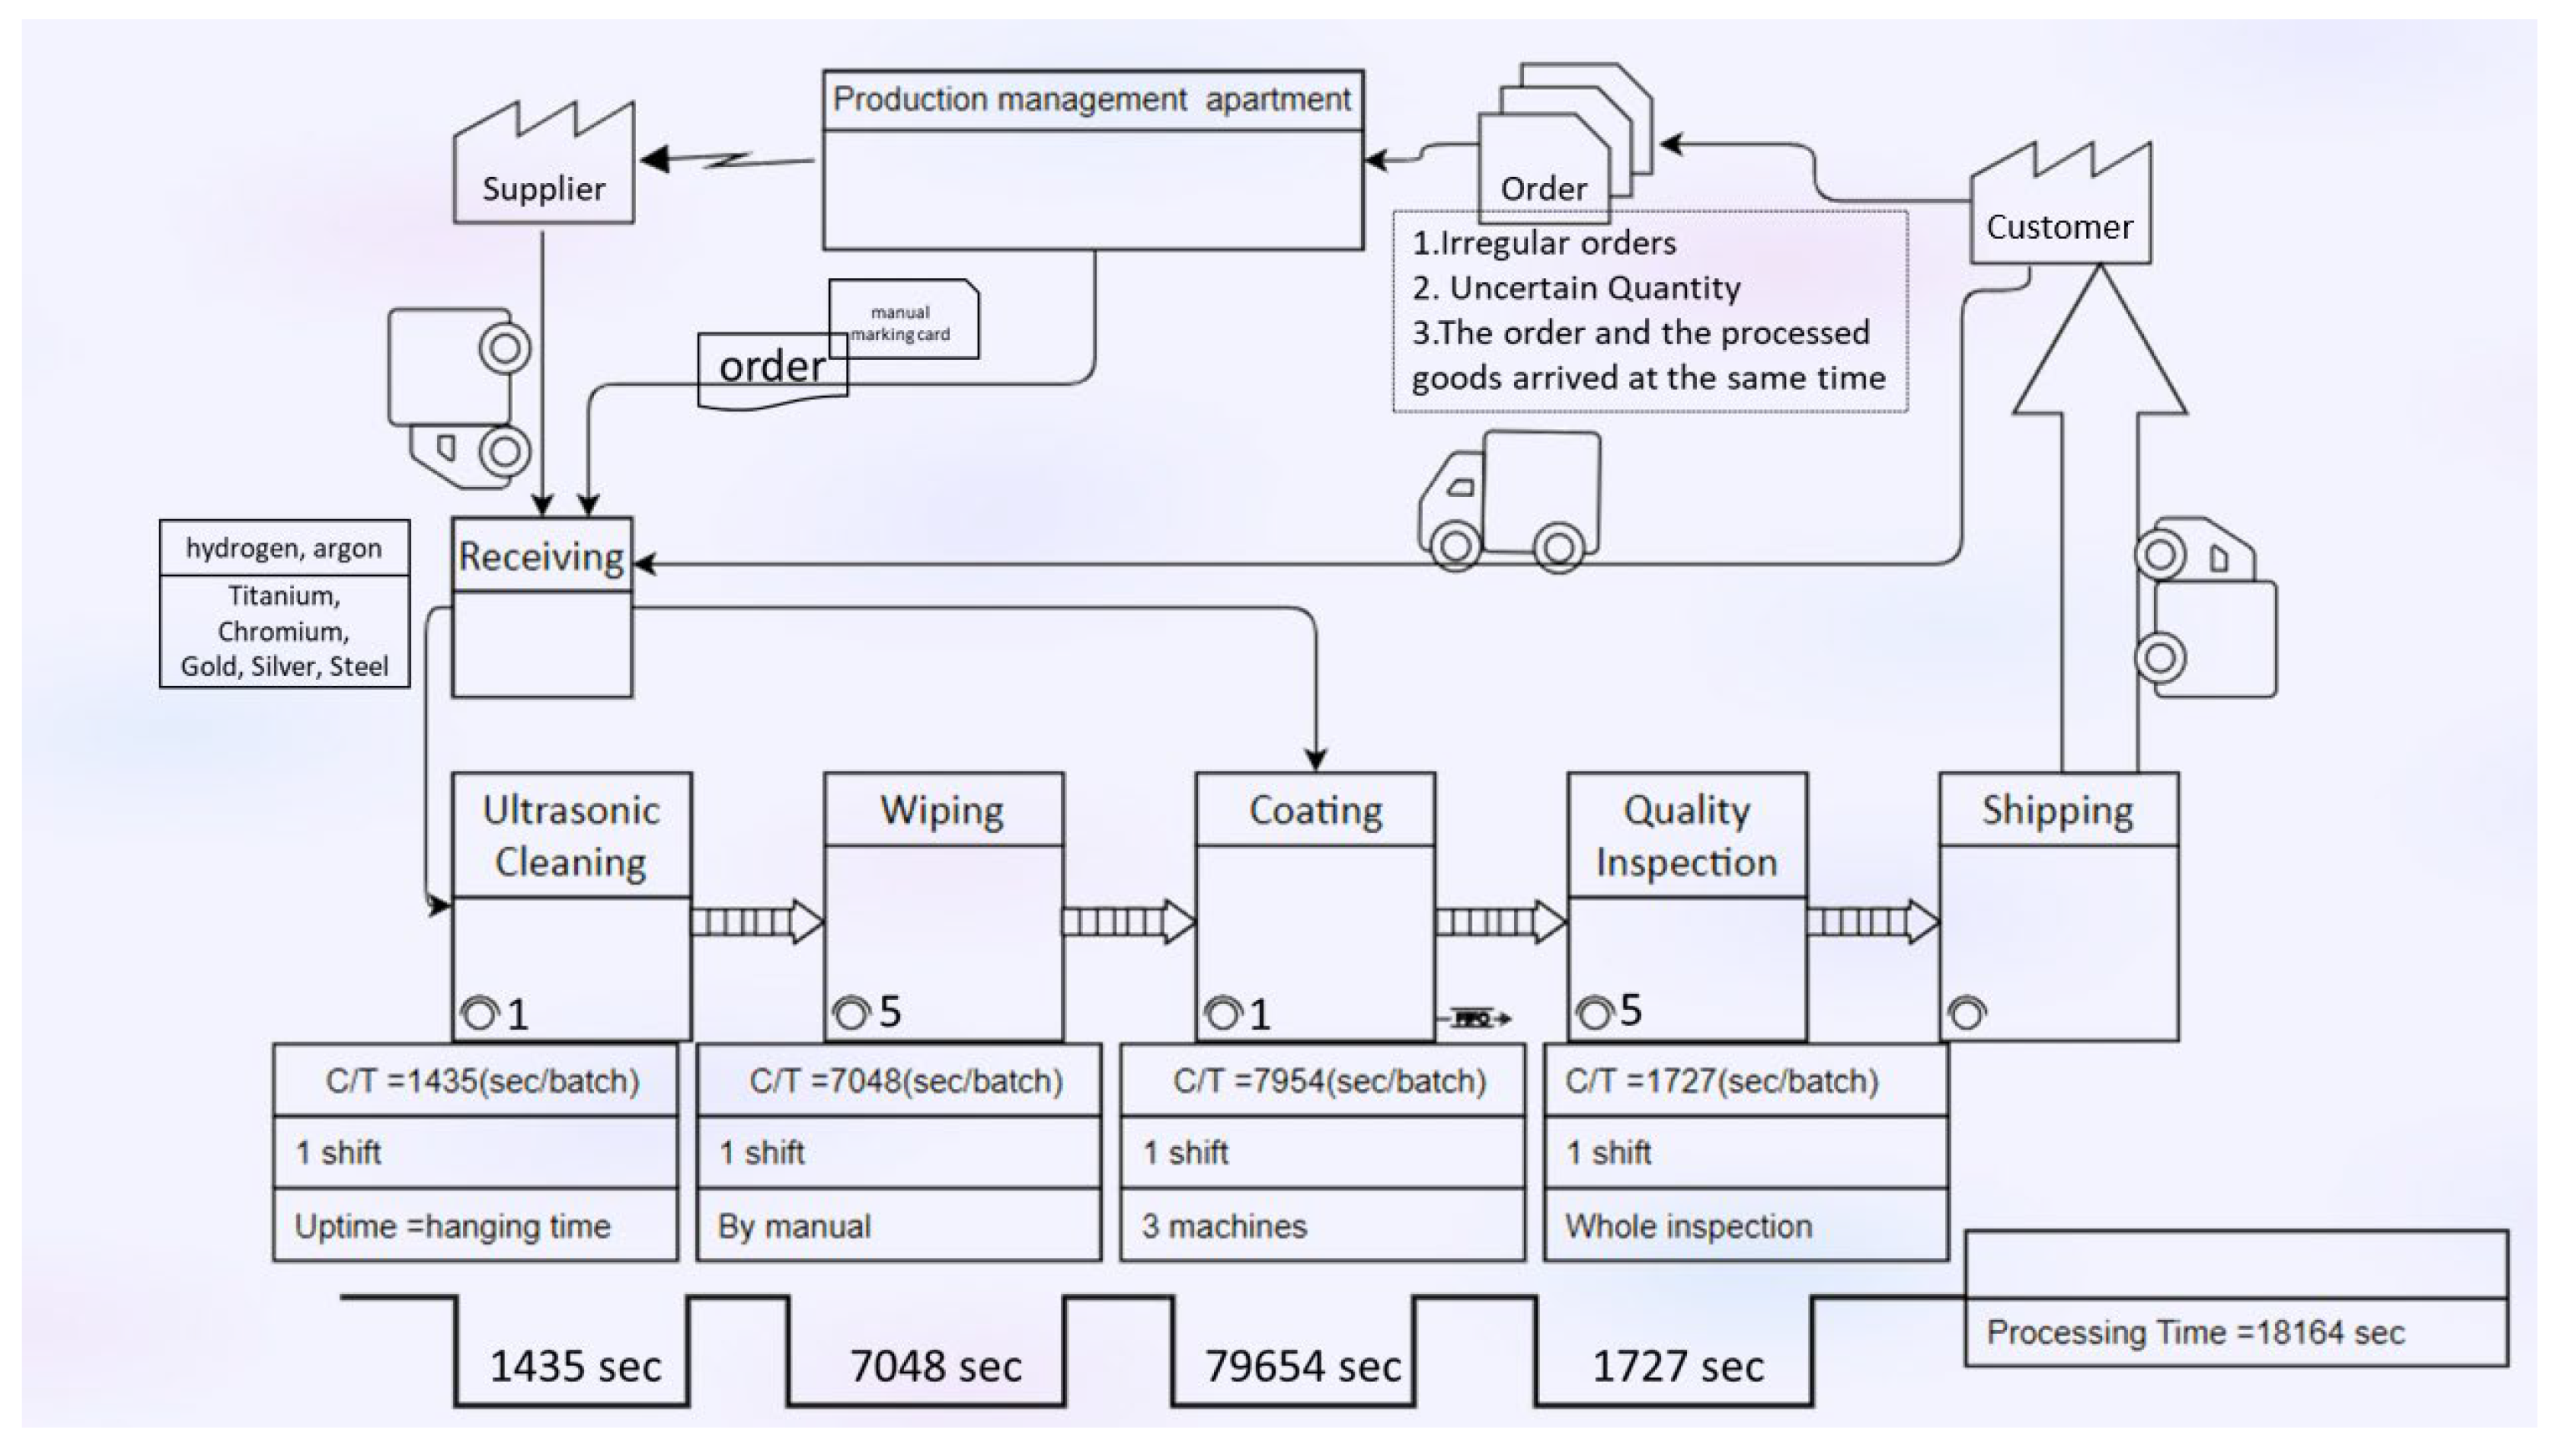
A seven-station process was introduced for fastener manufacturing. Each production station plays a critical role in ensuring product quality and meeting customer requirements. The process includes the following stages.
Receiving: The customer delivers the workpieces to the company, where on-site personnel use carts to transport the items for storage. Relevant order information, including supplier name, product name, delivery date, quantity, number of boxes, and due date, is labeled on the items.
Hanging: Entire batches are processed at this station. Personnel assist in hanging individual products onto rack-type carriers, which vary depending on the product type. Fully loaded racks are then suspended on transport trolleys, which can hold 6–10 racks at a time. The unit of transport is one trolley.
Ultrasonic cleaning: The workpieces are placed in an ultrasonic cleaning machine for decontamination. Each batch cleaned corresponds to one trolley. After cleaning, the components are reloaded onto the trolley for transport to the next station.
Wiping: One trolley of workpieces is moved to the wiping area, where five personnel individually wipe each piece to ensure quality and effective cleaning. After wiping, the items are transported to the next station, with one trolley serving as the transport unit.
Coating: The workpieces undergo surface coating in the coating machine, with coating thickness as the evaluation criterion. Processing time varies based on customer requirements. Each coating batch corresponds to one trolley. After coating, the components are reloaded onto the trolley for transport to the next station.
Quality inspection: One trolley of workpieces is brought to the inspection area, where five personnel disassemble the items from the racks and conduct a thorough inspection. Inspected products are packed in boxes and confirmed as a complete order. Finished orders are moved to the finished goods area.
Shipping: Personnel transport completed orders to the shipping area using carts. The production control team notifies the customer to pick up the goods.
2.2. VSM
We analyzed the interconnections between processes by mapping a pre-improvement with VSM and developing a simulation model to verify process flow and clarify workflow paths. By identifying bottlenecks, blind spots were identified in the production process, enabling consolidation of existing issues and facilitating the exploration of effective improvement strategies. The current-state value stream of the process is illustrated in
Figure 1.
3. Results and Discussion
The bottleneck analysis of the current state was conducted, followed by discussions with experts and company personnel to design an ideal VSM. The future-state VSM after proposed improvements is shown in
Figure 2. Utilizing software and applying discrete event simulation proved effective in modeling on-site conditions and predicting processing times.
4. Conclusions
Focusing on practical/processual implementation, we compared various simulation software options with an informatic (data quantity and quality) background. FlexSim was identified as more intuitive and user-friendly. In this study, FlexSim version 24.2.2 (2024), developed by FlexSim Software Products Inc., was used. FlexSim is a 3D object-oriented simulation software that integrates a C++ development environment with a graphical modeling interface. Its modeling objects can be precisely customized to meet diverse process requirements, offering superior scalability and analytical capabilities compared to other simulation tools. Additionally, it is well-suited for simulating and visualizing processes across various industries. We initiated the process of learning and designing simulation software. On-site data collected was imported into the model to simulate production conditions based on real-world scenarios. Improvements were implemented on-site for six months, during which outcomes were evaluated through on-site assessments. Subsequently, data related to the execution of each station after improvements were collected and systematically analyzed to consolidate the results of the enhancements. Given that most critical data is currently associated with software applications, it is essential to predict the flow of resources and waste sources throughout the production process using mathematical models. This approach enables the identification of potential bottlenecks to propose efficiency-improving solutions based on production simulations and forecast processing times to maintain the stability of production schedules.
Author Contributions
Conceptualization, Y.-T.L. and P.-Y.L.; methodology, P.-Y.L.; software, Y.-T.L. and P.-Y.L.; validation, Y.-T.L. and P.-Y.L.; formal analysis, Y.-T.L.; investigation, Y.-T.L. and P.-Y.L.; resources, M.-H.L., Y.-T.L. and P.-Y.L.; data curation, Y.-T.L. and P.-Y.L.; writing—original draft preparation, Y.-T.L. and P.-Y.L.; writing—review and editing, Y.-T.L.; visualization, Y.-T.L.; supervision, M.-H.L.; project administration, M.-H.L., Y.-T.L. and P.-Y.L. All authors have read and agreed to the published version of the manuscript.
Funding
This research was funded by the Ministry of Science and Technology of Taiwan (MOST) (111-2637-E-150-005-).
Institutional Review Board Statement
Not applicable.
Informed Consent Statement
Not applicable.
Data Availability Statement
Data for this study are not publicly available.
Conflicts of Interest
The authors declare no conflicts of interest. The funders had no role in the design of the study; in the collection, analyses, or interpretation of the data; in the writing of the manuscript; or in the decision to publish the results.
References
- Andrade, P.F.; Pereira, V.G.; Del Conte, E.G. Value stream mapping and lean simulation: A case study in automotive company. Int. J. Adv. Manuf. Technol. 2016, 85, 547–555. [Google Scholar] [CrossRef]
- Lin, G.-H. Applying Value Stream Mapping and Flexsim Simulation Technology to Improve the Tool Holder Manufacturing Process. Master’s Thesis, National Chin-Yi University of Technology, Taichung City, Taiwan, 2017. Available online: https://hdl.handle.net/11296/9522c5 (accessed on 24 May 2025).
- Wang, H. Applying Value Stream Mapping and System Simulation Method on Lean Production System—A Case Study of a Corporation. Master’s Thesis, Tunghai University, Taichung City, Taiwan, June 2022. Available online: https://hdl.handle.net/11296/4en493 (accessed on 24 May 2025).
- Lacerda, A.P.; Xambre, A.R.; Alvelos, H.M. Applying Value Stream Mapping to eliminate waste: A case study of an original equipment manufacturer for the automotive industry. Int. J. Prod. Res. 2016, 54, 1708–1720. [Google Scholar] [CrossRef]
- Nallusamy, S.; Saravanan, V. Enhancement of overall output in a small scale industry through VSM, line balancing and work standardization. Int. J. Eng. Res. Afr. 2016, 26, 176–183. [Google Scholar] [CrossRef]
- Punna Rao, G.V.; Nallusamy, S.; Raman, P. Enhancement of production in subassembly line of a medium scale industry using different lean tools and FlexSim simulation software. Int. J. Eng. Res. Afr. 2019, 44, 229–239. [Google Scholar] [CrossRef]
| Disclaimer/Publisher’s Note: The statements, opinions and data contained in all publications are solely those of the individual author(s) and contributor(s) and not of MDPI and/or the editor(s). MDPI and/or the editor(s) disclaim responsibility for any injury to people or property resulting from any ideas, methods, instructions or products referred to in the content. |
© 2025 by the authors. Licensee MDPI, Basel, Switzerland. This article is an open access article distributed under the terms and conditions of the Creative Commons Attribution (CC BY) license (https://creativecommons.org/licenses/by/4.0/).

