Abstract
The FLEX-S3 mission by ESA will deliver key Level 2 products such as sun-induced chlorophyll fluorescence (SIF) and vegetation-reflected radiance. To validate these, the SpaFLEX project, funded by the Spanish Ministry of Science and Innovation, is developing a robust calibration and validation strategy in Spain. This includes test site setup, instrument characterization, and sampling protocols. A field campaign was conducted in two Holm Oak forests in Teruel, analyzing Sentinel-2 spatial heterogeneity and collecting ground, UAV, and airborne data. The results support scaling procedures to match the 300 m pixel resolution of FLEX-S3, ensuring product accuracy and compliance with ESA standards.
1. Introduction
The European Space Agency’s FLuorescence EXplorer-Sentinel 3 (FLEX-S3), scheduled for launch in 2026, is a groundbreaking mission designed to remotely detect solar-induced fluorescence (SIF) in vegetation at a spatial resolution of 300 × 300 m. With its high spectral resolution, FLEX-S3 will retrieve SIF and improve the estimation of high-level products such as absorbed photosynthetically active radiation (APAR) and non-photochemical quenching (NPQ). Together with SIF, these products are expected to significantly improve the remote estimation of the true photosynthetic capacity of vegetation [1]. Cal/Val activities are crucial to refine the FLEX-S3 products prior to their integration into vegetation models. The European Space Agency (ESA) is responsible for managing Level 1 products, while member states, such as Spain, oversee the Cal/Val plans for Level 2 products, thereby promoting interoperability.
The SpaFLEXImp initiative, led by the Spanish National Institute of Aerospace Technology (INTA), coordinates the national calibration and validation (Cal/Val) plan. INTA contributes with its advanced airborne hyperspectral and chlorophyll fluorescence sensors, in collaboration with interdisciplinary teams from the University of Valencia (LEO-UV) and the Doñana Biological Station (LAST-EBD).
Interpretation of the weak SIF signal—10 orders of magnitude lower than reflectance—is challenging due to environmental variability. Accurate retrievals depend on atmospheric absorption characteristics and require stringent Cal/Val protocols to meet mission uncertainty targets: <30% overall, ~10% for fluorescence and irradiance, and ~1% for reflectance. Ground truth comparisons are essential to account for instrument-, algorithm-, and site-specific factors.
As an initial approach to addressing the calibration and validation requirements of the FLEX mission products, in this work we present the design and execution of a field campaign carried out in two Holm Oak forest areas of different tree densities in Sarrión–Manzanera (Teruel, Northeast Spain) (Figure 1). In both areas two CO2 flux towers and two fluorescence measurement systems (FLOX sensor (JB Hyperspectral Devices, Düsseldorf, Germany)) are installed. We analyzed spatial heterogeneity of Sentinel-2 images in order to determine the minimum number of Environmental Sampling Units (ESUs) needed to carry out intensive spectroradiometric measurements with ASD FieldSpec FR Spectroradiometer (Analytical Spectral Devices, Boulder, CO, USA), quantify leaf fluorescence with a Fluowat device [2], and overfly with the Piccolo Fluorescence sensor onboard of an UAV. For both areas, we also conducted a UAV flight campaign with the Cubert S185 hyperspectral camera for subsequent data scaling and for quantifying the number of measurements in each ESU. Results are being used to define upscaling procedures towards the FLEX-S3 300 m nominal pixel.
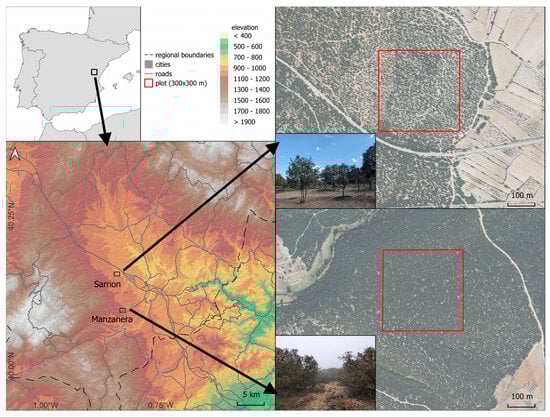
Figure 1.
Location of the Sarrión and Manzanera areas. Elevation map and location of the 300 × 300 m plot.
2. Methodology
The design and implementation of this campaign consists of two different temporal approaches: a “seasonal” campaign, based on sensors installed in the area, and a “short” campaign, which involves a specifically designed field sampling.
2.1. Seasonal Campaign
Eddy covariance systems are installed in both areas, providing semi-hourly data on the energy and carbon balance of the ecosystem. Next to the towers are two FLOX systems that continuously measure fluorescence levels on various characteristic holm oak trees in the area. These facilities allow the ecosystem to be monitored for temporal analysis.
2.2. Short Campaign
The short campaign focused on intensive field sampling, which included performing regressions between biophysical parameters derived from Sentinel-2 imagery and analysis of the residue maps generated by these regressions. To ensure spatial representativeness and statistical robustness, spatial autocorrelation was analyzed using Moran’s index and semivariograms to identify the most limiting variables for stratification. Based on the statistical distribution—mean and standard deviation—of these variables, the number of elementary sampling units (ESUs) was estimated (Equation (1)). Subsequent spatial interpolation using Support Vector Machine (SVM) methodology implemented in Smart-Map plugin [3] for QGIS (QGIS Development Team, 2025) allowed stratification and replication of ESUs across the study area. The biophysical parameters used were chlorophyll content (Cab), cover fraction (FCV), and fraction of photosynthetically active absorption (FAPAR), obtained with the SNAP program (ESA Sentinel Application Platform).
where n is the required sample size, Z is the value corresponding to a 95% confidence level, σ is the standard deviation and E defines the tolerable error.
n = ((Z∙σ)/E)^2
UAV measurements were made using the Cubert S186 hyperspectral sensor, (Cubert GmbH, Ulm, Germany) which captures 125 bands in the 450-950 nm range. Flights were conducted at an altitude of 120 m, resulting in a spatial resolution of approximately 4 cm and they were made on 30 May 2024. Key indices such as the Photochemical Reflectance Index (PRI) (Equation (2)) [4] for reflectance and the Red Edge Chlorophyll Index (ChlRE) (Equation (3)) [5] for fluorescence were targeted. The results of the hyperspectral flights over a representative 300 × 300 m area provided essential insights for spatial scaling. The data collected allowed quantification of the number of field measurements required to ensure that uncertainties remain below the FLEX-S3 mission thresholds through Equation (1). Specifically, these thresholds were defined as <10% for solar induced fluorescence (SIF) and <1% for surface reflectance. ChlRE is used as a fluorescence proxy due to the strong correlation between chlorophyll content and fluorescence emission [6]. Conversely, the PRI serves as an indicator of reflectance errors in the spectral region where the non-photochemical quenching (NPQ) mechanism predominates [7]. NPQ is a critical high-level product that the FLEX mission also aims to retrieve, as it is, along with Photosynthetically Active Radiation (PAR), a primary driver of vegetation-emitted fluorescence [8].
where PRI is the Photochemical Reflectance Index and 531 nm and 570 nm the reflectance values at wavelengths of 531 and 570 nanometers, respectively.
where ChlRE is the Red Edge Chlorophyll Index and 710 nm and 750 nm the reflectance values at wavelengths of 710 and 750 nanometers, respectively.
PRI = (531 nm − 570 nm)/(531 nm + 570 nm)
ChlRE = (750 nm/710 nm) − 1
3. Results
3.1. Seasonal Campaign
Figure 2 shows an example of the values obtained by the FLOX system throughout 2024 in the Manzanera area. These data sets, along with those from the eddy covariance system, will be used to optimize the time scaling process from half-hourly data to the FLEX temporal resolution (27 days). On the other hand, these data will be used to gain knowledge about the relationships between fluorescence, photosynthesis, and gross primary production (GPP) in order to fine-tune Level 2 algorithms [9].
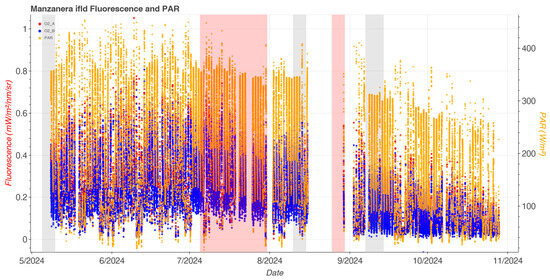
Figure 2.
Time series of solar-induced chlorophyll fluorescence (SIF) and photosynthetically active radiation (PAR) measured in 2024 at the Manzanera site (Teruel, Spain) using a FLOX sensor. Fluorescence retrievals at the O2-A (red) and O2-B (blue) bands are shown alongside PAR (orange). Red shading: dry periods; gray shading: recovery periods.
We observed in preliminary analysis that seasonal trends in SIF retrievals correlate well with changes in PAR and a significant relationship with GPP, which supports the reliability of the data for future temporal scaling efforts. Changes in the behavior of both sites after rainfall events were also observed and will be further investigated in the next step of the project.
3.2. Short Campaign
Table 1 shows the standard deviation and Moran’s index after regression and autocorrelation analysis of the biophysical variables for the study areas. A higher standard deviation implies greater spatial variability, and a lower Moran’s index indicates less spatial clustering. In both cases, the most limiting variable was Cab, with higher standard deviation and lower autocorrelation values, which was used to calculate the final estimate of the number of ESUs, resulting in 4 ESUs per site with an acceptable error of 10%.

Table 1.
Standard deviation and Moran’s index for biophysical variables per site.
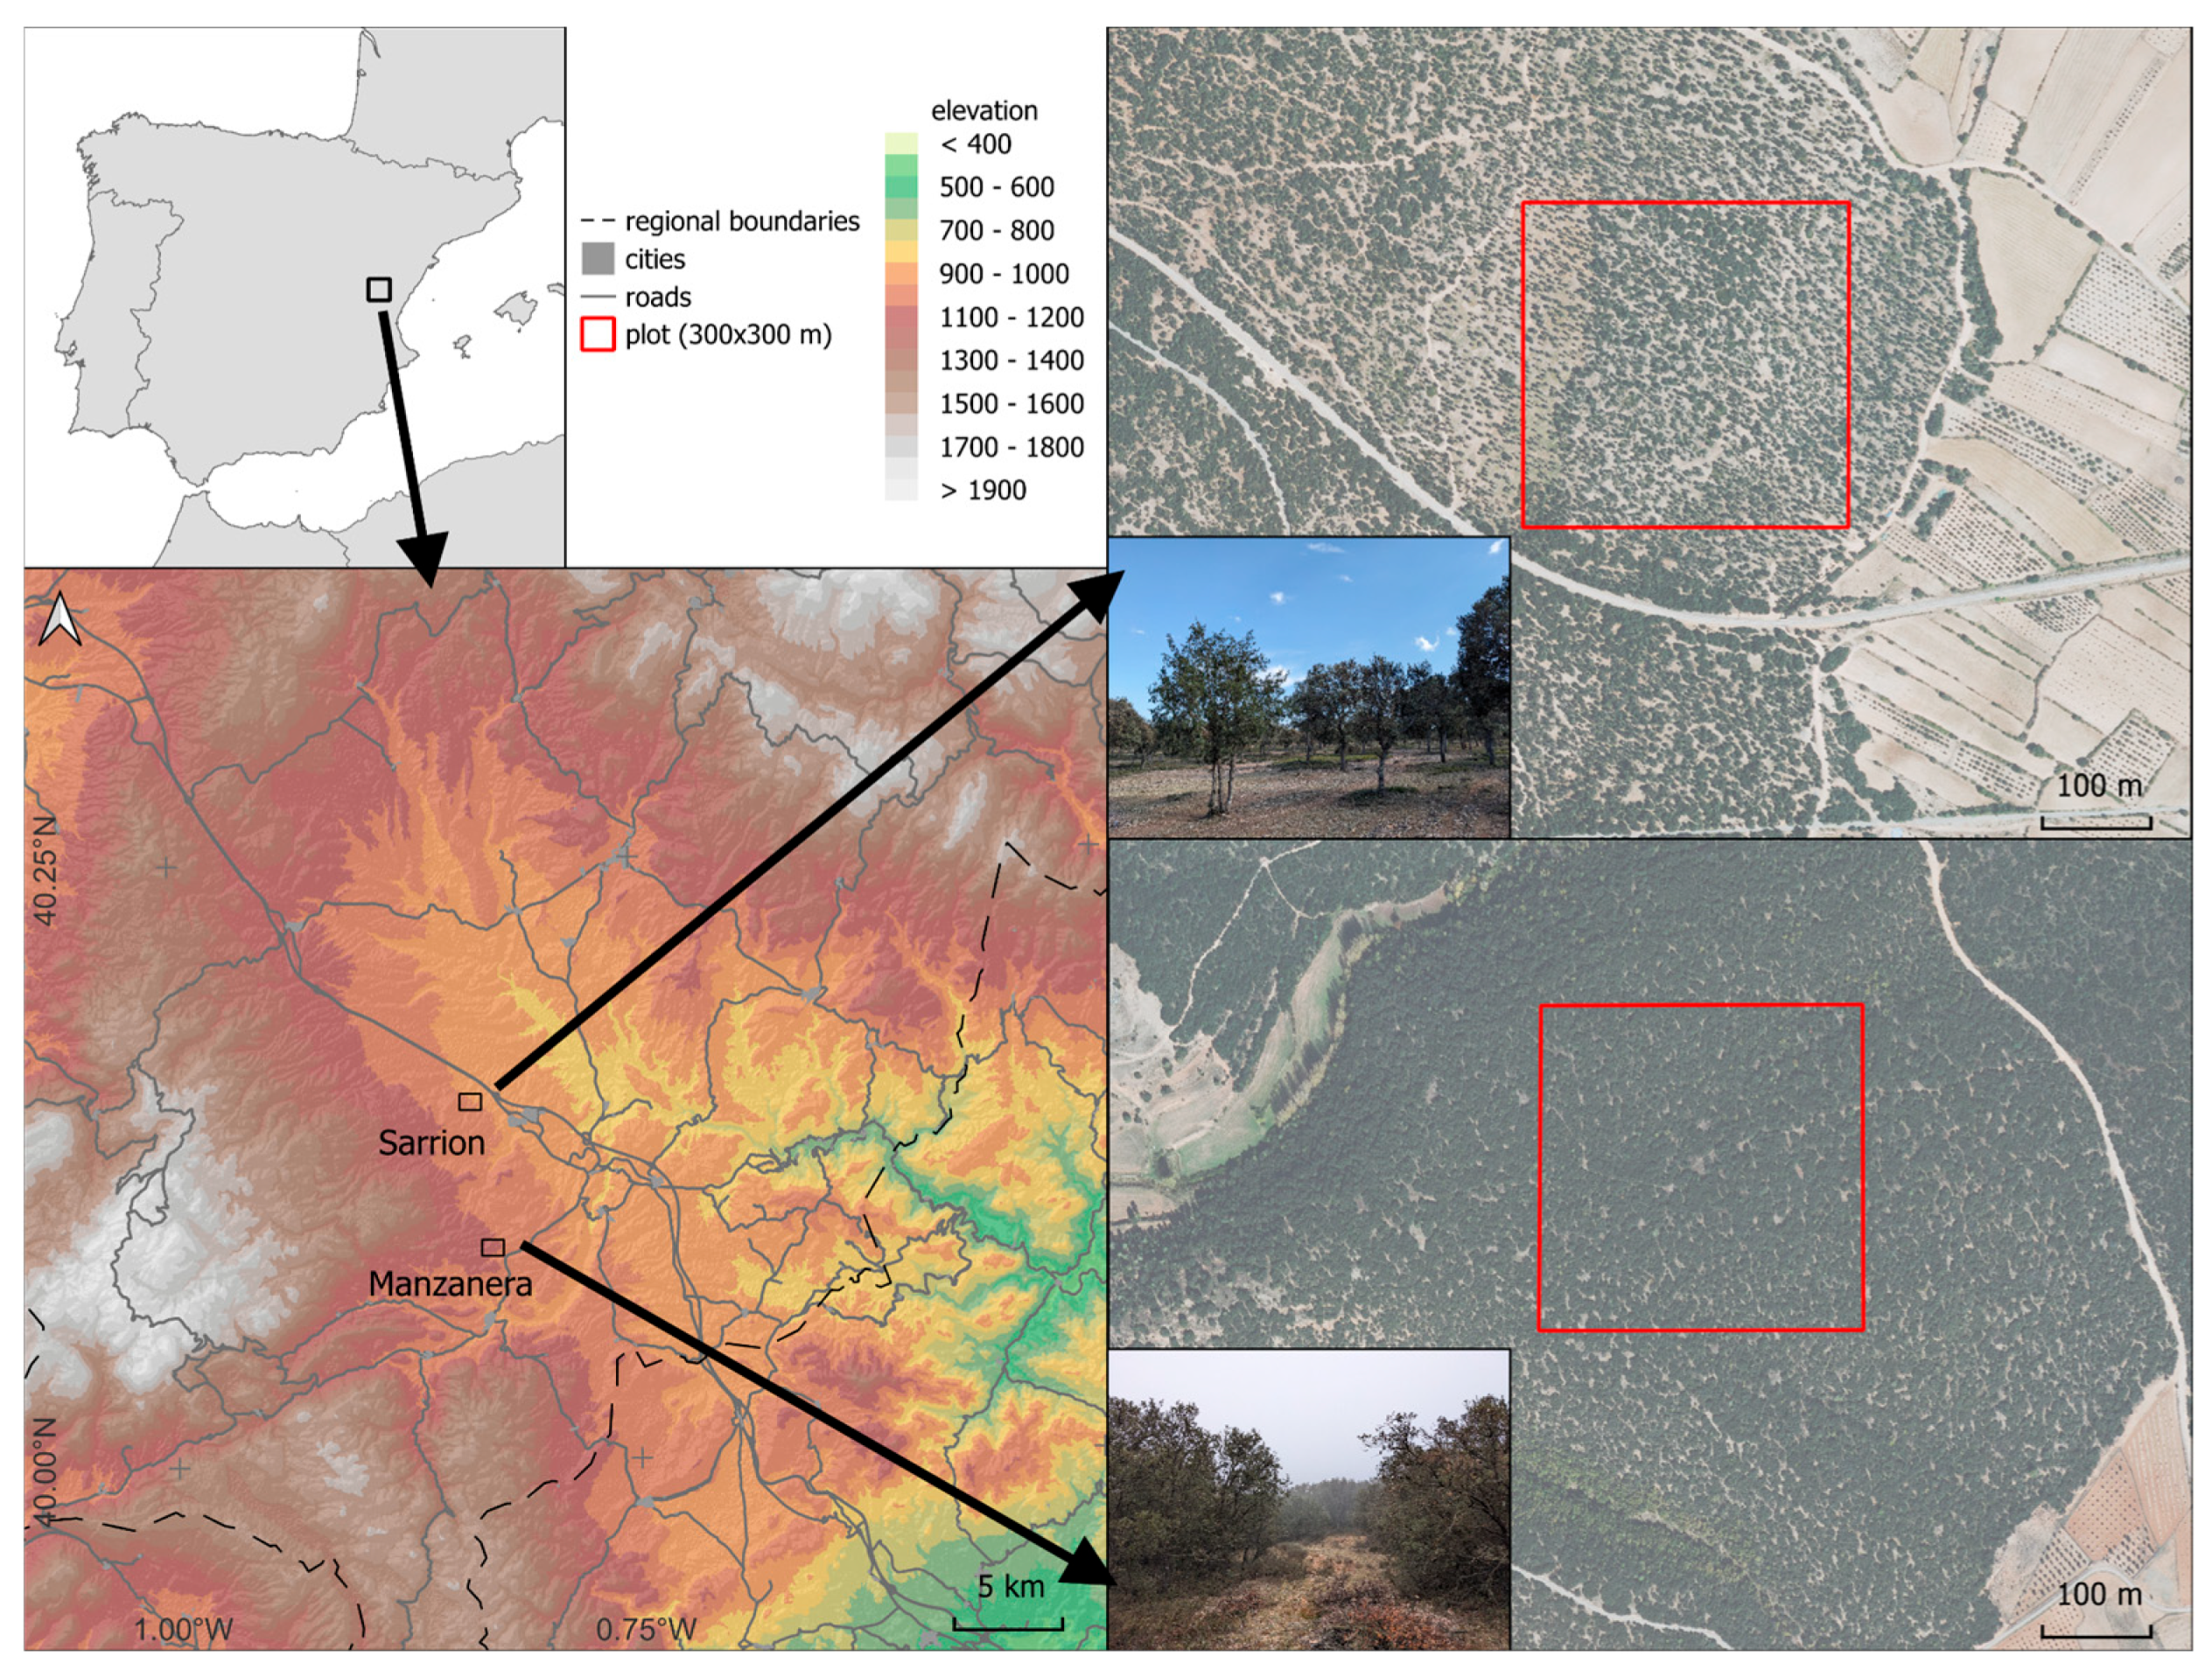
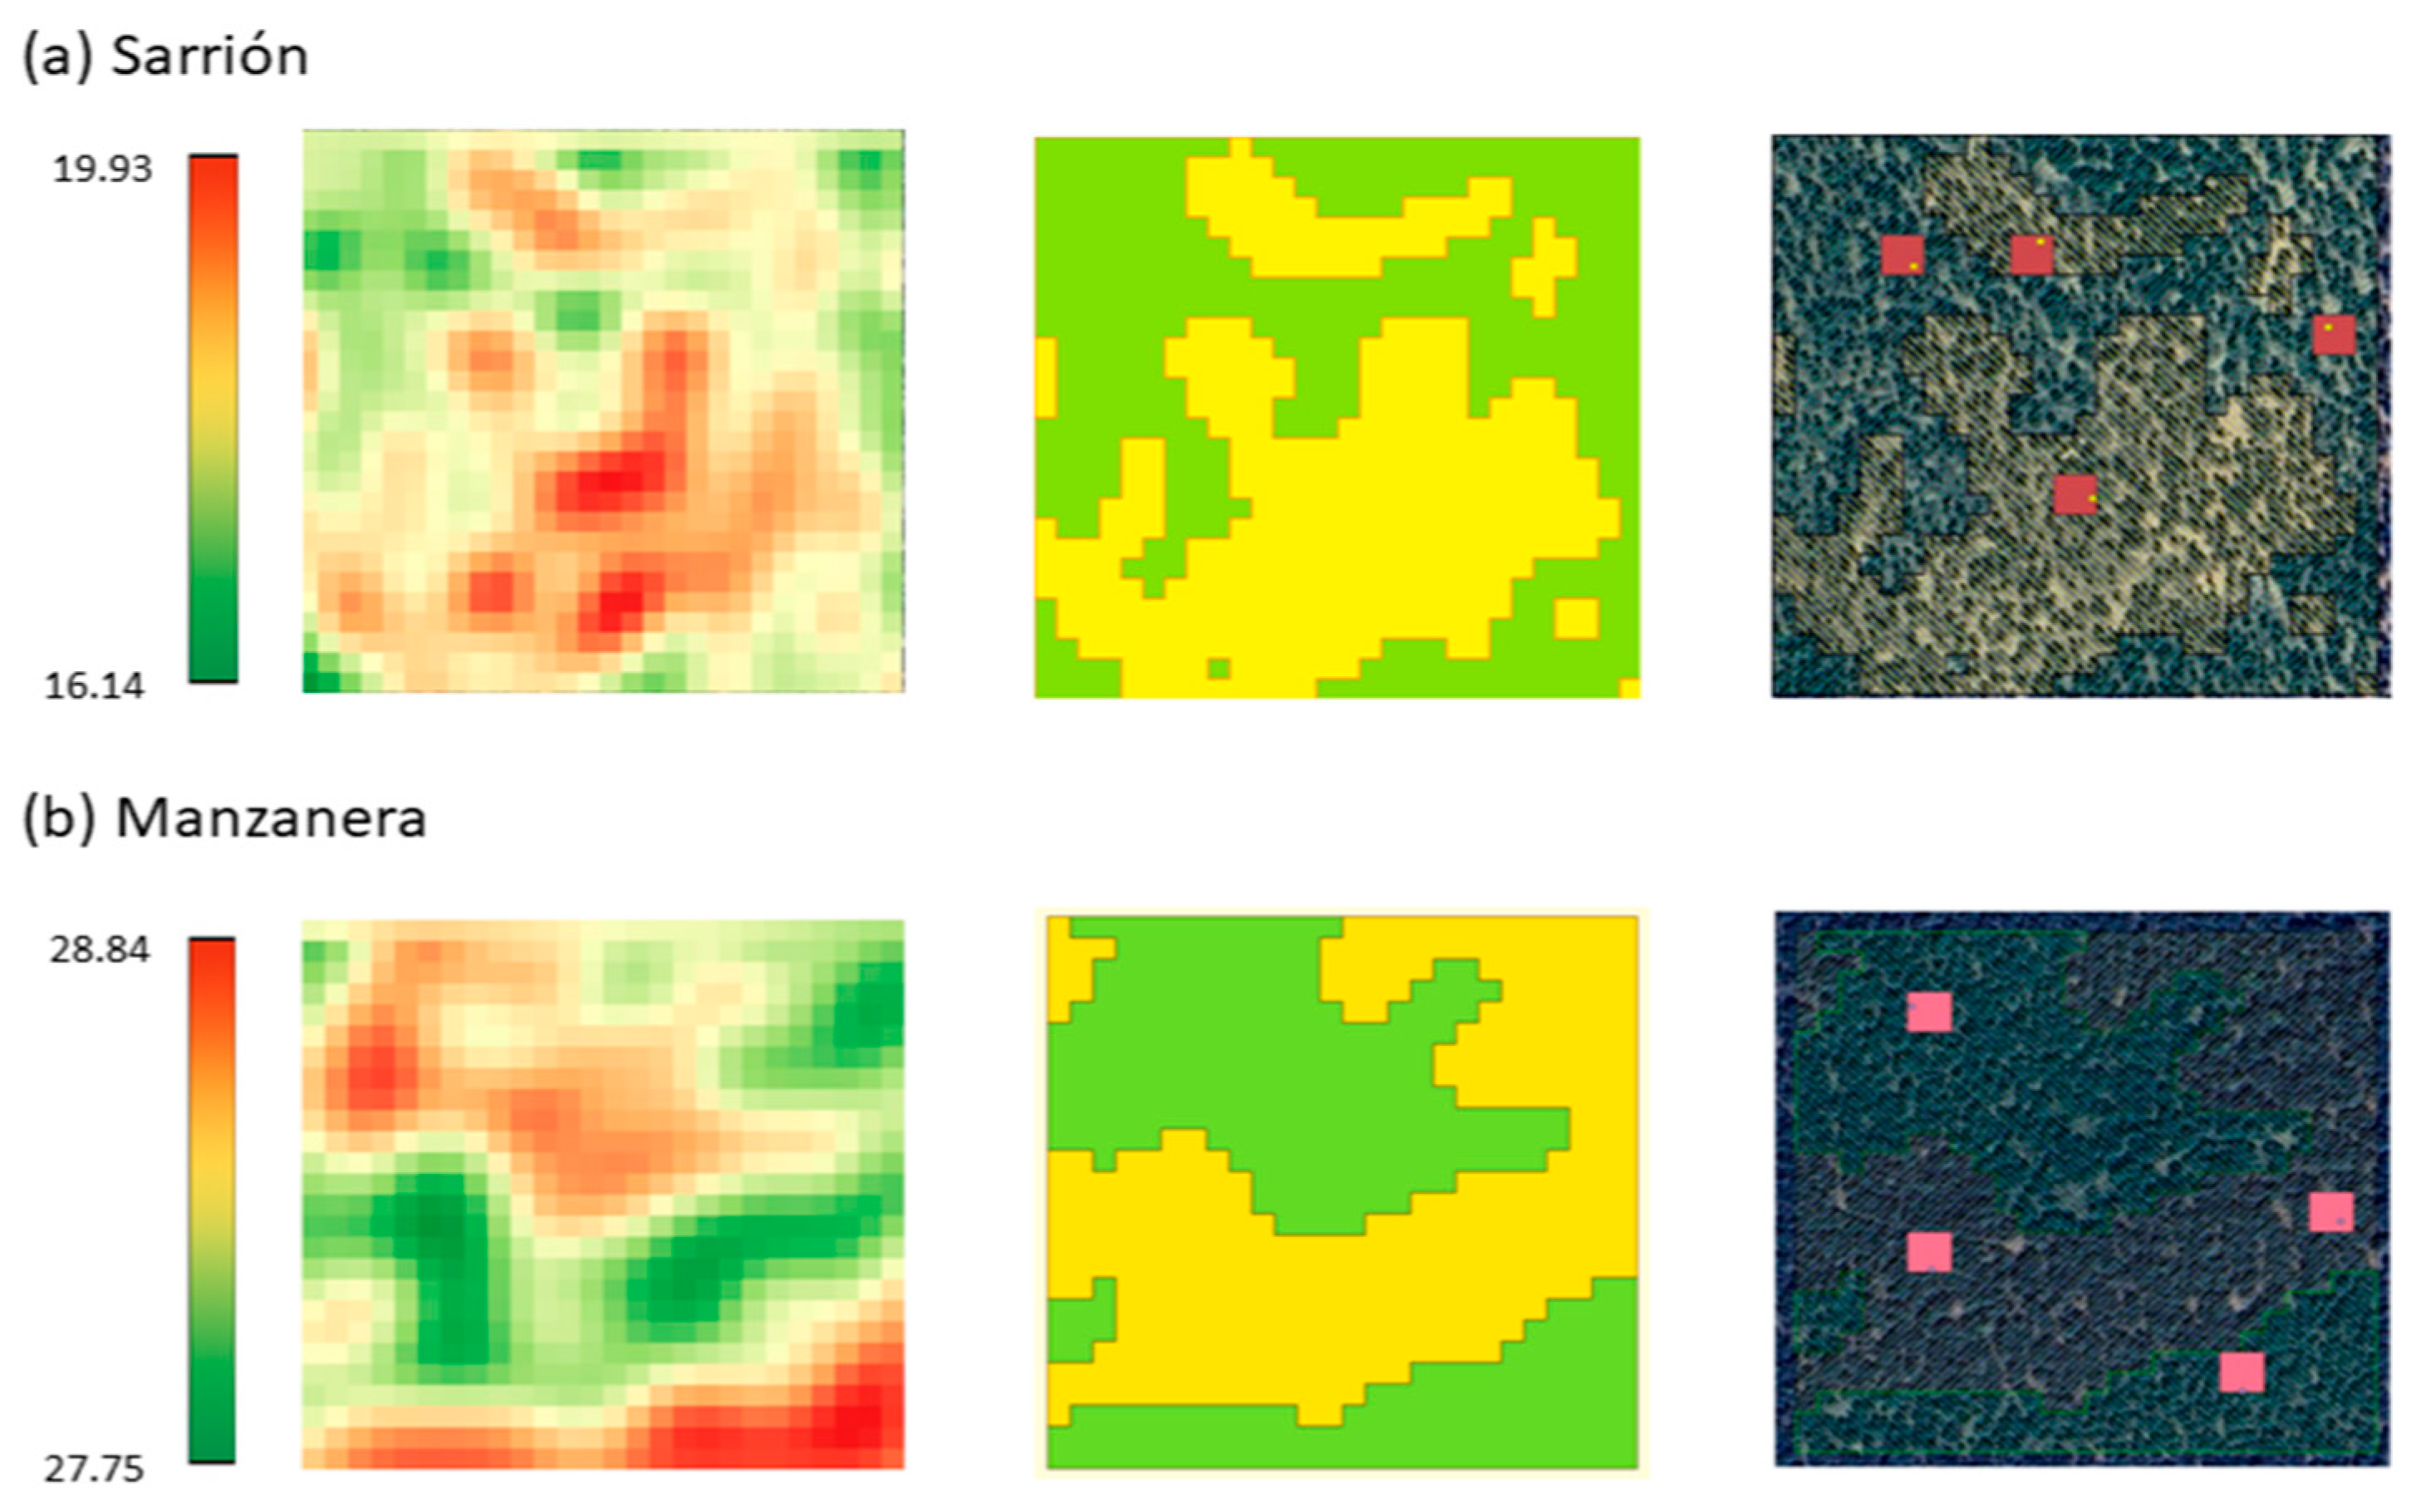
Based on these results, an interpolation of the Cab variable was performed using the SVM methodology. Two strata were selected (two ESUs per stratum) corresponding to the four ESUs to be distributed, one above and one below the mean to ensure the required sample size, and one replicate per stratum. The interpolation and stratification of each site and the distribution of ESUs are shown in Figure 3.
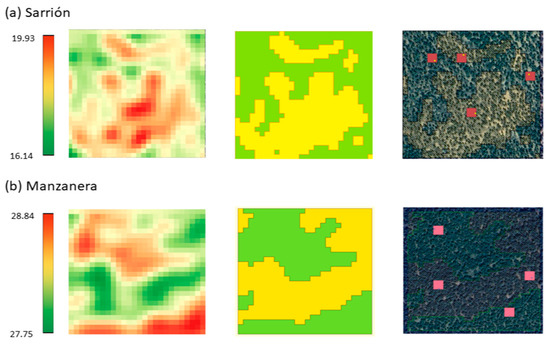
Figure 3.
From left to right, interpolated map of Cab, strata (green below the mean and yellow above) and distribution of ESUs over RGB composition in the following locations: (a) Sarrión 300 × 300 m plot and (b) Manzanera 300 × 300 m plot.
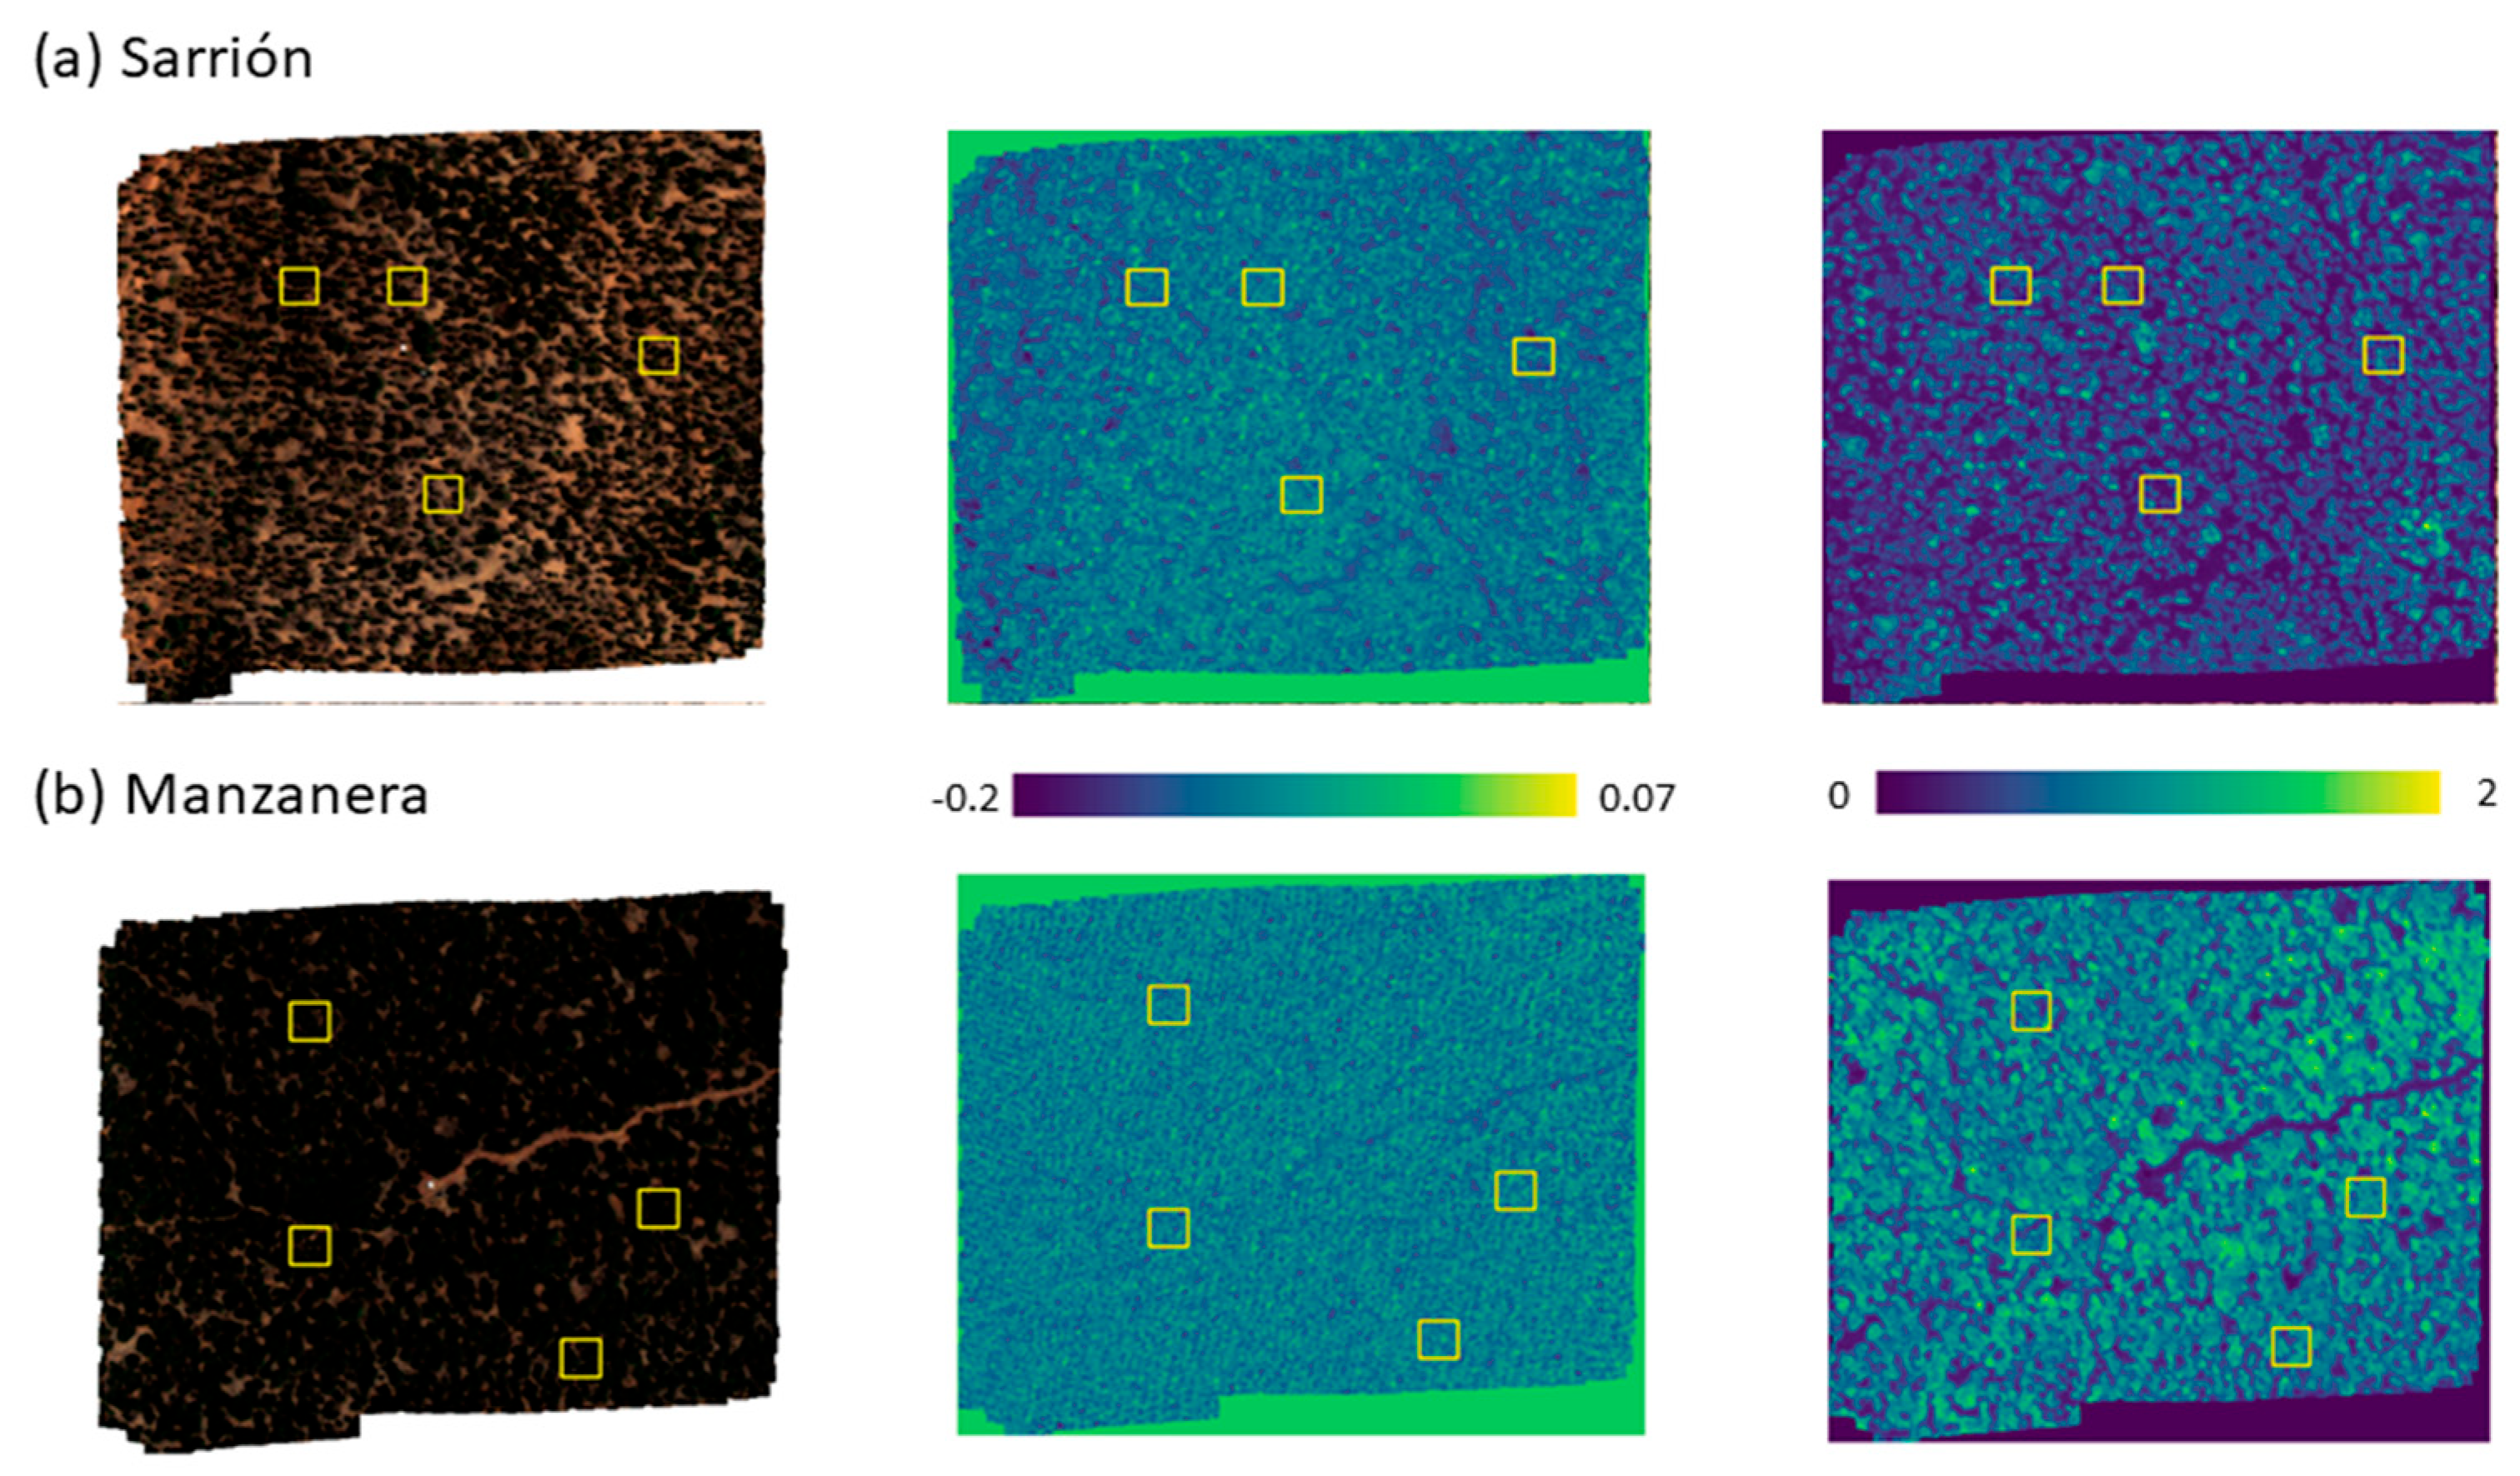
To obtain the number of measurements in each ESU, the PRI and ChRE images were obtained from the hyperspectral image (Figure 4). These images will also be used in upscaling.

Figure 4.
From left to right, hyperspectral image (RGB composition), PRI and ChlRE in the following locations: (a) Sarrión 300 × 300 m plot and (b) Manzanera 300 × 300 m plot. ESUs are highlighted in yellow.
Finally, the sample size formula was applied to the pixels within each ESU with a maximum acceptable error of 1% for PRI and 10% for ChlRE, resulting in approximately 16 sampling points per ESU (Table 2).
Table 2.
ESU ID within the 300 × 300 plot, standard deviation of PRI and ChlRE, and number of sampling points for reflectance and fluorescence.
4. Conclusions and Further Research
The field campaign design establishes a manageable number of ESUs and field measurements to achieve the objective of errors of less than 10% in SIF and 1% in reflectance.
The next task within the SpaFLEX project will be to apply an upscaling and error propagation methodology to verify whether measurement errors remain within the allowable limit for a 300 × 300 m pixel.
Author Contributions
Conceptualization, P.J.G.-G., D.A., M.J., M.P.C.-M., S.V.W., J.J.P., A.M.-E. and R.D.-D.; methodology, P.J.G.-G. and R.D.-D.; field campaign, P.J.G.-G., D.A., M.J., M.P.C.-M., J.J.P. and A.M.-E.; software, P.J.G.-G., R.D.-D. and D.A.; data curation, P.J.G.-G., R.D.-D. and D.A.; writing—review, and editing, P.J.G.-G., M.J. and R.D.-D.; graphical deployment, P.J.G.-G., D.A. and A.M.-E.; supervision, R.D.-D. All authors have read and agreed to the published version of the manuscript.
Funding
This publication is part of the R&D&I projects PID2022-137022OB-C33 and PCI2023-145988-2, funded by MICIU/AEI/10.13039/501100011033/. Part of this work was also funded by the eLTER Plus project (INFRAIA, Horizon 2020, Agreement no. 871128).
Institutional Review Board Statement
Not applicable.
Informed Consent Statement
Not applicable.
Data Availability Statement
The raw data supporting the conclusions of this article will be made available by the authors on request.
Acknowledgments
Authors are also participants of the CSIC Interdisciplinary Thematic Platforms (PTI) PTI EcoBioDiv and PTI Teledetect and in the thematic network NetOps (RED2022-134438-T) funded by MICIU.
Conflicts of Interest
The authors declare no conflicts of interest. The funders had no role in the design of the study; in the collection, analyses, or interpretation of data; in the writing of the manuscript, or in the decision to publish the results.
References
- Moreno, J.F. Advances in the Retrieval and Interpretation of Solar-Induced Vegetation Chlorophyll Fluorescence Using Passive Remote Sensing Techniques. In Proceedings of the 2021 IEEE International Geoscience and Remote Sensing Symposium IGARSS, Brussels, Belgium, 11–16 July 2021; pp. 1915–1918. [Google Scholar]
- Aasen, H.; Van Wittenberghe, S.; Sabater Medina, N.; Damm, A.; Goulas, Y.; Wieneke, S.; Hueni, A.; Malenovský, Z.; Alonso, L.; Pacheco-Labrador, J.; et al. Sun-Induced Chlorophyll Fluorescence II: Review of Passive Measurement Setups, Protocols, and Their Application at the Leaf to Canopy Level. Remote Sens. 2019, 11, 927. [Google Scholar] [CrossRef]
- Pereira, G.W.; Valente, D.S.M.; Queiroz, D.M.d.; Coelho, A.L.d.F.; Costa, M.M.; Grift, T. Smart-Map: An Open-Source QGIS Plugin for Digital Mapping Using Machine Learning Techniques and Ordinary Kriging. Agronomy 2022, 12, 1350. [Google Scholar] [CrossRef]
- Peñuelas, J.; Filella, I.; Gamon, J.A. Assessment of Photosynthetic Radiation-Use Efficiency with Spectral Reflectance. New Phytol. 1995, 131, 291–296. [Google Scholar] [CrossRef]
- Wu, C.; Niu, Z.; Tang, Q.; Huang, W.; Rivard, B.; Feng, J. Remote Estimation of Gross Primary Production in Wheat Using Chlorophyll-Related Vegetation Indices. Agric. For. Meteorol. 2009, 149, 1015–1021. [Google Scholar] [CrossRef]
- Porcar-Castell, A.; Macelloni, C.; Guanter, L. Linking chlorophyll a fluorescence to photosynthesis for remote sensing applications: Mechanisms and challenges. J. Exp. Bot. 2014, 65, 4065–4076. [Google Scholar] [CrossRef] [PubMed]
- Gamon, J.A.; Peñuelas, J.; Field, C.B. A narrow-waveband reflectance index that tracks diurnal changes in photosynthetic efficiency. Remote Sens. Environ. 1992, 41, 35–44. [Google Scholar] [CrossRef]
- Cendrero-Mateo, M.P.; Carmo-Silva, A.E.; Porcar-Castell, A.; Hamerlynck, E.P.; Papuga, S.A.; Moran, M.S. Dynamic response of plant chlorophyll fluorescence to light, water and nutrient availability. Funct. Plant Biol. 2015, 42, 746–757. [Google Scholar] [CrossRef] [PubMed]
- Gómez-Giráldez, P.J.; Jiménez, M.; Cendrero-Mateo, M.P.; Van Wittenberghe, S.; Peón, J.J.; Moncholí-Estornell, A.; Díaz-Delgado, R. The Spafleximp Project: Spanish Flex-S3 Mission Calibration and Validation Plan Implementation. In Proceedings of the IGARSS 2024 IEEE International Geoscience and Remote Sensing Symposium, Athens, Greece, 7–12 July 2024; pp. 296–300. [Google Scholar]

Disclaimer/Publisher’s Note: The statements, opinions and data contained in all publications are solely those of the individual author(s) and contributor(s) and not of MDPI and/or the editor(s). MDPI and/or the editor(s) disclaim responsibility for any injury to people or property resulting from any ideas, methods, instructions or products referred to in the content. |
© 2025 by the authors. Licensee MDPI, Basel, Switzerland. This article is an open access article distributed under the terms and conditions of the Creative Commons Attribution (CC BY) license (https://creativecommons.org/licenses/by/4.0/).