Abstract
We have improved the efficiency of the protection of occupants of cars by effectively reducing the injury and mortality rate caused by accidents when using safety belts. To ensure the protection efficiency of the safety belt outlet cover, we tested and adjusted the following parameters: the filling time, flow-front temperature and switching pressure, injection position pressure, locking force, shear rate, shear force, air hole, melting mark, material flow freezing-layer factor, volume shrinkage rate during jacking out, coolant temperature and flow rate in the cooling stage, part temperature, mold temperature difference, deflection stage, warping deformation analysis, differential cooling, differential shrinkage, and directional effect.
1. Introduction
The safety belt, an important passenger restraint device, is designed to immediately restrict the movement of passengers in a vehicle collision and to prevent them from secondary collision with hard objects such as the steering wheel or instrument panel in the vehicle to prevent serious injury. Due to their low cost and excellent safety protection performance, automobile seat belts are widely recognized and it is mandatory to install them all vehicles in many countries around the world [1]. With the continuous progress of the automobile manufacturing industry, automobile safety has become a top priority, and airbags and safety belts, as standard safety equipment for vehicles, have become important. They operate together and significantly improve the protection of the occupants of the vehicle and effectively reduce injury in vehicle accidents [2]. According to relevant studies on the key safety features of cars, the safety belt significantly reduces casualties in accidents and plays an important role in protection. To protect the driver and passenger, the seat belt is installed in the side wall of the car through the exit cover. Because the safety belt slips out along the exit cover, the design of the exit cover directly affects the service life of the safety belt.
2. Description of Seat Belt
2.1. Product Information
The information on the seat belt used in our study is shown in Table 1.

Table 1.
Product information sheet.
2.2. Thickness
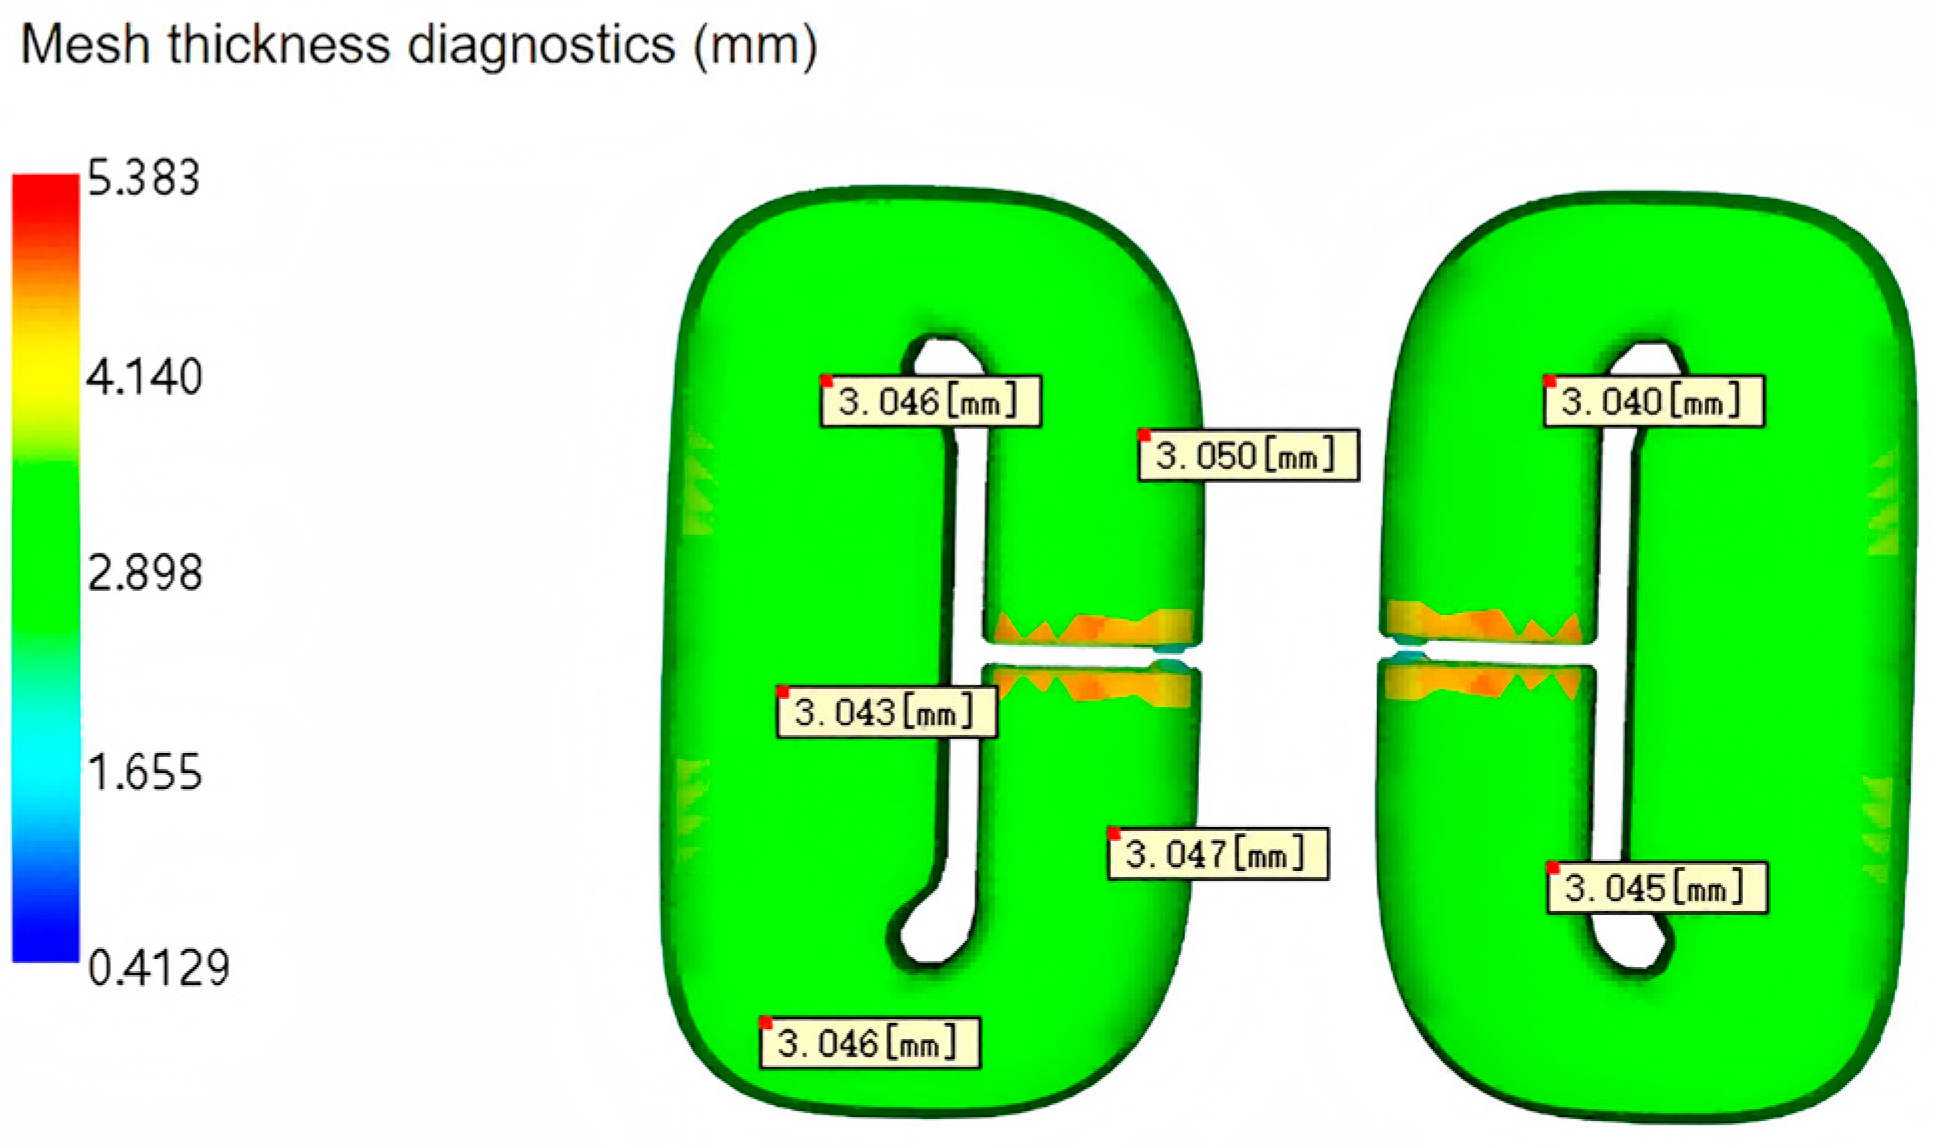
The thickness of the safety belt outlet cover is directly related to its structural strength; a thicker cover provides better impact resistance and wear resistance, which is crucial in protecting the seat belt system from damage in collisions. It needs to withstand wear in daily use as well as emergency tensile forces, ensuring reliability and safety for long-term use. Therefore, as shown in Figure 1, a die flow analysis was conducted on the thickness of the cover.

Figure 1.
Plastic flow analysis of belt outlet cover.
3. Process Setting
3.1. Grid Statistics
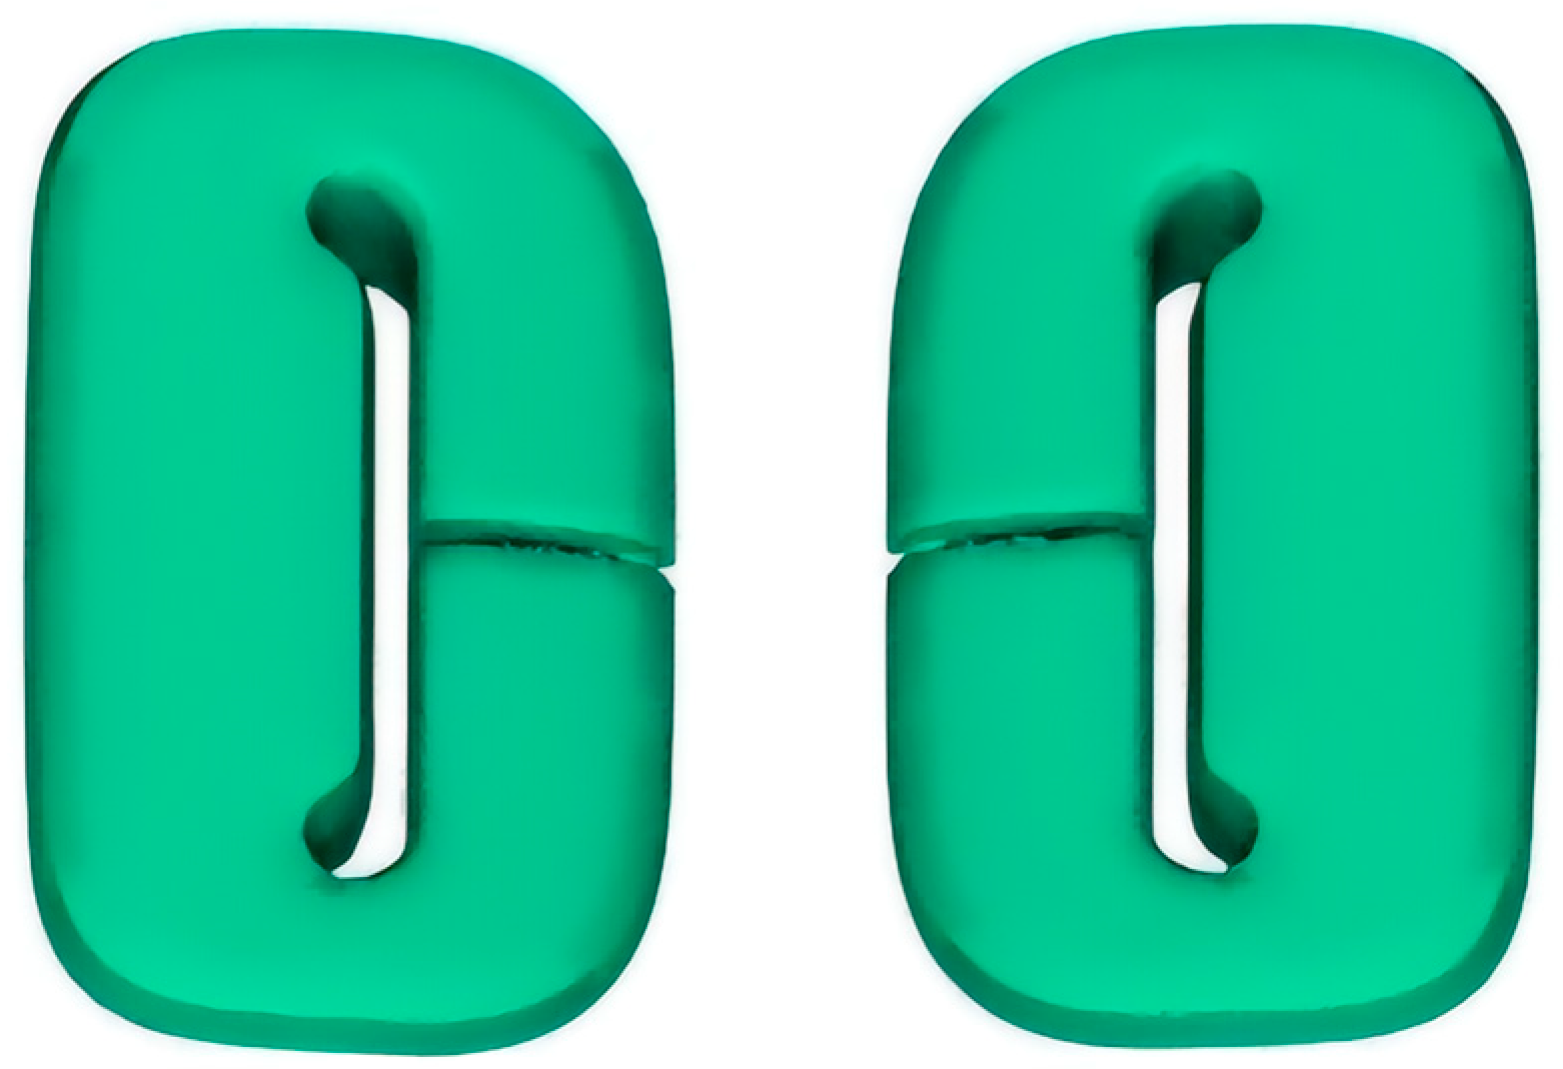
After starting Moldflow, the seat belt outlet cover model was created as shown in Figure 2. The grid type selected for use was “Fusion”, “mm”, and enter “Print” in the project name.
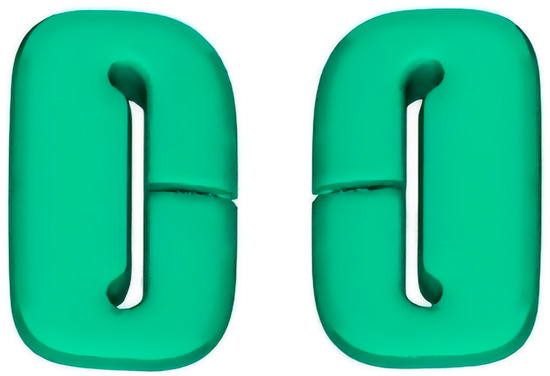
Figure 2.
Safety belt outlet cover model.
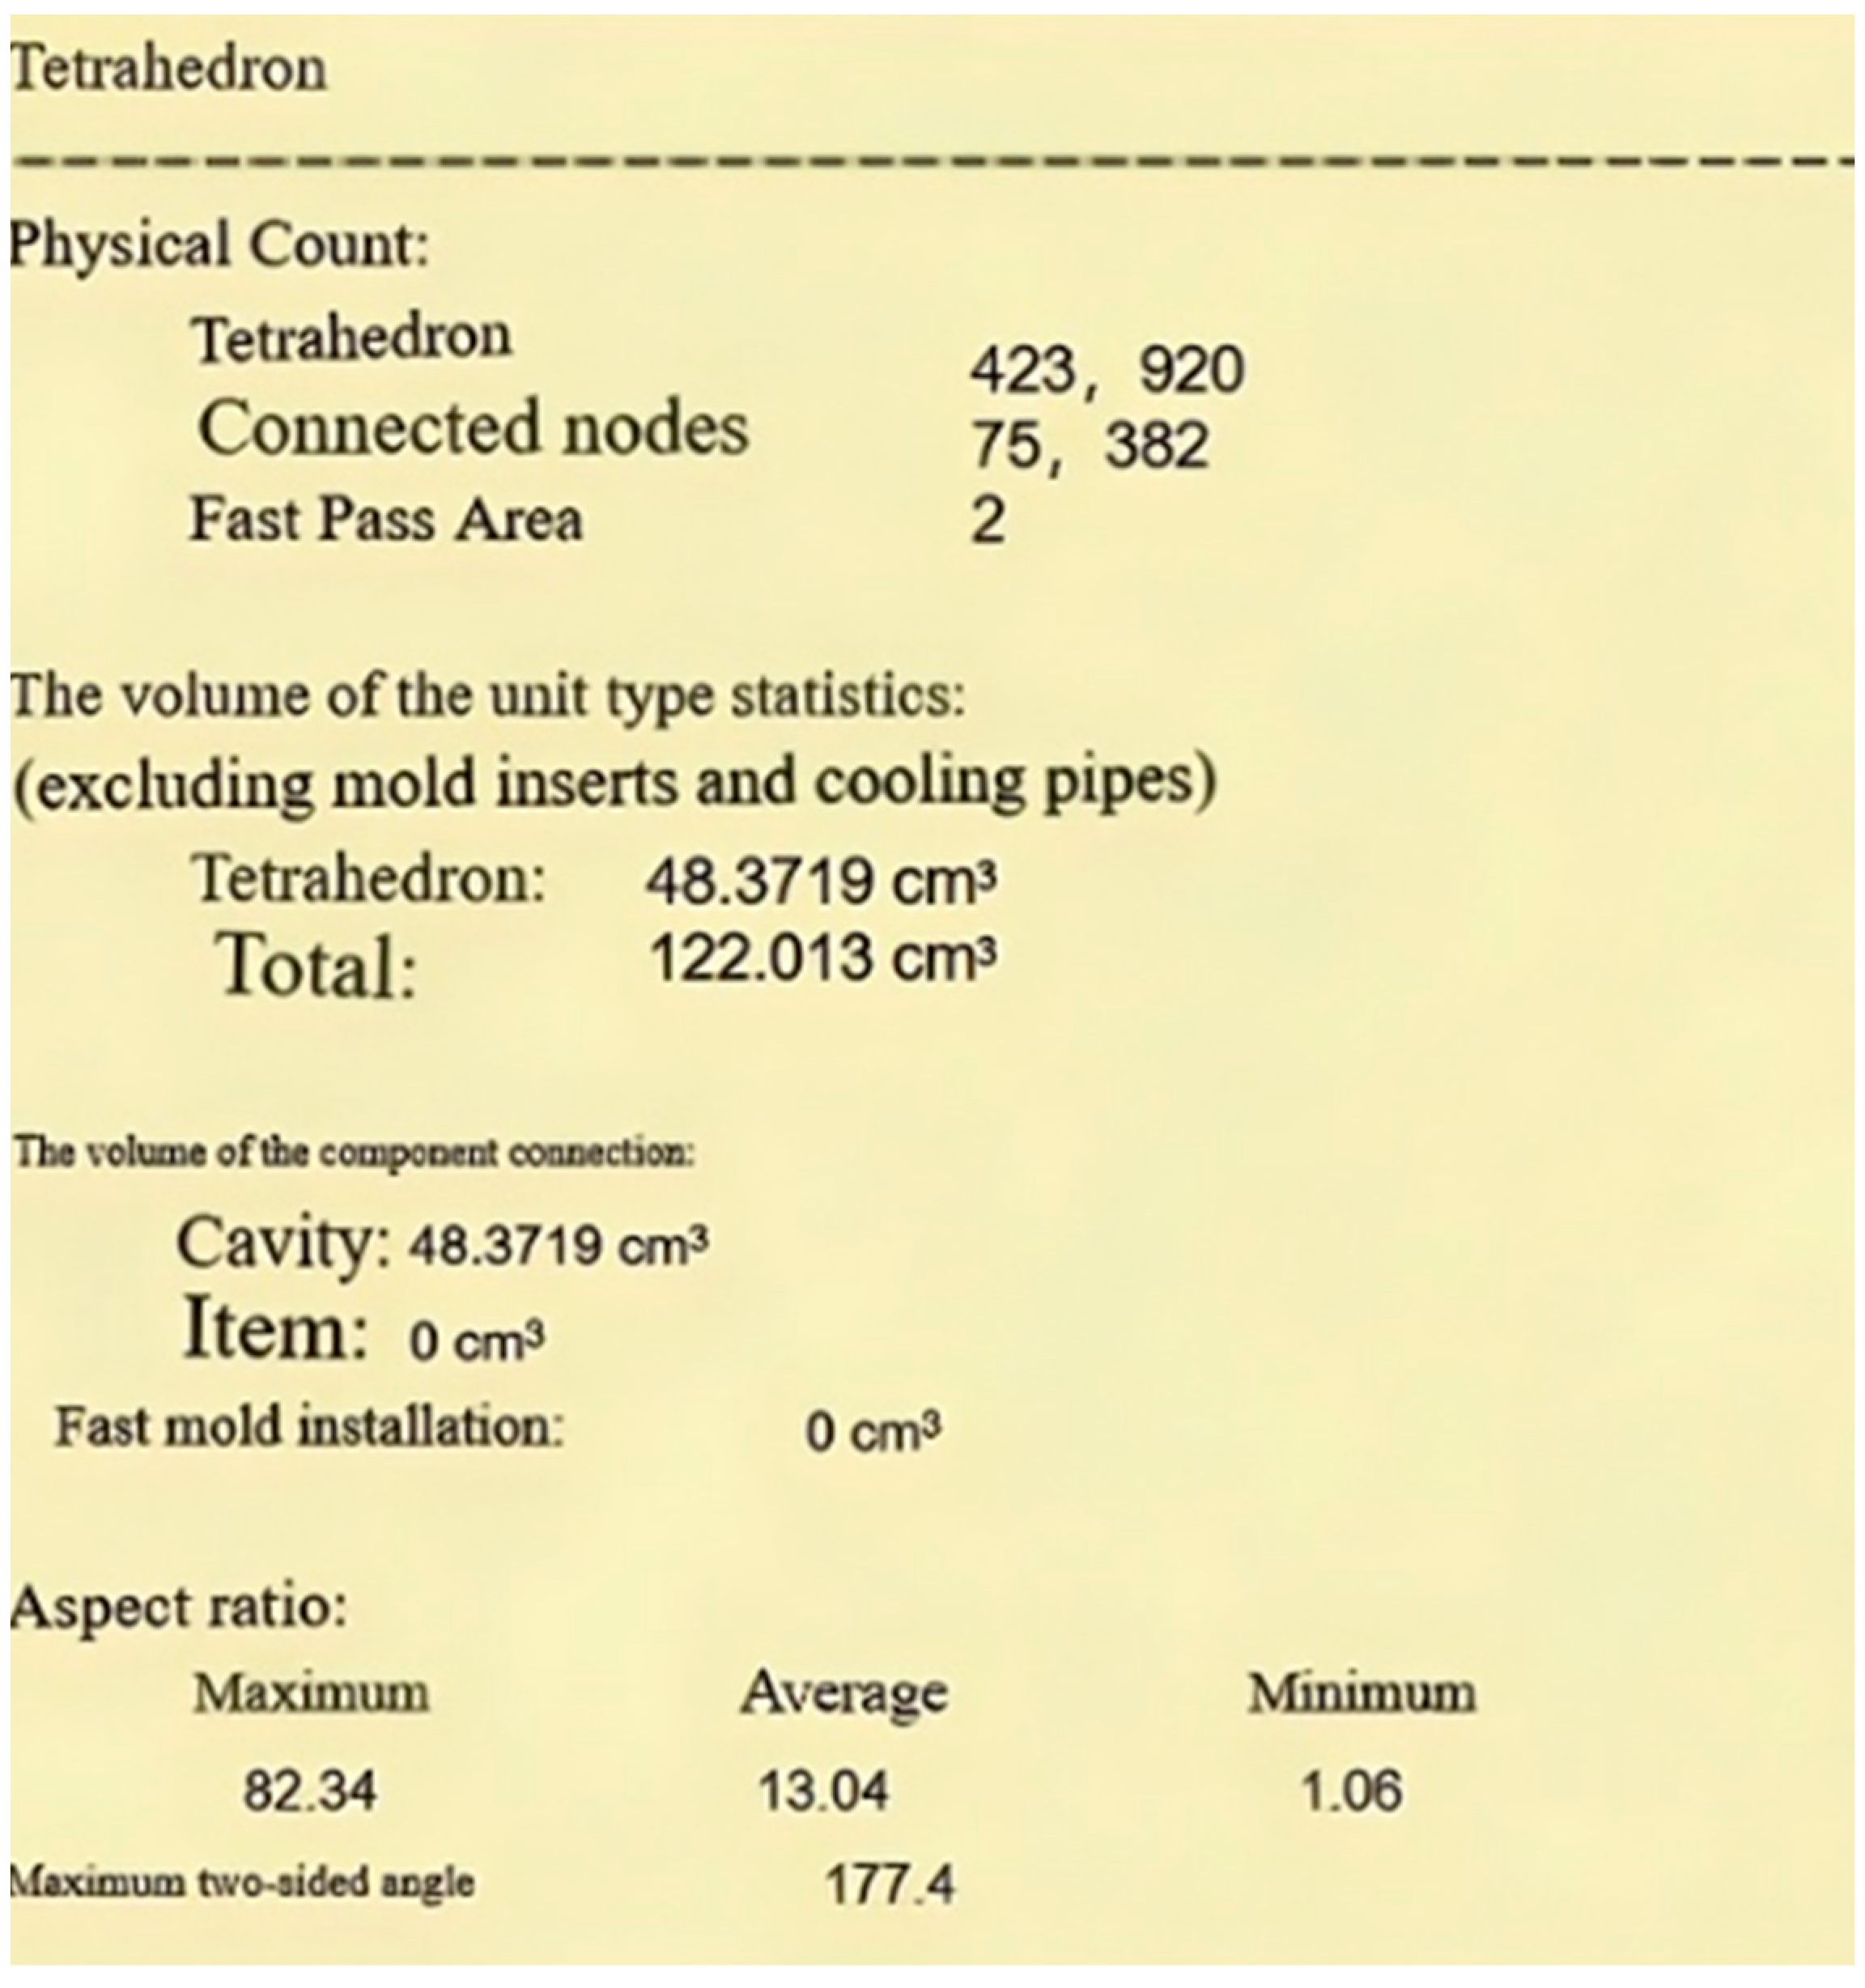
By double-clicking the Create Grid icon in the Schema task window, the Tools page displayed the definition of the Create Mesh and we set it as 5 mm in the global grid side length. The “Grid Now” command was used to grid the model with the grid information shown in Figure 3.
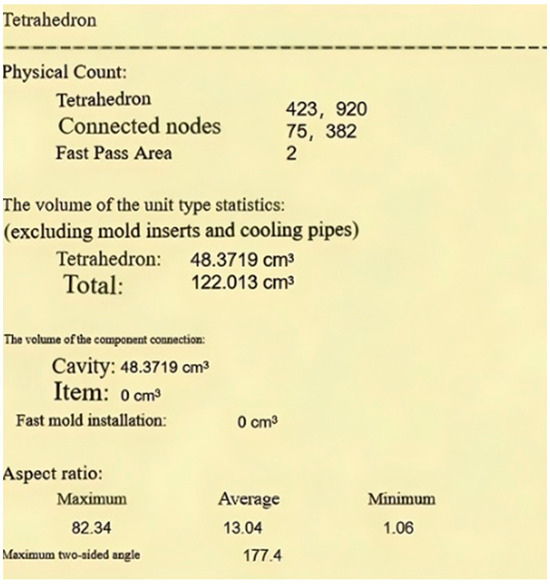
Figure 3.
Network information.
3.2. Material Data
The PA66 AI0BK-S17 seat belt outlet cover was used in this study, with the material data shown in Table 2.
Table 2.
Data sheet of seat belt outlet cover material.
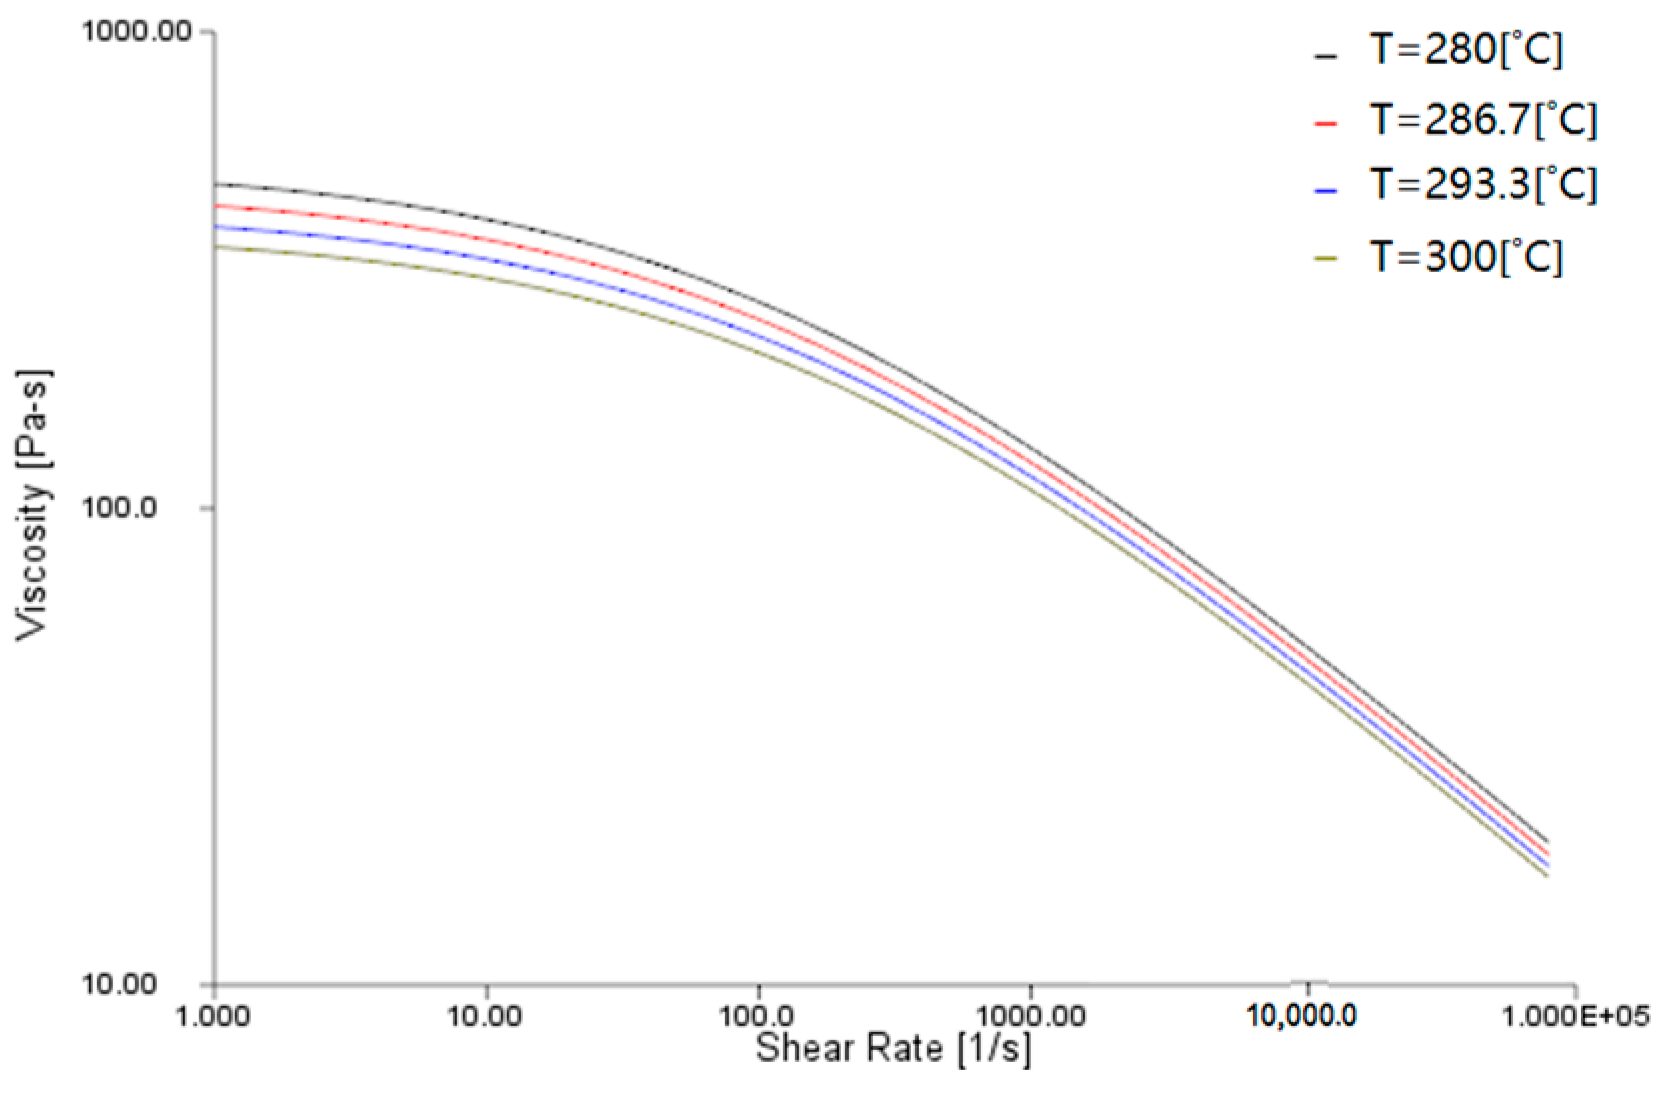
A curve graph with viscosity as the ordinate and shear rate as the abscissa is called a viscosity characteristic curve graph. The curves of the shear velocity versus viscosity at different temperatures are presented in Figure 4. The curves of shear velocity and viscosity decreased monotonically at different temperatures. When the shear speed was fixed, the maximum viscosity of the material occurred at 280 °C.
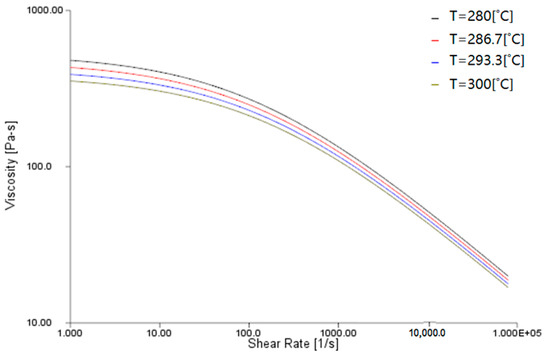
Figure 4.
Plot of viscosity characteristics.
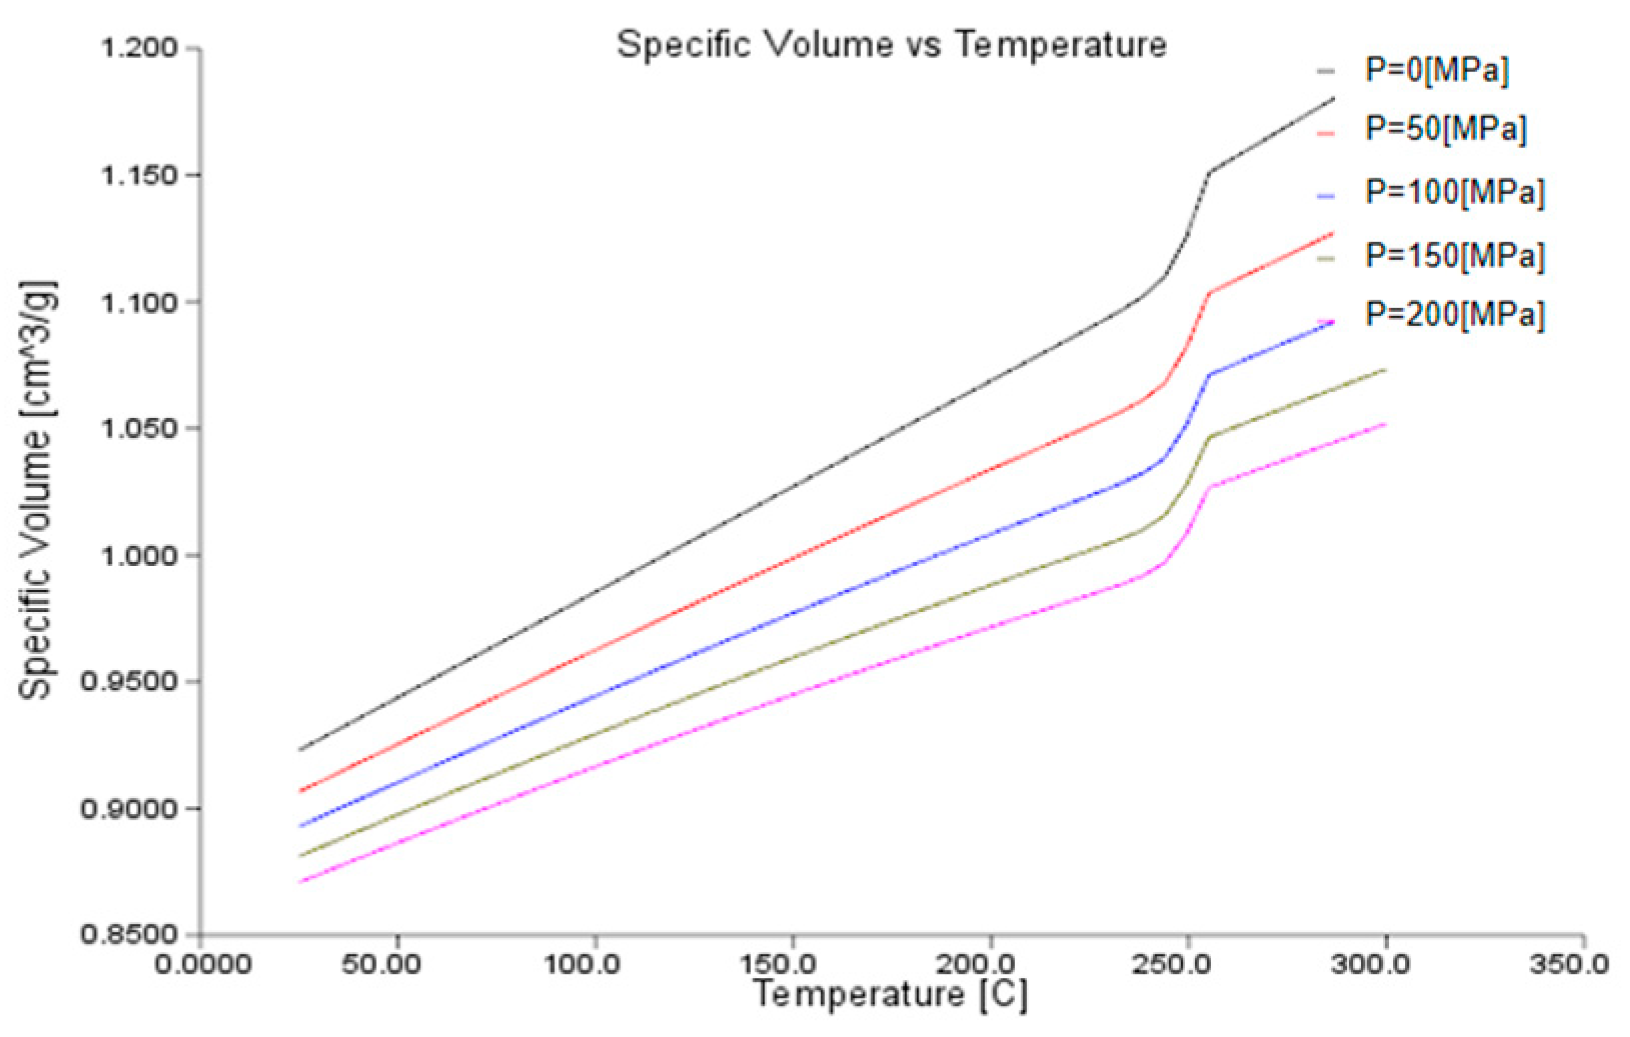
Figure 5 shows the relationship between temperature and specific volume. When the temperature was fixed, the material with a pressure of 0 MPa had the maximum specific capacity, and the pressure of 200 MPa was the minimum.
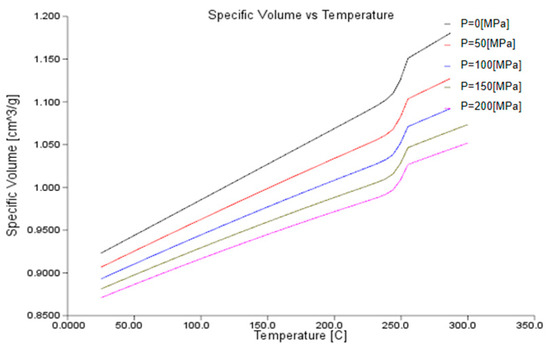
Figure 5.
Temperature-specific volume curve plot.
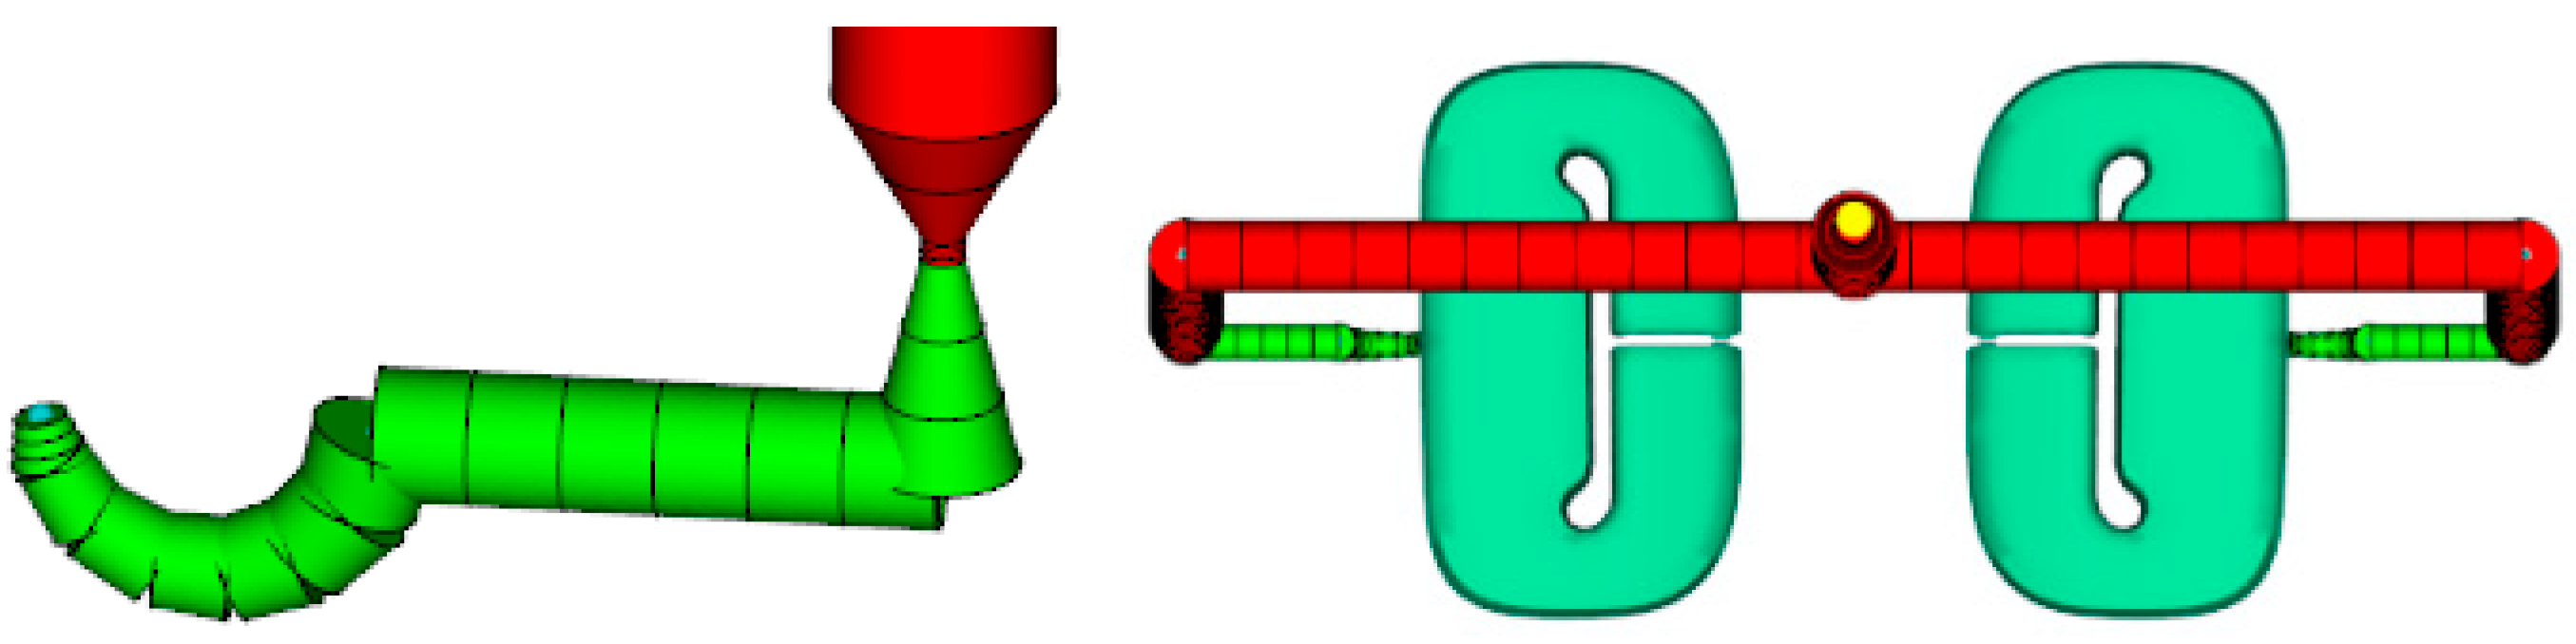
3.3. Gate Position
The gate position accurately controls the flow path, flow, and speed of the fluid (such as melt glue and injection materials). By adjusting the opening degree and position of the valve, precise control of fluid flow is obtained to meet specific process requirements. When using check valves, the selection of their position is important in preventing fluid backflow or backflow in the mold, ensuring that the fluid flows in the predetermined direction, and improving the molding quality of the product (Table 3, Figure 6).
Table 3.
Size information.

Figure 6.
Valve position.
4. Results
4.1. Fill and Pressure Protection
In mold flow analysis, the analysis and simulation of the filling and pressure holding stage are important for predicting the possible defects in the injection molding process and optimizing the mold design and process parameters. By simulating the melt flow behavior, pressure distribution, and temperature change during filling and pressure retention, the quality of the mold design and the feasibility of the process parameters were evaluated to guide mold modification and process adjustment in the actual production.
4.1.1. Filling Time
Filling time is the time required for the metal liquid or plastic melt to enter the mold cavity from the nozzle and fill the whole cavity. In die-casting, this is the time from the beginning of the flow of the metal fluid into the mold chamber until the chamber is filled. In the injection process, the time required for the plastic to melt from the injection nozzle into the mold cavity and to fill the whole cavity is measured. As shown in Figure 7, the filling time of the safety belt cover was 0.0143 s, and the fluid mode at this time was balanced.
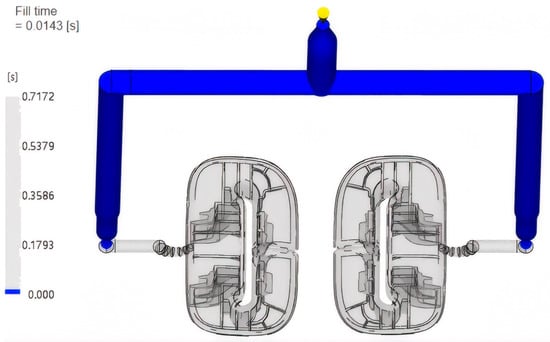
Figure 7.
Analysis of filling time (0.0143 s).
As shown in Figure 8, the filling time of the safety belt cover was 0.7172 s, and the contour interval at this time was uniform.
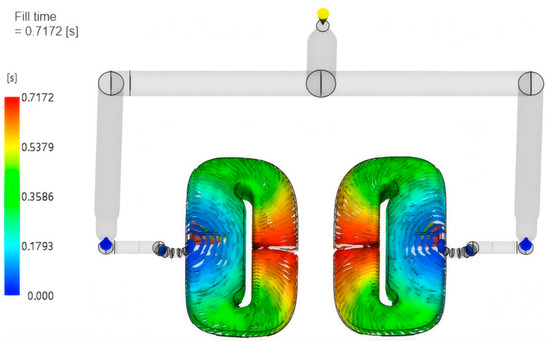
Figure 8.
Analysis of filling time (0.7172 s).
4.1.2. Flow-Front Edge Temperature
The temperature difference of the flow front refers to the temperature distribution of the flow front of the melt in the process of filling the mold cavity, that is, the temperature difference at different positions or at different times. The flow-front temperature is one of the key factors in evaluating the quality of injection molding products because it directly affects the fluidity energy of the melt, the quality of the fusion line, and the final performance of the product. In addition, the temperature difference in the flow front further reveals the inhomogeneity of the temperature distribution, which is of great significance for optimizing the injection molding process and avoiding product defects.
As shown in Figure 9, in the flow front, the temperature difference of the flow front was 16.5 °C, and the temperature difference of the product appearance surface was within 0.5 °C. The recommended material molding range was between 280.0 and 300.0 °C, and the temperature difference before the flow was very small.
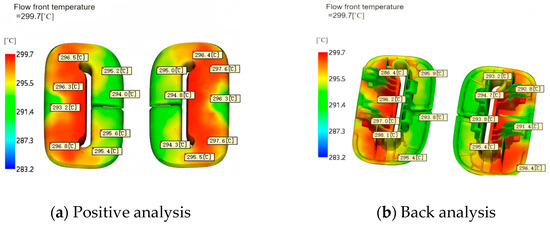
Figure 9.
Temperature distribution diagram of 3D hydrodynamic analysis.
4.1.3. V/P Switching Pressure
V/P switching refers to the process of transition from the injection stage (speed regulation) to the pressure holding stage (pressure regulation) when the molten material is injected into the mold. The selection of V/P switching points is crucial to the quality of molding products. The appropriate switching point effectively prevents or reduces injection defects such as short-shot, overflow, gas retention, and residual stress. The pressure indication speed was determined according to Figure 10 [3]. V/P switching controls the filling degree of the molten material during filling. As shown in Figure 10, the pressure distribution of the whole product and the flow channel at this time, and the instantaneous pressure distribution of the V/P switching point was 48.48 MPa.
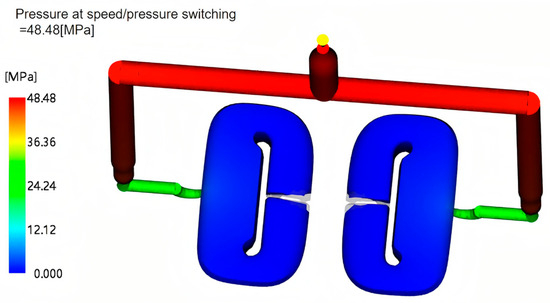
Figure 10.
V/P switching pressure.
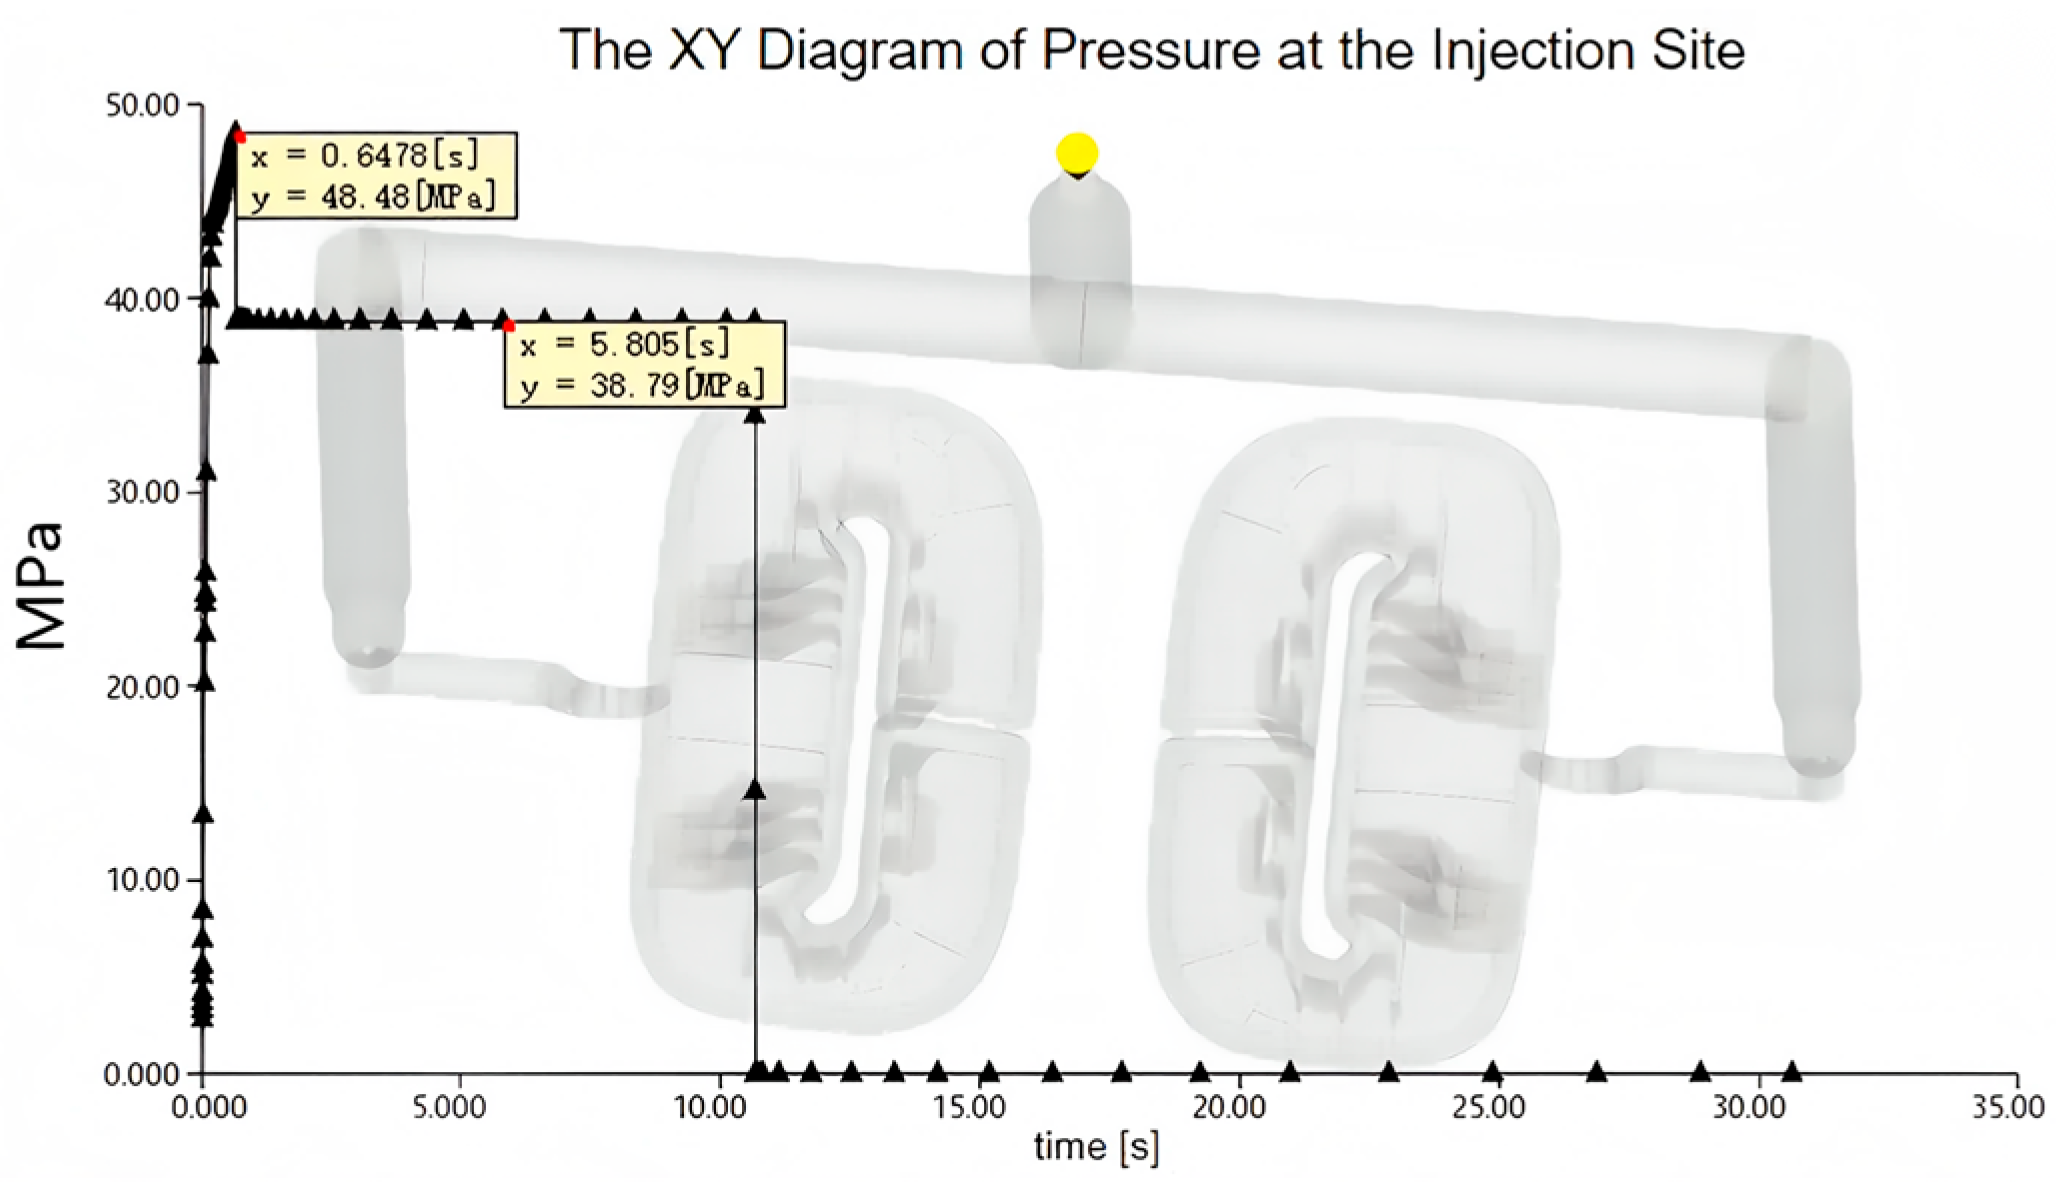
4.1.4. Injection Position Pressure
Figure 11 shows the XY diagram of the pressure at the injection position. Through analysis, the maximum time was 0.6478 s, the maximum nozzle pressure was 48.48 MPa, and when the pressure holding time was 10 s, the pressure was 39 MPa. Triangles mark the coordinate points corresponding to each data point.
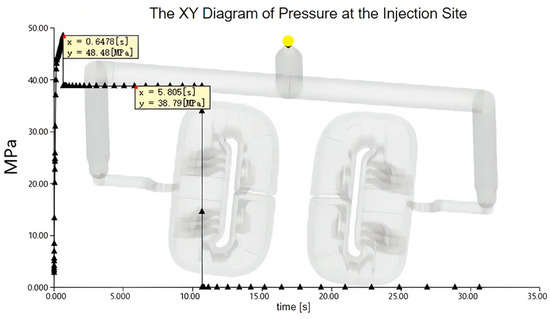
Figure 11.
XY chart of pressure over time at the injection position.
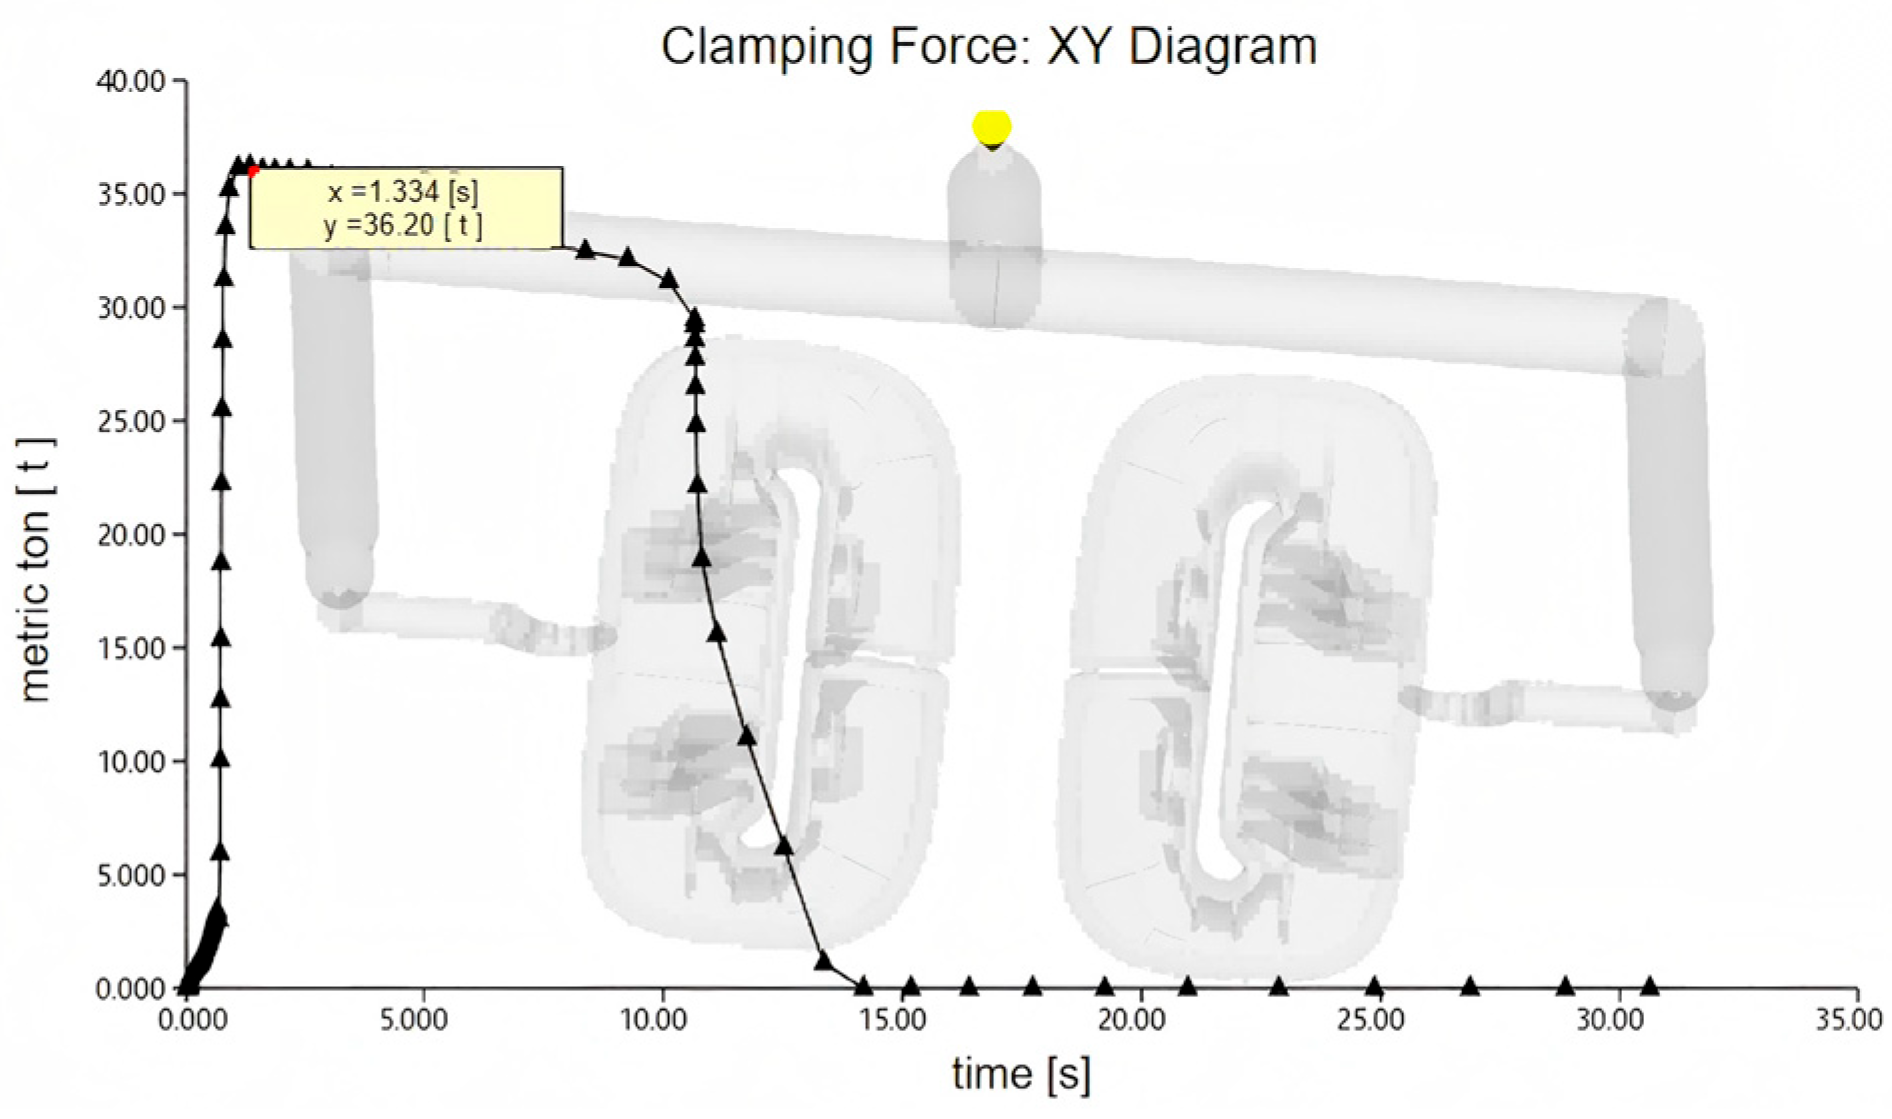
4.1.5. Mold-Locking Force
The mold-locking force is a variable closely related to the cavity pressure of the injection molding machine [4], and is an important index of the injection molding machine. Manufacturers do not calculate the theoretical locking force. Due to the backward detection technology or lack of precision testing instruments, many manufacturers do not test injection molding forces, so the locking force is an extremely important index. Figure 12 shows the XY diagram of the seat belt cover locking force analysis. The maximum die locking force was 36.2 tons, and the clamping force required for the filling and pressure-retaining parts was less than the maximum machine clamp force currently selected.
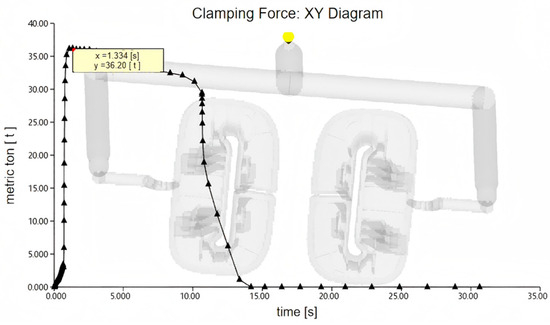
Figure 12.
Analysis of seat belt cover die-locking force.
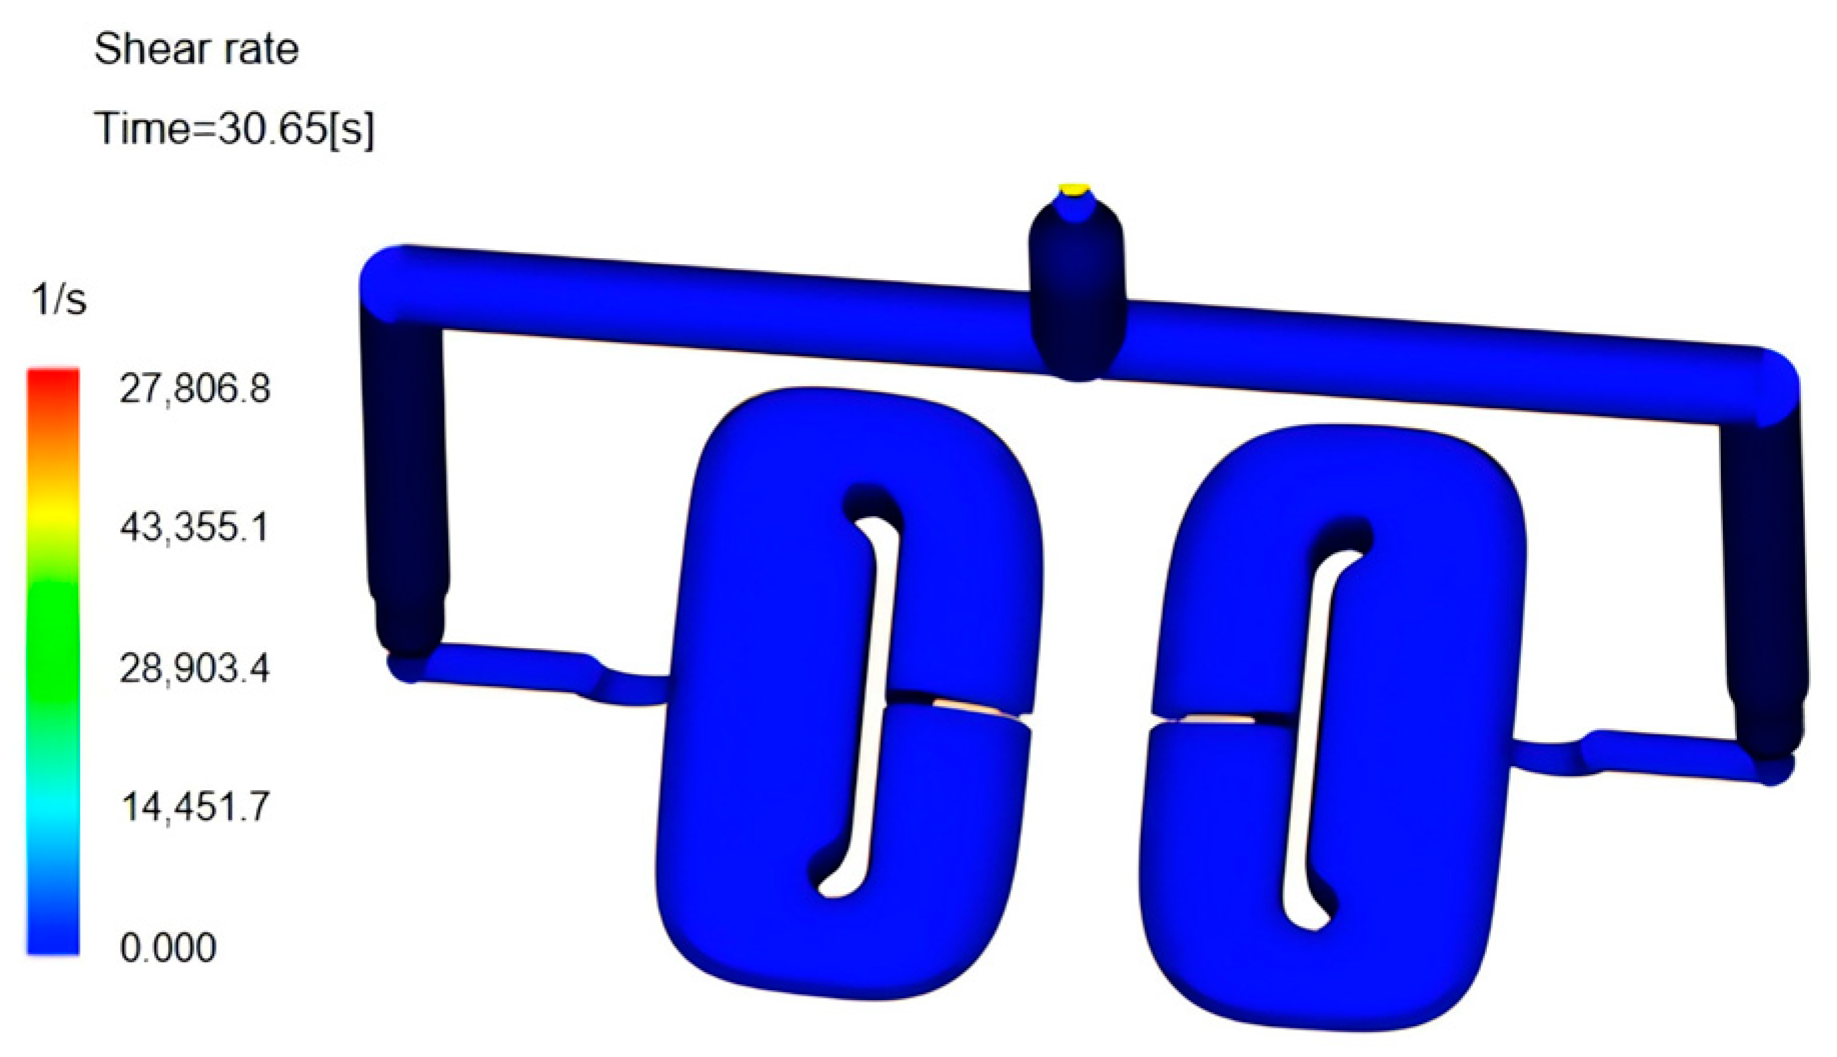
4.1.6. Shear Rate
The shear rate is important in the mechanics of materials, and describes the deformation velocity of a material subjected to a shear force. Specifically, the shear rate refers to the velocity of the material shear deformation per unit time, usually expressed in units of /s or /min. Shear rate is a key parameter in material processing, plastic molding, geological disaster prediction, and material rupture analysis. The simulation results of the shear rate are shown in Figure 13. The maximum shear rate was 57,806.8 per second and the material allowable limit was 60,000 per second. The maximum shear rate did not exceed the allowable limit of the material.

Figure 13.
Results of cut rate.
4.1.7. Shear Stress on Wall
Shear stress on a wall is a force tangential to the surface of an object (especially the wall in contact with a fluid), and is usually called the shear force. Figure 14 presents the simulation diagram of shear stress on the wall. The maximum shear stress was 1.074 MPa, and the allowable limit of the material was 0.5 MPa. The maximum shear stress exceeded the allowable limit of the material, and the maximum shear stress occurred near the gate.
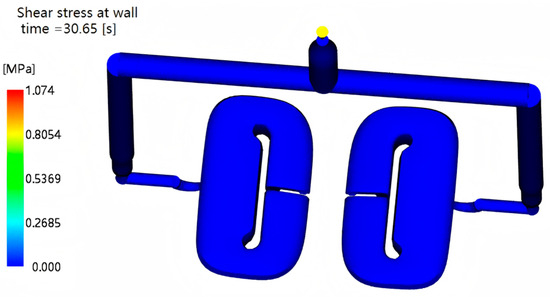
Figure 14.
Shear stress on wall.
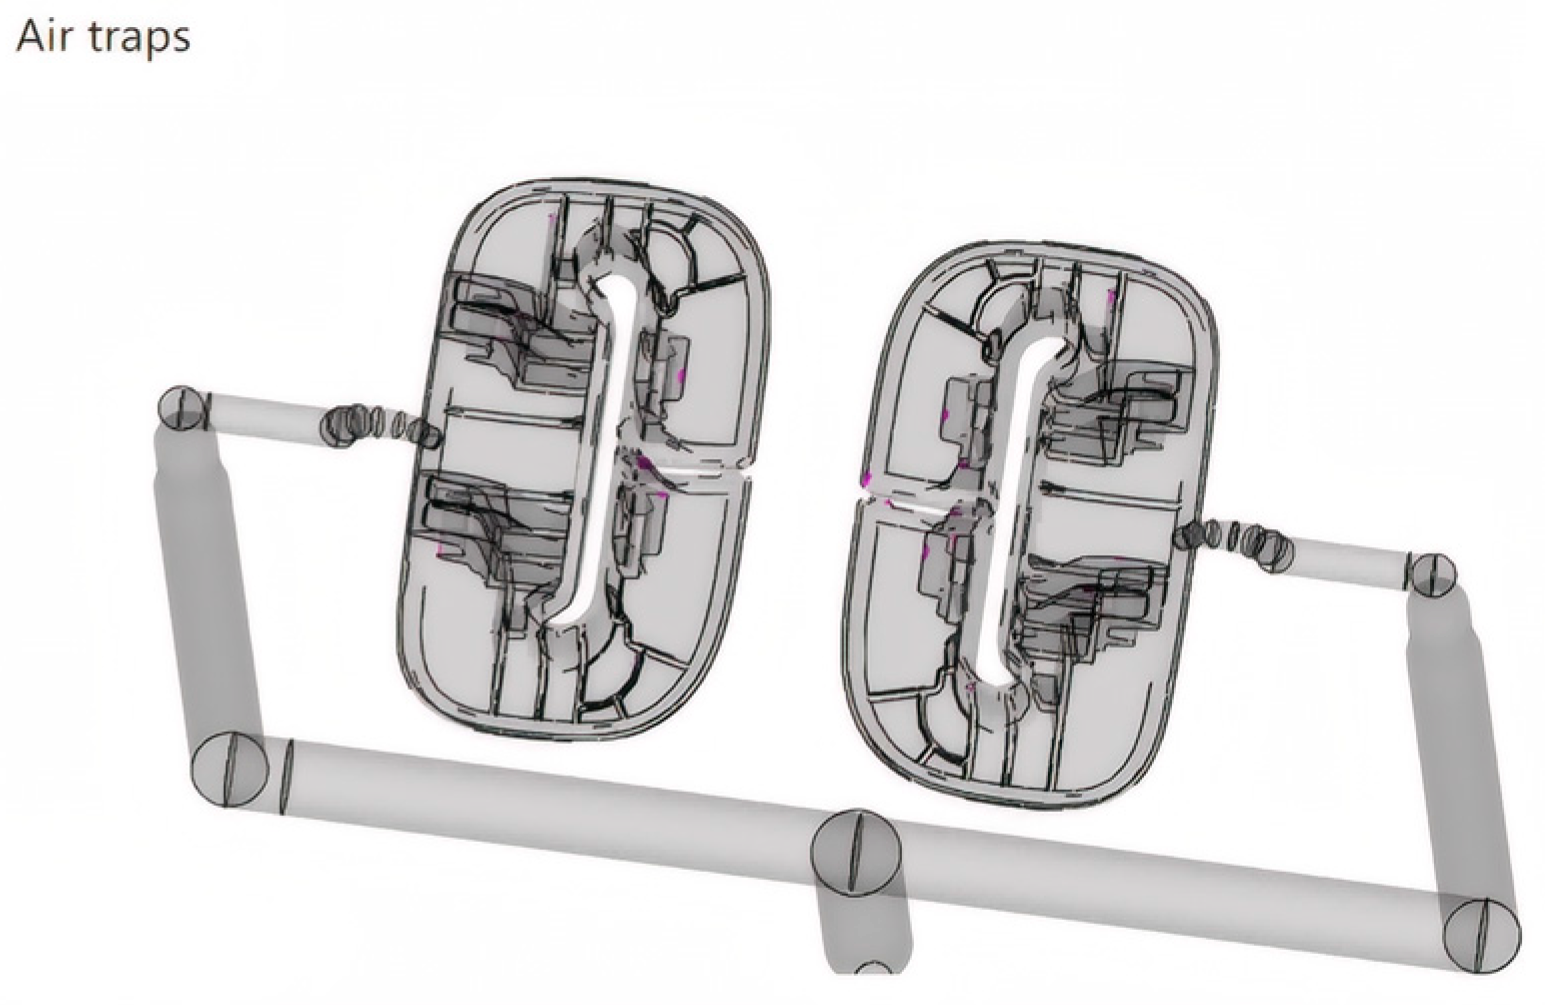
4.1.8. Air Cavity
In mold flow analysis, the formation of an air hole (cavitation) is an important phenomenon. It refers to the fluid in the mold (such as plastic melt) flow process. In some areas, pressure drops sharply; therefore, the gas in the fluid (which may be dissolved or exist as tiny bubbles) rapidly expands and precipitates, forming bubbles or holes. The production of air cavities affects product quality, production efficiency, and equipment safety. Figure 15 shows the analysis results. The area highlighted in pink in the figure is where air is trapped.
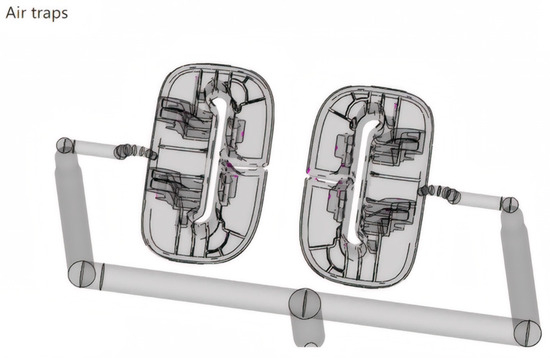
Figure 15.
Results of air hole analysis.
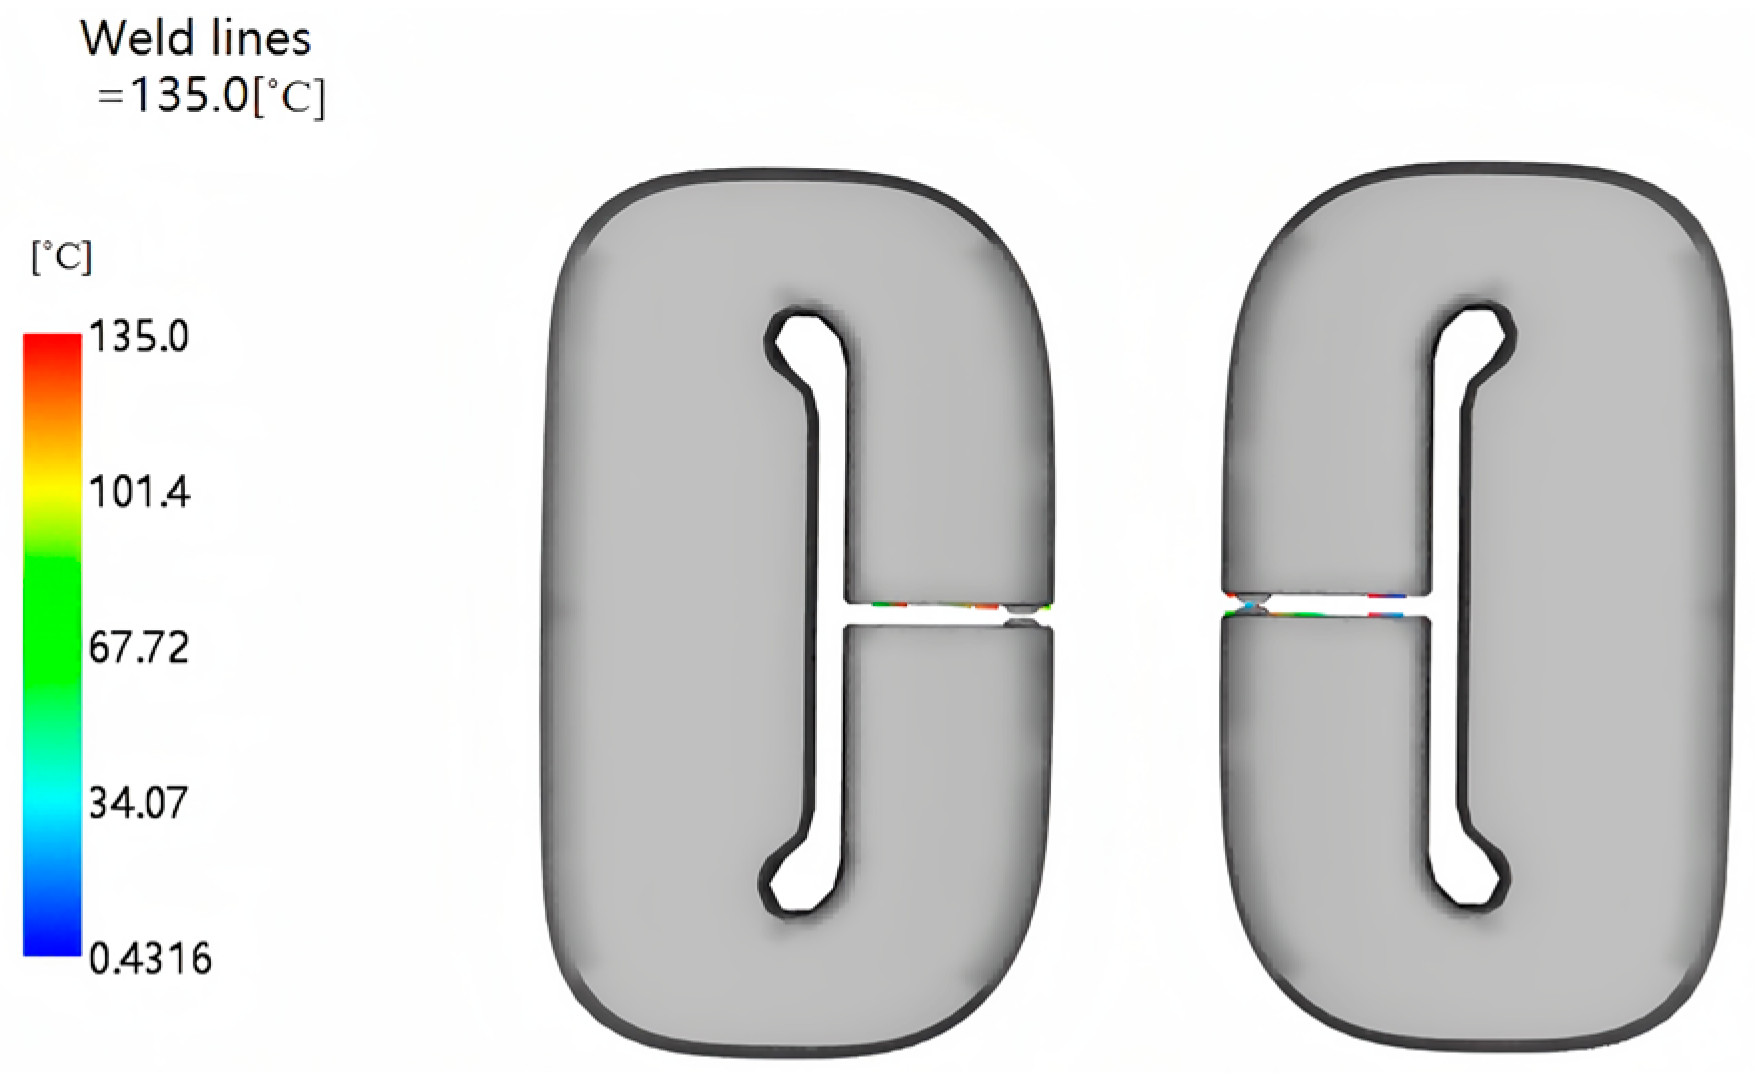
4.1.9. Fusion and Connection Marks
In the injection molding process, defects such as warping, fusion marks, and shrinkage marks are difficult to avoid. To improve product quality, the manufacturers usually adjust the molding process parameters such as temperature, pressure, or time. To find the best combination of process parameters, these defects must be removed [5]. When increasing the pressure, the mold temperature increases, helping the melted plastic to flow smoothly [6]. Fusion marks are formed mainly due to multiple temperatures of low plastic melt in the front that meet and confluence. When the temperature of the striker is low, the fusion between them is hindered. When the molten plastic in the cavity encounters holes, the flow area is incoherent, and the mold flow interruption area, in the form of multiple joints, cannot fuse the joint. This causes black, gray, or transparent effects to be obvious, and fusion marks, according to the two different close angles, make cold fusion and hot melt marks. The two marks are different in appearance and in the strength of the plastic parts. Figure 16 shows a diagram of the fusion mark results. The temperature difference of the appearance area was 10 °C, and the welding line showed that the convergence angle when the two flow surfaces met was 135°.
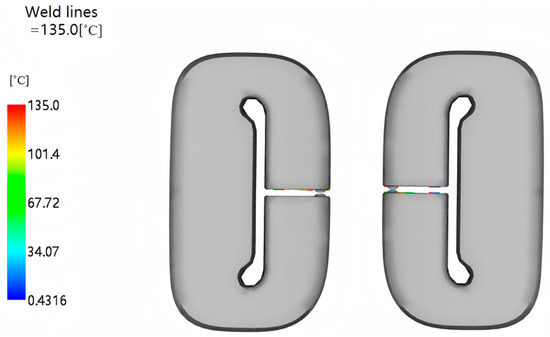
Figure 16.
Results of fusion mark analysis.
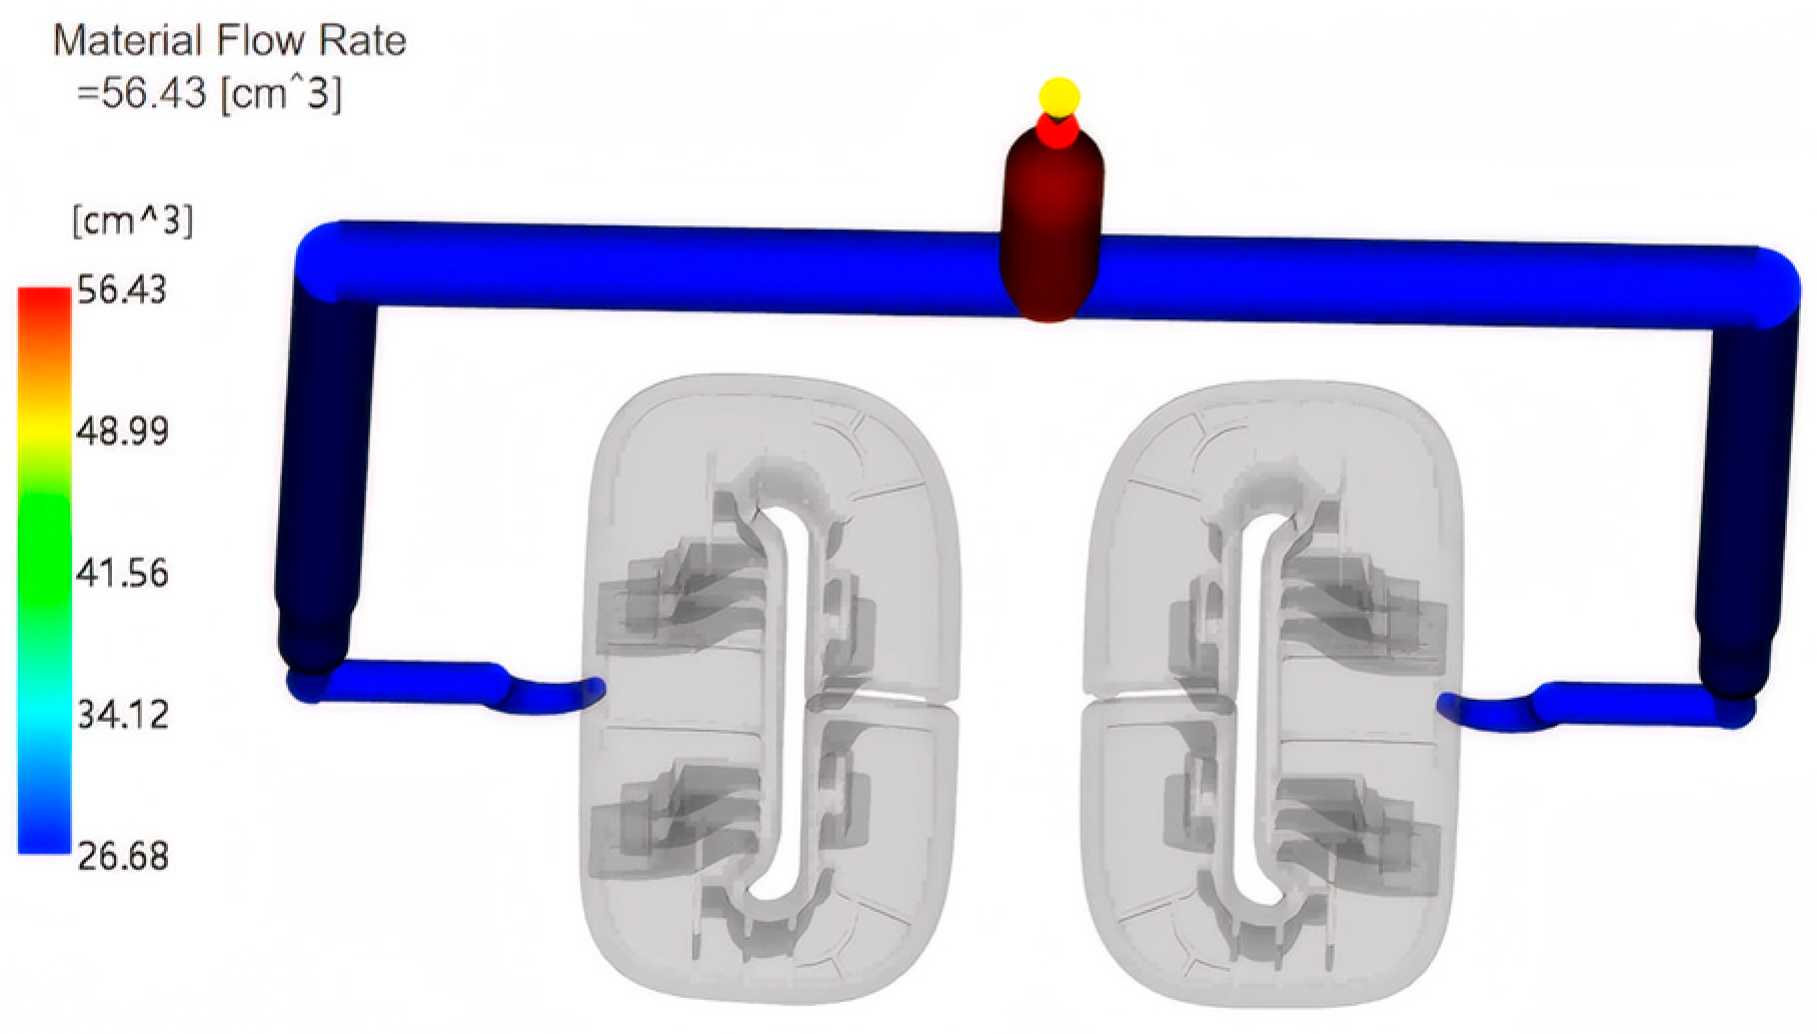
4.1.10. Material Flow Rate
Material flow rate refers to the amount of material through a system or equipment within a unit of time. It is expressed by different units of measurement, such as m3/hour, liter/minute, or ton/hour. The size of the material flow rate has a direct impact on the stability of the production process and the product quality. Figure 17 shows that the total volume of material was 56.43 cm3 for each of the flow systems connected to the injection node.
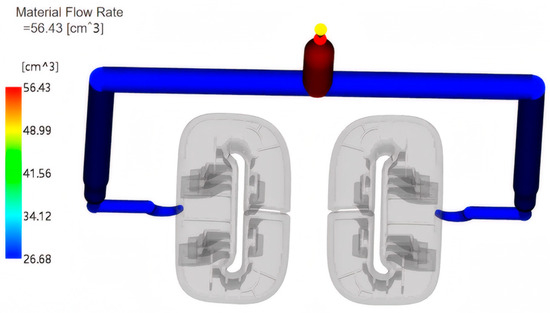
Figure 17.
Material flow rate analysis diagram.
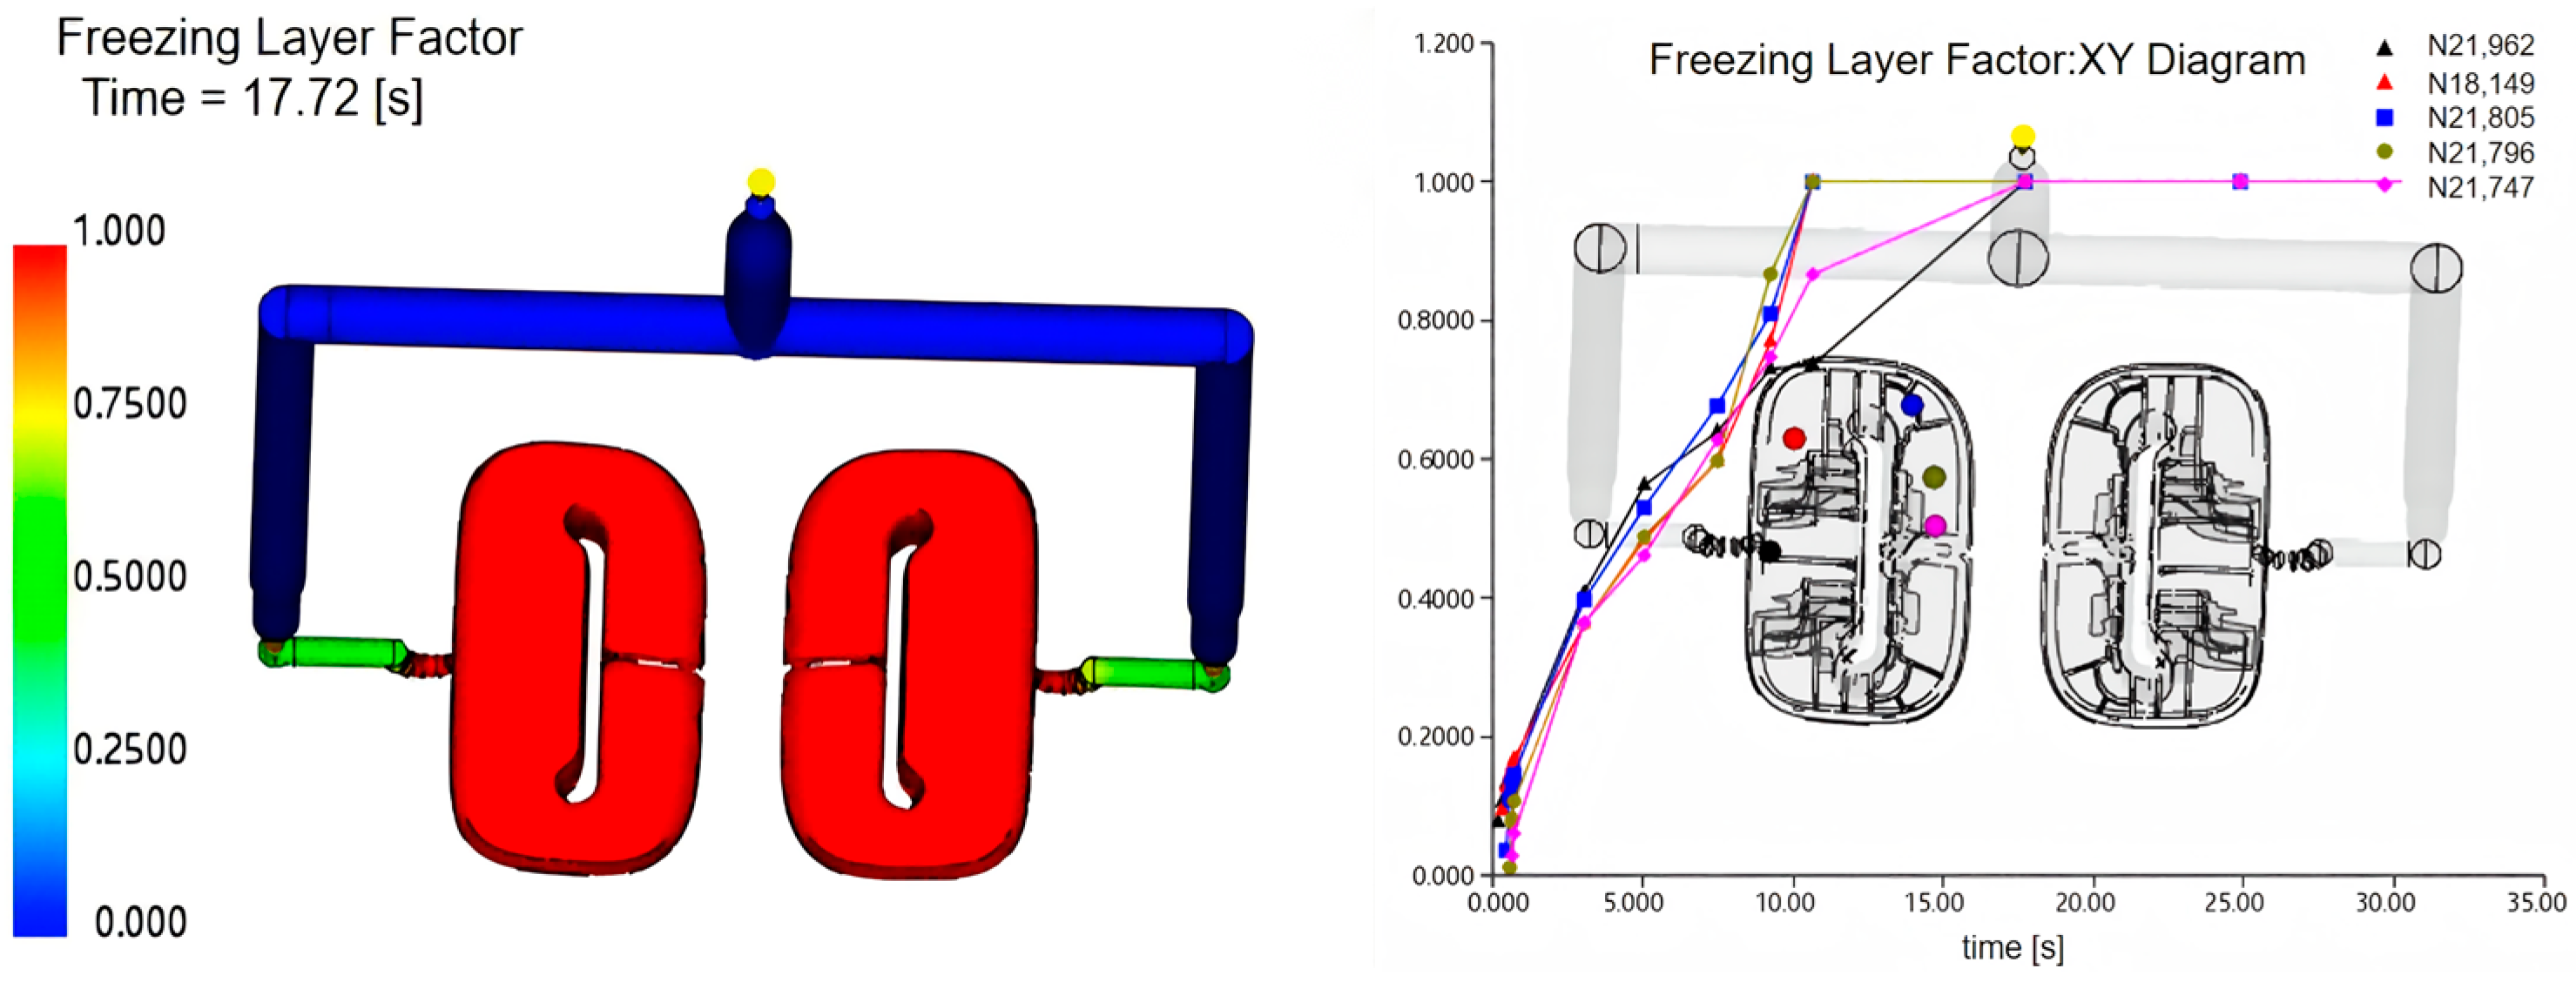
4.1.11. Freezing-Layer Factor
The freezing-layer factor refers to the percentage of the thickness of the frozen layer to the total thickness of the product formed when the polymer melt is cooled below the glass transition temperature in the process of injection molding. The freezing-layer factor is an important indicator in determining the pressure preservation and cooling parameters during injection molding. By monitoring the variation in the freezing-layer factor, the pressure preservation curve and the cooling time can be optimized to ensure the quality and dimensional stability of the product. An increase in the freezing-layer thickness significantly increases the flow resistance. Therefore, the freezing- layer factor is used to evaluate the change in the flow resistance during the injection molding process, and then guide the mold design and the adjustment of process parameters. Figure 18 presents a diagram of the analysis of the freezing-layer factor; the freezing time was 17 s.

Figure 18.
Frozen layer factor analysis results diagram.
4.2. Cooling
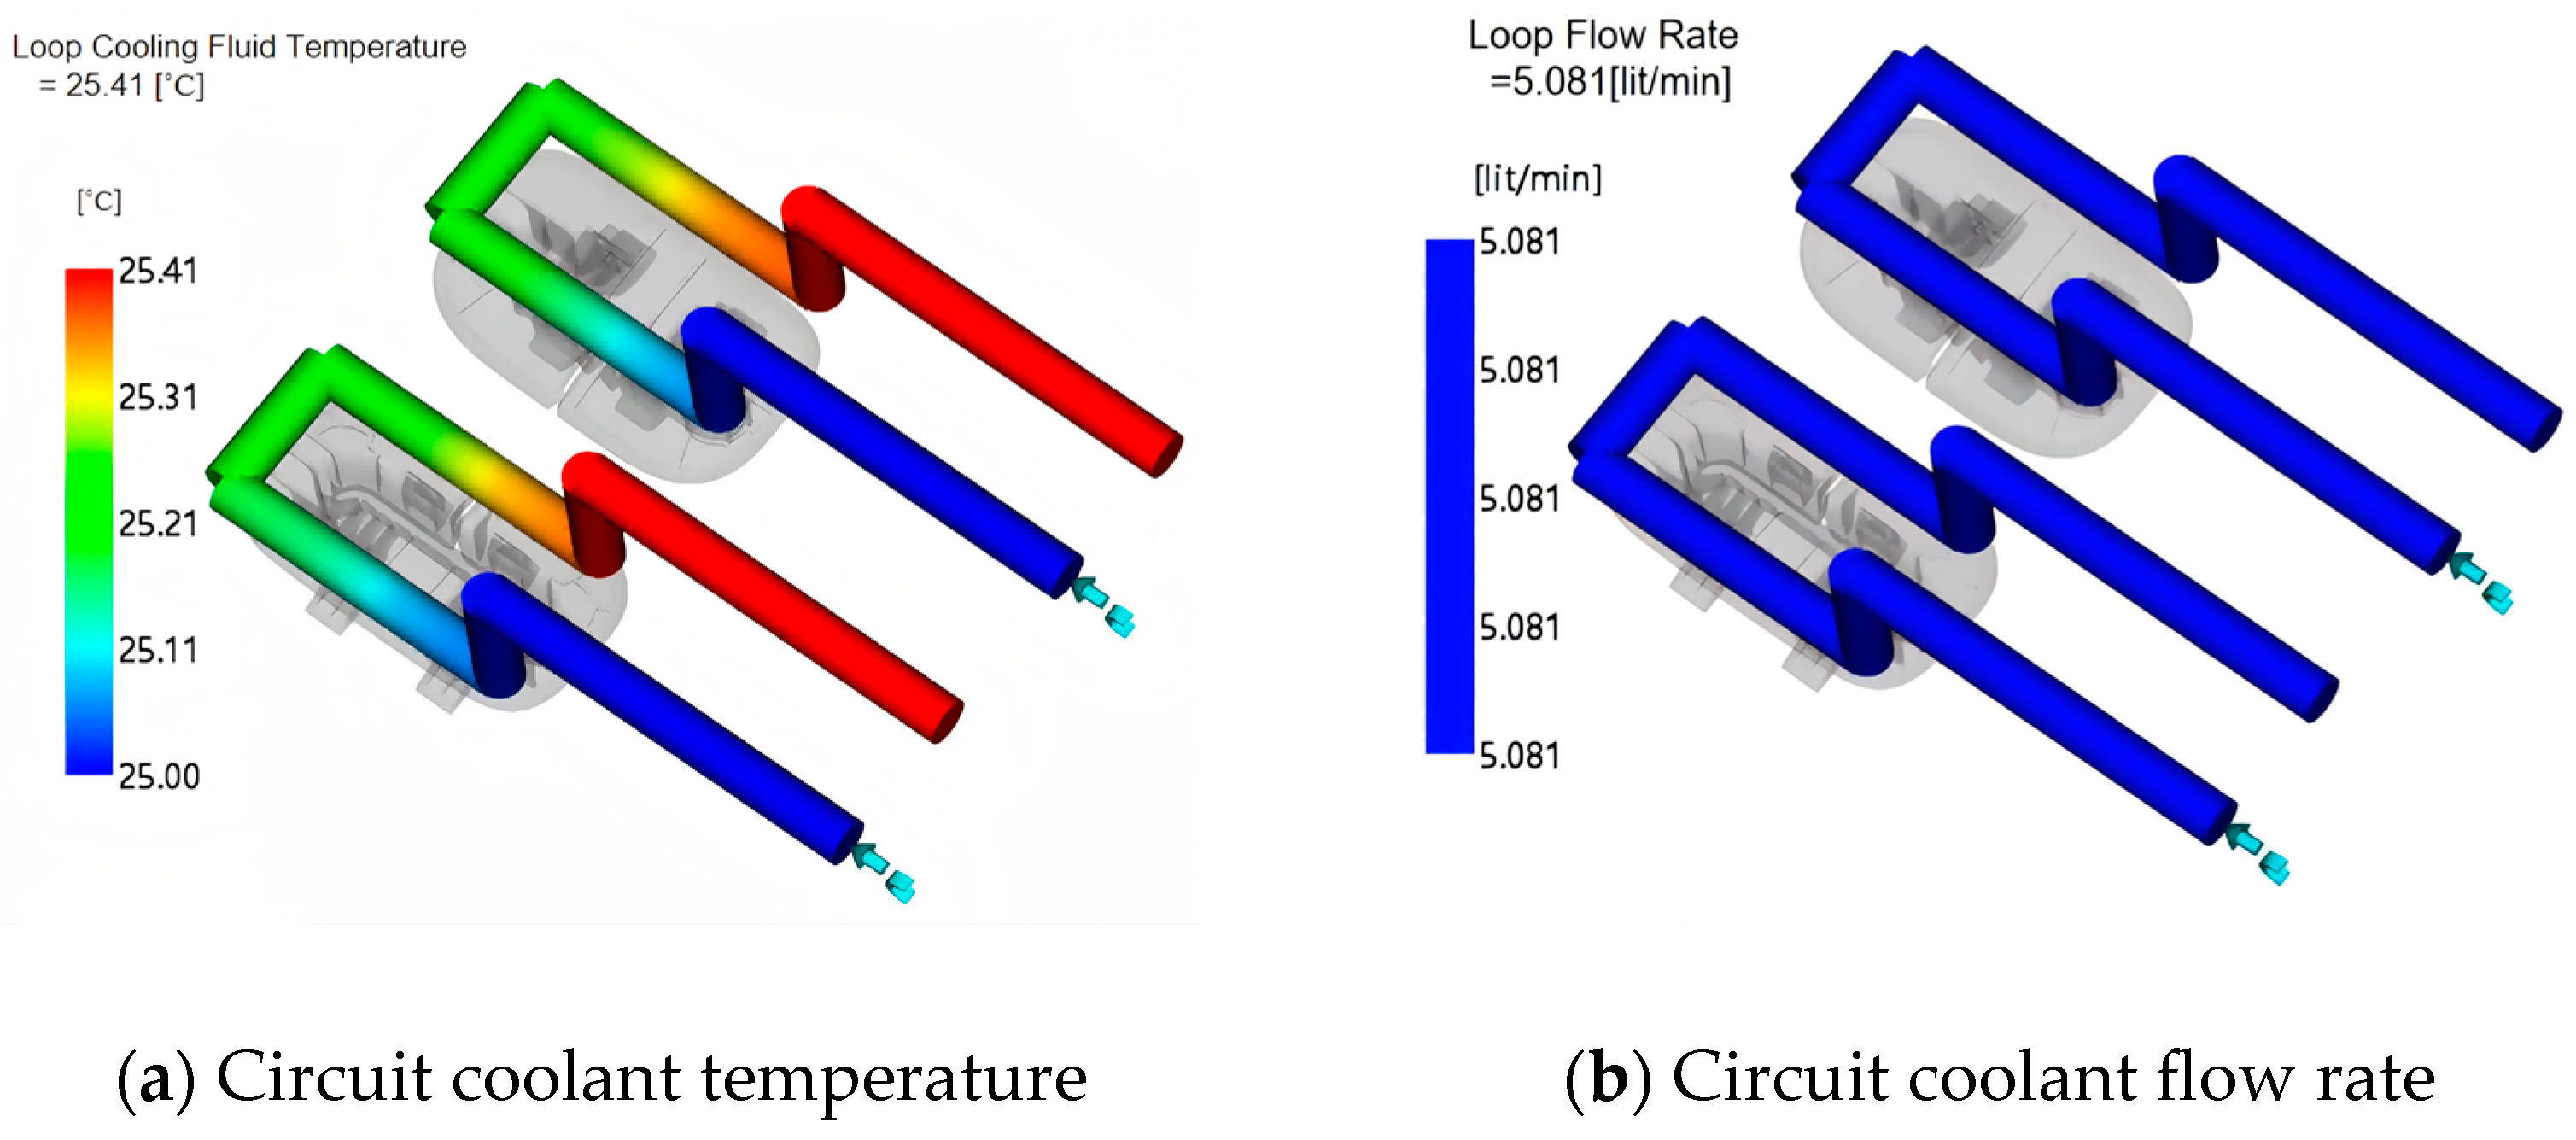
4.2.1. Coolant Temperature and Flow Rate
The coolant temperature is the temperature of the water or other cooling medium flowing through the cooling pipe. Coolant flow is the volume of coolant passing through the cooling system per unit time. The size of the flow directly affects the heat dissipation capacity of the cooling system. There is a close relationship between the coolant temperature and the flow rate. In the cooling system, the coolant adjusts the temperature of the device by absorbing and taking away the heat. When the heat generated by the device increases, the temperature of the coolant rises, and the flow of the coolant is increased to remove more heat to keep the device temperature within a reasonable range. On the contrary, when the heat generated by the equipment is reduced, the flow rate of the coolant is appropriately reduced to save energy. The temperature and flow rate of the coolant are the two crucial parameters in the cooling system. They are interrelated and influence each other, jointly determining the heat dissipation effect of the cooling system and the performance of the equipment. Figure 19 and Figure 20 present the loop coolant temperature and the loop coolant flow rate at the cavity and core, respectively.

Figure 19.
Circuit coolant temperature and flow rate of loop coolant during the cavity.

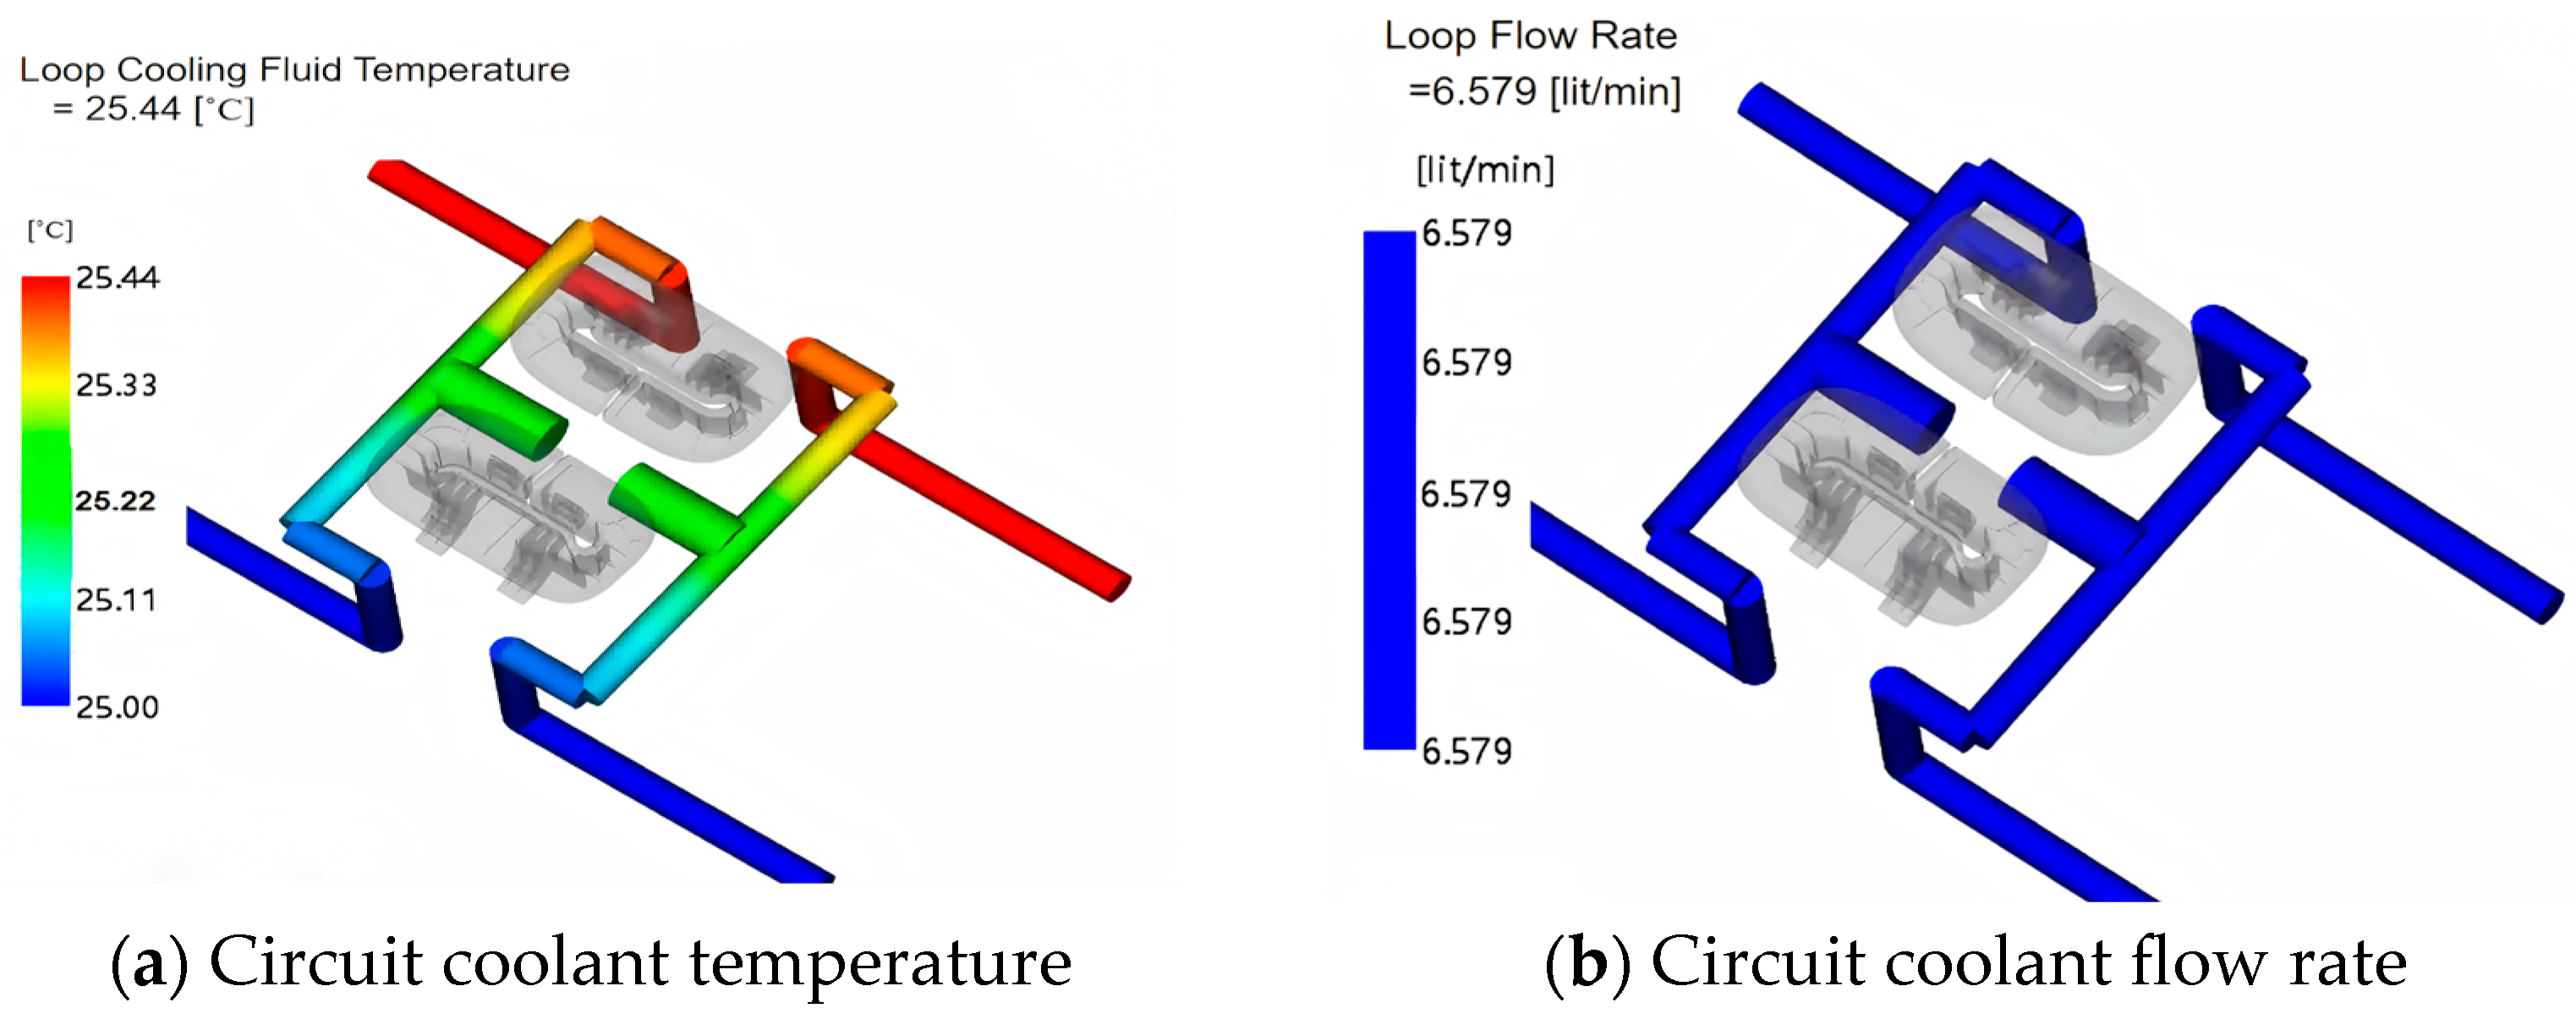
Figure 20.
Circuit coolant temperature and flow rate of loop coolant during core.
In the case of water as the medium, the coolant flow rate was 5.081 L/min, the coolant temperature was between 25.00 and 25.41 °C, and the inlet and outlet temperature difference was 0.41 °C. In the core, the coolant flow rate was 6.579 L/min, the coolant temperature was between 25.00 and 25.44 °C, and the inlet and outlet temperature difference was 0.44 °C, which was slightly higher than that of the cavity.
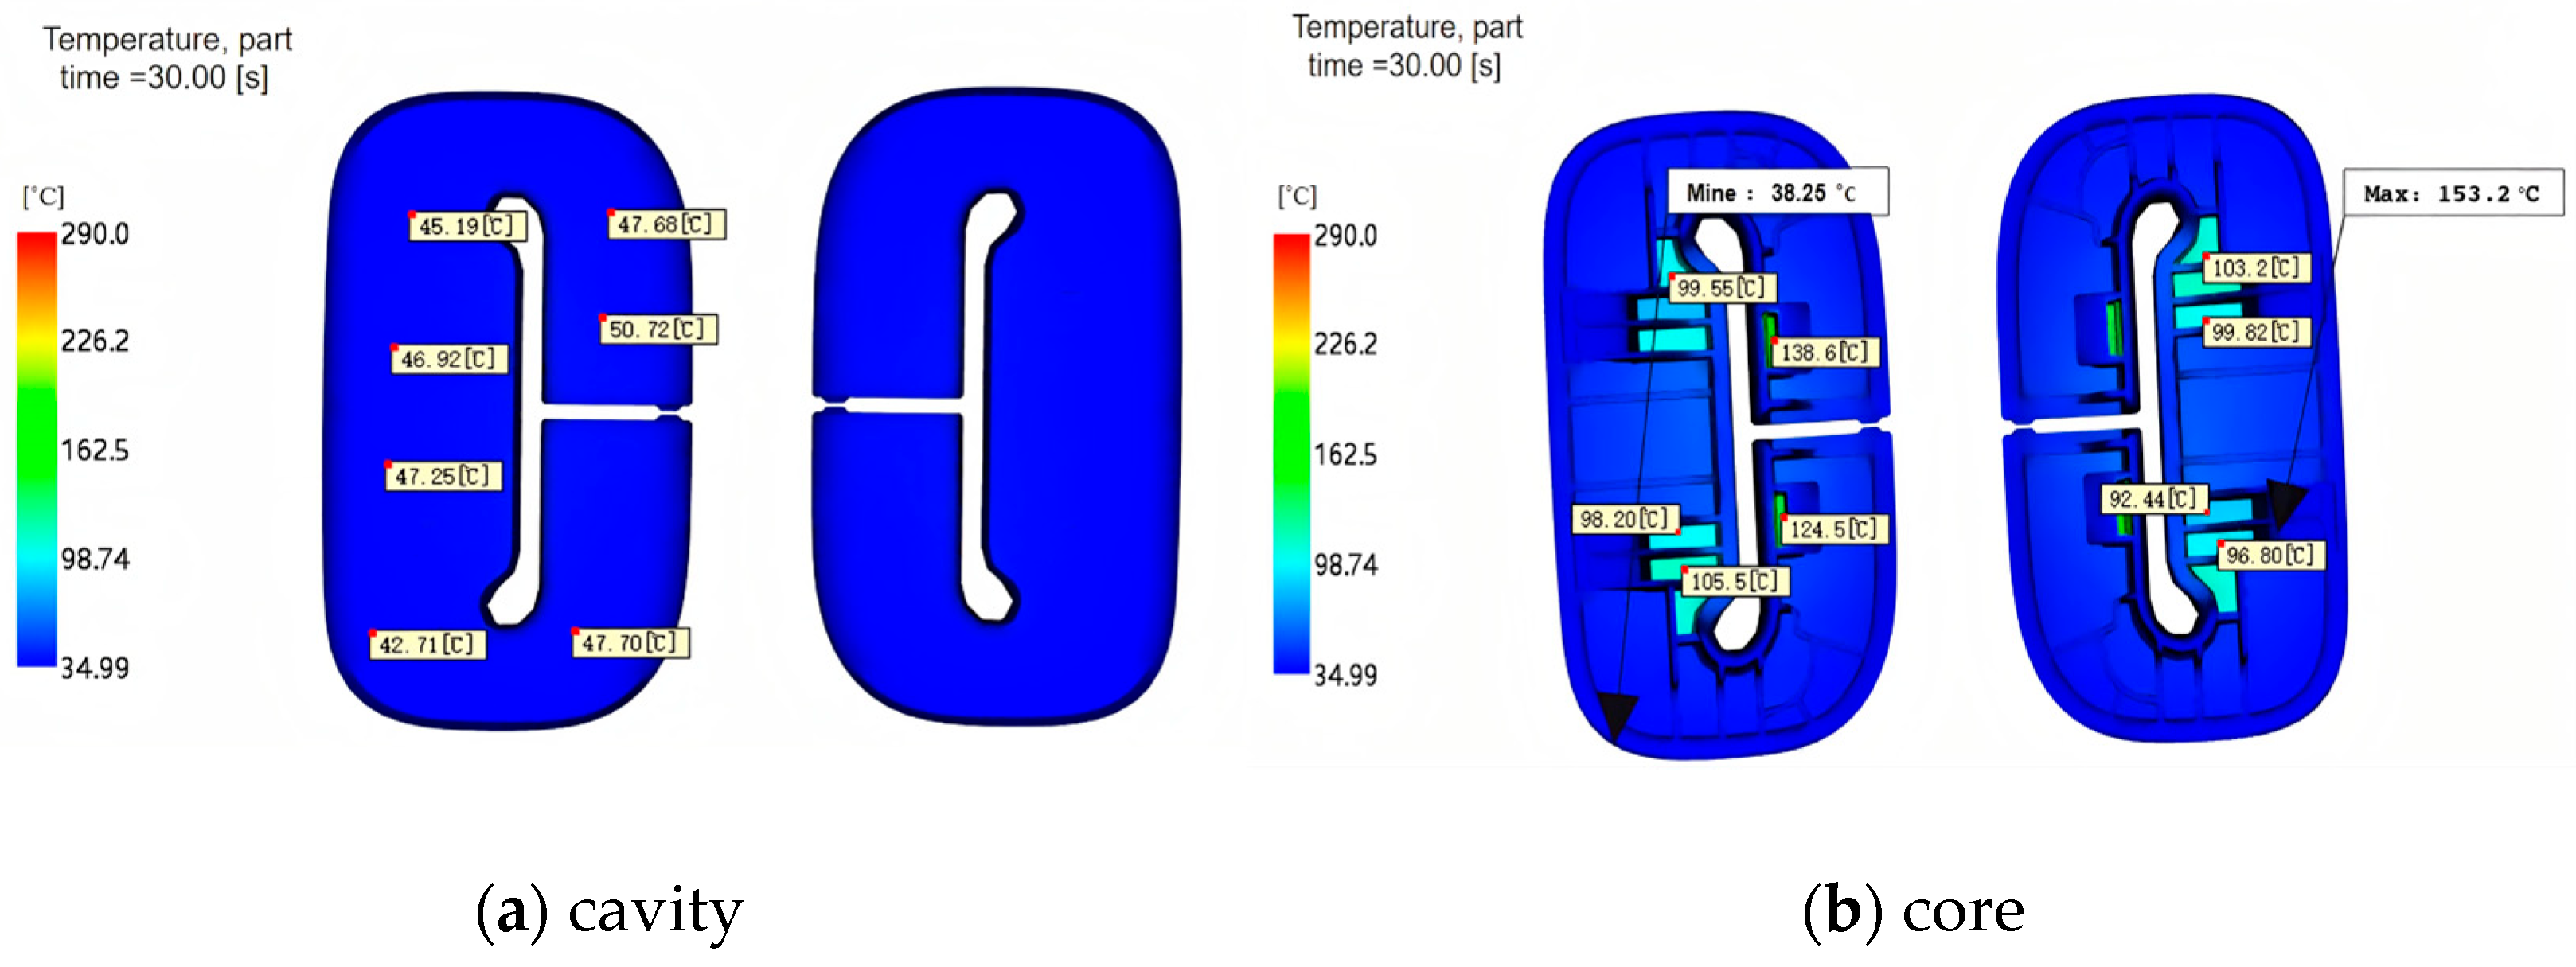
4.2.2. Part Temperature
Part temperature refers to the temperature of the part formed after the plastic melt is cooled and solidified in the mold during the injection molding process. The temperature of the parts reflects the cooling speed of the plastic melt in the mold and directly affects the dimensional accuracy, surface quality, internal structure, and performance of the parts. Figure 21 shows the part temperature at the cavity and core. The temperature of the parts was evenly distributed on the cavity side, and the temperature of the parts was evenly distributed on the core side of the core.

Figure 21.
Part temperature.
4.2.3. Mold Temperature Difference
Mold temperature difference refers to the temperature difference at different positions on the surface or inside of the mold. The mold temperature difference directly affects the quality, dimensional accuracy, and so on. Figure 22 shows that the temperature difference between the cavity and the core side was small.
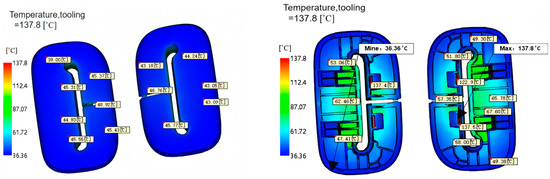
Figure 22.
Die temperature difference.
4.3. Deflection
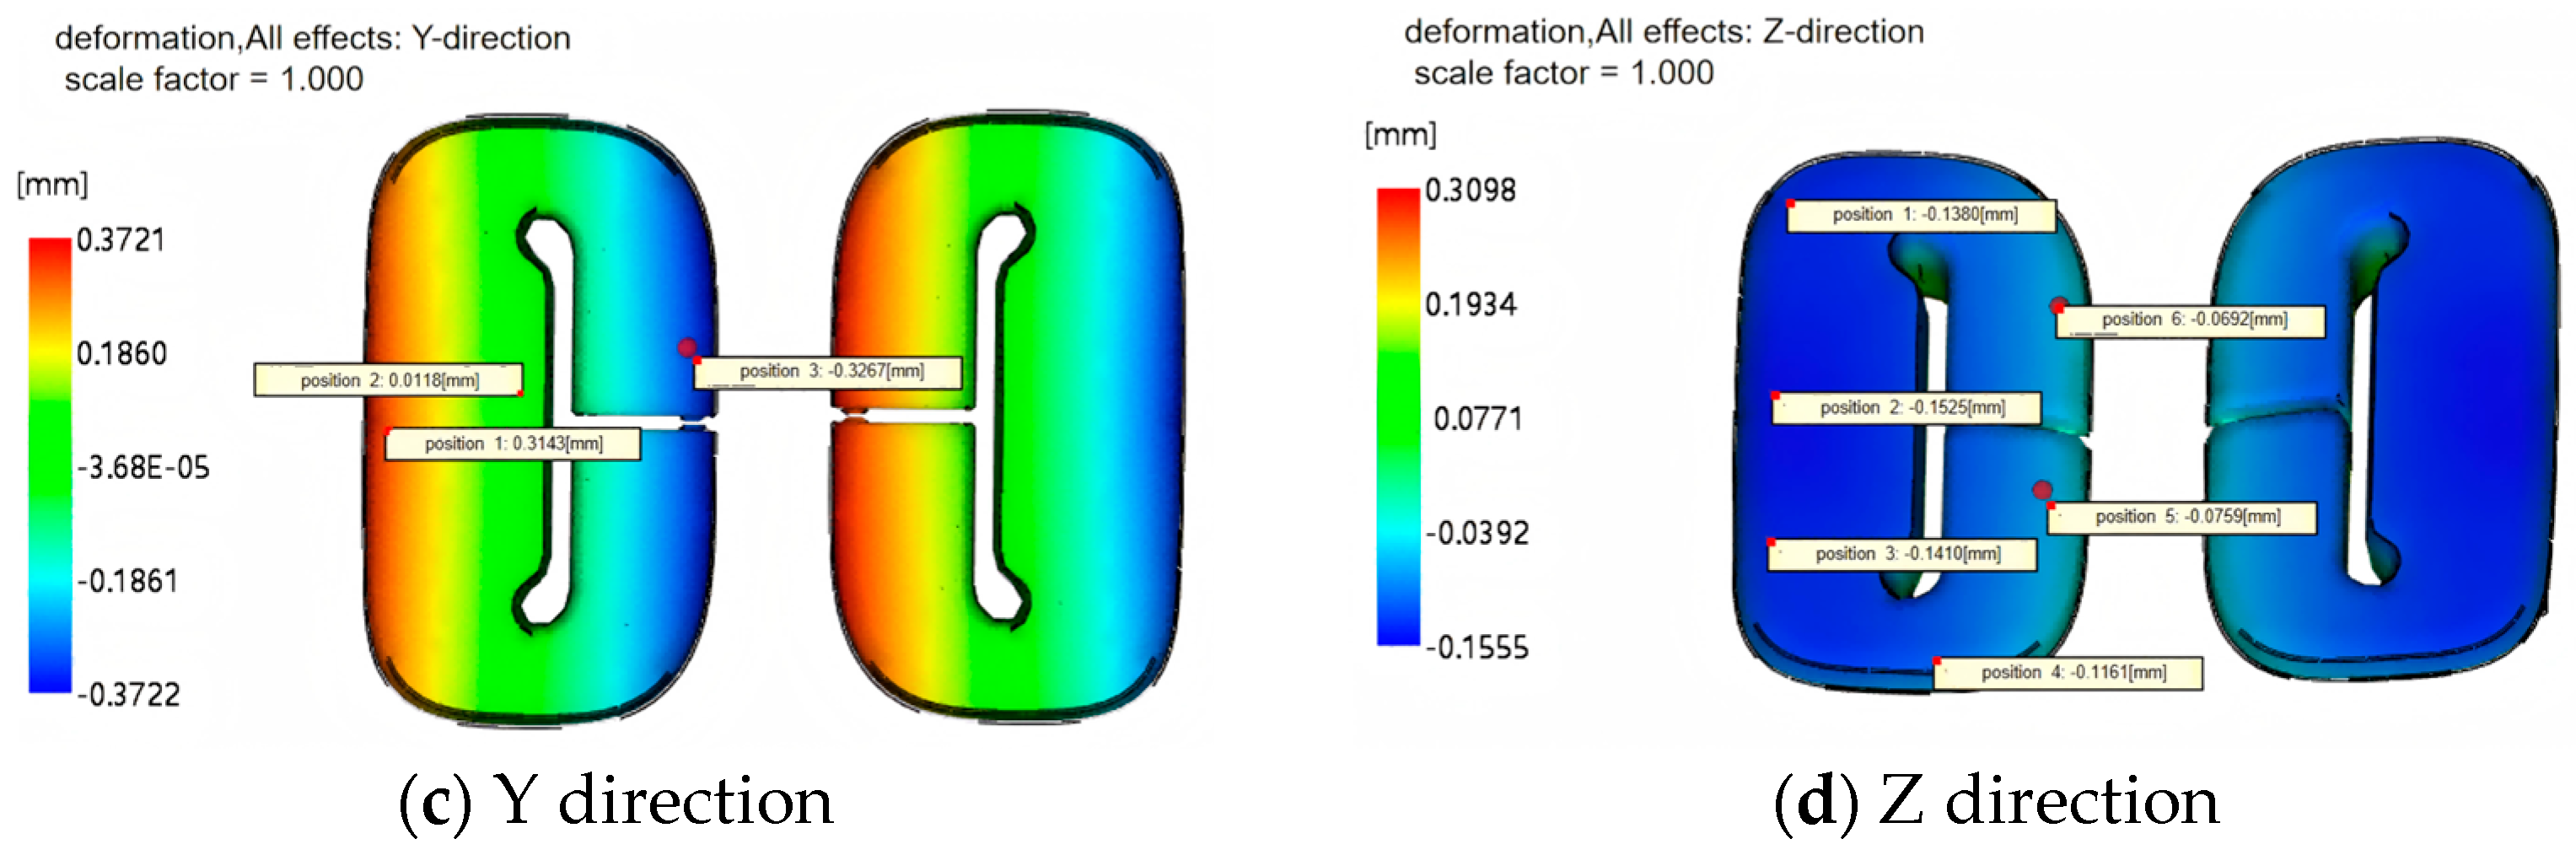
4.3.1. Analysis of Warping Deformation
Warping deformation is one of the common defects in the production of injection parts. Figure 23 shows the amount of deformation in the X, Y, and Z directions. The maximum deformation in the X direction was 0.6296–0.6297 mm, and it was 0.3722–0.3721 and 0.1555–0.3098 mm in the Y and Z directions, respectively. The total deflection angle was 0–0.6473 mm.
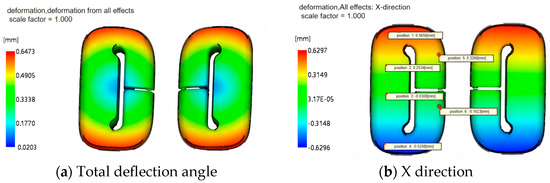

Figure 23.
Analysis of warping deformation.
4.3.2. Differential Action Cooling
Differential cooling refers to the uneven cooling phenomenon caused by the temperature difference in the mold or between different parts. As shown in Figure 24, the maximum deformation was 0–0.0003 mm.
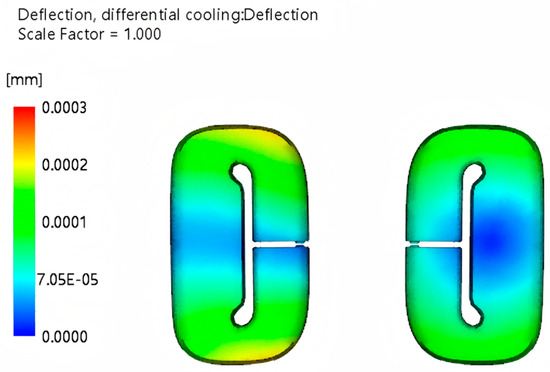
Figure 24.
Total deflection of differential cooling.
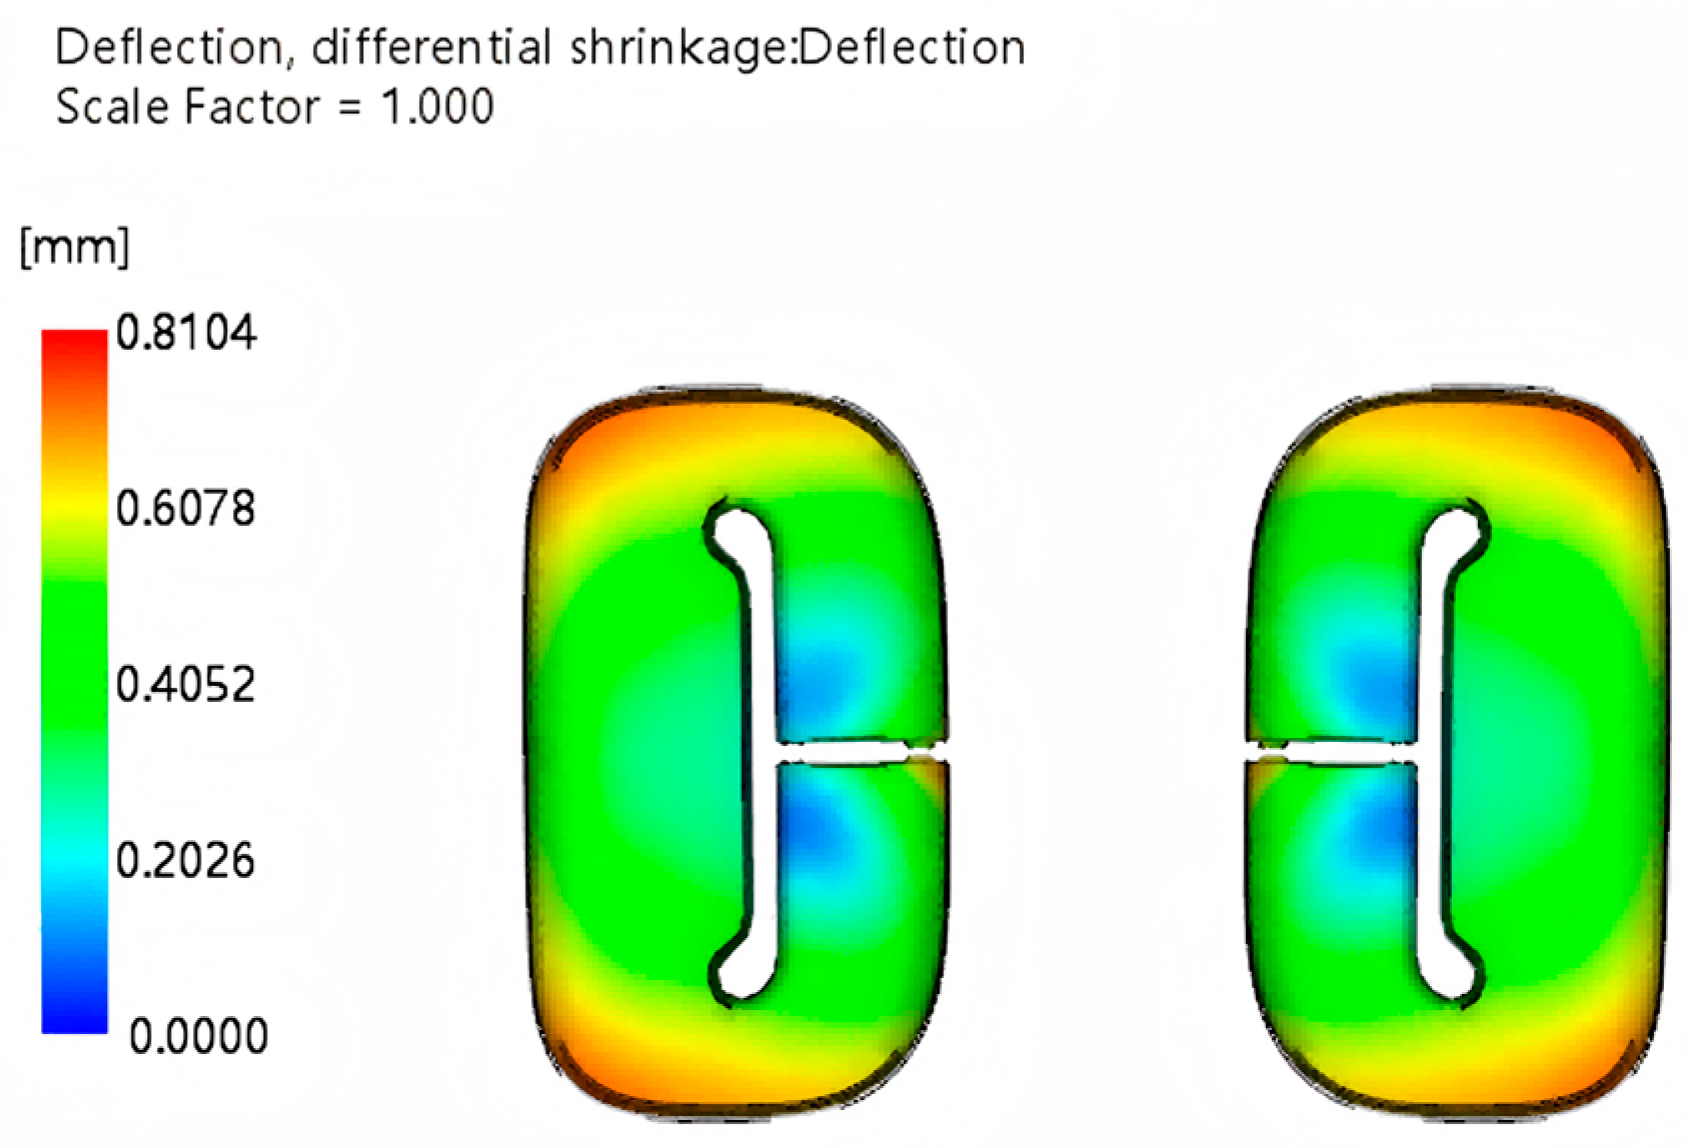
4.3.3. Differential Shrinkage
Differential contraction refers to the process of material cooling or curing. Due to the uneven temperature distribution within the material, molecular structure, density, and orientation, the external conditions and the shrinkage rate of each part of the material were inconsistent, resulting in uneven shrinkage. As shown in Figure 25, the maximum deformation was 0–0.8104 mm.

Figure 25.
Differential shrinkage deviation analysis.
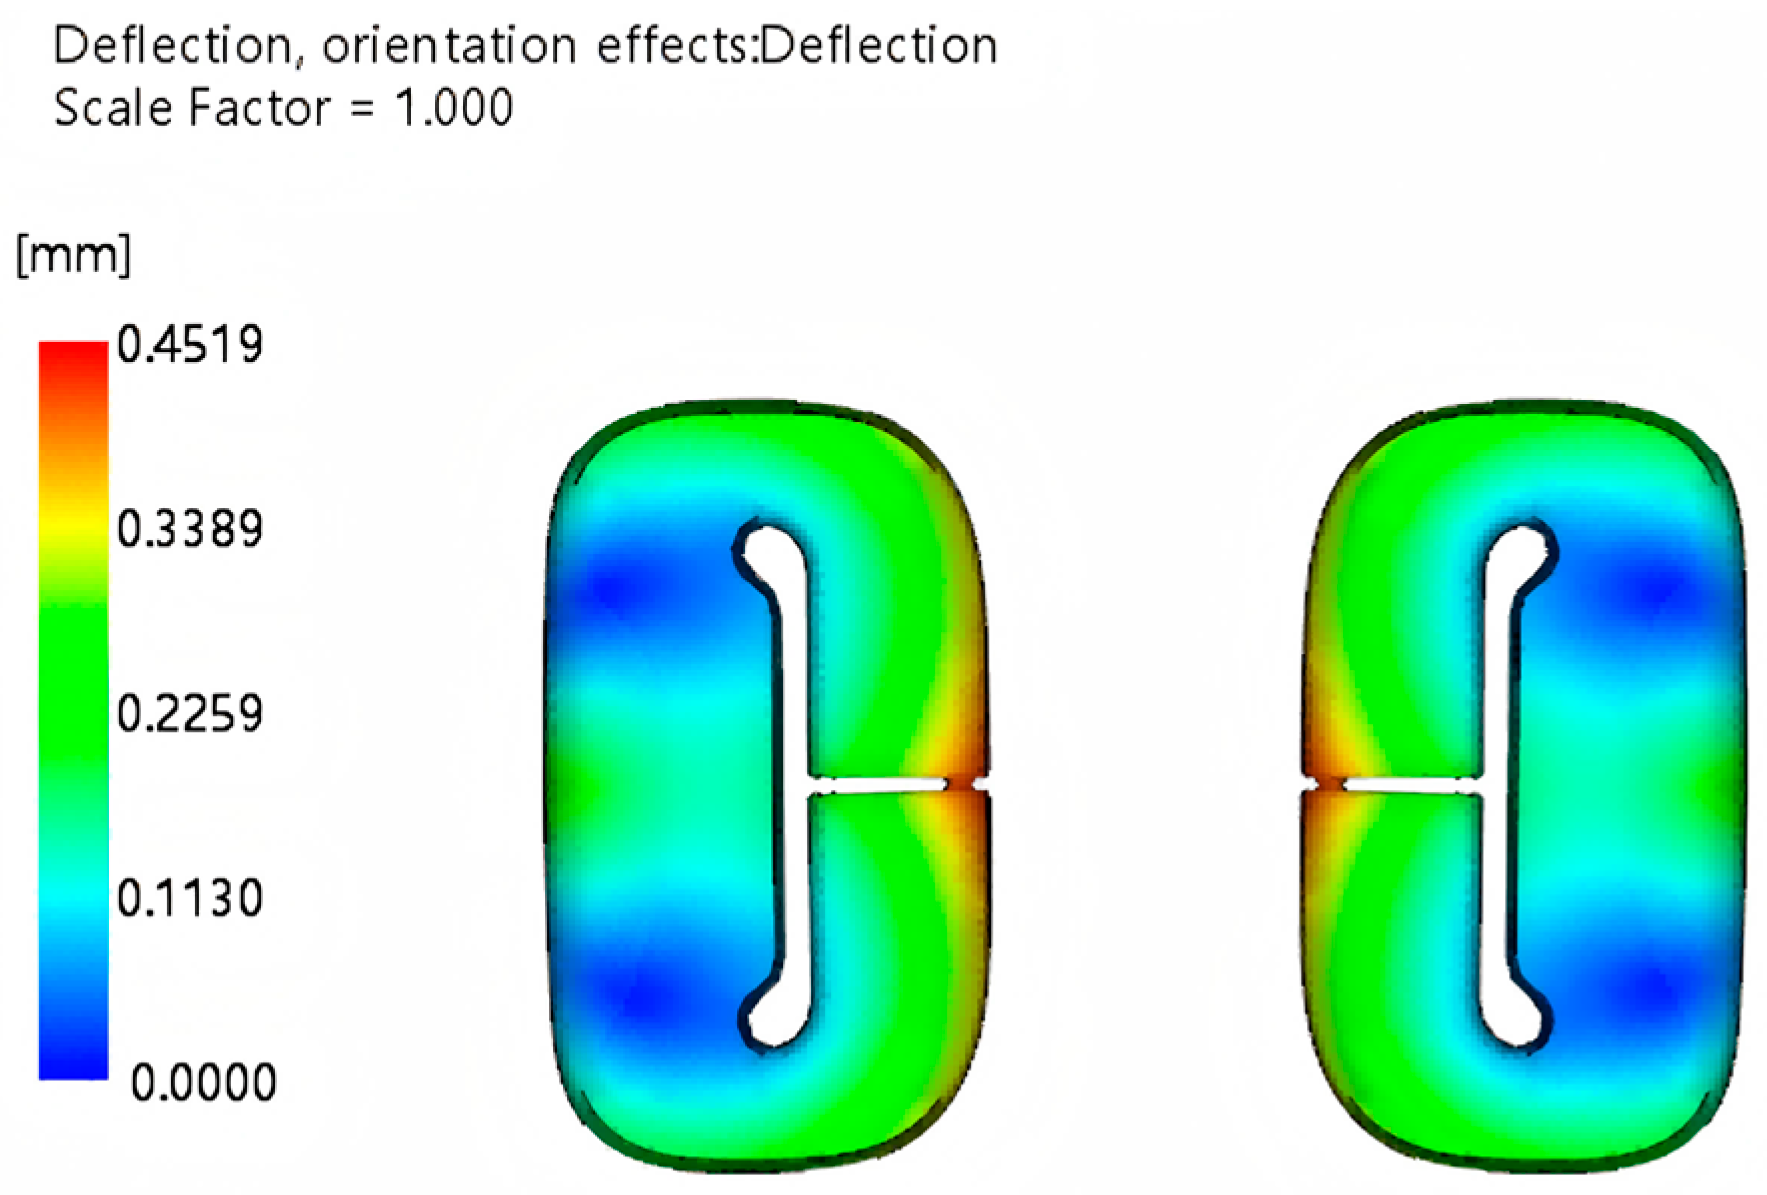
4.3.4. Directional Effect
The orientation effect refers to the effect of the material during processing due to the directional arrangement of molecules or fibers. As shown in Figure 26, the maximum deformation was 0–0.4519 mm.

Figure 26.
Analysis of bias of directional effects.
5. Conclusions
Using the mold flow analysis of the spare parts, we found that the filling time was 0.0143 and 0.7172 s. The temperature difference in the flow front was 16.5 °C, the instantaneous pressure distribution at the V/P switching point was 48.48 MPa, the injection position pressure was 39 MPa, the maximum die-locking force was 36.2 tons, the maximum shear rate was 57,806.8 per second, the maximum shear stress was 1.074 MPa, the total volume of material for each flow system directly connected to the injected node was 56.43 cm3, the parts had a freeze time of 17 s, and the injection volume shrinkage rate was 18.87%. During the cooling phase, the coolant flow rate was 5.081 L/min, the coolant temperature ranged between 25.00 and 25.41 °C, and the temperature difference between import and export was 0.41 °C. At the core-stacking time, the coolant flow rate was 6.579 L/min, the coolant temperature was between 25.00 and 25.44 °C, and the temperature difference between import and export was 0.44 °C. In the warping deformation analysis at the deflection phase, the maximum deformation in the X direction was −0.6296–0.6297 mm, the maximum deformation in the Y direction was −0.3722–0.3721 mm, the maximum deformation in the Z direction was −0.1555–0.3098 mm, the maximum deformation of the total deflection angle was 0–0.6473 mm, the maximum deformation amount was between the 0 and 0.0003 mm, and the differential contraction was most pronounced as 0–0.8104 mm.
Author Contributions
Conceptualization, H.J. and Y.Y.; methodology, Y.L.; software, H.J.; validation, H.J., Y.Y. and C.S.; formal analysis, Y.L.; investigation, H.J.; resources, Y.Y.; data curation, Y.L.; writing—original draft preparation, C.S.; writing—review and editing, C.S.; visualization, J.Y.; supervision, Y.Y.; project administration, Y.Y.; funding acquisition, H.J. All authors have read and agreed to the published version of the manuscript.
Funding
This research and development of an automatic assembly device for a buckle rim on rotating shaft of a certain type of radiator was funded by Chongqing Municipal Education Commission Science and Technology Research Project (KJQN202203701). The research was also supported by the Science and Technology Research Project of Chongqing Municipal Education Commission (KJQN202303705), which is used for the research and application of military and civilian small rotary vane engines.
Institutional Review Board Statement
This statement is formally issued by Chongqing University of Mechanical and Electrical Technology. The Review Committee has conducted a comprehensive review of the aforementioned research project in accordance with relevant laws, regulations, research ethics guidelines, and the institution’s policies and procedures. The review covered the scientific validity, feasibility, and anticipated contributions of the research design, assessed potential risks and benefits to participants, ensured the effectiveness of informed consent procedures, privacy protection measures, and data confidentiality protocols, while confirming participants’ rights to voluntary participation and unconditional withdrawal. Key documents including the research protocol, informed consent form, and recruitment materials were also reviewed.
Informed Consent Statement
We hereby confirm that the submitted paper is an original work, having not been published in any other publications or platforms (including but not limited to journals, conference proceedings, online blogs, social media, etc.), nor has it been simultaneously submitted to any other journals or conferences. The content of the paper does not involve any plagiarism or unauthorized use of others’ achievements, and all cited data and viewpoints have been properly credited with their sources.
Data Availability Statement
The data that support the findings of this study are available from third party. Restrictions apply to the availability of these data, which were used under license for this study.
Acknowledgments
I would like to express my deep gratitude to the Chongqing Education Commission for its generous funding. This financial support was an important guarantee for the implementation of this study, and it provided an experimental platform and resources, which laid a solid foundation for the smooth progress of the study. I also express my sincere thanks to the staff who helped us in the during literature search and in the revision of the paper. At the same time, I would like to express my deepest gratitude to my family and friends who have always supported and encouraged me. It is their understanding and company that enable me to move forward on the road of scientific research and to overcome many difficulties.
Conflicts of Interest
The authors declare no conflicts of interest.
References
- Li, D.; Li, B.; Xie, X.; She, C.; Zhao, T. How to Make a Safety Belt Outlet Cover. Chongqing Yanfeng Adient Automotive Components Systems Co., Ltd. Patent no. 17413868, 16 April 2019. Available online: https://www.xjishu.com/zhuanli/29/201821513707.html (accessed on 25 April 2024).
- Qin, Y.; Ning, J.; Wu, T.; Xie, J. Analysis of the Current Status of Car Seat Belt Research. Xinjiang Agric. Mech. 2022, 25–27. (In Chinese) [Google Scholar] [CrossRef]
- Zhou, L.; Tang, S.; Huang, T.; Gao, G. Study on the stability of V/P switching position control of injection molding machine. Mold Ind. 2022, 11, 15–21. (In Chinese) [Google Scholar]
- Poszwa, P.; Brzęk, P.; Gontarev, I. Influence of processing parameters on clamping force during injection molding process. In Advances in Manufacturing II. MANUFACTURING 2019; Springer: Cham, Switzerland, 2019; pp. 287–299. [Google Scholar] [CrossRef]
- Shan, Z.; Hu, X.; Dai, H.; Zhang, N. Quantitative study on weld marks of injection molded products based on image processing technology. Mold Technol. 2022, 3, 25–29. (In Chinese) [Google Scholar]
- Kitayama, S.; Tsurita, S.; Takano, M.; Yamazaki, Y.; Kubo, Y.; Aiba, S. Multi-objective process parameters optimization in rapid heat cycle molding incorporating variable packing pressure profile for improving weldline, clamping force, and cycle time. Int. J. Adv. Manuf. Technol. 2022, 120, 3669–3681. [Google Scholar] [CrossRef]


Disclaimer/Publisher’s Note: The statements, opinions and data contained in all publications are solely those of the individual author(s) and contributor(s) and not of MDPI and/or the editor(s). MDPI and/or the editor(s) disclaim responsibility for any injury to people or property resulting from any ideas, methods, instructions or products referred to in the content. |
© 2025 by the authors. Licensee MDPI, Basel, Switzerland. This article is an open access article distributed under the terms and conditions of the Creative Commons Attribution (CC BY) license (https://creativecommons.org/licenses/by/4.0/).