Abstract
The Moroccan garment industry faces challenges in scheduling small order batches, often hindered by traditional product family-based methods that increase downtime by 15–20%. This study proposes a clustering-based scheduling approach, grouping garments by technological times rather than product families to reduce changeovers and downtime by 30–35%. A case study in a Moroccan factory with 50–100-unit batches showed a 20% lead time reduction and a 15% productivity boost. Using methods like K-Means, the approach enhances planning flexibility and resource use. This methodology offers a scalable solution for optimizing production and maintaining competitiveness in fast fashion markets.
1. Introduction
The fast fashion sector is one of the biggest players on the global apparel scene, driven by demand for constantly changing collections at prices affordable enough for quick delivery. This means that textile manufacturers, including those in Morocco, need to uphold high levels of agility and operational efficiency in order to satisfy these specifications while at the same time adhering to On-Time Delivery (OTD) targets [1]. Given geographical proximity to the European market and a well-trained workforce, Morocco should gain a strategic advantage in this industry [2]. However, some challenges remain with regard to small production runs, changes in orders, and high variability within this industry [3].
In this context, production planning and scheduling are essential to enhancing operational performance. Conventional approaches, which mainly focus on grouping similar products into families, often prove inadequate when dealing with fragmented and highly variable production requirements [4]. These methods tend to lead to frequent adjustments of production lines, resulting in increased changeover times and repeated disruptions [5].
Such conditions not only lower productivity but also reduce flexibility, limiting the ability of factories to efficiently manage a growing variety of orders.
Thus, introducing novel scheduling techniques should tackle the above-mentioned challenges. Clustering techniques, especially the K-means approach, seem to be an alternative worth investigating [6]. Contrary to grouping products by families, this method orders production sequences according to similarities in processing times and operational requirements. The idea is to minimize idle time and enhance transfer from one batch of production to another. In this manner, since products with similar manufacturing processes are grouped, reconfiguration times would be less, allowing for a better production flow and a reduction in delivery times [7].
This research describes an implementation of a scheduling approach that was developed in one Moroccan textile factory with a view to illustrating the benefits of a clustering technique. The results show considerable gains in productivity: A reduction of 30–35% on average in changeover times and a decrease of 20% in delivery lead times [8] (pp. 85–92). Furthermore, this method influences the efficient utilization of workers’ expertise, allowing flexible production in a cost-effective manner [9].
The incorporation of clustering methods into scheduling practices provides a totally new perspective for the textile industry in Morocco, and perhaps, in other countries, which find themselves facing similar operational challenges. This process serves as a valuable guideline for companies intending to improve their competitiveness in a dynamic and subsequently global market [10]. In addition, the study will provide further additions to the collection of studies about perfecting the art of production optimization in the fast fashion industry [11].
Objective: This shows what needs to be set in place to develop a better scheduling arrangement regarding problems relating to clustering of manufacturing lines according to technological times rather than product families. The general idea is to minimize setup stopovers while maximizing manufacturing and to ensure that small batches of output are completed in time [12]. We briefly contextualize the study in a wider frame; the significance of the work should also be presented.
2. Methodology
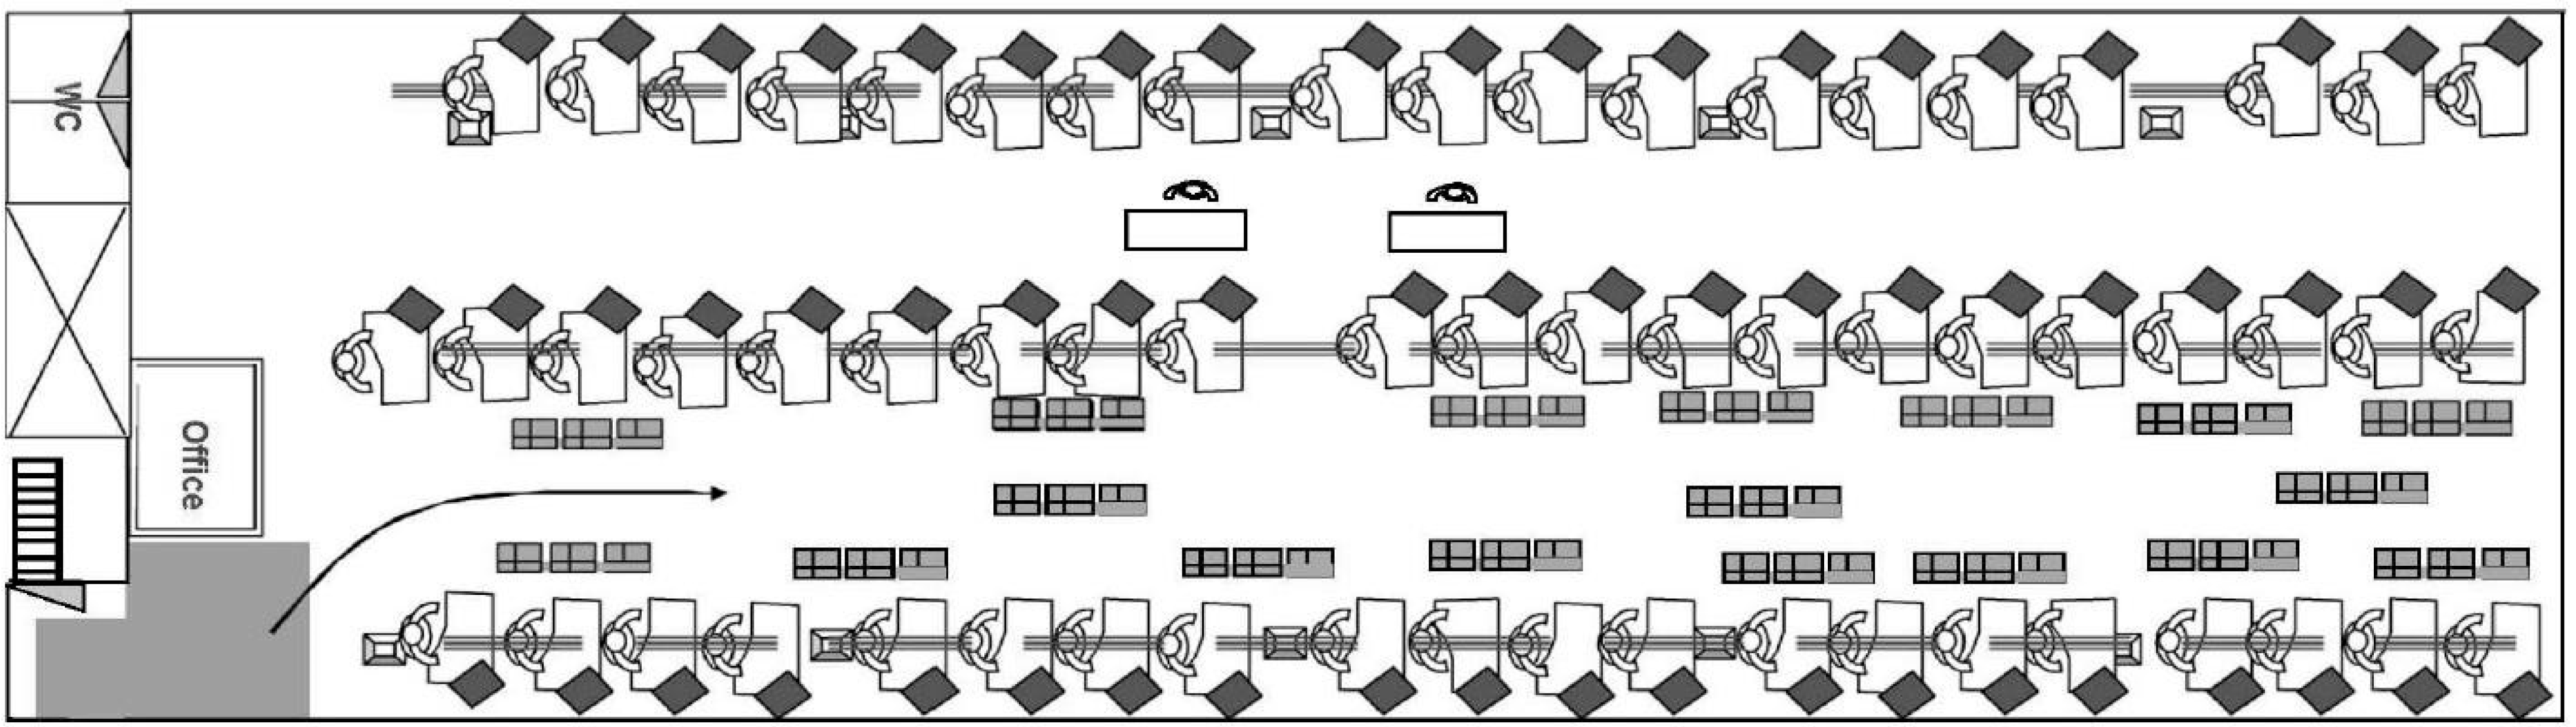
In the Moroccan garment industry, production lines (Figure 1) are typically organized by product families. This method simplifies order allocation but has a major drawback of frequent changeovers, as each product requires specific setup adjustments before manufacturing [13].

Figure 1.
Production line [14].
2.1. Subsect Proposed Clustering-Based Approach
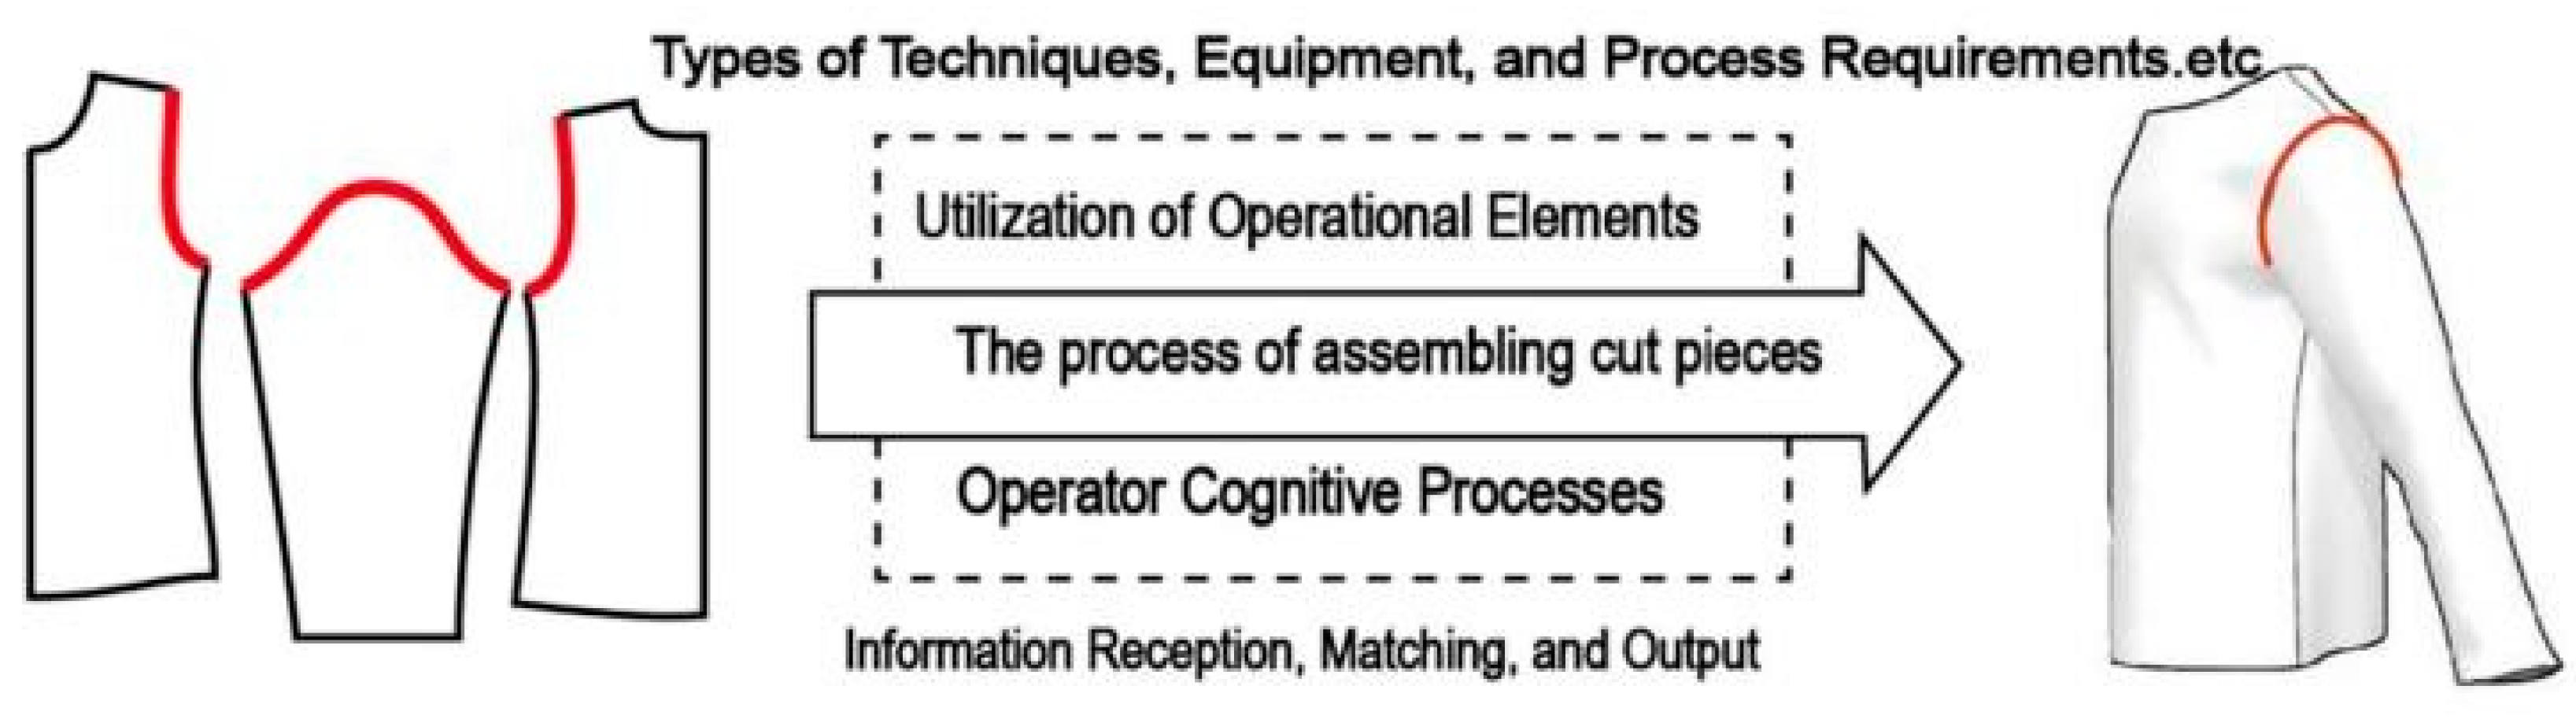
The method organizes production lines based on technological times, signifying the time needed for carrying out definite operations or processes (Figure 2). Technological matches group orders together, restricting the occurrence and time of changeovers [15]. Based on technological times, production lines can be more easily run since they would have less adjustment to do; hence, fewer disruptions and a steadier production flow can occur [16]. This method favors the more effective use of equipment and labor and thus improves productivity and cost efficiency, especially under the conditions of high variability that characterize fast-fashion production [17].

Figure 2.
Example of operation.
2.2. Clustering Algorithm
A clustering algorithm is used to group orders according to their technological times. Several parameters are taken into consideration, like the kind of fabric, the complexity of the design, and the operations required; The clustering is performed for the purpose of minimizing changeover time between different orders.
2.3. Cataloging of Homogeneous Clusters Using Dynamic K-Means
The K-means method is a widely used unsupervised learning algorithm for addressing clustering problems, known for its practical efficiency and effectiveness. Originally developed as a vector quantization technique in signal processing, it has become a standard tool for cluster analysis in data mining. This study presents an adaptation of the K-means algorithm, incorporating a self-adjusting approach to classify six distinct style attributes. Let xip represent the i-th discrete point of garment P, and yjp represent the i-th discrete point of garment Q, with i = 1, …, k. The classification is based on the Euclidean distance (D), calculated as follows:
These points represent the same features as measured and recorded from both P and Q dresses. The set D of Euclidean distances between dress x and all successive dress y ∈ Y is calculated using Equation (1).
From set D, the k smallest distances are selected. The classifier then assigns each verified design to one of three categories: original, combined, or new. To ensure more reliable classification and reduce noise, a voting score is used, based on the number n of neighbors, defined as follows:
where each data point is classified as one of the three categories: each such point influences the number of clusters and the initial mean vectors. If the data points are less than the clusters, they are nominated as the initial mean vector of a cluster. Therefore, each cluster is represented by a single data point in such cases. If the data points exceed the clusters, the distance is calculated from each data point to all the cluster mean vectors, and the point has to be assigned to the cluster with the nearest mean.
Since one does not know the initial positions of all the mean vectors, they need to be adjusted in an iterative manner as data points are assigned to clusters. Each time the data points are reassigned, the cluster k-mean is recomputed based on the rule defined here:
In Equation (3), x represents the set of data for clustering. The clusters were then evaluated using the Sum of Squared Error:
For each point, the error is measured by its distance to the nearest cluster. To calculate the SSE (Sum of Squared Errors), this error is squared and then summed, as shown in Equation (4).
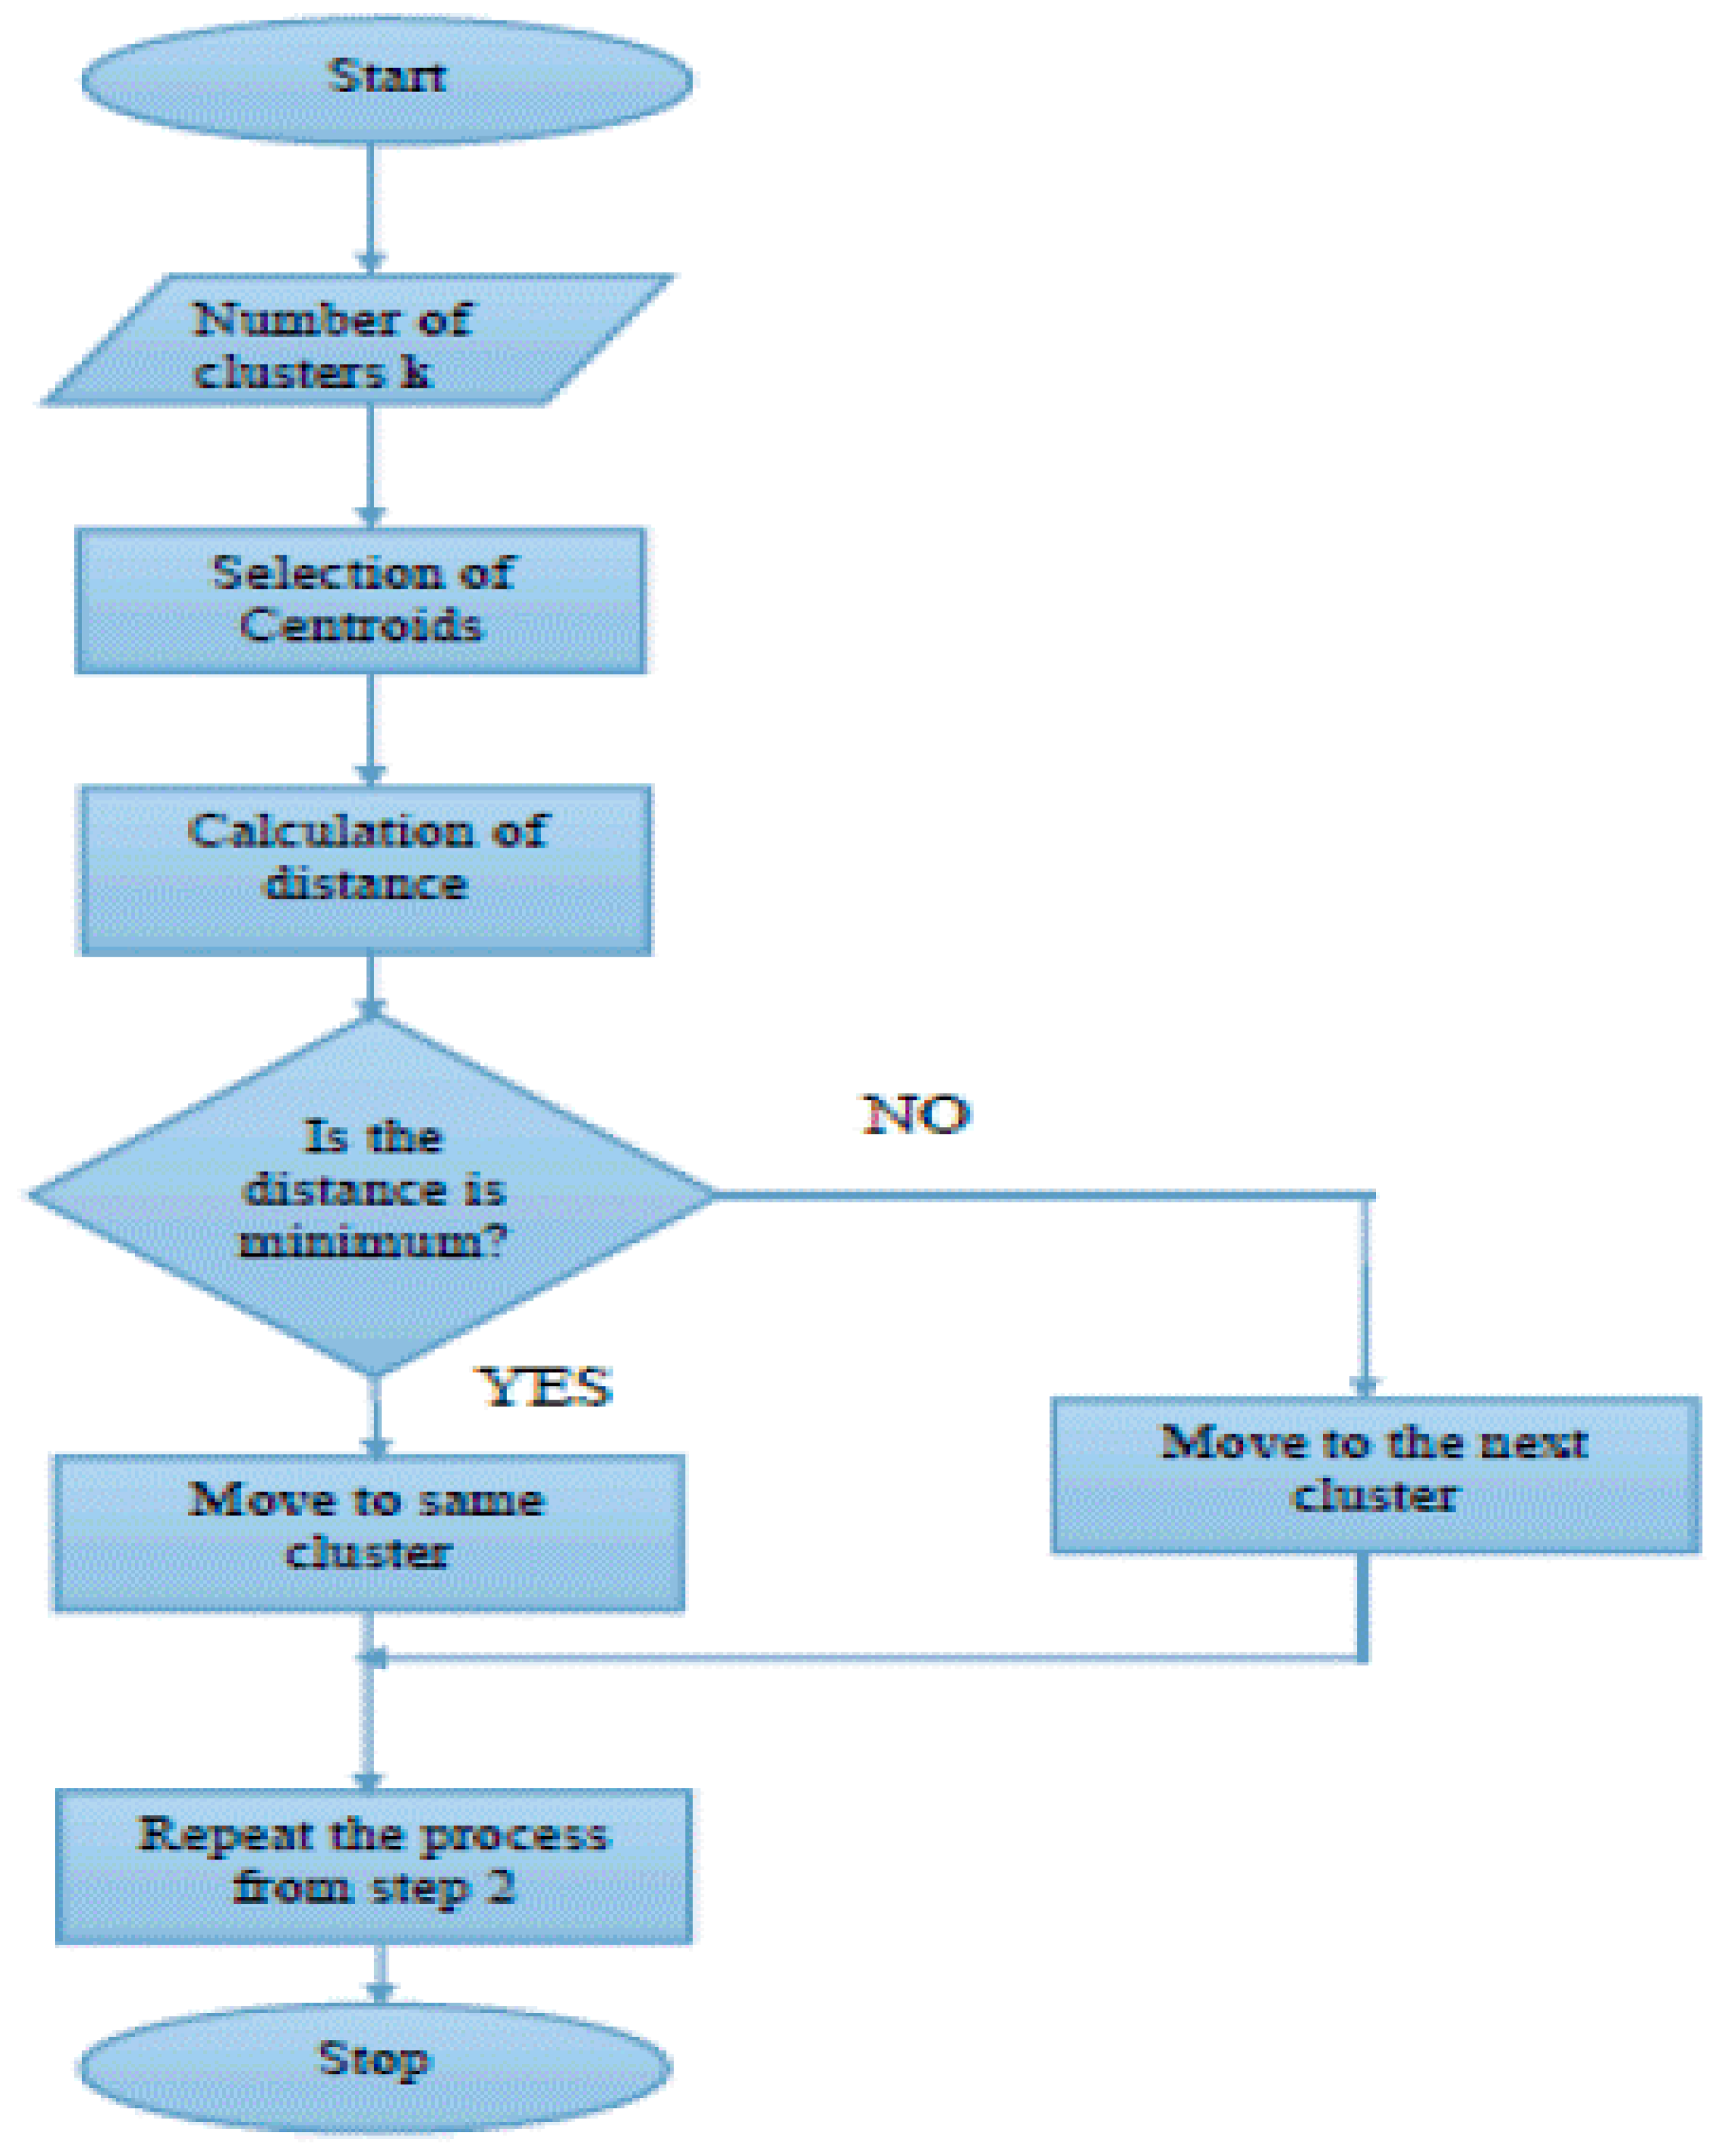
If the matrix X has a dimension of l(c × d) according to Equation (2), then Algorithm (Figure 3) details the process of generating a new xi.

Figure 3.
Flowchart for K-means clustering [18].
We chose K-Means because it is well-suited for our production scheduling challenge, where we need to group orders into predefined categories. Unlike K-Nearest Neighbors (K-NN), which assigns new data points based on proximity, K-Means is ideal when the number of clusters is known in advance, which is the case in our study.
This method allows us to efficiently group production orders with similar characteristics (e.g., processing times, machine types), reducing setup times and improving workload balance. Compared to DBSCAN or hierarchical clustering, K-Means is faster, scalable, and better suited for large datasets, making it a practical and efficient choice for industrial applications.
3. Analysis of the Company’s Order Book by Type of Operation and Creation of a Database
A tabulated form was formulated (Table 1), and each row consisted of a particular operation related to a specific garment type linked with a machine and with technical skills needed to accomplish the job. The time necessary for the performance of the operation is also recorded. For clarification, a few operations concerning the garment AUR 802 H are exemplified.

Table 1.
The process of changing series.
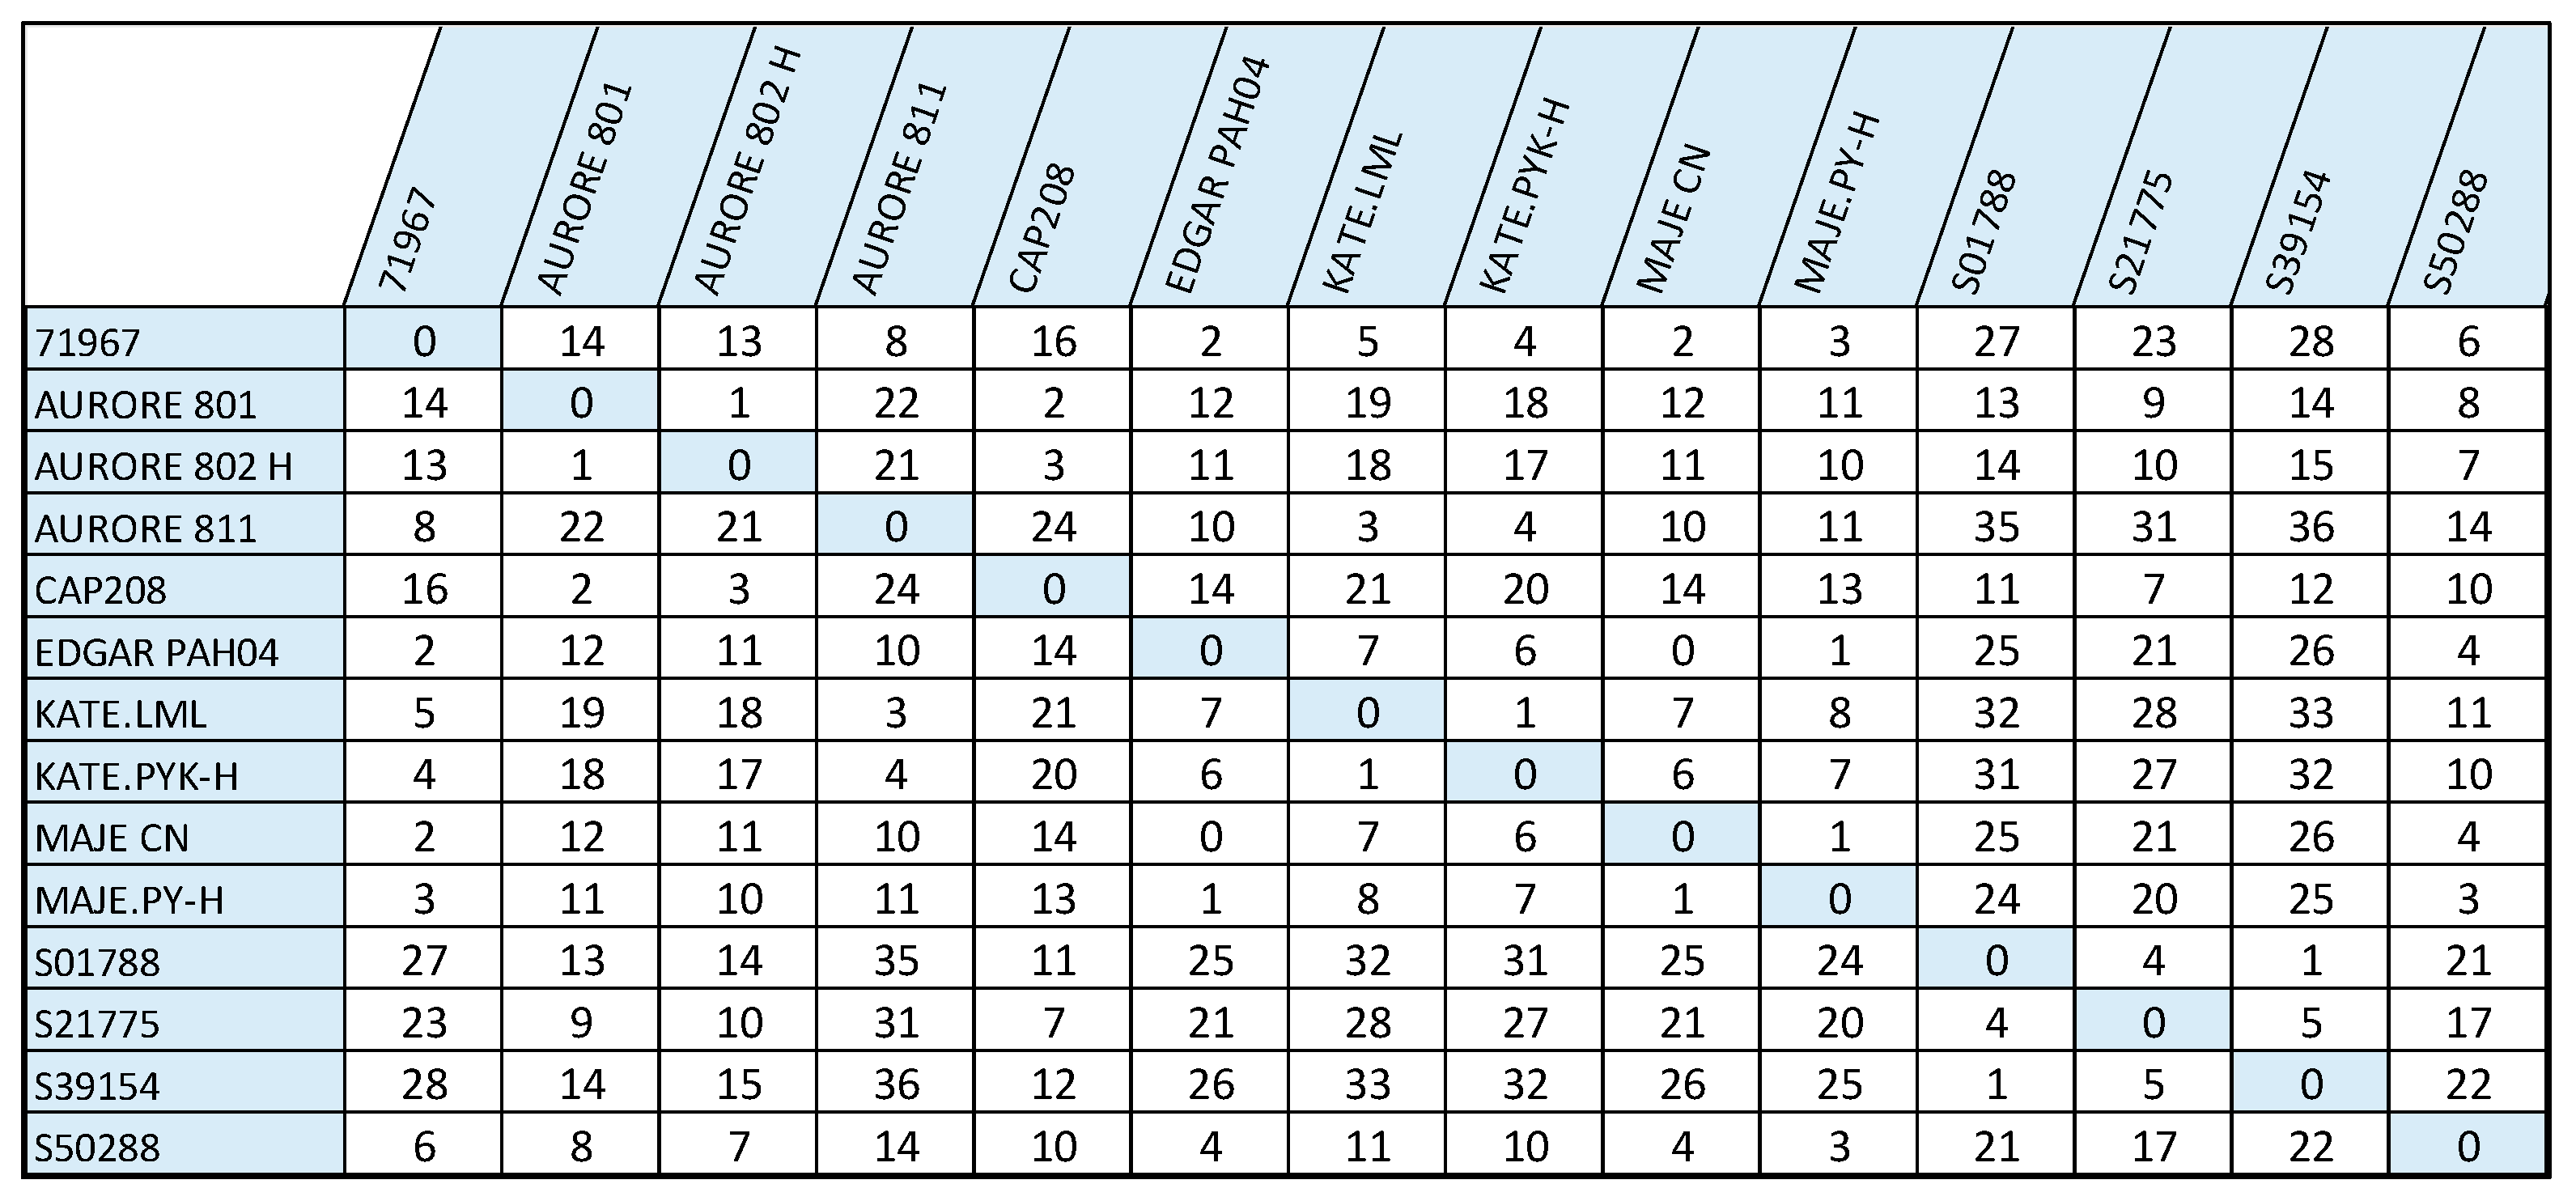
Transition matrix (Figure 4) represents the Number of Modifications Required to Shift from One Model to Another; A rounded-down staffing requirement has been transformed into a garment-type matrix, indicating the operational difference from one garment model to others; This matrix indicates how staffing requirements vary from one garment model to another, depending on the specific skills needed for particular garment types. Every cell in the matrix signifies the operator count needed to carry out a particular skill for various garment types, highlighting how these need to be modified in the production process. The matrix structure further clarifies operational diversity between garment types while providing a good platform for resource allocation optimization, which in turn promotes work efficiency and flexibility.
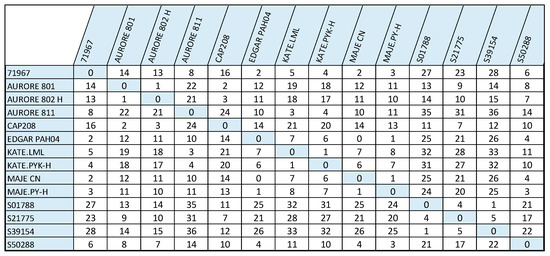
Figure 4.
Transition matrix represents the number of modifications required to shift from one model to another.
4. Results and Discussion
Use of the cluster-based approach gave substantial gains in production efficiency. The total changeover time was reduced by 50%, while the average lead time for small orders was reduced by 30%. Further, improved predictability and smooth workflow enhanced operator satisfaction.
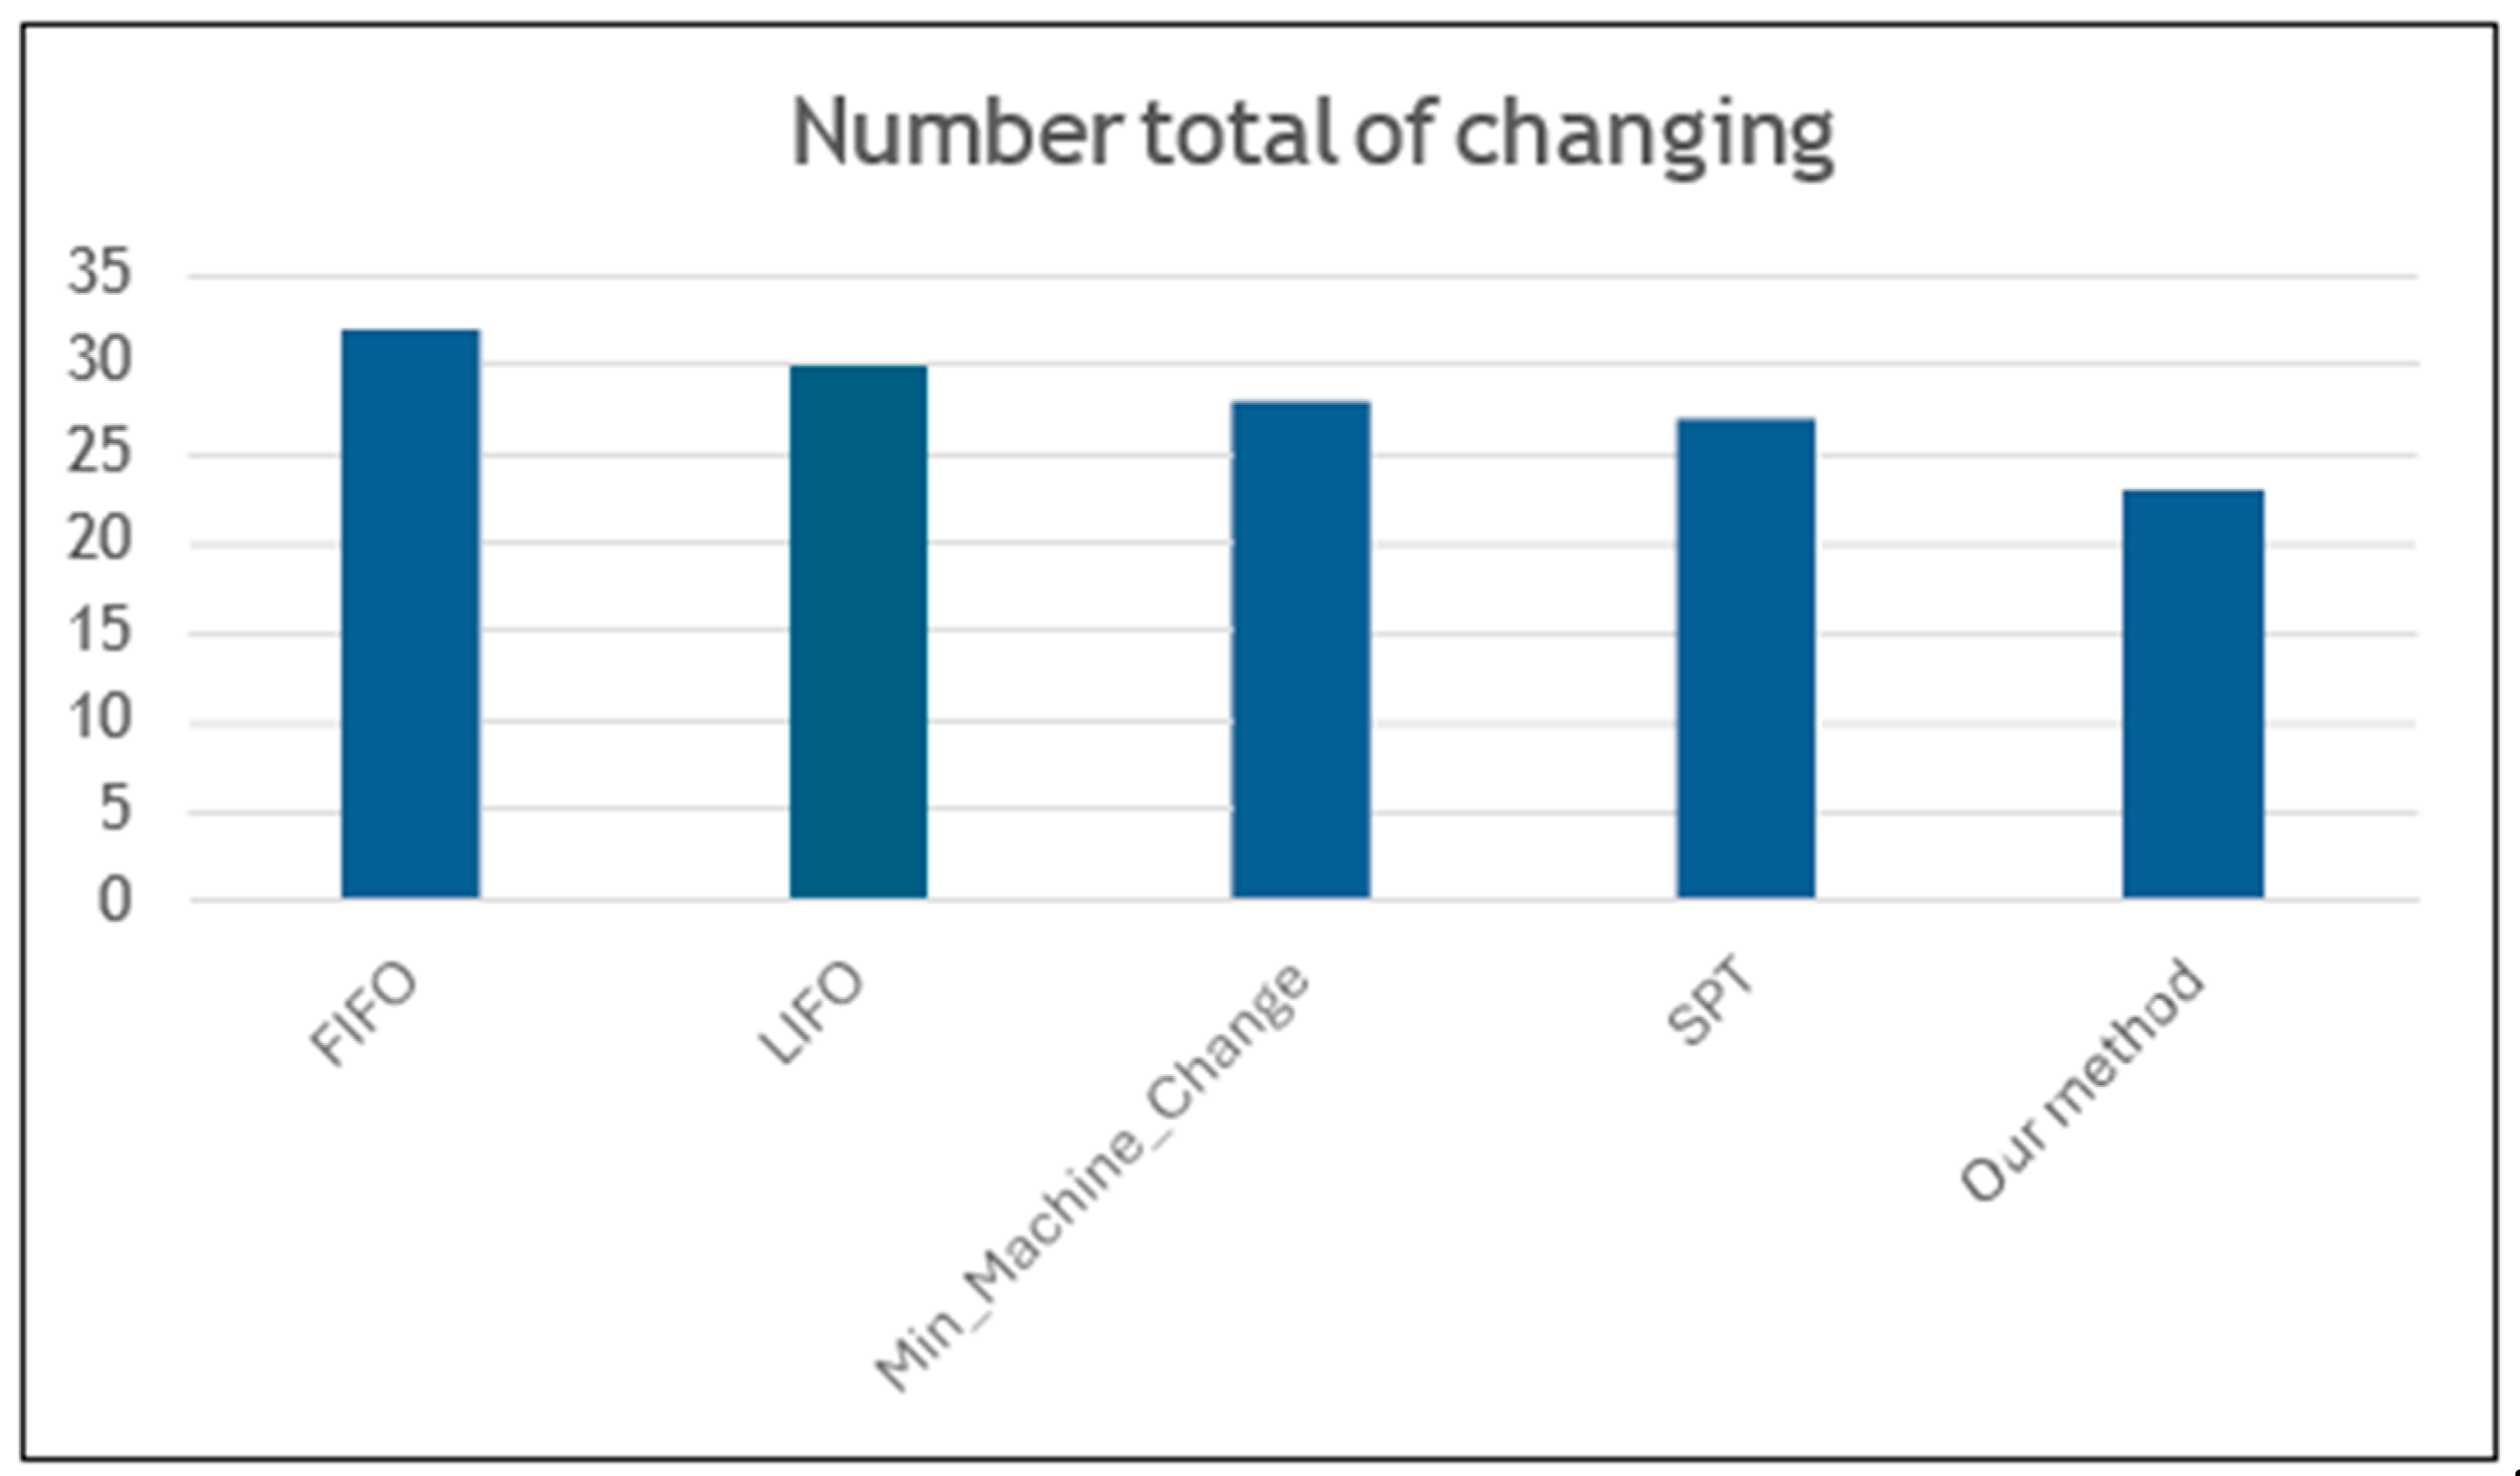
Our method versus the most common scheduling criteria and priority rules (Figure 5):

Figure 5.
Comparison with classic scheduling methods.
It refers to the qualitative and quantitative set of demands to be fulfilled to review the established schedule’s quality. A number of criteria may be applied to the same dataset. Selecting amongst these depends on the criterion or criteria combinations which were already designated.
First Come, First Served (FCFS): This rule is beneficial if the purpose is to be honest and equitable to clients.
Shortest Processing Time (SPT): Orders are prioritized based on the shortest processing time, with the fastest jobs being processed first.
Longest Processing Time (LPT): The longest order is chosen first.
Critical Ratio (CR): Orders are prioritized based on their critical ratio, with those having the lowest ratio being processed first.
The clustering technique holds a vast edge over the traditional scheduling rules since it groups similar operations or products in a resource allocation mode that improves workflow efficiency. Unlike conventional modes such as FCFS or SPT that prioritize orders based on individual traits, clustering places its focus on forming groups of operations with shared needs; thus, on the entire production line, there is reduced setup and changeover time, leading to performance enhancement while balancing operator workload and bounded disruptions in production flow.
Our study primarily compares K-Means clustering with traditional scheduling methods, such as FIFO. However, we acknowledge the potential of more advanced approaches, including heuristic algorithms (NEH, Tabu Search, genetic algorithms) and artificial intelligence techniques (neural networks, reinforcement learning).
While these methods offer more refined optimization and real-time adaptability, their complexity and industrial implementation remain challenging. In the future, further exploration of these approaches could help enhance the flexibility and efficiency of the model in various production environments.
Nevertheless, clustering-based methods have inherent disadvantages when it comes to dynamic environments where priorities or urgent orders change constantly. Unlike other approaches, such as Earliest Due Date (EDD) or Critical Ratio (CR), which are designed to adapt quickly in the face of changing constraints, clustering performs a more static pre-planning scheduling. Also, clustering algorithms are often much more complex than other real-time methods which makes them less suitable for cabinet live, computer-controlled applications than their simpler rule-based rivals like FCFS or SPT.
We acknowledge the importance of a broader comparative analysis with other scheduling methods. In this study, we focused on K-Means versus traditional approaches like FIFO, highlighting its benefits in reducing changeover times and optimizing resource allocation.
However, exploring methods like EDD (Earliest Due Date), SPT (Shortest Processing Time), or heuristic algorithms (Tabu Search, genetic algorithms) could provide deeper insights into the model’s efficiency in more complex production environments.
We tested different workload configurations, and K-Means consistently reduced changeover times and optimized resource allocation, confirming its reliability.
Future research will explore more complex scenarios, increasing data variability and comparing K-Means with adaptive algorithms like metaheuristics or AI to further validate its robustness.
5. Conclusions
The clustering-based scheduling approach hence presents a realistic solution for the Moroccan garment industry, especially for the fast fashion sector. Instead of grouping by product families, factories should focus on these technological timings to minimize changeover times, which increases efficiency on the production line and meet on-time delivery goals. Moreover, with the K-means clustering method, similar operating requirements for each garment to be produced were grouped, which would help simplify the planning process and obviate changes from one production run to another.
Author Contributions
Conceptualization, A.M., Y.E.B. and S.T.; data curation, A.M.; formal analysis, A.M., Y.E.B. and S.T.; research, A.M.; methodology, A.M., Y.E.B. and S.T.; supervision, O.C. and A.S.; validation, A.S.; original draft and editing; A.M., Y.E.B. and S.T. All authors have read and agreed to the published version of the manuscript.
Funding
This research received no external funding.
Institutional Review Board Statement
Not applicable.
Informed Consent Statement
Not applicable.
Data Availability Statement
Data is available in this manuscript.
Conflicts of Interest
The authors declare no conflict of interest.
References
- Ray, S.; Nayak, L. Marketing Sustainable Fashion: Trends and Future Directions. Sustainability 2023, 15, 6202. [Google Scholar] [CrossRef]
- Aggour, A.; Moussaid, A.; Abou El Hassan, A. Fast fashion in the Moroccan apparel supply chain: A case study. Int. J. Manag. Value Supply Chain. 2016, 7, 17–24. [Google Scholar] [CrossRef]
- Karacapilidis, N.I.; Pappis, C.P. Production planning and control in textile industry: A case study. Comput. Ind. 1996, 30, 127–144. [Google Scholar] [CrossRef]
- Aggour, A.; Moussaid, A.; El Hassan, A.A. Fast fashion assessment tool: A case study of a moroccan apparel supply chain. Int. J Sup. Chain. Mgt 2018, 7, 213–220. [Google Scholar]
- Spahija, S.; Dumishllari, E.; Leti, A.; Dhoska, K. The influence of line balance on efficiency in garment production. J. Integr. Eng. Appl. Sci. 2024, 2, 40–47. [Google Scholar] [CrossRef]
- Marzouk, Y.M.; Ghoniem, A.F. K-means clustering for optimal partitioning and dynamic load balancing of parallel hierarchical N-body simulations. J. Comput. Phys. 2005, 207, 493–528. [Google Scholar] [CrossRef]
- Wong, W.K. Optimisation of apparel manufacturing resource allocation using a generic optimised table-planning model. Int. J. Adv. Manuf. Technol. 2023, 21, 935–944. [Google Scholar] [CrossRef]
- Astanti, R.D.; Ai, T.J. Clustering-based heuristics for aligning master production schedule and delivery schedule. Manag. Syst. Prod. Eng. 2024, 32, 401–408. [Google Scholar] [CrossRef]
- Rahman, S.; Baten, A.; Hoque, M.; Mahmud, M.I. Impact of lean manufacturing on productivity and layout design in sewing section of a garment industry. Int. J. Ind. Manag. 2023, 17, 152–161. [Google Scholar] [CrossRef]
- Cevallos Bravo, M.V. Textile companies and the factors involved in their competitiveness: A bibliographic review. Open J. Bus. Manag. 2022, 10, 1013–1025. [Google Scholar] [CrossRef]
- Barde, P.S.; Jadhao, R.R. Advance manufacturing process for convenient & optimize production. J. Emerg. Technol. Innov. Res. 2019, 6, 393–398. [Google Scholar]
- Kozinski, O.; Kotyrba, M.; Volna, E. Improving the Production Efficiency Based on Algorithmization of the Planning Process. Appl. Syst. Innov. 2023, 6, 77. [Google Scholar] [CrossRef]
- Tsai, W.-H.; Chen, H.-C.; Chang, S.-C.; Chan, K.-C. Revolutionizing Textile Manufacturing: Sustainable and Profitable Production by Integrating Industry 4.0, Activity-Based Costing, and the Theory of Constraints. Processes 2024, 12, 2311. [Google Scholar] [CrossRef]
- Rossi, A. Does Economic Upgrading Lead to Social Upgrading in Global Production Networks? Evidence from Morocco. World Dev. 2013, 46, 223–233. [Google Scholar] [CrossRef]
- Kentli, A.; Dal, V.; Alkaya, A.F. Minimizing Machine Changeover Time in Product Line in an Apparel Industry. TEKSTİL Ve KONFEKSİYON 2013, 23, 159–167. [Google Scholar]
- Choi, H.; Yu, S.; Lee, D.; Noh, S.D.; Ji, S.; Kim, H.; Yoon, H.; Kwon, M.; Han, J. Optimization of the Factory Layout and Production Flow Using Production-Simulation-Based Reinforcement Learning. Machines 2024, 12, 390. [Google Scholar] [CrossRef]
- Ali, S.M.; Haque, M.N.; Sarker, M.R.; Kandasamy, J.; Vlachos, I. Improving Changeover Techniques in Apparel Manufacturing through Single Minute Exchange of Die: Implications for Benchmarking. Benchmarking: Int. J. 2025, 32, 1207–1223. [Google Scholar] [CrossRef]
- Al Naqbi, H.; Bahroun, Z.; Ahmed, V. Enhancing Work Productivity through Generative Artificial Intelligence: A Comprehensive Literature Review. Sustainability 2024, 16, 1166. [Google Scholar] [CrossRef]
Disclaimer/Publisher’s Note: The statements, opinions and data contained in all publications are solely those of the individual author(s) and contributor(s) and not of MDPI and/or the editor(s). MDPI and/or the editor(s) disclaim responsibility for any injury to people or property resulting from any ideas, methods, instructions or products referred to in the content. |
© 2025 by the authors. Licensee MDPI, Basel, Switzerland. This article is an open access article distributed under the terms and conditions of the Creative Commons Attribution (CC BY) license (https://creativecommons.org/licenses/by/4.0/).