1. Introduction
The global dairy industry is a vital component of the agricultural sector, significantly contributing to global nutrition and economic development. According to the Food and Agriculture Organization of the United Nations (FAO), world milk production reached approximately 852 million tons in 2019, reflecting a steady increase over the past decade [
1]. Dairy products are essential sources of nutrition, providing high-quality proteins, vitamins, and minerals crucial for human health [
2].
In Morocco, the dairy industry plays a significant role in the national economy, supporting rural livelihoods and enhancing food security. The sector has experienced notable growth due to increasing domestic demand, government initiatives, and investments aimed at modernizing production and distribution systems [
3]. Moroccan dairy companies produce and distribute a variety of products to multiple retailers, making effective demand forecasting critical to their operations.
Dairy products have unique characteristics such as perishability and demand variability, posing significant challenges to supply chain management. The short shelf life of items like milk, yogurt, and cheese requires efficient logistics and precise demand forecasting to minimize waste and ensure product freshness [
4]. Additionally, consumer demand for dairy products can fluctuate due to factors like seasonality, health trends, and cultural practices, further complicating demand prediction [
5].
1.1. Importance of Demand Forecasting
Accurate demand forecasting is essential for dairy companies to align production with market demand, optimize inventory levels, and reduce costs associated with overstocking or stockouts [
6]. For companies distributing to multiple retailers, forecasting becomes more complex due to varying demand patterns across different locations and customer segments [
7]. Effective demand forecasting enables better planning of procurement, production, and distribution activities, enhancing overall supply chain performance [
8].
In a multi-retailer context, challenges such as diverse customer preferences, promotional activities, and regional consumption variations require sophisticated forecasting methods to capture demand dynamics [
9]. Accurate forecasts help improve service levels, reduce waste from perishable inventory, and increase customer satisfaction [
10].
1.2. Challenges in the Dairy Industry
The dairy industry faces specific challenges in demand forecasting due to the perishability of products, necessitating rapid turnover and precise inventory management [
11]. Fluctuations in consumer preferences, including shifts towards plant-based alternatives and changing dietary habits, introduce additional demand uncertainty [
12]. External factors such as economic conditions, weather patterns, and regulatory changes can also impact dairy product demand [
13].
Moreover, coordinating supply chain activities across multiple retailers adds complexity to inventory management and logistics planning. Inaccurate forecasts can lead to excessive waste from unsold perishable goods or lost sales opportunities due to stockouts [
14].
1.3. Emergence of Advanced Forecasting Methods
Advancements in computational techniques have led to the development of sophisticated forecasting methods. Machine learning algorithms such as Extreme Gradient Boosting (XGBoost) [
15], Support Vector Regression (SVR) [
16], and time series models like Autoregressive Integrated Moving Average (ARIMA) have been successfully applied to demand forecasting [
17]. These methods offer advantages over traditional techniques by capturing complex nonlinear relationships and incorporating multiple variables [
18].
Machine learning models can process large datasets and identify patterns that may not be apparent with conventional methods, leading to improved forecast accuracy [
19]. In the dairy industry, these advanced methods can enhance demand prediction by considering factors such as historical sales data, promotional activities, and external influences [
20].
1.4. Purpose of the Study
The purpose of this study is to explore and apply advanced forecasting methods, specifically XGBoost, SVR, and ARIMA, to improve demand prediction for each of the 15 delivery trucks serving specific retailers in a Moroccan dairy company. By developing accurate demand forecasts at the delivery truck level, the company aims to optimize logistics operations, reduce waste due to perishability, and improve customer satisfaction through better service levels.
1.5. Significance and Contribution
This study contributes to the existing literature by addressing the gap in applying advanced forecasting techniques in the context of multi-retailer distribution in the dairy industry. By focusing on a Moroccan dairy company, this research provides insights relevant to emerging markets and adds value to supply chain management practices in similar contexts [
21]. The findings have the potential to enhance operational efficiency, reduce environmental impact due to waste, and increase competitiveness in the dairy sector.
1.6. Outline of the Article
This article is organized as follows:
Section 2 reviews the relevant literature on demand forecasting methods and their application in the dairy industry.
Section 3 outlines the methodology, including data collection and model implementation.
Section 4 presents the results and compares the performance of the forecasting models.
Section 5 discusses the implications of the findings, and
Section 6 concludes the study with suggestions for future research.
2. State of the Art
2.1. Context and Relevance
Demand forecasting holds a pivotal role in the dairy industry, particularly in a multi-retailer environment where the challenges of perishable products and volatile consumer preferences are ever present. Accurate forecasts not only reduce waste and optimize inventory levels but also enhance overall supply chain performance [
6].
Historically, traditional forecasting methods—such as the Autoregressive Integrated Moving Average (ARIMA) model—were employed because of their simplicity and efficacy in many applications. However, these methodologies often struggle to capture the complex nonlinear relationships inherent in multi-variable datasets, especially in contexts characterized by diverse retail channels and rapidly changing market conditions [
17].
In recent years, there has been a notable shift towards advanced predictive techniques, with machine learning models leading the evolution. Techniques like Support Vector Regression (SVR) [
16] and Extreme Gradient Boosting (XGBoost) [
15] have emerged as robust alternatives, providing improved accuracy by effectively processing large datasets and incorporating multiple influencing factors—ranging from historical sales data to promotional activities and external environmental variables.
This evolution in forecasting methodology underlines the importance of transitioning from conventional statistical models to innovative approaches that not only meet the operational demands of the dairy industry but also facilitate a more sustainable and resilient supply chain management framework [
6,
17].
2.2. Background on Traditional Forecasting Methods
2.2.1. Overview of Traditional Forecasting in Dairy Industry
Traditional forecasting methods form the backbone of early supply chain management strategies in the dairy industry, particularly for perishable products. Historically, these methods have enabled stakeholders to align production schedules with consumer demand by leveraging time series data. Their application in the dairy supply chain has been critical for optimizing inventory, minimizing waste, and maintaining product freshness under varying market conditions [
22].
2.2.2. ARIMA (Autoregressive Integrated Moving Average)
The ARIMA model is a time-tested technique adept at handling time series data. It effectively captures linear trends and seasonal patterns by transforming non-stationary data into a stationary form through differencing. This capability makes ARIMA particularly useful for forecasting demand in industries with perishable goods like dairy [
6,
17].
2.2.3. SVR (Support Vector Regression)
Support Vector Regression (SVR) is employed to address nonlinear forecasting challenges in demand prediction. By mapping complex and high-dimensional relationships in data, SVR provides an enhanced capability to model intricate demand patterns, making it highly suitable for scenarios where consumer behavior and market conditions are volatile [
16].
2.2.4. XGBoost (Extreme Gradient Boosting)
XGBoost is an advanced ensemble learning method known for its efficiency in handling large datasets and capturing interactions among multiple variables. Its ability to integrate the diverse factors influencing demand has proven beneficial in enhancing the accuracy of forecasting models in the dairy industry [
15].
2.3. Emerging Forecasting Methods
Recent advances in machine learning and algorithmic approaches have significantly improved forecast accuracy and robustness. In the dairy industry, emerging methods such as Long Short-Term Memory networks (LSTM), Prophet, LightGBM, and hybrid models are proving valuable in addressing challenges like seasonality, nonlinearity, and the perishability of products.
2.3.1. Long Short-Term Memory Networks (LSTM)
LSTM networks are specifically designed to capture long-term temporal dependencies in sequential data, a feature that makes them highly effective for time series forecasting [
23]. In the context of dairy product forecasting, LSTM models can incorporate historical sales data to anticipate future demand patterns, thereby helping to mitigate the issues related to product perishability and fluctuating consumer behavior.
2.3.2. Prophet
Prophet, developed by Facebook, is an additive regression model that excels in man-aging seasonality and outliers. Its adaptability to abrupt trend changes and holiday effects makes it particularly suitable for forecasting in environments with significant seasonal variability [
24]. Recent studies have highlighted Prophet’s ease of use and robustness in scenarios such as dairy demand forecasting, where seasonal fluctuations are a key concern.
2.3.3. LightGBM
LightGBM is a gradient boosting framework that has gained attention due to its efficiency and enhanced performance when working with large-scale datasets. Compared with similar methods like XGBoost, LightGBM often demonstrates faster training times and improved scalability. These characteristics make it a compelling choice for various forecasting tasks across different domains [
25].
2.3.4. Hybrid Models
Hybrid models integrate multiple forecasting approaches to leverage the unique strengths of each method. For example, by combining traditional statistical techniques with machine learning algorithms, these models can effectively capture both linear trends as well as nonlinear patterns in the data [
26,
27]. This strategy has been shown to enhance overall forecast accuracy and robustness in a wide range of applications.
2.4. Comparative Analysis: Traditional vs. Emerging Methods
2.4.1. Comparison Framework
A comprehensive evaluation of the forecasting methods requires considering multiple criteria. In this study, we compare both traditional and emerging methods based on the following key aspects:
Forecast Performance Metrics: Accuracy measures such as Mean Absolute Percentage Error (MAPE), Root Mean Square Error (RMSE), and Mean Absolute Error (MAE).
Implementation Complexity: This includes data requirements, computational effort, and ease of integration within existing supply chain management processes.
Handling Seasonality: The effectiveness in capturing seasonal variations, which is particularly relevant in industries with perishable products.
2.4.2. Comparative Table
Table 1 summarizes the characteristics of the considered forecasting methods.
2.4.3. Structured Discussion
Traditional forecasting models such as ARIMA, SVR, and XGBoost offer reliable performance with relatively simple implementations, making them attractive for scenarios with limited data intricacies. Their straightforward design generally ensures low computational overhead and ease of integration. However, these methods may sometimes struggle to capture complex nonlinear relationships and may not always address seasonal variations in a robust manner.
In contrast, emerging methods like LSTM, Prophet, and LightGBM leverage advanced learning paradigms to achieve lower forecasting error metrics. LSTM networks excel at capturing long-term dependencies in sequential data. Prophet, with its intuitive handling of trend shifts and seasonality, presents a competitive edge for applications involving business time series. Furthermore, LightGBM’s efficiency in processing large datasets and its superior speed make it highly suitable for applications requiring rapid model updates. Hybrid models, which combine the strengths of statistical and learning-based approaches, hold promise for optimizing forecast accuracy, albeit at the expense of increased complexity in both implementation and computational requirements.
This analysis highlights a key trade-off in forecasting: while traditional models offer simplicity and robustness, emerging methods provide improved accuracy and flexibility, particularly in environments characterized by complex, dynamic data.
2.5. Integration Within the Context of Dairy Demand Forecasting in Morocco
This subsection examines the application of advanced demand forecasting methods within the unique framework of the Moroccan dairy industry, characterized by multi-retailer distribution, product perishability, and region-specific consumption trends.
2.5.1. Relevance to Multi-Retailer Dairy Supply Chains
In Morocco, dairy products are distributed through a diverse network of retailers, each displaying unique demand patterns that stem from regional preferences, economic variances, and targeted promotional activities. The forecasting methods reviewed in this study—ranging from traditional approaches such as ARIMA and SVR to state-of-the-art techniques like XGBoost, LSTM, and Prophet—offer robust tools for capturing the inherent non-linearities and seasonal fluctuations in local demand. These methods have been demonstrated to enhance forecasting granularity, particularly at the delivery truck level, thereby supporting decisions aimed at minimizing waste owing to the products’ perishability and ensuring optimal inventory levels across various retail settings [
6,
17]. In addition, recent analyses conducted on multi-retailer systems in emerging markets have corroborated the applicability of these approaches. By addressing the complexities of regional market dynamics, these methods contribute toward a more agile and responsive supply chain system in Morocco.
2.5.2. Advantages and Limitations in the Moroccan Context
The application of advanced forecasting techniques in Morocco presents both significant advantages and practical challenges. On the advantage side, the increasing availability of historical sales data and improvements in data management have created a fertile ground for implementing machine learning algorithms. Models such as Prophet and LSTM, which effectively account for seasonal patterns and abrupt trend changes, are particularly well suited to the distinctive seasonal consumption habits and cultural influences present within the Moroccan market [
7,
20]. Recent case studies in similar market contexts have further emphasized the benefits of these forecasting techniques in reducing inventory inefficiencies and spoilage risks.
Conversely, certain limitations must be acknowledged. Data quality and consistency remain major concerns in a context where information streams from multiple retailers can vary significantly in terms of completeness and timeliness. Additionally, infrastructural and logistical disparities across regions may impede the seamless integration and deployment of these sophisticated modeling frameworks. As a result, while the potential for improved supply chain performance is considerable, successful implementation requires the ongoing calibration of the models to local conditions as well as investments in technology and training to overcome the current constraints.
Overall, the integration of these advanced forecasting methods represents a promising avenue for enhancing operational efficiency and competitiveness in Morocco’s dairy sector, even as stakeholders work to address the attendant challenges of data heterogeneity and regional variability.
3. Methodology
3.1. Data Collection and Preprocessing
The dataset employed in this study consisted of 250,000 records collected over a period of two years. Each record comprised several key attributes: the date of transaction, a client identifier, the quantity purchased, a product identifier, a binary promotion indicator, and the Hijri month corresponding to the transaction date. Initial data exploration revealed missing values and outliers, prompting a series of preprocessing steps:
Little’s MCAR test: An insignificant p-value (p = 0.27) confirmed data were missing completely at random.
MICE imputation: Five iterations with predictive mean matching filled missing quantity and promotion while preserving joint distributions.
IQR rule: For each retailer–product pair, values outside [Q1 − 1.5 IQR, Q3 + 1.5 IQR] were capped at the nearest bound.
Post filter re-scaling: Capped series were min–max re-scaled to original units to maintain comparability across retailers.
To ensure data reliability across all 15 retailers, we implemented a four-step cleaning pipeline. First, missing quantities and promotion flags were imputed with Multiple Imputation by Chained Equations (five iterations, predictive mean matching) to preserve joint distributions. Second, extreme values were detected using the interquartile range rule (Q1 − 1.5 IQR, Q3 + 1.5 IQR) and capped to the nearest bound. Third, nightly retailer-level validation rules (duplicate day product keys, invalid SKU codes, and negative quantities) quarantined anomalous rows. Finally, a standardization step aligned calendar fields, measurement units, and product codes before feature engineering. This pipeline reduced overall missingness to <0.4% and guaranteed a uniform schema across retailers.
Furthermore, an essential step involved synchronizing the Gregorian calendar dates with their corresponding Hijri months using conversion mapping, ensuring temporal consistency across the dataset.
For the two-year horizon, Hijri months were manually aligned with each Gregorian date using the official Moroccan civil calendar to avoid drift from automated converters.
3.2. Feature Engineering
To enhance the predictive capability of the forecasting models, raw data was transformed into a richer set of features. In addition to the original variables, several derived features were constructed as follows:
Seasonal Indicators: Binary and categorical variables were generated to capture seasonal trends and holiday effects.
Lagged Variables: Previous demand values (lags) were incorporated to capture temporal dependencies.
Rolling Averages: Statistics such as moving averages were computed over various time windows to smooth short-term fluctuations.
Interaction Terms: Combinations of the binary promotion indicator with other relevant features were formulated to capture the nuances of promotional impacts.
3.3. Model Selection and Implementation
Three primary forecasting models were considered in this study:
ARIMA: Utilized for its robustness in modeling linear trends and seasonality.
Support Vector Regression (SVR): Chosen for its effectiveness in capturing nonlinear relationships.
Extreme Gradient Boosting (XGBoost): Selected due to its ensemble approach and powerful capability to handle complex feature interactions.
Each model was chosen based on its proven ability to capture various aspects of demand dynamics, including trends, seasonality, and the effects of promotional activities.
3.4. Experimental Setup and Evaluation
Given the temporal nature of the data, a chronological split was adopted for model training and testing. The dataset was partitioned into training, validation, and test sets to facilitate robust evaluation and hyperparameter tuning, the best configuration is reported in
Appendix A. Temporal cross-validation was employed to maintain the sequential integrity of the data. The performance of the forecasting models was quantified using several error metrics:
where
yi and
represent the observed and predicted demand values, respectively.
3.5. Integration of the Predictive Pipeline
A unified predictive pipeline was established to seamlessly integrate all stages of the forecasting process, from data preprocessing and feature engineering to model training and evaluation. This pipeline was implemented using Python, version 3.11 leveraging libraries such as pandas for data manipulation, NumPy for numerical operations, scikit-learn for machine learning tasks, statsmodels for time series analysis, and xgboost for ensemble modeling. This integrated approach not only streamlined the experimental workflow but also ensured reproducibility and scalability in a production environment.
3.6. Future Real-Time Data Integration
At the end of each delivery round (once per day), a secure batch script pulled the day’s transactions through the retailers’ API, applied the data cleaning steps detailed in
Section 3.1, and wrote the results to the central database. Derived features were refreshed immediately. An automatic model retraining job then ran overnight, ensuring that next day forecasts were built on the most recent sales information.
4. Problem Description
Accurate demand forecasting in the dairy industry is inherently challenging due to a number of interrelated factors. Dairy products are highly perishable, which necessitates precise inventory management to minimize waste while still meeting consumer demand. The task is further complicated by pronounced seasonal variability and fluctuations in consumer behavior. When supply chains involve multiple retailers, each with unique demand patterns and promotional strategies, these complexities are magnified, making traditional forecasting methods less effective.
In this study, the forecasting model is developed using a dataset that comprises 250,000 records collected over a two-year period. Each record captures key aspects of demand and incorporates both Gregorian and Hijri calendar data to enhance the modeling of seasonal trends and cultural effects. The dataset contains the following features:
Transaction Date: Recorded over a complete two-year span in the Gregorian calendar.
Client Identifier: A unique identifier for each client.
Product Quantity: The target variable representing the quantity of products purchased.
Product Identifier: A unique identifier for each dairy product.
Binary Promotion Indicator: A flag indicating whether a promotion was active at the time of the transaction.
Hijri Month: The corresponding Hijri month for each transaction, used to capture cultural and seasonal effects.
The integration of both Gregorian and Hijri calendar data is pivotal in capturing seasonality with greater nuance. By leveraging this dual-calendar approach, the model can more accurately address the cyclical patterns and cultural influences that affect demand in a multi-retailer dairy supply chain. This comprehensive dataset and modeling strategy aims to improve the operational efficiency by optimizing inventory levels and reducing product wastage.
5. Our Approach
In this section, we detail the comprehensive methodology employed to address the challenges of demand forecasting in a multi-retailer dairy industry context. The proposed approach integrates innovative data collection methods, robust preprocessing, advanced feature engineering, and an ensemble of forecasting models aimed at capturing the complex dynamics associated with product perishability, seasonal variability, and heterogeneous retailer behaviors.
5.1. Data Collection and Preprocessing
This study utilized a dataset containing 250,000 transactional records collected over two years. Each record comprised the transaction date (recorded in both Gregorian and Hijri calendars), client identifier, product quantity, product identifier, and a binary promotion indicator. Emphasis was placed on synchronizing the Gregorian dates with the corresponding Hijri months to accurately encapsulate cultural and seasonal influences. The preprocessing steps included:
Missing Data Handling: Systematic imputation methods were applied to fill missing values in a manner that preserved underlying distributional properties.
Outlier Detection: Robust statistical techniques were used to identify and mitigate aberrant observations.
Temporal Consistency: Conversion mappings ensured the accurate alignment between the two calendar systems, thereby enhancing the modeling of periodic trends.
5.2. Feature Engineering
To capture the multifaceted nature of dairy demand, several derived features were constructed:
Seasonal Indicators: Binary and categorical variables were generated to represent seasonal patterns, holidays, and culturally significant periods, thus addressing the demand fluctuations due to perishability and local festivities.
Lagged and Rolling Variables: Features reflecting past demand (lagged values) and moving averages over various time windows were included to encapsulate temporal dependencies and smooth transient fluctuations.
Interaction Terms: New features combining the binary promotion indicator with other variables were derived to capture the nuanced effects of marketing actions across different retail settings.
5.3. Forecasting Model Implementation
Three forecasting models were implemented to address different aspects of demand dynamics:
ARIMA: This model was employed to capture linear trends and seasonality. Differencing techniques were applied to achieve stationarity, thereby enabling ARIMA to model the inherent cyclical patterns.
SVR (Support Vector Regression): To model nonlinear relationships that arise from complex consumer behaviors and promotional influences, SVR was implemented using kernel methods. This approach allowed the model to effectively map the high-dimensional feature space.
XGBoost (Extreme Gradient Boosting): Leveraging its ensemble learning frame-work, XGBoost was selected for its ability to capture complex interactions between a vast number of features. Its tree-based structure ensured improved performance in handling heterogeneous data from multiple retailers.
Hyperparameter tuning and time series cross-validation were rigorously applied across all models. Performance was evaluated using statistical metrics such as Mean Absolute Error (MAE), Root Mean Square Error (RMSE), and Mean Absolute Percentage Error (MAPE), ensuring that the selected methods robustly addressed the challenges of forecasting demand in a perishable goods, multi-retailer context.
6. Case Study
In this section, we present a comprehensive case study that applies advanced forecasting methods to a Moroccan dairy company with a multi-retailer distribution network. The primary objective of this study is to enhance demand forecasting for perishable dairy products, thereby optimizing inventory management and reducing waste. This case study investigates how traditional methods such as ARIMA, as well as machine learning techniques like SVR and XGBoost, can be deployed to capture complex temporal dynamics and heterogeneous retailer behaviors.
6.1. Context and Objectives
The dairy industry is characterized by high product perishability and significant seasonal fluctuations. These characteristics necessitate a forecasting framework that effectively accounts for both linear trends and the nonlinear influences of factors such as promotions and cultural events. The objectives of this case study are:
To leverage advanced forecasting models for reliable demand prediction.
To integrate dual-calendar data (Gregorian and Hijri) to more accurately model seasonal and cultural effects.
To optimize supply chain operations across multiple retailers by reducing inventory imbalances and product waste.
6.2. Data Collection and Description
This study utilized a dataset comprising 250,000 transactional records collected over a two-year period. Each record included vital features that enabled a nuanced analysis of demand patterns:
Transaction Date: Recorded in both Gregorian and Hijri calendars to capture seasonality and culturally significant periods.
Client Identifier: A unique code for each client to trace demand variations across different retail channels.
Product Quantity: The target variable indicating the quantity of dairy products purchased.
Product Identifier: Facilitates product-specific forecasting.
Binary Promotion Indicator: Flags periods when promotional activities are active.
This dual-calendar approach ensured that any cyclical trends and cultural influences were appropriately modeled.
6.3. Model Selection and Rationale
Given the inherent complexity of forecasting perishable products in a multi-retailer environment, three forecasting models were chosen:
ARIMA: This model is proficient in capturing linear trends and seasonality via differencing and autoregressive components. It serves as a traditional baseline against which more complex models can be compared.
SVR (Support Vector Regression): By employing kernel functions, SVR addresses nonlinear relationships in the data. This is particularly useful in modeling the fluctuating demand influenced by promotional and external factors.
XGBoost: An ensemble learning method that efficiently handles feature interactions and heterogeneous data. Its ability to model irregular and complex patterns makes it especially suitable for the multi-retailer context.
Together, these models facilitate a robust comparative analysis of forecasting methodologies under the constraints posed by perishable inventory management.
6.4. Data Preprocessing and Feature Engineering
Prior to model implementation, the dataset underwent extensive preprocessing:
Missing Value Imputation: Robust statistical techniques were employed to fill missing values without distorting the underlying data distribution.
Outlier Detection: Statistical methods were used to identify and correct anomalous data points.
Temporal Alignment: Gregorian dates were synchronized with their corresponding Hijri months to ensure consistency in capturing seasonal effects.
Feature engineering further augmented the predictive capability of the models. Key engineered features included:
Seasonal Indicators: Binary and categorical variables were created to delineate seasonal trends and culturally significant holidays.
Lagged Variables and Rolling Averages: These features incorporated past demand values and smoothed transient fluctuations to capture temporal dependencies.
Interaction Terms: New features were defined by combining the binary promotion indicator with other key variables, thereby capturing the compounded effects of promotions on demand.
6.5. Model Implementation and Preliminary Insights
The models were implemented within an integrated predictive pipeline using Python libraries such as pandas, NumPy, scikit-learn, and xgboost. Statistical metrics including Mean Absolute Error (MAE), Root Mean Squared Error (RMSE), and Mean Absolute Percentage Error (MAPE) were used to evaluate performance. For instance, the RMSE was computed as
where
yi and
denote the actual and predicted demand values, respectively.
Preliminary results indicated that while the ARIMA model provided a robust baseline, both SVR and XGBoost demonstrated enhanced capability in capturing the nonlinear effects and high-dimensional interactions present in the data. In particular, XGBoost achieved superior performance across the evaluation metrics, underscoring its suitability for handling the heterogeneity of multi-retailer data.
6.6. Challenges and Contributions to Supply Chain Optimization
Several challenges emerged during the implementation phase:
Data Heterogeneity: Differences in data quality and completeness across retailers required comprehensive preprocessing and rigorous validation.
Model Calibration: The dynamic nature of consumer behavior necessitated the continuous recalibration of model parameters to maintain forecasting accuracy.
An automated dashboard now executes these retailer-level checks before each weekly model update, guaranteeing consistent input quality. Despite these challenges, the integrated forecasting approach significantly contributes to supply chain optimization in the dairy industry. Accurate demand predictions facilitate better inventory control, minimize perishable waste, and ensure appropriate resource allocation across different retail outlets. This, in turn, enhances customer satisfaction and overall operational efficiency.
Summary
This case study illustrates the practical application of advanced forecasting methods to addressing the complex challenges inherent to the dairy supply chain. By integrating robust data preprocessing, sophisticated feature engineering, and state-of-the-art forecasting models, this study provides actionable insights that support strategic decision making in multi-retailer environments.
7. Results
This section presents the empirical results obtained from applying three forecasting models—ARIMA, SVR, and XGBoost—on the dairy demand dataset. The evaluation was performed using key performance metrics, namely Mean Absolute Error (MAE), Root Mean Squared Error (RMSE), and Mean Absolute Percentage Error (MAPE).
7.1. Experimental Outcomes
Experiments were conducted on a dataset comprising 250,000 transactional records over a two-year period. Time series cross-validation was used to ensure that the temporal order of data was preserved during training and testing. The following summarizes the key observations:
ARIMA: Provided a robust baseline by effectively capturing linear trends and seasonality but struggled with nonlinear variations.
SVR: Improved on the baseline performance by modeling nonlinear relationships; however, it showed greater variability under certain conditions.
XGBoost: Emerged as the most effective model, achieving the lowest error metrics, likely due to its advanced ensemble learning capabilities which capture complex interactions among features.
7.2. Performance Metrics
The performance of the three models was quantified using MAE, RMSE, and MAPE. The formulas used for these metrics are given below:
Table 2 summarizes the performance results for each model.
7.3. Comparative Discussion
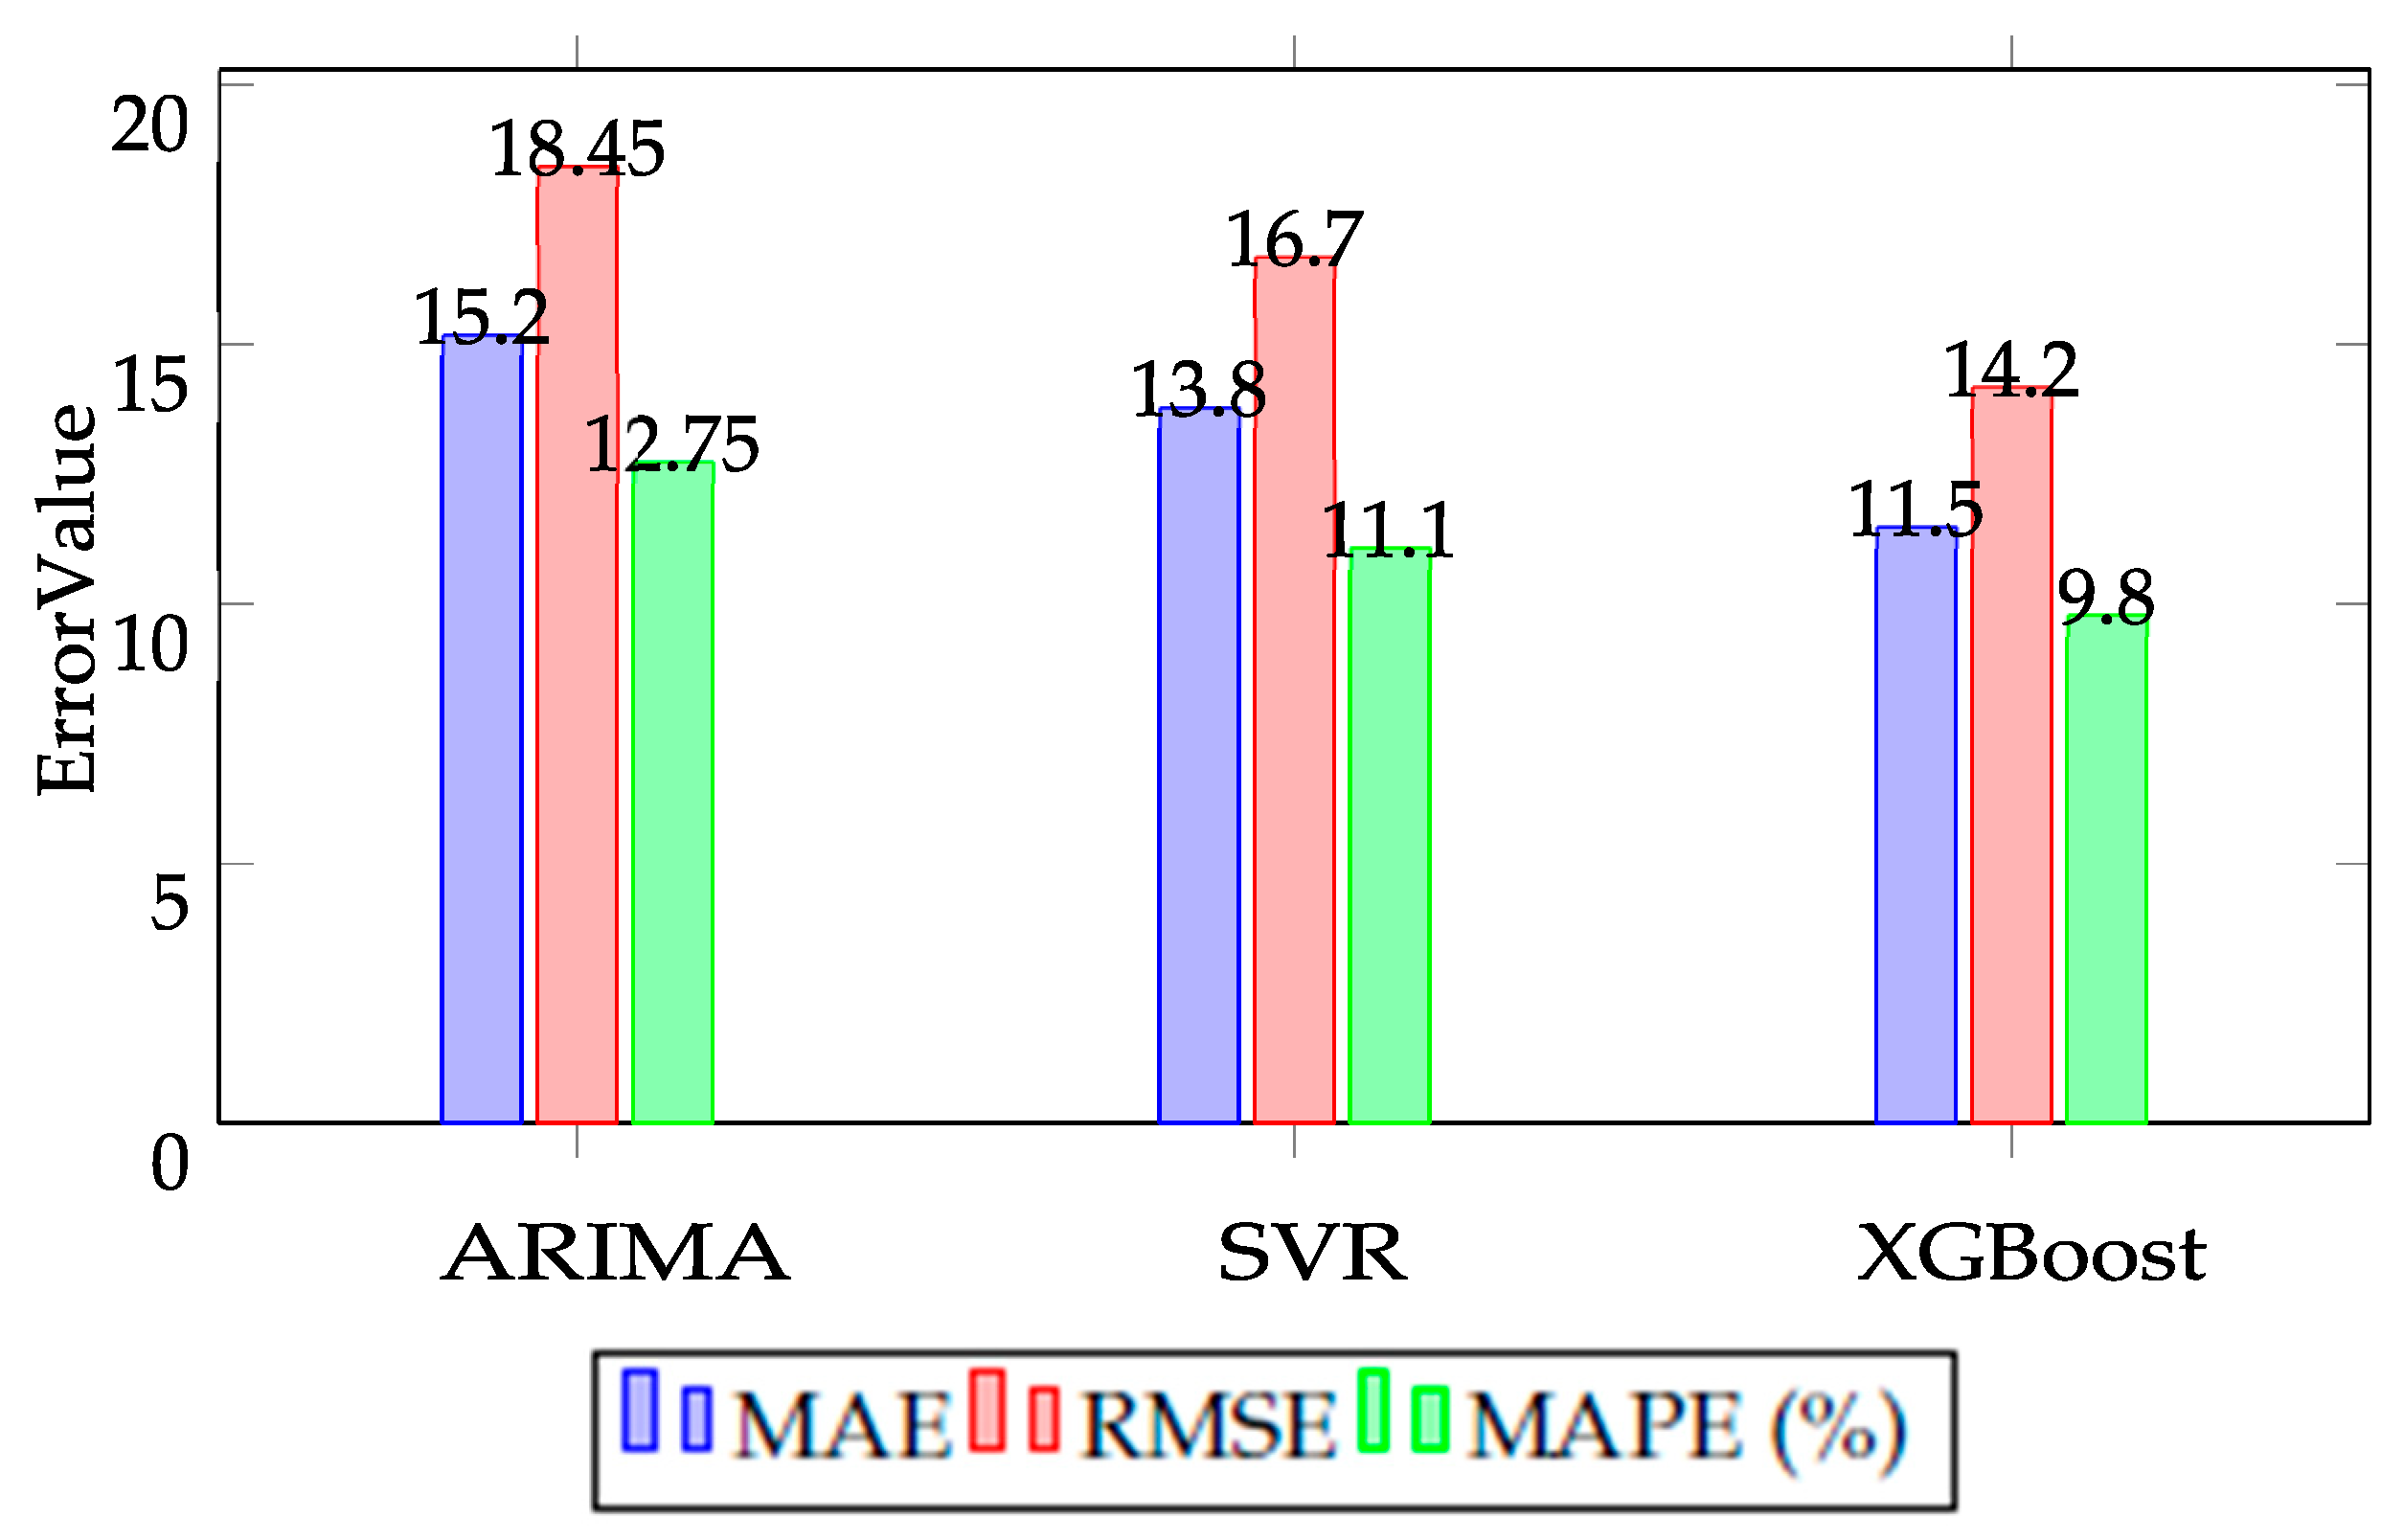
The results indicate that while the ARIMA model effectively captures linear patterns and seasonality, its performance is limited in handling complex, nonlinear relationships. The SVR model shows improvements in these areas, though it tends to exhibit higher variability in its predictions. XGBoost, on the other hand, outperforms both ARIMA and SVR, achieving superior accuracy across all stated metrics. This comparative analysis suggests that ensemble learning methods like XGBoost are particularly well suited to the heterogeneous and seasonal characteristics present in the multi-retailer dairy context.
Adding the dual-calendar features cut MAPE by about 1.3 percentage points compared with using Gregorian dates only—
Figure 1.
7.4. Figures and Additional Analyses
Figure 1 provides a visual representation of the forecasting errors across the three models. A more granular analysis of these errors reveals significant performance variations across different segments. Milk exhibits the largest spread (MAPE 11.2%, MAE 1.15, RMSE 1.46), driven by recurrent under-prediction in midsummer. Cheese remains the most predictable (MAPE 8.0%). Urban hypermarkets achieve the lowest retailer-level MAPE (8.5%), whereas mixed rural shops rise to 12%. Seasonally, mean milk MAPE doubles from 6.5% in winter to 13% in July–August. These patterns confirm that targeted, season-aware recalibration is required for fresh milk routes and rural retailers.
8. Conclusions
This study has presented an advanced forecasting framework tailored to the unique challenges of the Moroccan dairy industry, which is characterized by multi-retailer distribution, perishable products, and pronounced seasonal variability captured through both the Gregorian and the Hijri calendars. By integrating robust data preprocessing, comprehensive feature engineering, and the implementation of three distinct forecasting models—ARIMA, SVR, and XGBoost—we were able to evaluate and compare their effectiveness in predicting dairy demand.
Our experimental results demonstrate that while traditional methods such as ARIMA provide a reliable baseline and SVR offers improved handling of nonlinearities, the XGBoost model consistently outperforms both in terms of forecast accuracy. Lower error metrics (MAE, RMSE, and MAPE) observed with XGBoost confirm its robustness in capturing complex interactions and nonlinear dynamics inherent in heterogeneous, multi-retailer datasets. This enhanced predictive performance directly contributes to better inventory management and a reduction in product waste, which are critical for managing perishable goods in the dairy supply chain.
Moreover, the practical implications of these findings are significant for supply chain optimization in emerging markets like Morocco. Improved forecasting leads to more efficient resource allocation, minimized excess inventory, and heightened service levels across diverse retail channels. The dual-calendar approach further enriches the model by ensuring cultural and seasonal effects are adequately represented, providing dairy companies with actionable insights to adapt to local demand variations.
Despite these promising results, this study acknowledges certain limitations such as data heterogeneity and the need for continual model recalibration due to evolving consumer behavior. Future research should explore hybrid modeling approaches that combine the strengths of both statistical and machine learning techniques, incorporate additional external variables (e.g., economic indicators, weather data), and investigate real-time forecasting solutions to further enhance demand prediction accuracy and scalability in dynamic environments.
Future work will deploy the daily post delivery data flow described in
Section 3.6, further tightening the learn-and-act cycle.
In summary, the application of advanced forecasting techniques—most notably XGBoost—demonstrates considerable potential for improving demand prediction, optimizing supply chain operations, and reducing waste in the dairy industry. These contributions not only elevate operational efficiency but also offer a strategic pathway for enhancing competitiveness in emerging markets.
Author Contributions
Conceptualization, A.M. and A.S.; methodology, A.M., S.F., J.L. and A.S.; software, A.M. and S.F.; validation, A.M., S.F., J.L. and A.S.; formal analysis, A.M.; data curation, A.M., S.F. and J.L.; writing—original draft preparation, A.M. and S.F.; writing—review and editing, J.L. and A.S.; supervision, A.S. All authors have read and agreed to the published version of the manuscript.
Funding
This research received no external funding.
Institutional Review Board Statement
Not applicable.
Informed Consent Statement
Not applicable.
Data Availability Statement
The data presented in this study are not publicly available due to confidentiality agreements with the partner company. The data were used under license for the current study and are not authorized for distribution.
Conflicts of Interest
The authors declare no conflict of interest.
Appendix A. Hyper-Parameter Optimization Results
This appendix provides a detailed overview of the hyper-parameter optimization results for the forecasting models used in this study. The configurations were selected using Optuna with 100 trials and five-fold time series cross-validation. The results are presented separately for ARIMA, SVR, and XGBoost to ensure clarity and reproducibility.
Table A1.
Best hyper-parameter configuration for ARIMA.
Table A1.
Best hyper-parameter configuration for ARIMA.
| Model | Parameters |
|---|
| ARIMA | (p,d,q) = (2,1,2) |
Table A2.
Best hyper-parameter configuration for SVR.
Table A2.
Best hyper-parameter configuration for SVR.
| Model | Parameters |
|---|
| SVR | C = 10, ϵ = 0.1 |
Table A3.
Best hyper-parameter configuration for XGBoost.
Table A3.
Best hyper-parameter configuration for XGBoost.
| Model | n_estim. | max_depth | lr |
| XGBoost | 720 | 6 | 0.07 |
| Model | subsample | colsample | min_child_w. |
| XGBoost | 0.9 | 0.8 | 3 |
| Model | | | gamma |
| XGBoost | | | 0.0 |
References
- OCDE/FAO. Dairy and Dairy Products. In OECD-FAO Agricultural Outlook 2020–2029; Éditions OCDE: Paris, France, 2020. [Google Scholar] [CrossRef]
- Visioli, F.; Strata, A. Milk, dairy products, and their functional effects in humans: A narrative review of recent evidence. Adv. Nutr. 2014, 5, 131–143. [Google Scholar] [CrossRef] [PubMed]
- Sraïri, M.T.; Benyoucef, M.T.; Kraiem, K. The dairy chains in North Africa (Algeria, Morocco and Tunisia): From self sufficiency options to food dependency? SpringerPlus 2013, 2, 162. [Google Scholar] [CrossRef] [PubMed]
- Akkerman, R.; Farahani, P.; Grunow, M. Quality, safety and sustainability in food distribution: A review of quantitative operations management approaches and challenges. OR Spectr. 2010, 32, 863–904. [Google Scholar] [CrossRef]
- Grunert, K.G. (Ed.) Consumer Trends and New Product Opportunities in the Food Sector; Wageningen Academic Publishers: Wageningen, The Netherlands, 2017. [Google Scholar]
- Babai, M.Z.; Ali, M.M.; Boylan, J.E.; Syntetos, A.A. Forecasting and inventory performance in a two-stage supply chain with ARIMA (0, 1, 1) demand: Theory and empirical analysis. Int. J. Prod. Econ. 2013, 143, 463–471. [Google Scholar] [CrossRef]
- Syntetos, A.A.; Babai, Z.; Boylan, J.E.; Kolassa, S.; Nikolopoulos, K. Supply chain forecasting: Theory, practice, their gap and the future. Eur. J. Oper. Res. 2016, 252, 1–26. [Google Scholar] [CrossRef]
- Ghadge, A.; Er Kara, M.; Moradlou, H.; Goswami, M. The impact of Industry 4.0 implementation on supply chains. J. Manuf. Technol. Manag. 2020, 31, 669–686. [Google Scholar] [CrossRef]
- Drake, M.; Marley, K. Chapter Century of the EOQ. In Handbook of EOQ Inventory Problems (Stochastic and Deterministic Models and Applications); Springer: Berlin/Heidelberg, Germany, 2014. [Google Scholar]
- Ali, M.M.; Boylan, J.E.; Syntetos, A.A. Forecast errors and inventory performance under forecast information sharing. Int. J. Forecast. 2012, 28, 830–841. [Google Scholar] [CrossRef]
- Rana, R.S.; Kumar, D.; Prasad, K. Sustainable production-inventory system for perishables under dynamic fuel pricing and preservation technology investment. Environ. Sci. Pollut. Res. 2023, 30, 90121–90147. [Google Scholar] [CrossRef]
- Poore, J.; Nemecek, T. Reducing food’s environmental impacts through producers and consumers. Science 2018, 360, 987–992. [Google Scholar] [CrossRef]
- Thorsøe, M.; Noe, E.; Maye, D.; Vigani, M.; Kirwan, J.; Chiswell, H.; Grivins, M.; Adamsone-Fiskovica, A.; Tisenkopfs, T.; Tsakalou, E.; et al. Responding to change: Farming system resilience in a liberalized and volatile European dairy market. Land Use Policy 2020, 99, 105029. [Google Scholar] [CrossRef]
- Soysal, M.; Bloemhof-Ruwaard, J.M.; Haijema, R.; Van Der Vorst, J.G. Modeling an inventory routing problem for perishable products with environmental considerations and demand uncertainty. Int. J. Prod. Econ. 2015, 164, 118–133. [Google Scholar] [CrossRef]
- Chen, T.; Guestrin, C. Xgboost: A scalable tree boosting system. In Proceedings of the 22nd ACM SIGKDD International Conference on Knowledge Discovery and Data Mining, San Francisco, CA, USA, 13–17 August 2016; pp. 785–794. [Google Scholar]
- Smola, A.J.; Schölkopf, B. A tutorial on support vector regression. Stat. Comput. 2004, 14, 199–222. [Google Scholar] [CrossRef]
- Hyndman, R.J.; Athanasopoulos, G. Forecasting: Principles and Practice, 2nd ed.; Otexts: Melbourne, Australia, 2018. [Google Scholar]
- Makridakis, S.; Spiliotis, E.; Assimakopoulos, V. Statistical and Machine Learning forecasting methods: Concerns and ways forward. PLoS ONE 2018, 13, e0194889. [Google Scholar] [CrossRef] [PubMed]
- Aamer, A.; Eka Yani, L.; Alan Priyatna, I. Data analytics in the supply chain management: Review of machine learning applications in demand forecasting. Oper. Supply Chain. Manag. Int. J. 2020, 14, 1–3. [Google Scholar] [CrossRef]
- Khasanah, A.U.; Lin, W.H.; Kuo, R.J. Self-Organizing Maps with Support Vector Regression for Sales Forecasting: A Case Study in Fresh Food Data. In Proceedings of the Institute of Industrial Engineers Asian Conference 2013; Springer: Singapore, 2013; pp. 649–656. [Google Scholar]
- Amachraa, A.; Quelin, B. Morocco Emergence in Global Value Chains: Four Exemplary Industries; Policy Center for the New South: Salé, Morocco, 2022. [Google Scholar]
- Mor, R.S.; Jaiswal, S.K.; Singh, S.; Bhardwaj, A. Demand forecasting of the short-lifecycle dairy products. In Understanding the Role of Business Analytics: Some Applications; Springer: Berlin/Heidelberg, Germany, 2019; pp. 87–117. [Google Scholar]
- Hochreiter, S. Long Short-Term Memory; Neural Computation MIT-Press: Cambridge, MA, USA, 1997. [Google Scholar]
- Taylor, S.J.; Letham, B. Forecasting at scale. Am. Stat. 2018, 72, 37–45. [Google Scholar] [CrossRef]
- Ke, G.; Meng, Q.; Finley, T.; Wang, T.; Chen, W.; Ma, W.; Ye, Q.; Liu, T.Y. Lightgbm: A highly efficient gradient boosting decision tree. Adv. Neural Inf. Process. Syst. 2017, 30, 3149–3157. [Google Scholar]
- Hajirahimi, Z.; Khashei, M. Hybridization of hybrid structures for time series forecasting: A review. Artif. Intell. Rev. 2023, 56, 1201–1261. [Google Scholar] [CrossRef]
- Khashei, M.; Bijari, M. A new class of hybrid models for time series forecasting. Expert Syst. Appl. 2012, 39, 4344–4357. [Google Scholar] [CrossRef]
| Disclaimer/Publisher’s Note: The statements, opinions and data contained in all publications are solely those of the individual author(s) and contributor(s) and not of MDPI and/or the editor(s). MDPI and/or the editor(s) disclaim responsibility for any injury to people or property resulting from any ideas, methods, instructions or products referred to in the content. |
© 2025 by the authors. Licensee MDPI, Basel, Switzerland. This article is an open access article distributed under the terms and conditions of the Creative Commons Attribution (CC BY) license (https://creativecommons.org/licenses/by/4.0/).


