2. Literature Review
The Quality Function Deployment (QFD) technique originated in Japan in 1972 [
13]. Through QFD, a systematic method was developed to transform the voice of customers through various product planning, design, and manufacturing stages to achieve higher customer satisfaction [
14].
This method can also be used as a design and problem-solving tool [
15]. The QFD technique consists of a matrix of four consecutive stages that are used in many phases of the product design process [
16]. A three-phase version of the technique, adapted for logistics applications, can also be used to develop and control logistics strategies [
5].
The matrix used to design customer requirements is called the “House of Quality” (HOQ) [
17] which is taken as a starting point for the joint applicability of QFD and BSC.
The Balanced Scorecard [
18] is a strategic corporate governance and performance measurement method based on a balanced set of objectives and performance indicators. The basic premise of the BSC model [
19] is that the performance of one business area has an impact on the results of other areas. It approaches organizational performance from four perspectives and organizes it into a coherent, logical system [
20].
The four aspects are as follows:
The corporate aspect relates to the company’s performance and profit orientation;
The customer aspect—the product should be accessible and affordable;
The internal organizational business process aspect refers to processes that support the achievement of strategic goals;
The learning and development aspect, namely, how to maintain the company’s evolving capability to achieve future goals.
This method helps to highlight the interrelationship between the four aspects, making it accessible to different departments. The BSC system can be used to articulate the vision and strategy of the organization clearly and unambiguously and translate it into tangible and measurable objectives [
21]. It has the advantage of helping with planning, setting priorities, and enabling continuous monitoring [
22].
The Key Performance Indicator (KPI) is a metric [
23] that measures a company’s performance and through which the company’s results can be compared with those of its competitors. The KPI is based on data measured in each department, with the main categories being financial, consumer, process, and other (human, etc.) performance indicators [
24]. A brief comparison is presented to clarify which corporate performance measurement method can be used to develop sustainable logistics strategies.
As
Table 1 shows, the BSC method [
25] allows for a far more comprehensive analysis of the company’s objectives, as the interrelationships between the individual objectives of the company are much more emphasized in the application of BSC. This publication aims to support the development of logistics strategies for the company by considering not only customer expectations but also the company’s financial expectations and internal processes. It also aims at learning and development; that is, the sustainability of the company’s logistics strategy. Therefore, in this publication, the BSC method has been chosen as a complement to the QFD technique.
Knowledge Background Analyses
For the common use of QFD and BSC, the knowledge background in Science Direct, Scopus, and Web of Science databases was investigated. To narrow down the list of publications, the keywords QFD and BSC were used, supplemented with the keywords logistics and strategy to identify publications on the topic (
Table 2).
The publications in the databases were examined for articles published in the last 5 years, namely 2019–2024. This covers 5 full years, as there are still very few publications in 2024. Then, the database of publications from the 15 years preceding 5 years, i.e., 2004–2018 (covering 15 full years), was also looked at to see the direction in which research on a topic has developed.
The resulting publications were analyzed using VOSviewer, a visualization text mining tool that draws different graphs and bibliometric maps of the keywords in the corpus using different statistical methods [
12]. VOSviewer can be used to explore the relationship between the keywords in the corpus. The program scores keywords by relevance (relevance score) using statistical methods and visualizes the relationships between them based on their strength [
26].
For the visualization with VOSviewer, only data imported from the Scopus database was used, as this is the database where most of the publication abstracts and keywords are available and, therefore, the most relevant scientific database for the analysis with VOSviewer.
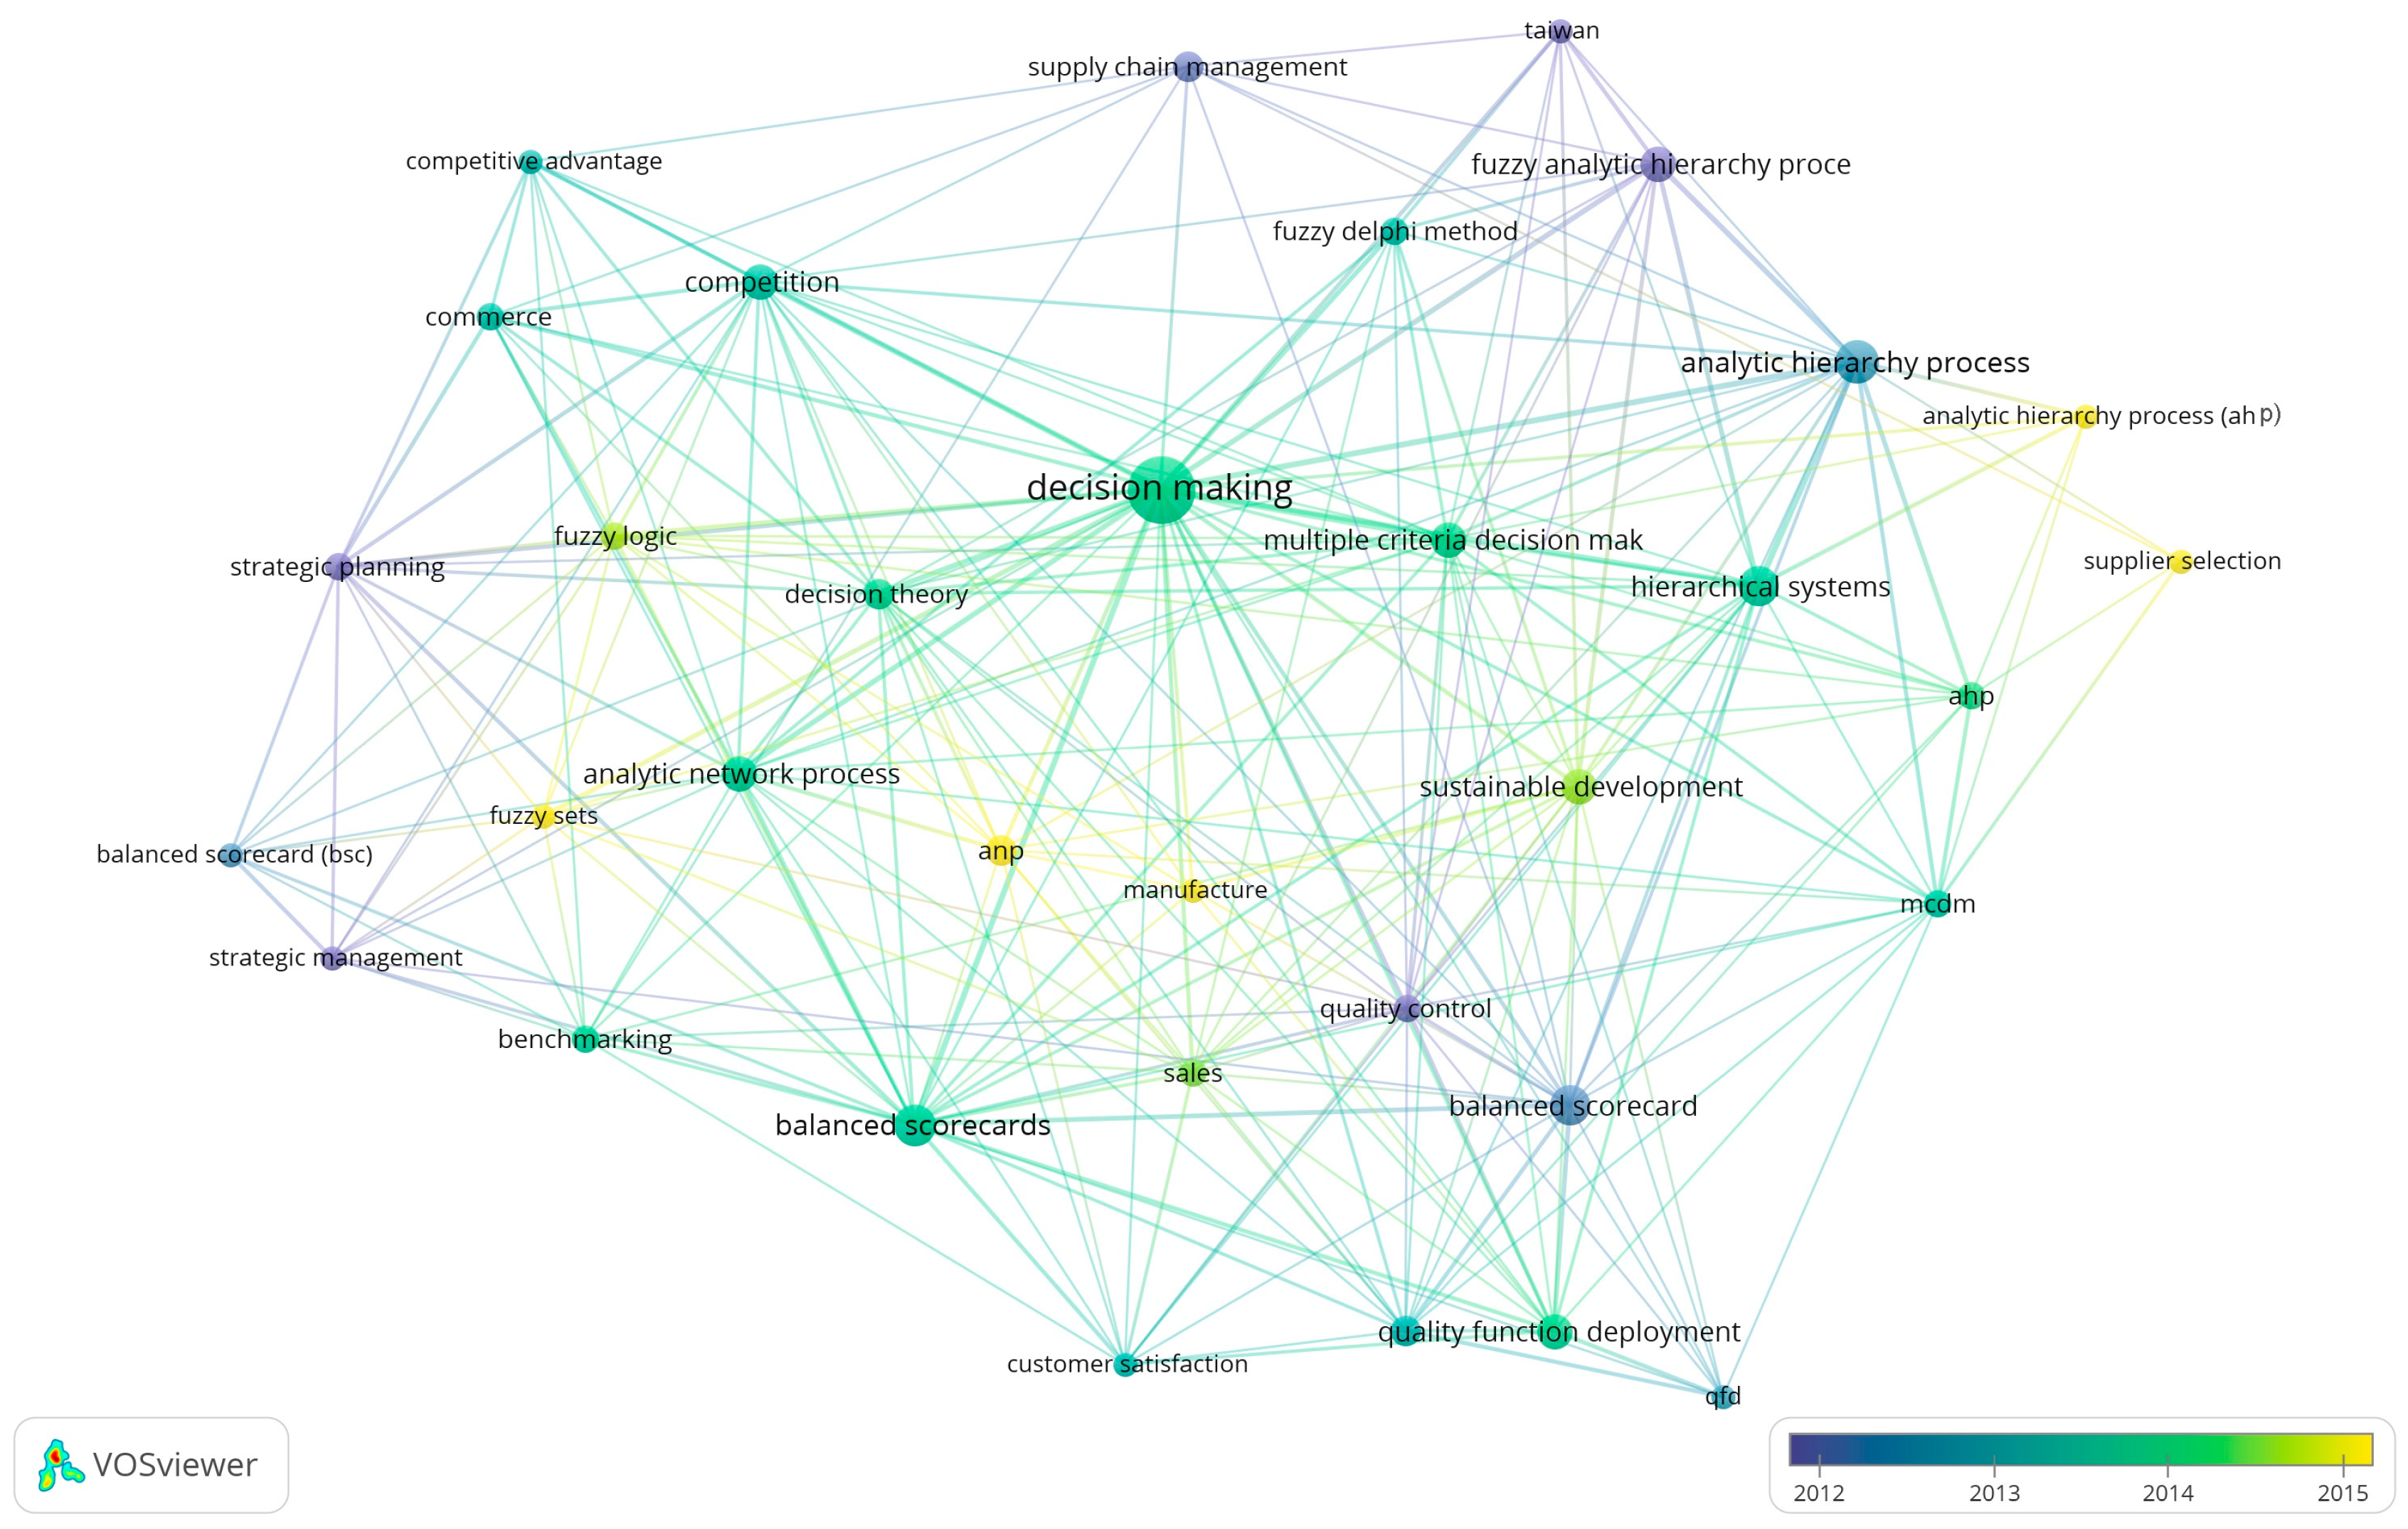
Both
Figure 1 and
Figure 2 focus on decision-making and several popular decision support methods (AHP, MCMD, QFD, Fuzzy) are also shown. However,
Figure 1 shows that after 2020, sustainability and sustainable development have been introduced and supply chain management is directly linked to them, suggesting that practitioners have recognized that in order to achieve sustainability in logistics strategy, it is not only important to measure performance.
The topics for which publications have been written that are considered more relevant to this research are briefly described below:
- (a)
Construction project management [
27].
They propose a structure that can be used to manage construction projects efficiently and thus reduce delays. The Balanced Scorecard (BSC) and Quality Function Deployment (QFD) framework proposed in this study enabled the identification and prioritization of financial plan objectives and construction delay reduction.
- (b)
Ranking of economic indicators [
28].
The BSC core framework has an added supplier aspect, a four-phase Quality Function Deployment (QFD), and economic GRI priorities. Finally, the results of the QFD were used in the TOPSIS (Technique for Order of Preference by Similarity to Ideal Solution) technique to rank the economic indicators.
- (c)
Examination of employee expectations [
29].
This study attempts to explore the factual expectations of employees using the Balance Scorecard (BSC) approach. Furthermore, the relationship between employers’ expectations and the requirements needed to meet those expectations is also determined using Quality Function Deployment (QFD).
- (d)
Financial targets for the pavement management sector [
30].
The results of the QFD-BSC analysis are studied using the fishbone diagram and causal analysis to graphically illustrate how the four perspectives’ significant factors lead to better financial targets in the pavement management industry.
- (e)
This publication developed a comprehensive healthcare model using the Kano model, Quality Function Deployment (QFD), and the Balanced Scorecard (BSC) to simultaneously reduce costs, improve quality, improve patient satisfaction, and increase hospital profitability.
- (f)
An extended Product Planning House of Quality (PPHOQ) using the Least Deviation Based Approach (LDBA) and the Balanced Scorecard (BSC) was proposed. They develop a comprehensive and systematic approach to determine the aggregate PR of engineering characteristics in the extended PPHOQ.
- (g)
Strategic map for business development [
33].
To identify and prioritize the business’s development needs, a strategic map is drawn up that combines the BSC’s management principles with quality principles from the Malcolm Baldridge National Quality Award and the European Foundation for Quality Management. An implementation methodology to support its application in a specific enterprise is implemented using the Quality Function Deployment (QFD) quality planning tool.
- (h)
For performance measures based on financial management [
34].
It proposes a structured methodological approach based on the Quality Function Deployment (QFD) methodology to improve the implementation of the Balanced Scorecard methodology in individual organizations, based on traditional financial management performance measures.
- (i)
Analysis of educational criteria [
35].
This publication analyses the educational criteria for strategy development in vocational education and training. The methodology of the proposed framework is to combine the SWOT matrix and the Balanced Scorecard (BSC) by identifying the four critical success perspectives using the quality function development (QFD) methodology.
This list shows some publications that have been written suggesting the joint use of BSC and QFD. However, no publication was found that specifically advocated the structured planning of logistics strategies.
3. Methodology: Extended QFD with BSC Methodology
BSC was chosen because it examines expectations from 4 different perspectives [
7]. Combined with QFD [
36], it provides the opportunity to not only “translate” the voice of the customer, but also to keep the interests of the company in mind, at the same time allowing for the examination of internal process expectations and sustainability.
In other words, the development of Extended QFD provides a methodology to formulate the different requirements in a structured way; that is, to define how strategic directions, as expectations of customers, companies, internal organizational business processes, and learning and development objectives, vary for each product range produced by each company. The methodology will be used to show that, unlike basic QFD, different aspects can be examined here. This is because the methodology, using QFD and BSC together, can be used to draw up a corporate strategy, which can help visualize the relationships between the expectations expressed by the different aspects and the contrasts. These contradictions may not be resolved, but they can help in the decision-making process.
Using the Extended QFD method, we did not consider the sustainability in the classical context [
37], but the long-term sustainability of a company. However, all three dimensions of sustainability [
37] are included in this methodology:
Economic: concerns about the economy often cause conflict between disciplines, which requires a “trade-off” [
38]. This means, for example, trying to find a balance between the requirements of the economic department and the logistics services [
39].
Social: a reliable, resilient company with long-term planning provides its employees with security and predictability [
40].
Environmental: if a company is sustainable, it can plan for the long term with equipment, machinery, etc., the replacement of which mostly generates waste [
41]. A learning and growth approach also means innovative solutions, which often means energy efficiency and purchasing sustainable equipment.
Thus, sustainability has been used in interpreting companies’ logistics strategies, but its dimension is more emergent in the methodology. After all, having a predictable, reliable, and sustainable strategy supports both economic and environmental goals as well as overall social goals. Thus, each of the three dimensions of sustainability is included in developing a sustainable logistics strategy.
To use BSC and QFD together,
Table 3 has been created, in which the parameters that appear in the field of logistics strategy have been added to the BSC 4 approach, the list of which reflects our own opinion and may vary depending on the company culture and product area.
As the developed Extended QFD is a methodology, the technical and organizational elements that may arise in the logistics strategy of a product and may have similar importance have been added to the list of logistics parameters in this publication.
For the logistics parameters in
Table 3 and
Table 4, some information is provided for clarity. There is an obvious conflict of interest regarding order quantity, since the company is basically interested in switching production to another product as few times as possible, while the customer wants to be able to order as much as they need.
Therefore, economic batch sizes can be presented differently from the customer’s and the financial (company) point of view, as the importance of economic batch sizes for both parties differs. It is suitable for the customer to order a lot of units, but, in this case, the company needs to keep stock or produce smaller units, so it has to readjust the machines each time. For the company, it is better to have larger orders, which it can deliver to the customer immediately after production, so it does not need to hold stock and the number of changeovers can be kept low.
The degree of customer focus of the communicated, ordered unit of measure depends on several factors. For example, whether the customer is either ‘dictated’ by the market, meaning that a product is produced where there are several competing firms to compete with, or whether the product is so specialized that quantity requirements can be imposed on the customer in terms of order. Therefore, in Extended QFD, the customer’s aspect is called free defined order size, which means that the customer can order 1 piece and several pieces at the same time. Financial (company) in terms of LOT size designation is used in this article since the batch size has a significant impact on inventory and also on changeovers.
The internal processes perspective includes logistics parameters that have an impact on the internal processes of the company, such as keeping lead time, constant supply, and quality.
Learning and growth refer to the long-term development and sustainability of the company, which means that the aim is to develop a logistics strategy that enables the company to stay in the market. These parameters can be defined in the Extended QFD diagram with the indicators expansion, productivity improvement, contract time (long term), and constant customer base. Productivity improvement can be measured year by year. In addition, the contract’s length determines the company’s ability to be present in the market. This can be measured by the percentage of capacity that is linked to long-term contracts. Constant customer base, on the other hand, is measured by the percentage of customers that change in 1 year. It is also a predictor of how loyal customers are, as a secure customer base makes a company sustainable.
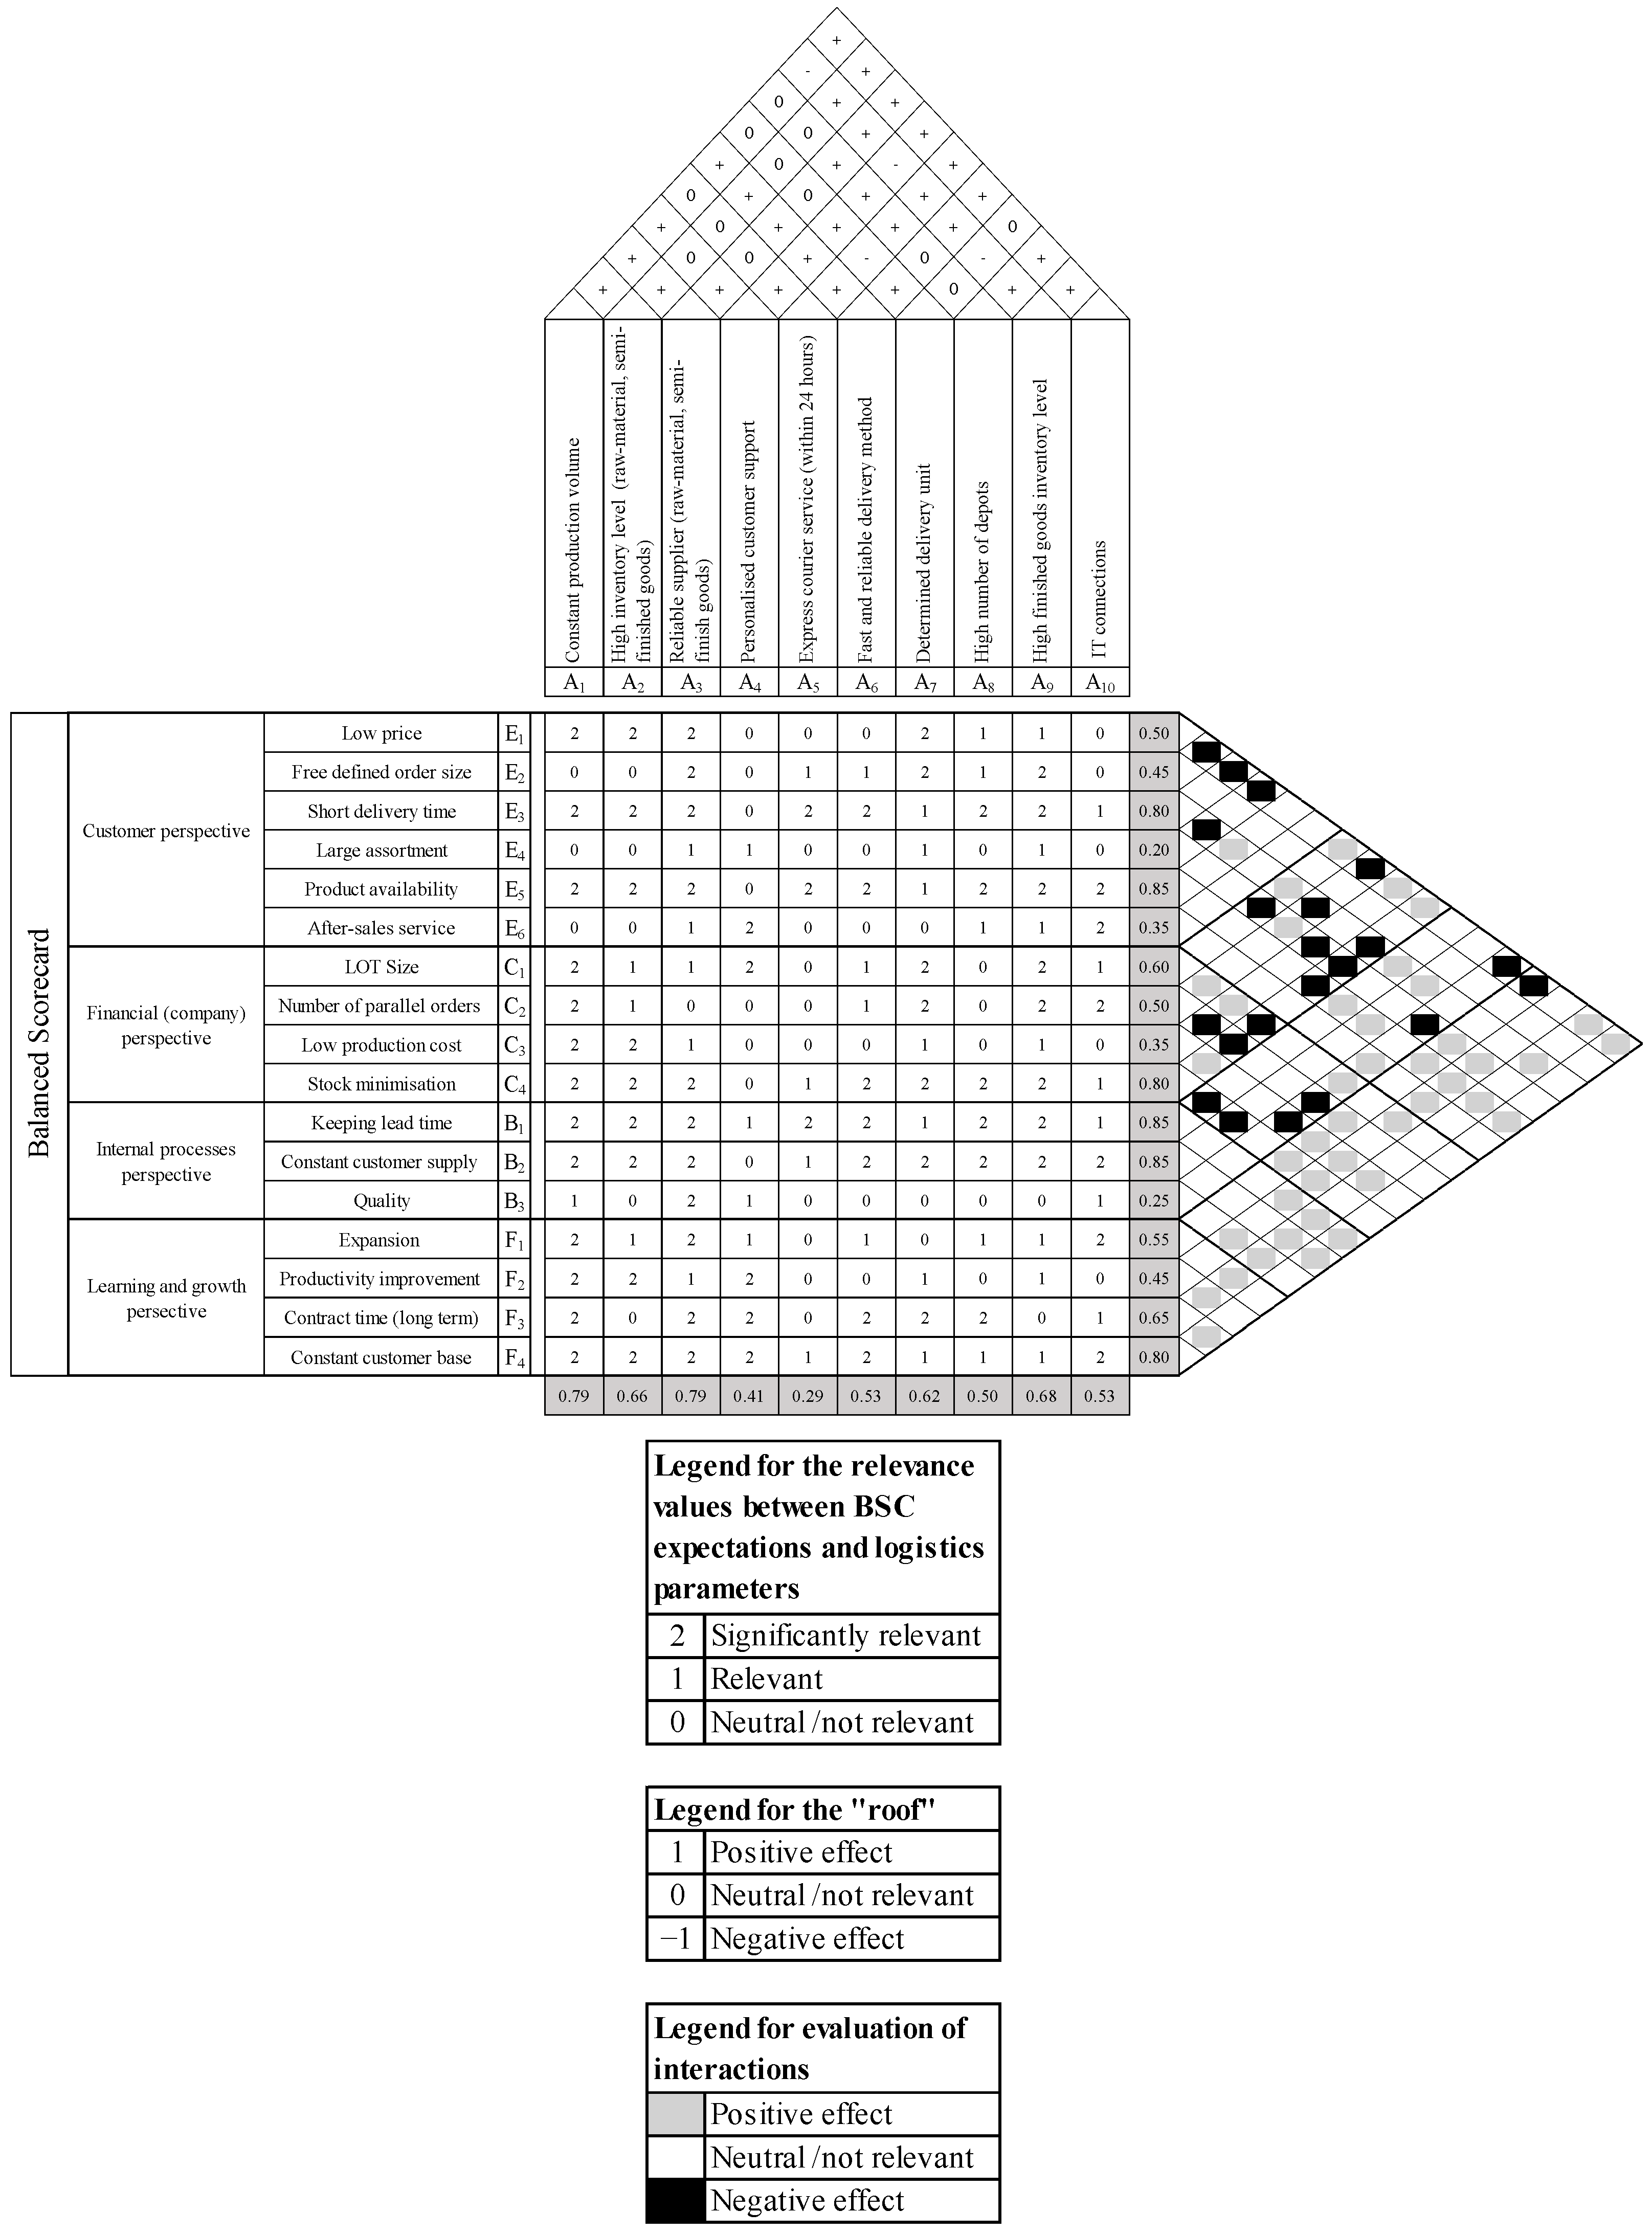
In connection with the joint use of the Balanced Scorecard and Quality Function Deployment, we created a diagram called Extended QFD (
Figure 3 and
Table 5), which was used to combine the strategic indicator system represented in BSC with the QFD technique.
The BSC technique separately examines customer expectations, the company’s approach to financial and internal processes, and the activities that promote the company’s development, which means it strives for balance. The Extended QFD methodology developed combines the BSC technique with QFD to show where there are inconsistencies. For this purpose, the logistic requirements that can be defined according to the BSC structure are shown on the right-hand side of the matrix. For this example, general logistics-related expectations have been collected that are common to the expectations of customers and the company; they may vary depending on the product and the company culture.
In the legend of
Table 6, it can be seen that in the Extended QFD, the relevance of the expectations collected from the BSC is first investigated with the logistic parameters. The values 0,1, and 2 have been used in the analysis, where 2 means that the expectation and the logistic parameter have a significant impact on one another for the product under consideration, 1 means that they have a moderate impact on each other, and 0 is neutral; that is, not relevant for the present product. In the present examples, with regard to the interaction effects, the logistic parameter has not been examined to determine whether it has a positive or negative impact on the expectation.
In the triangle at the top of the House of Quality, the interaction between the available logistical technical and service elements has been examined, with the legend in
Table 5.
In this paper, the analysis of the values in the roof has not been performed, as the relevance of the expectations set by the BSC is focused on the logistic parameters, and therefore, the “inside” of the QFD provides the basis for the analysis.
Example products have been produced for the use of the Extended QFD system developed (
Appendix A and
Appendix B). The symbol explanation in
Table 7 relates to the analysis of the interrelationship between the logistics-related requirements in BSC.
The example products show that if a logistics strategy is developed and then BSC is to be introduced, it becomes clear that the same indicators cannot be set by the corporate leadership towards the management because of the different nature of the product. The chosen products are as follows: Example 1—toothpaste (
Appendix A); Example 2—mainframe computer (
Appendix B).
3.1. Example 1
To demonstrate the methodology, the first example product (
Appendix A) is toothpaste, a mass-produced product that should be available to consumers anywhere, anytime. It requires a push logistics strategy with a short lead time.
In terms of toothpaste, price (E1) and constant production volume (A1) take a value of 2. This means that price has a significant influence on production volume. For example, if there is a sudden price increase, demand is likely to fall, so continuous production will only increase the inventory. Conversely, if there is a price decrease, this is likely to generate higher demand.
Where most 1s are included, the parameters have a moderate impact on each other. For example, after-sales service (E6) and reliable raw materials and semi-finished goods suppliers (A3) influence each other. This is because the after-sales service can handle a customer complaint and quickly provide another product if it knows that the supply of raw materials and semi-finished goods is dynamic, i.e., it will not affect the constant production volume.
Where they take a value of 0, the elements do not affect each other, so no particular change is necessary for this product. For toothpaste, both free defined order size (E2) and personalized customer support (A4) are set to 0 because, for a mass product, it is possible to purchase both small and large quantities, and the product is available in a wide range, eliminating the need for personalized customer support.
3.2. Example 2
The example product (
Appendix B) is the mainframe computer, a custom-built, high-end product. It requires a pull logistics strategy and, because of its specificity, usually has a long lead time.
In the case of Example 2, it can be seen that the parameters take on a completely different value during the relevance test than in the case of the product in Example 1. The values are determined, taking into account the specificity of the product in each case. For example, the price (E1) and the constant production volume (A1) for the mainframe computer take the value 0. As this is a unique product with a high price range, constant production is not usually a feature and, therefore, does not affect the price.
The after-sales service (E6) and the reliable raw-material, semi-finished goods supplier (A3) also have an impact here, taking the value 1. For this product, the relationship between after-sales service (E6) and reliable raw-material, semi-finished goods supplier (A3) is significant because, in the event of a failure of a high-price category product, the supply of spare parts must be ensured, and this is only possible if the firm has a reliable supplier.
For the mainframe computer, free defined order size (E2) and personalized customer support (A4) took 2 values. As it is a product with unique specializations, usually with an order unit of 1, the customer’s desire to buy, for example, 6 products at a time, is likely to require personalized customer support. This is because, in order to ensure that all 6 products have the same specifications in terms of hardware and software, it is also necessary to agree on how long it will take to produce this quantity, given the expected requirements, and how it will be installed.
3.3. Comparison of Example 1 and Example 2
After the relevance examination, the results of the columns (n) and the rows (m) should also be examined.
For columns (n), the current analysis is based on the importance of a given logistical technical parameter for the realization of the expectations set by BSC.
For Example, with 1, which is toothpaste, the constant production volume (A1) shows a value of 0.79. This means that this logistical parameter is very important for each of our desires in BSC because, as a mass product, the expectations of the customer and the company in terms of financial, process, and development can only be met if the company can produce continuously. If a mass-produced product is not available continuously, the customer will not be satisfied because they will not be able to buy the product anywhere. In addition, the company will not be able to stick to its targets, e.g., low production cost, keeping lead time, etc.
For Example 2, the mainframe computer, the constant production volume (A1) shows a value of 0.21. This means that the constant production volume is not relevant for a product made to order since it is not continuously produced; production starts after the order is received.
The number of rows (m) shows how useful a given technical element is in general, meaning how intensively it supports a ‘desire’:
In Example 1, toothpaste, the stated expectation is a short delivery time (E3), which is evaluated at 0.80. This means that it is supported by most of the logistic technical parameters, i.e., it is a feasible expectation for toothpaste.
For product No. 2—the mainframe computer—the short delivery time (E3) expectation is assessed at 0,35, which means that this expectation is not feasible for a custom-made product using the present logistical technology and service elements.
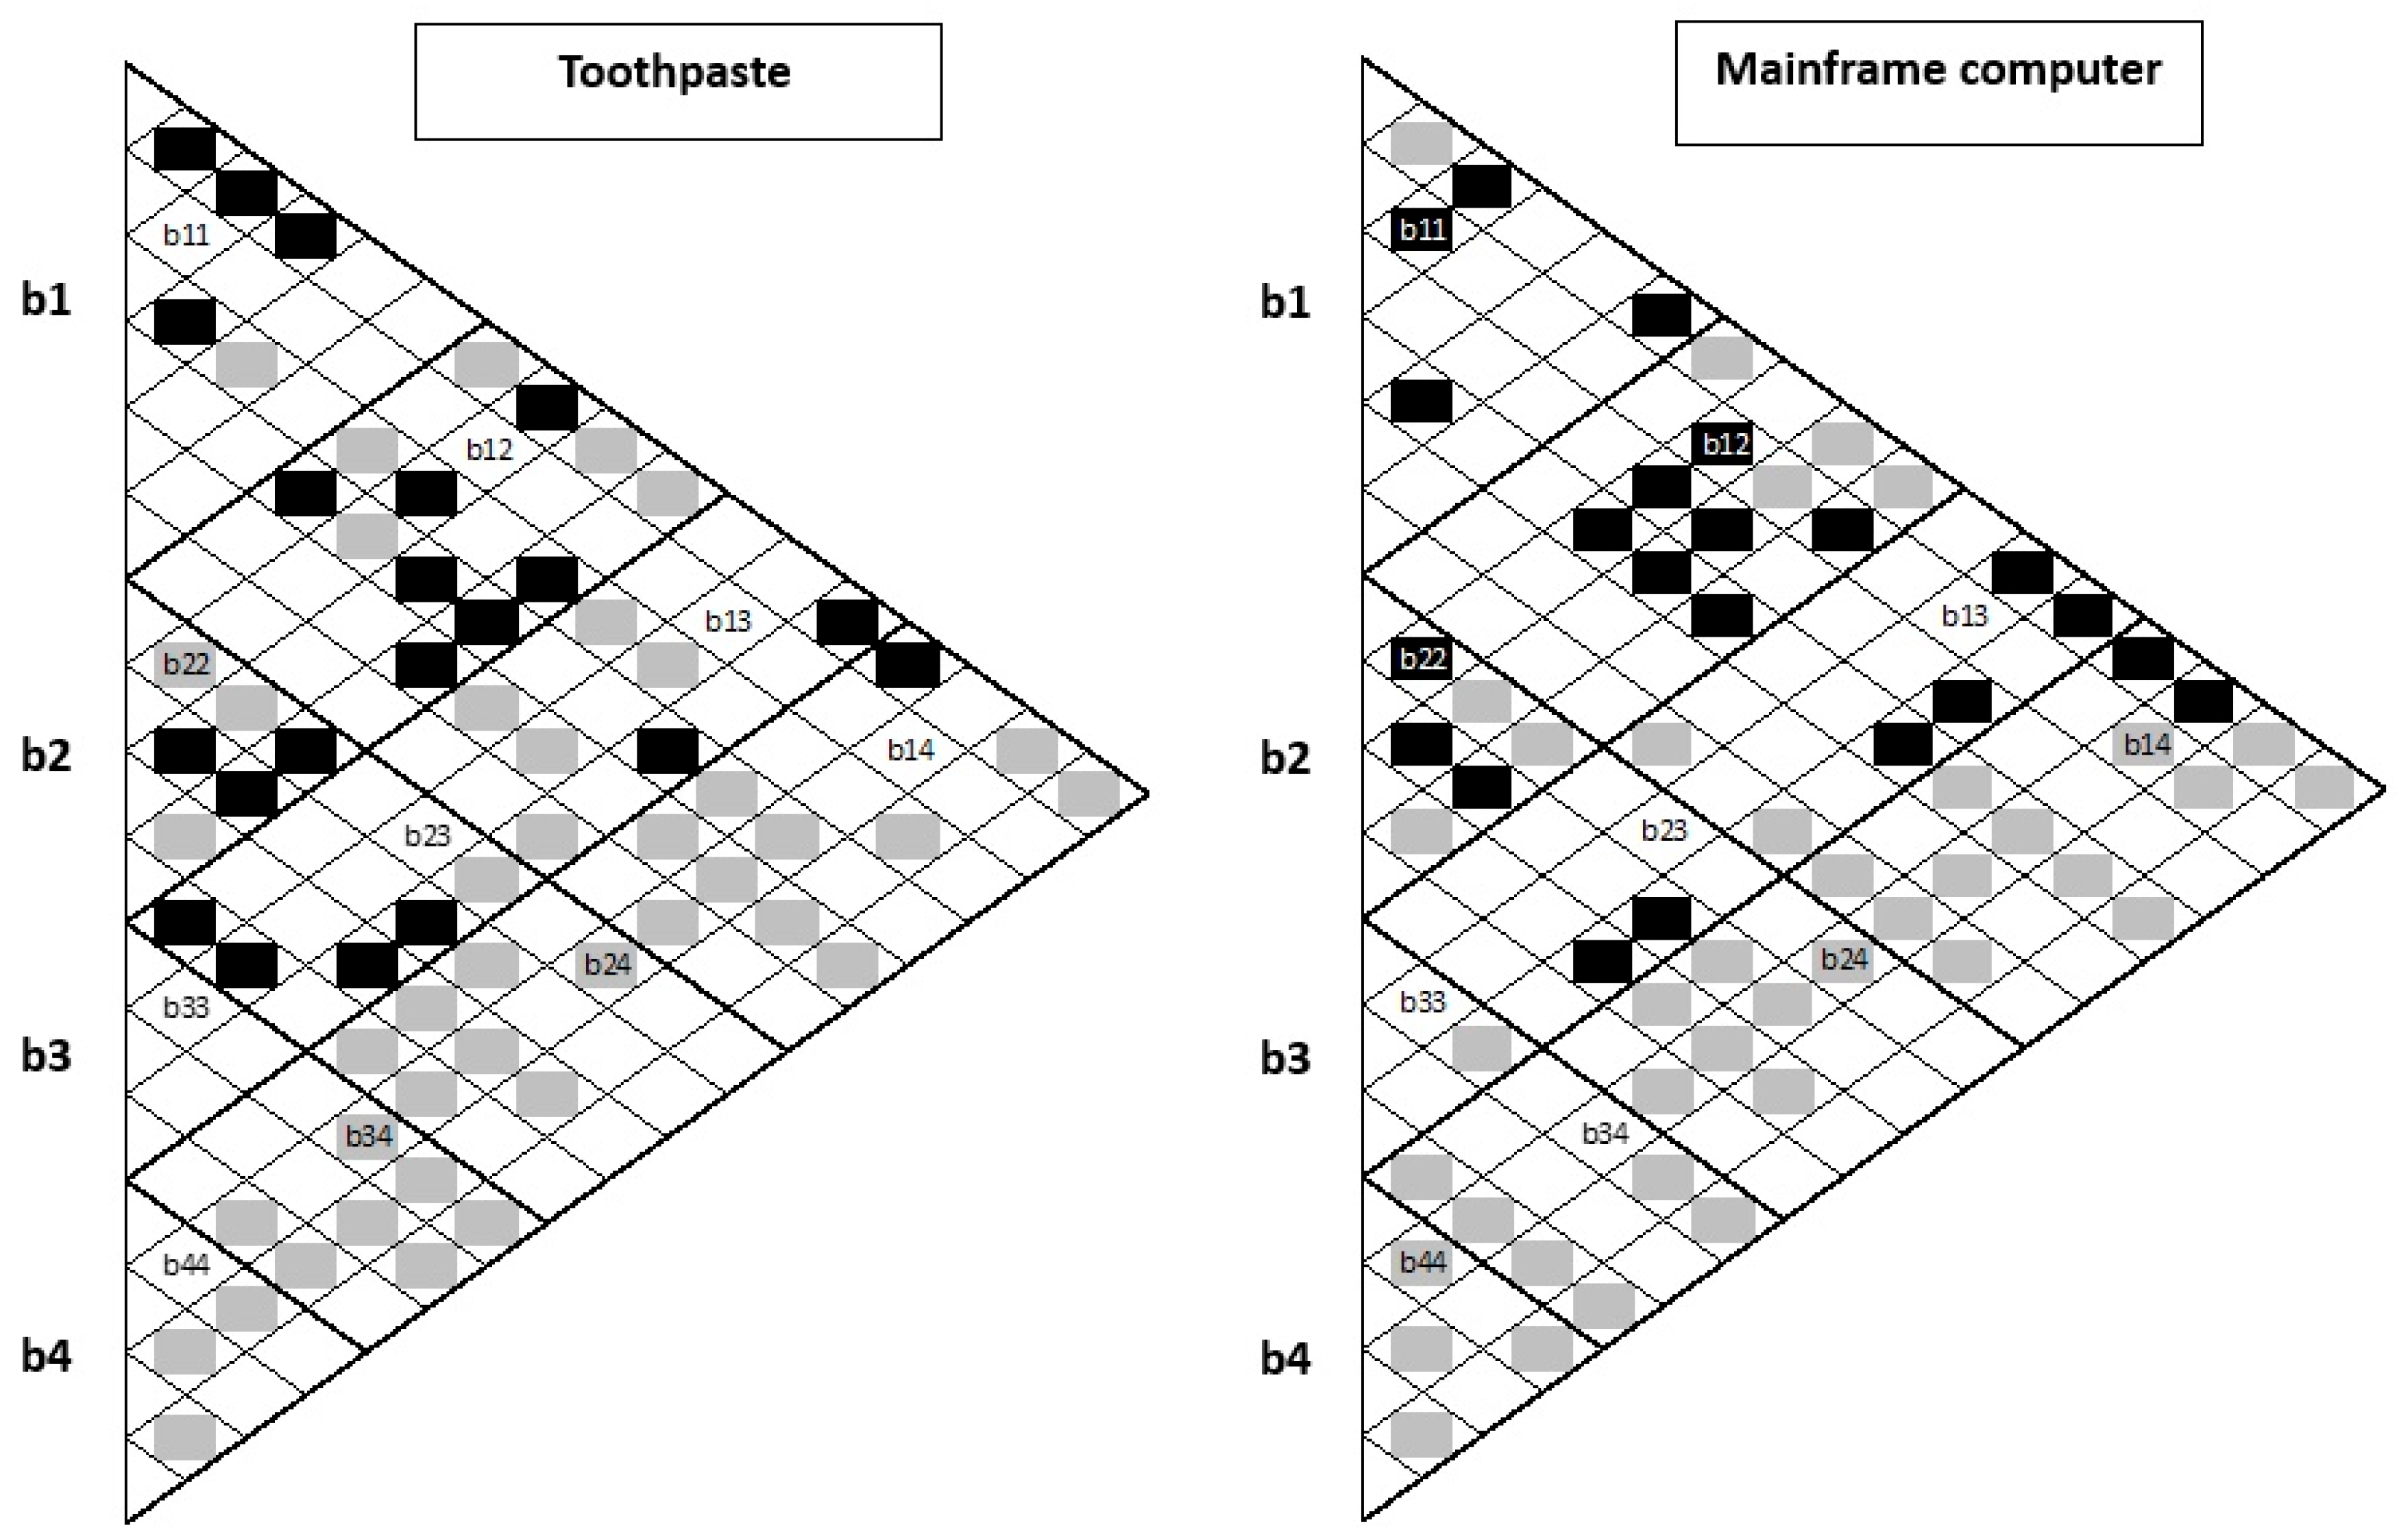
3.4. Examining the Relevance Between BSC Requirements in Example Products
In BSC, the four perspectives (customer, financial, internal processes, learning, and growth) were linked to the formulated logistics-related expectations, and the relevance between them was also evaluated separately based on Examples 1 and 2 (
Appendix A and
Appendix B) and
Table 7. Following the legend in
Table 8, expectations that have a positive impact on each other are marked in gray, negative impacts are marked in black, and those that have no effect or are not relevant for the product in question are marked in white. Once the assessment was completed, the impacts were analyzed, and the results are presented in
Table 8.
As illustrated in
Appendix A and
Appendix B and
Table 8, the positive and negative effects proportions show similar results. However, for the sample products in the appendix, it is clear that the evaluated expectations defined in BSC show positive and negative interactions in different places.
To see this, the interactions are also examined by cluster (
Figure 4), and for each cluster, the proportion of positive and negative values associated with the interactions is calculated (
Table 8).
Table 9 demonstrated that the percentages of interactions of positive and negative effects are very similar for the toothpaste and mainframe computer; however,
Figure 4 and
Table 9 apparently show the same % value, but the distribution and location of positive interactions are not the same, and the location of the contrasts are different. This means that the focus should be placed elsewhere on different products. Within this, the clusters b11, b22, b33, and b44 should also be examined separately, where the expectations within BSC, defined from one perspective, can be seen. If many negative contradictions can be identified within clusters b11, b22, b33, and b44, it means that in that particular area, where the expectations come from, it is not clear exactly what is wanted from the product. In other words, these areas need to be focused on because internal controversies have an impact on customer service through logistics processes.
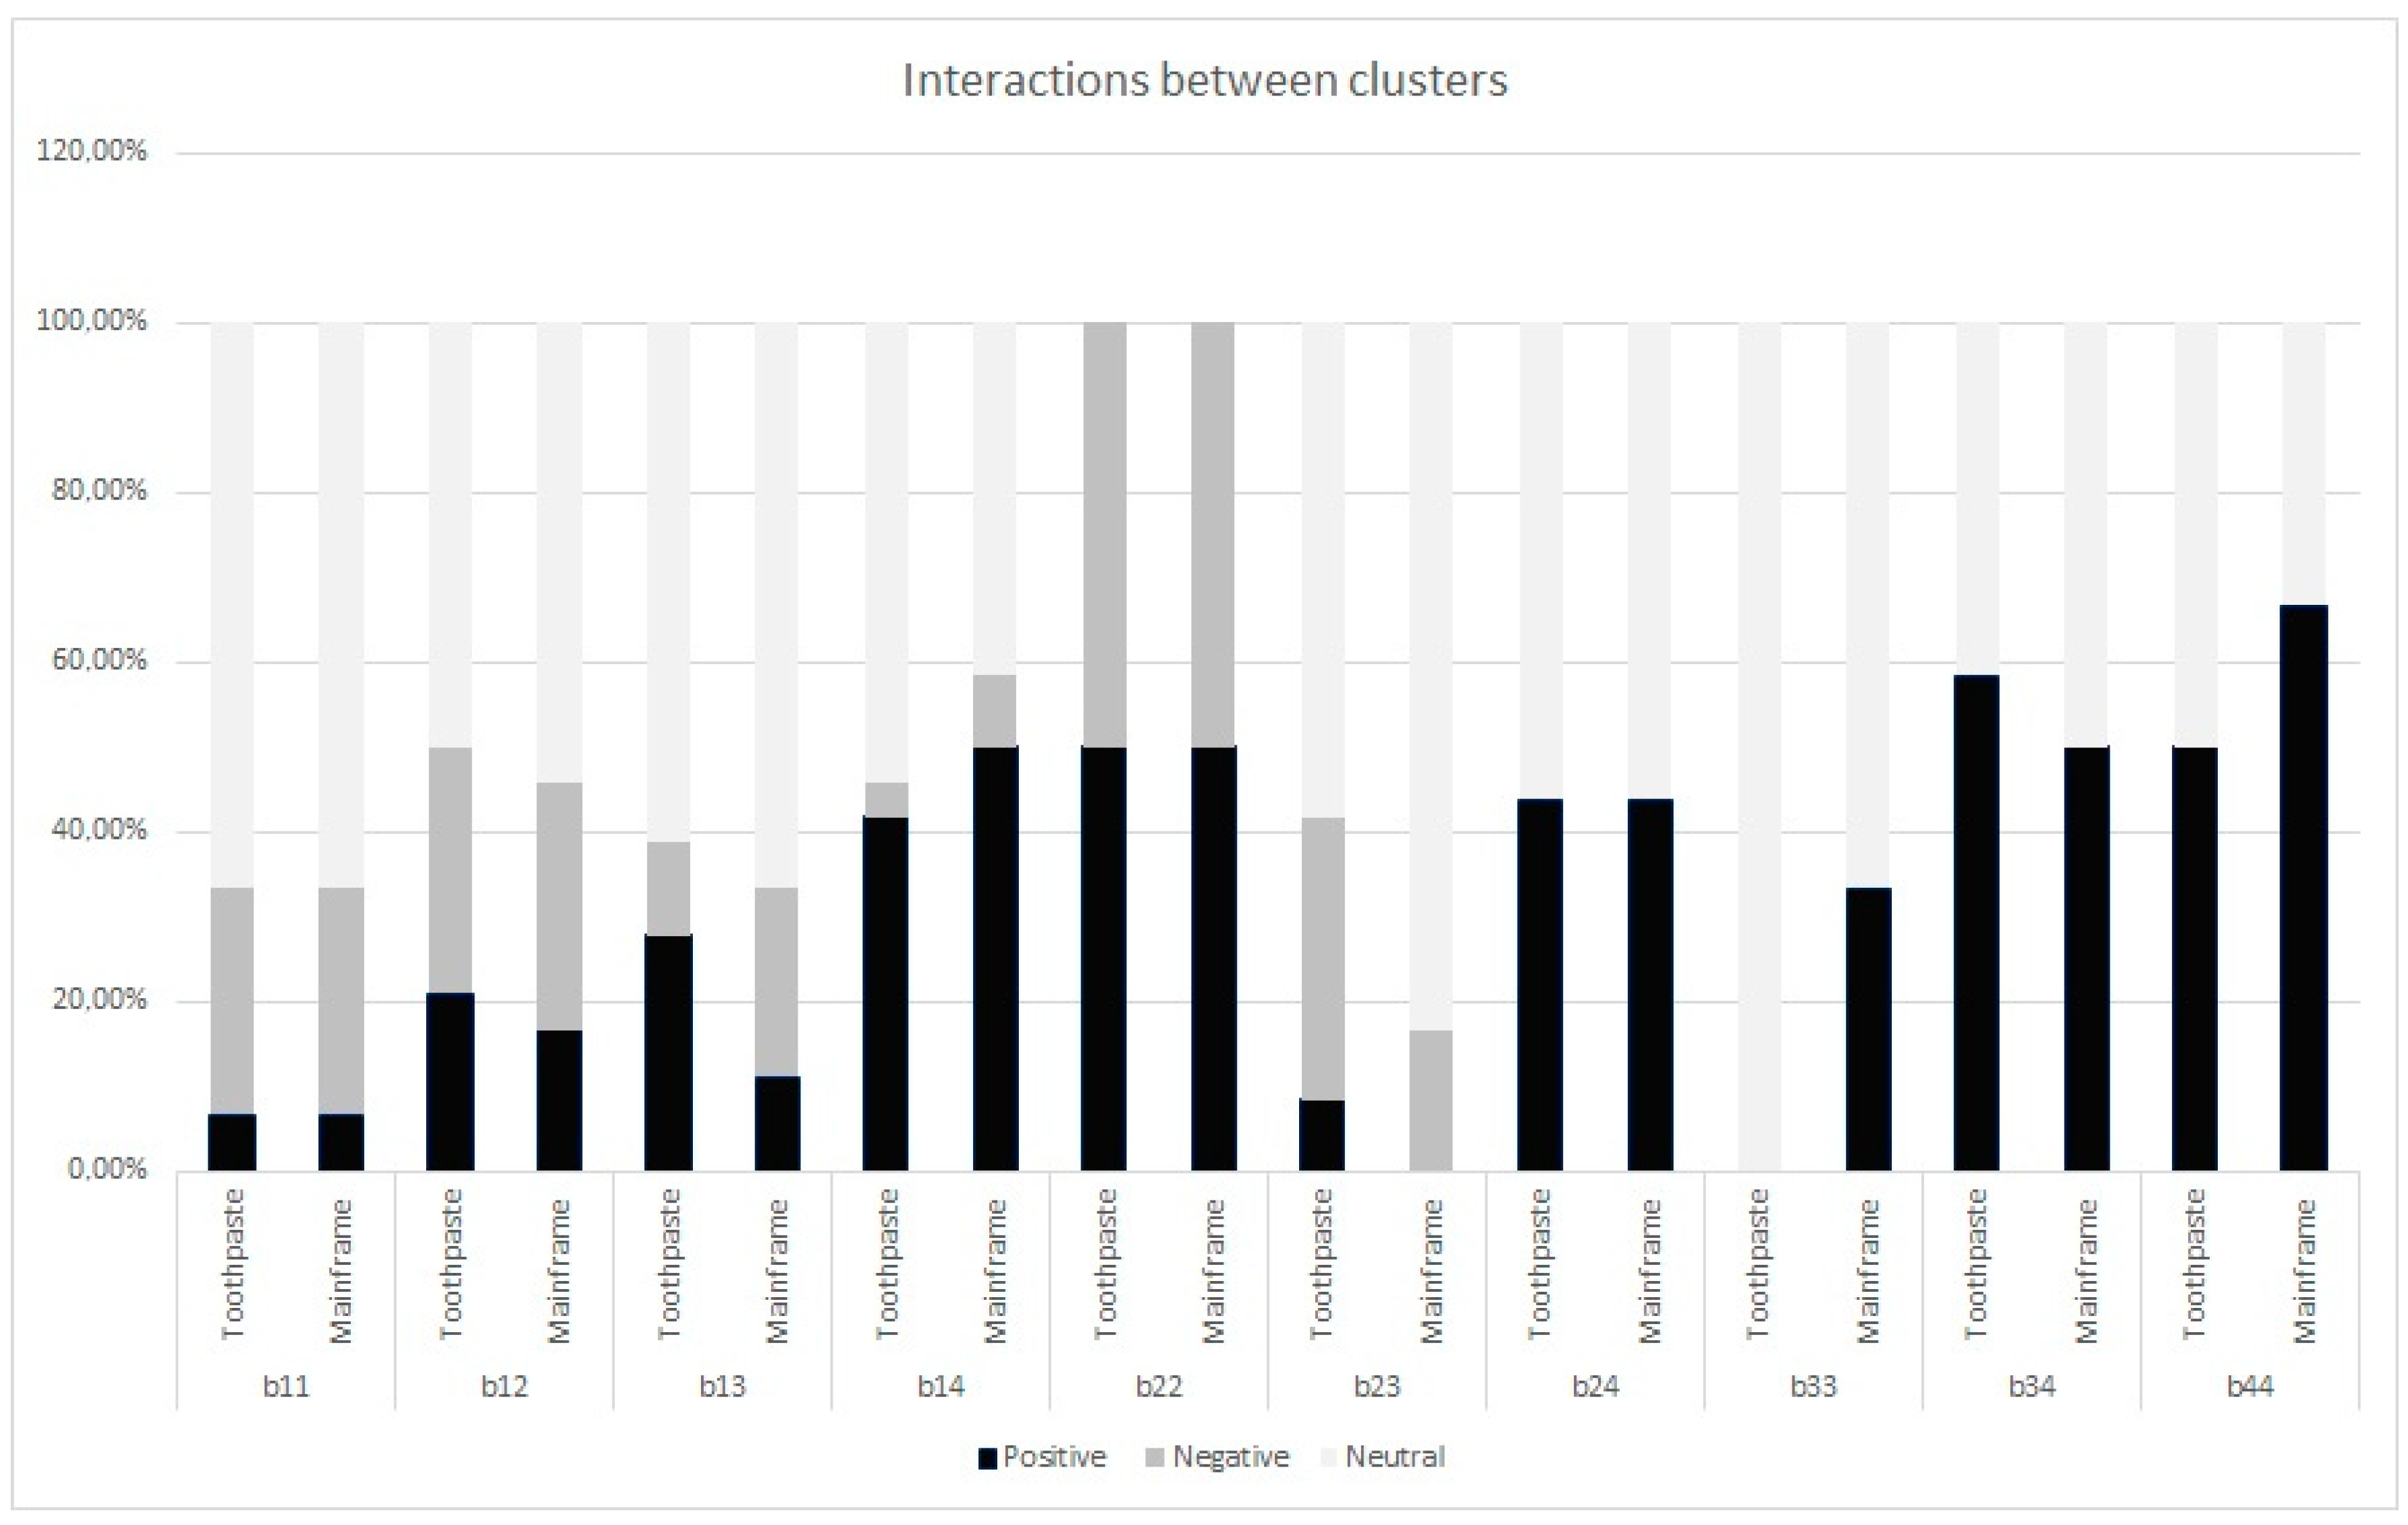
Figure 5 illustrates the interactions within clusters. It shows the differences within each cluster for the product evaluated in
Appendix A and
Appendix B, with the percentages also shown in
Table 9.
It is clearly visualized in
Figure 5 that although the same expectations are formulated for products requiring different logistics strategies and lead times, completely different technical and service elements are prioritized to fulfill the expectations formulated in the Balanced Scorecard. In other words, they may show very similar percentages on the overall average, but the inconsistencies in each cluster show in which areas the percentage of controversies is high and where the focus needs to be placed in order to ensure that the logistics strategy is sustainable in the context of the performance indicators defined in the Balanced Scorecard.
Certain limitations may affect the performance of the analysis. The precise definition of expectations and indicators is important in this area, and the method’s effectiveness depends on it. In some cases, however, the expectations themselves may be weakly defined, uncertain, subjective, or potentially subject to cognitive bias [
42]. On the other hand, the interpretation and quantification of indicators may also cause difficulties, such as what counts as ‘fast’, what unit of measurement is used, etc. In this sense, the practical application of the proposed methodology will only lead to the right result if it is based on sound professional principles.
This publication aims to present a useful methodology for investigating the interdisciplinary nature of logistics by analyzing the expectations of different disciplines based on the parameters of the services provided by logistics and the logistics environment. This methodology can be used as a “first step in conflict resolution” to make inconsistencies visible. In the process of using this methodology, expectations can be transformed into fuzzy sets [
43,
44] that help companies to quantify the discrepancies between the expectations of the different disciplines.


