Proceeding Paper

Primitive Shape Fitting of Stone Projectiles in Siege Weapons: Geometric Analysis of Roman Artillery Ammunition †

Department of Engineering, Università degli Studi della Campania Luigi Vanvitelli, 81031 Aversa, Italy
Presented at the Conference “Discovering Pompeii: From Effects to Causes—From Surveying to the Reconstructions of Ballistae and Scorpiones”, Aversa, Italy, 27 February 2025.
Eng. Proc. 2025, 96(1), 3; https://doi.org/10.3390/engproc2025096003
Published: 3 June 2025

Abstract

:
This paper presents the documentation, study activities, and possible applications of 3D digital models for the analysis and reconstruction of some examples of spheroidal stone projectiles—launched during the Sullan siege in 89 BC—now preserved in the Archaeological Park of Pompeii. The research proposes a methodology to derive best-fitting shapes that most closely adhere to the partially reconstructed image-based geometries. This allows a comparison with the circular ballistic impact traces still present on the ashlars of the northern city walls, as discovered by archaeologists about a hundred years ago. The results facilitate more precise ballistic calculations for the reconstruction of the elastic torsion weapons and their launching power.

1. Introduction

Integrated digital documentation is currently a widely adopted system in the field of Cultural Heritage (CH) for acquiring reality-based data and using them for the study, analysis, and preservation of the morphometric characteristics of numerous significant architectural and archaeological assets, especially in Italy [1]. In this field, various active and passive devices and sensors, including photogrammetric techniques, have been employed and integrated in recent decades to capture reality as it exists at the moment of acquisition [2,3,4]—data that can potentially be updated over time through remote monitoring to assess their state of conservation [5,6] while using systems that prioritize non-contact methodologies. This approach is particularly crucial, as surfaces are typically protected and subject to conservation restrictions, permitting only non-invasive analysis methods.
However, digital reality-based models present a major challenge, since, in most cases, the amount of data acquired is neither portable nor easily manageable and requires specific pre-acquisition solutions to limit file size without compromising data quality [7] or the use of online resources to manage very large datasets on hardware with limited local resources [8]. In any case, advanced use remains restricted to specialized skills, preventing experts in other fields from fully exploiting their potential. Beyond the hope for multidisciplinary collaboration, and considering the recent progress in software that has made both programs and online interfaces for browsing 3D material much more user-friendly and accessible [9], the complexity of leveraging more or less structured digital assets, which are useful primarily as metric documentation at a given time, remains a common issue. On the contrary, 3D digital models are extremely useful for studying the original design, for example, providing for a basis for new interpretive perspectives [10], enabling digital reconstructions, and supporting virtual anastylosis [11]. They can also undergo manual or automatic segmentation processes and data extraction for interpretive purposes or for advanced study of their constitutive geometry, even when elements are incomplete [12].
Within the framework of the MUR-PRIN 2022 SCORPiò-NIDI project, and as a complement to the study of the ballistic imprints found on the northern city walls of Pompeii, originating from traces left during the Sullan siege (1st century BC) [13,14], this paper presents the documentation and analysis of the spheroidal stone projectiles (Figure 1) that most likely produced the marks on the ashlars.

2. Materials and Methods
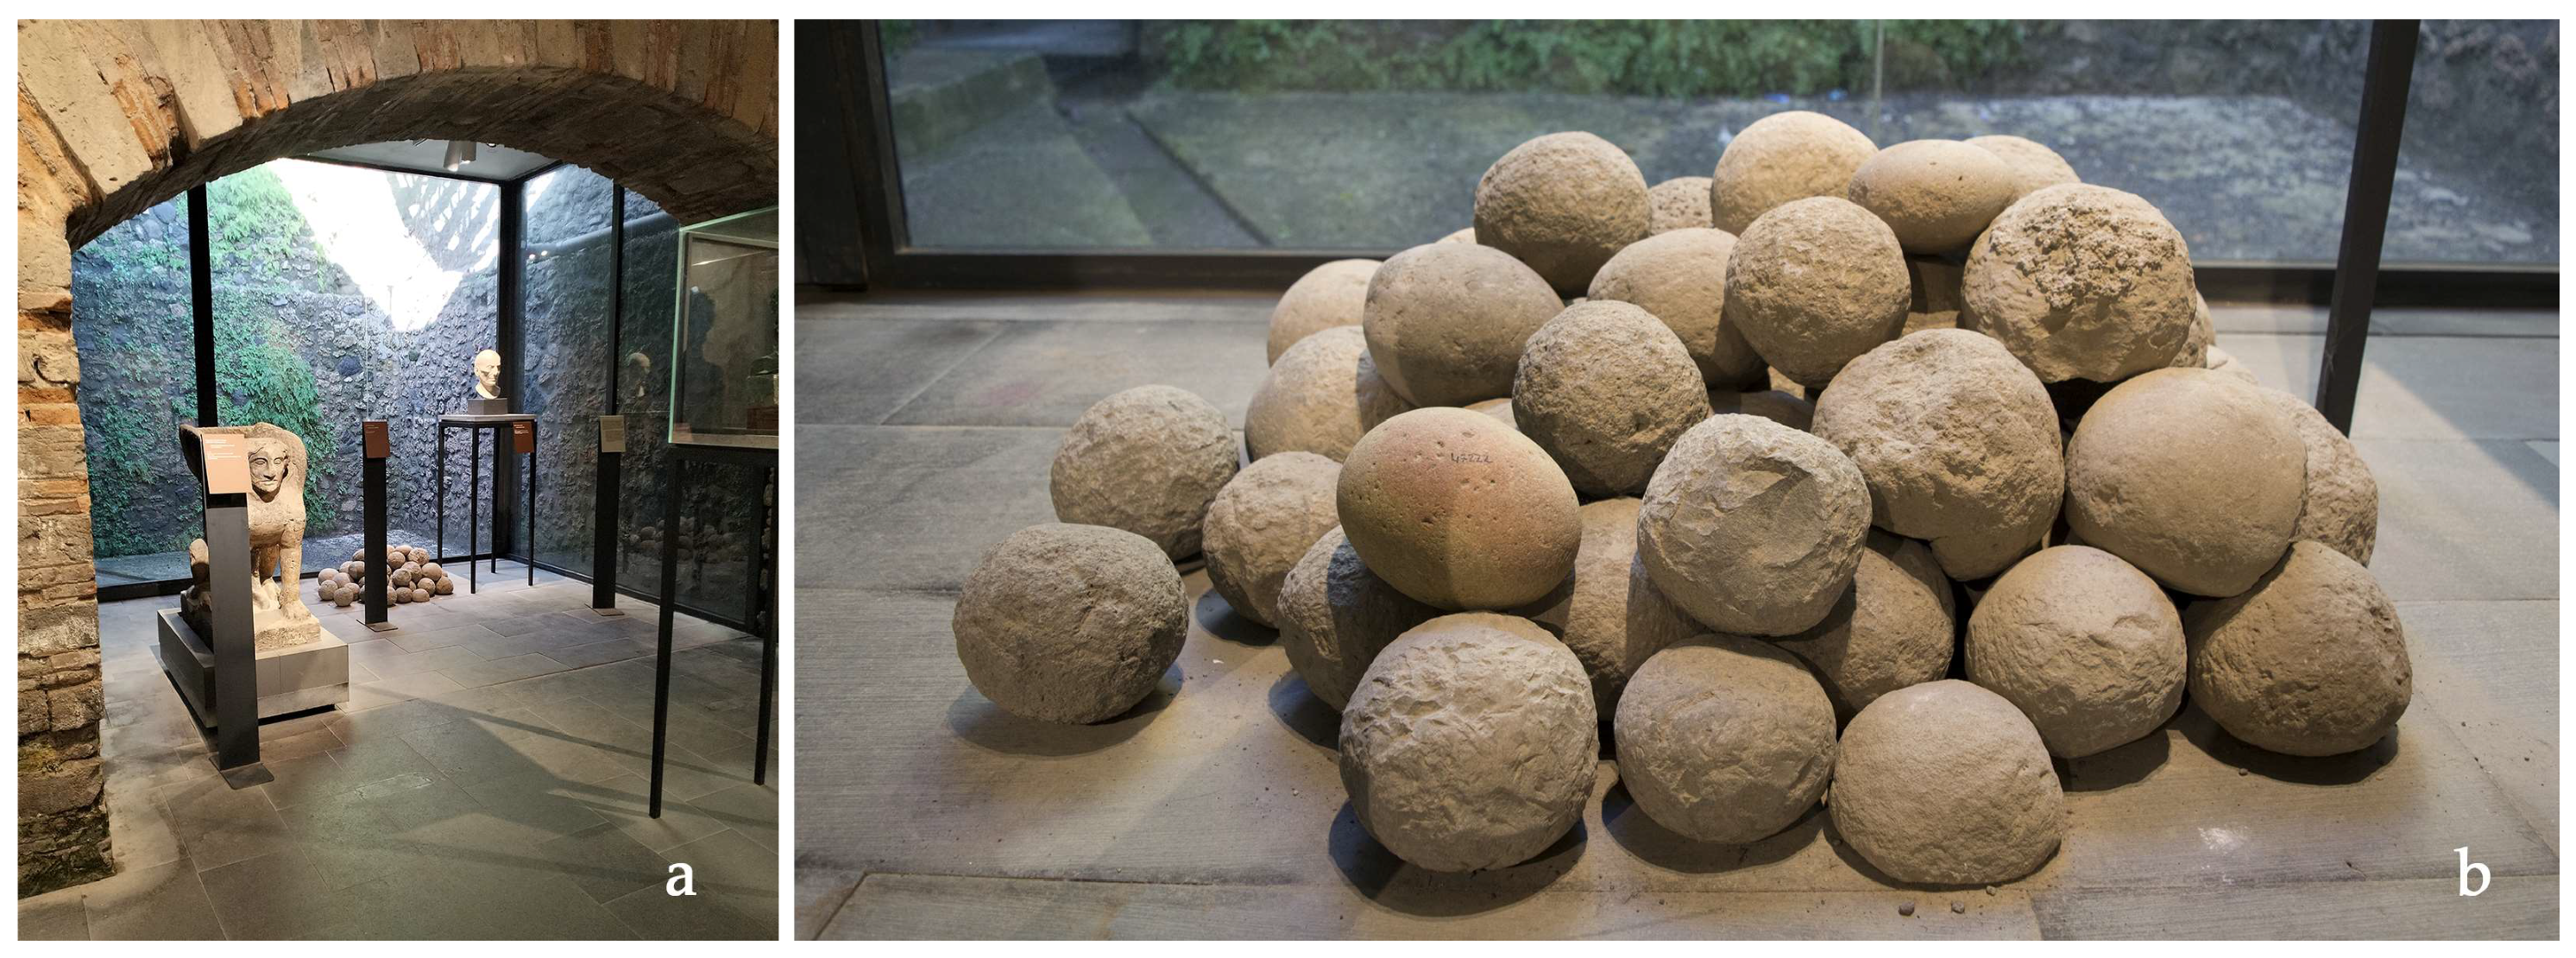
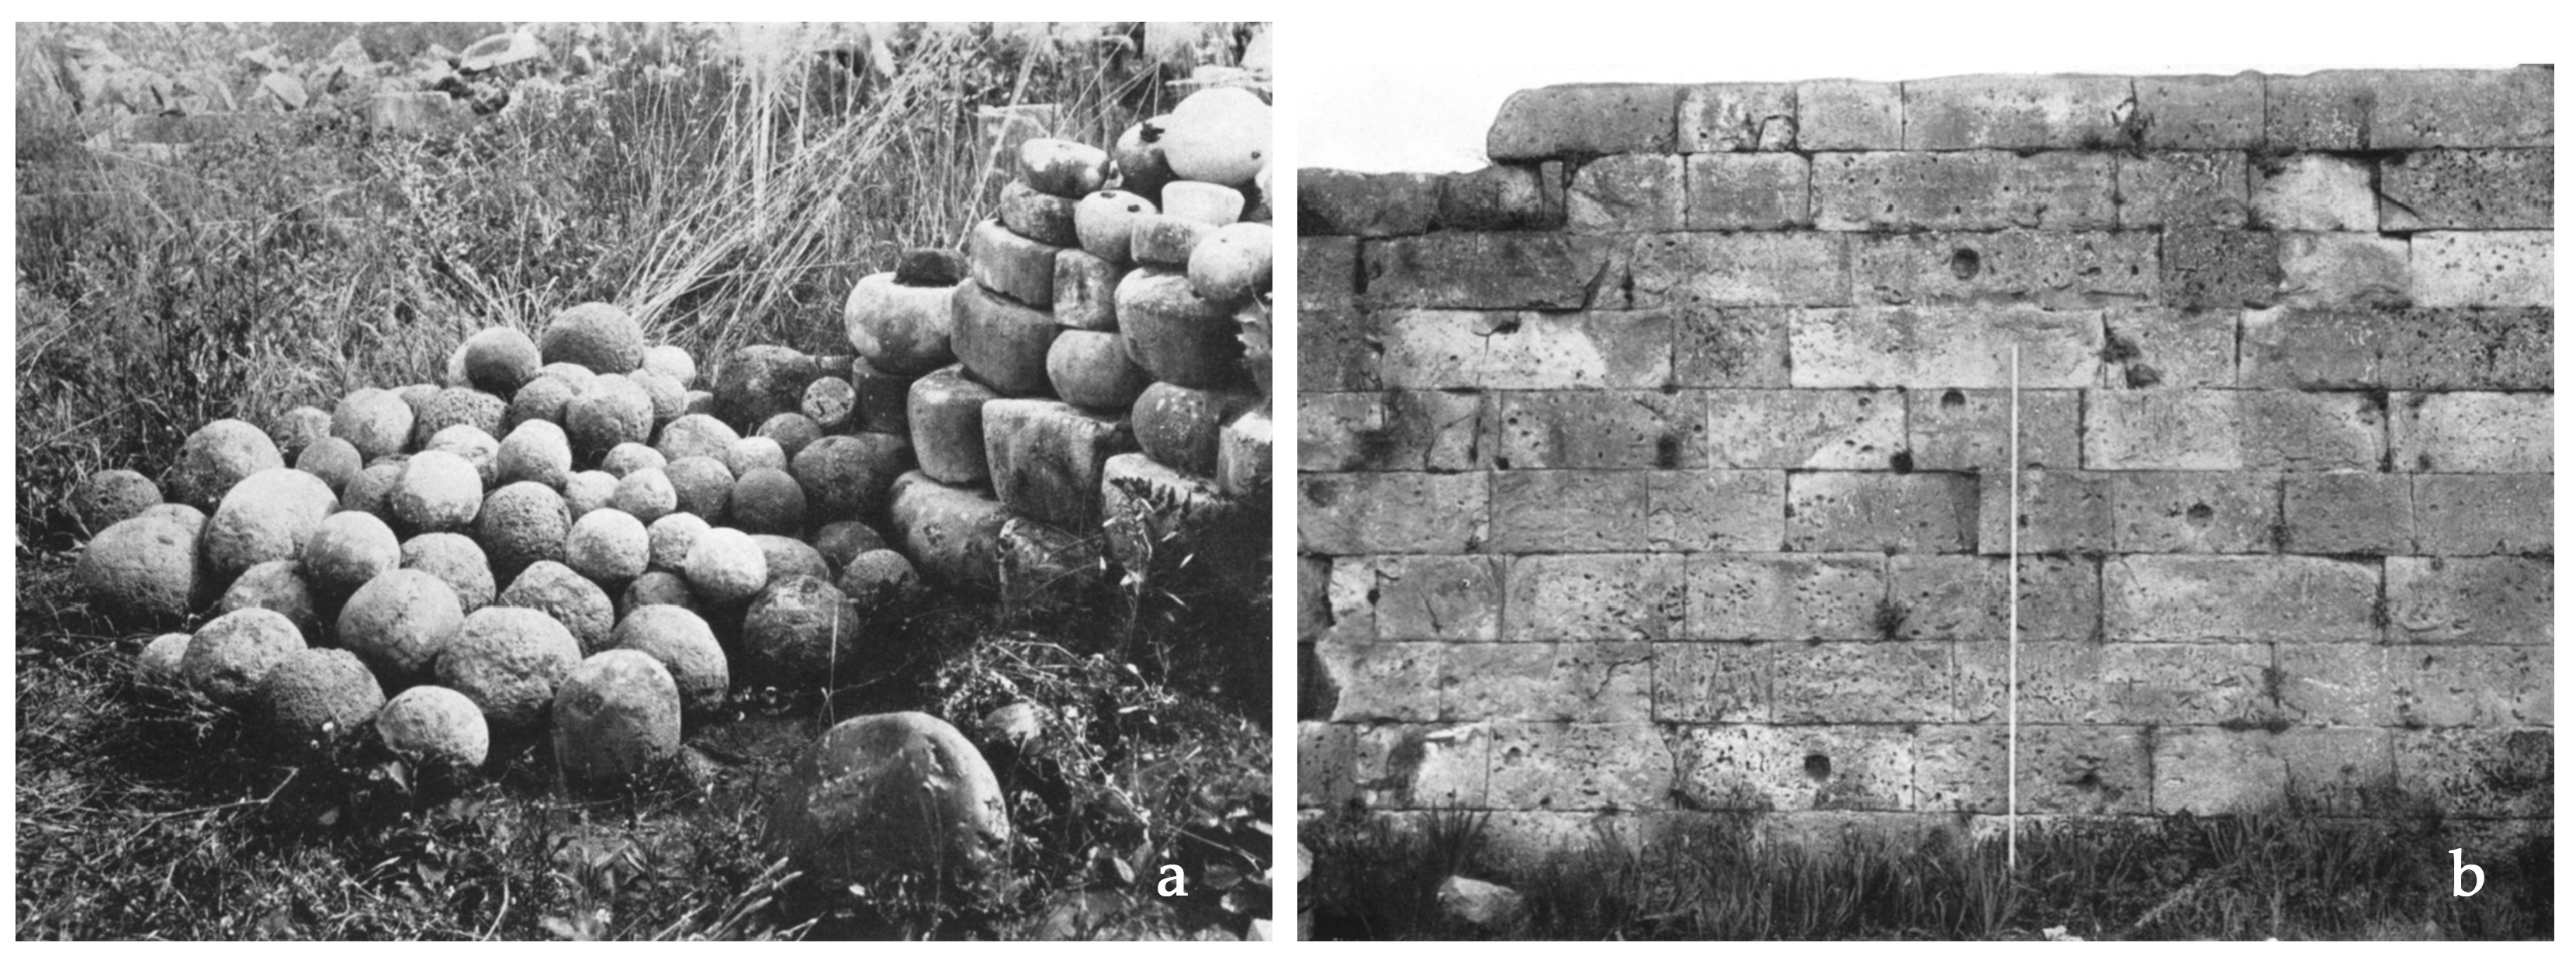
This study proposed a methodology for the reality-based documentation, geometric analysis, and theoretical reconstruction of spheroidal stone projectiles attributed to the Sullan siege of Pompeii (89 BC). The projectiles, launched by Roman elastic–torsion siege weapons such as ballistae and onagers, as described by Vitruvius [16], provide valuable evidence of the throwing power of ancient artillery. Similar findings of Roman catapult ammunition have been reported in various sites [17,18,19], but the Pompeii specimens are unique because their destructive effects are still visible on the city’s northern walls, found between Vesuvio and Ercolano Gate.
Thus, the research aimed to reconstruct the most geometrically reliable shapes and compare them with the spherical impact traces on the ancient city walls, first documented by archaeologists a century ago [20]. Until recently, in a previous exhibition layout, these projectiles were displayed in the Antiquarium, where they were partially documented with Structure from Motion (SfM) techniques to facilitate the geometric analysis and testing of different 3D reconstruction approaches, both manually and automatically. Using an integrated workflow, survey techniques and geometric analysis were applied to these small-sized artifacts, acquired through rapid photogrammetric techniques. Their virtual models—partially reconstructed—served as a basis for theoretical geometric reconstructions for comparison with the ballistic indentations on Pompeii’s northern walls.
At the end of this study, the analysis helped to determine whether any stone projectiles matched the dimensions of the impact traces attributed to the Sullan siege, potentially identifying the ammunition responsible for the marks on the ashlars. The research also provided recommendations for further investigations on the topic.

2.1. The Case Study

The stone balls of various sizes and weights used for ballistae, launched by pulling a rope on a rail in Roman elastic–torsion weapons, were approximately spherical in shape. In Pompeii, some of the larger and heavier balls have been found mainly in the northwestern part of the city (Regio VI, e.g., the House of the Labyrinth), where the most intense clashes took place, as well as in several private domus near the most affected areas [21]. Scholars believe that the larger projectiles, such as stone balls weighing one Greek talent (equivalent to about 26 kg), were thrown over the walls using ballistae or catapults, capable of hurling them beyond 200 m [22], or onagers, which launched them in parabolic trajectories to overcome the fortified walls present at the time.
Regarding the projectiles of different calibers, materials, and hardnesses that were collected in large numbers during the siege of the city, in particular the stone balls likely used by Sulla’s forces in 89 BC, the archaeologist Albert W. Van Buren already mentioned them in the 1930s. In his writings, he recorded 86 specimens “of the type of ballista ball” [23] (p. 15) (Figure 2) preserved in the brick building along the northern part of the western side of the Forum. In all probability, they represented a selection of the surviving ballistic projectiles thrown by the besieging Sullan army against the walls of Pompeii, along with a portion of the projectiles thrown by the city’s defenders. Such defensive missiles were usually stored near the fortified structures (e.g., those depicted by Piranesi in the nineteenth century near the Ercolano Gate [24] (vol. 1, Plate 5)). However, after the war emergency, they were often relocated or possibly repurposed for other uses.
Of the stone balls photographed at that time, a selection had been made by the archaeologist himself who, with the approval of the Superintendence, ensured the removal of certain stones, that, in his opinion, did not correspond to the type of “missile” used for launching.
The selected collection of stones was undoubtedly quite distinct from both those used as weights (see Figure 2a, above right) and from irregular yet rounded stones made of various materials that must have served for other purposes. The projectiles were well rounded rather than irregular, primarily made of tuff, with some examples of lava, sandstone, and limestone (but none of marble). They lacked no intentional inscriptions or markings, but many exhibited damaged areas on parts of their surfaces, possibly due to impact or partial preservation. Approximate recorded diameters for typical specimens ranged from 10 to 23 cm. More specifically, Van Buren [23] (p. 16) lists examples measuring 0.23, 0.21, 0.19, 0.16, 0.14, 0.13, 0.11, and 0.10 m, without mentioning any conversion to Roman units of measurement. In his view, these were comparable to the 2500 examples found at the military port of Carthage, which ranged from 10 to 30 cm in diameter (p. 16, note 2).
In any case, the projectiles recovered from different parts of the excavation site lacked any documentation regarding the original location of individual pieces. Despite the archaeologist’s efforts to trace records of their discovery in excavation reports from his time [26,27], no definitive conclusions could be drawn about their primary context or the locations from which they were fired. Furthermore, he himself did not provide precise measurements or weights for the specimens, leaving such details to be determined in future, with more detailed studies. He only referenced similar missiles found at various archaeological sites in the 1920s–30s, comparable to the Pompeian examples, and discovered at other key sites besieged by the Romans [28].
The discovery of 215 lead sling bullets and 17 stone ballista balls—some partially fragmented and made of either limestone or dark grey lava stone with black inclusions—within three different calibers, averaging 18, 21, and 25 cm in diameter, was a more recent find. These were unearthed during the Anglo-American Project at Pompeii, during excavations conducted between 1996 and 2003 near the Ercolano Gate in Regio VI, Insula I [29] (p. 1).

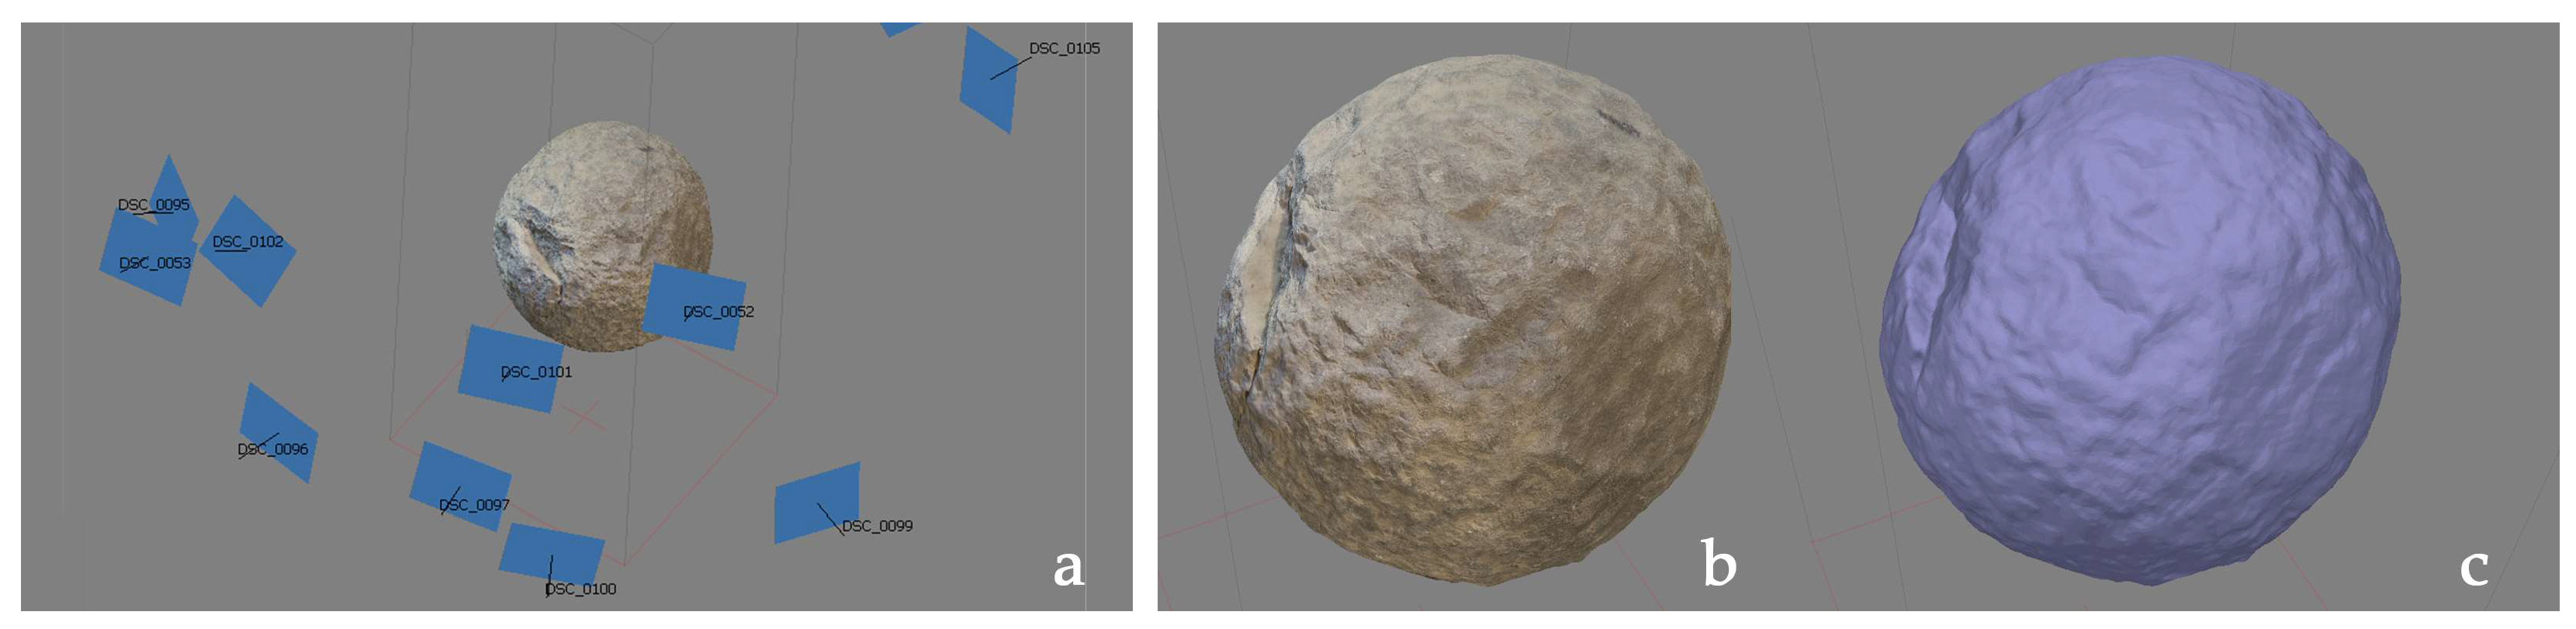
2.2. Three-Dimensional Documentation

For the initial analysis, a selection of the approximately 50 stone balls were documented using rapid photogrammetry for 3D reconstruction (Figure 3). Despite challenging lighting conditions and the stacked arrangement of the stone balls in the former exhibition layout, it was possible to reconstruct 3D models of only the visible portions of some of the objects. However, at this stage of the research, the hidden parts remain undocumented; the objects should be relocated to a more suitable environment for complete documentation.
The acquired images (63 photos, 6000 × 4000 pixel, NIKON D5200, focal length 18 mm, ISO sensitivity 450, exposure time 1/60) were processed with Agisoft Metashape Professional software (version 2.1.1) [30] to generate a geometric reconstruction of the pile of stone balls in their fixed position (as their relocation was not possible). The software also generated a textured model representing the apparent color, resulting in partial reconstruction. However, the full study is in progress, various models were evaluated in this paper, and only the most complete ones were selected for the following steps, i.e., those with a reconstructed surface exceeding 50%, while also considering objects of different sizes (large diameter: >16 cm; medium: 12–16 cm). Meanwhile, elongated ovoid objects, which seemed to belong to a different category, were excluded. The resulting partial models were then exported for post-processing using Reverse Modeling software 3D Systems Geomagic Design X (version 2016.1.1) [31] to perform dimensional and geometric analyses. The models featured a polygonal mesh with an average edge length of 1.2 mm, which was doubled after optimizations.
Beyond the operational steps, the reconstruction of the existing projectile geometry (12–18 cm in diameter) required addressing key methodological aspects for defining a reliable theoretical shape and determining the center and radius of the ideal sphere closest to the real object. The main challenges included the following: (i) some reconstructed portions may not have accurately reflected reality, especially in occluded or poorly lit areas; (ii) since the initial survey was not metric, scaling errors may have occurred, potentially affecting the final results.
Therefore, future documentation with active sensors is planned; (iii) theoretical shapes will have limited adherence to stone projectiles, which are typically rough and irregular, with both chipped areas and tool marks. Thus, the analysis will focus on defining ranges of spheres that encompass the average or total surface area; (iv) objects with a low percentage of reconstructed surface are inherently less reliable than more complete models.
For this reason, the main processing steps performed in this research were as follows (Figure 4):
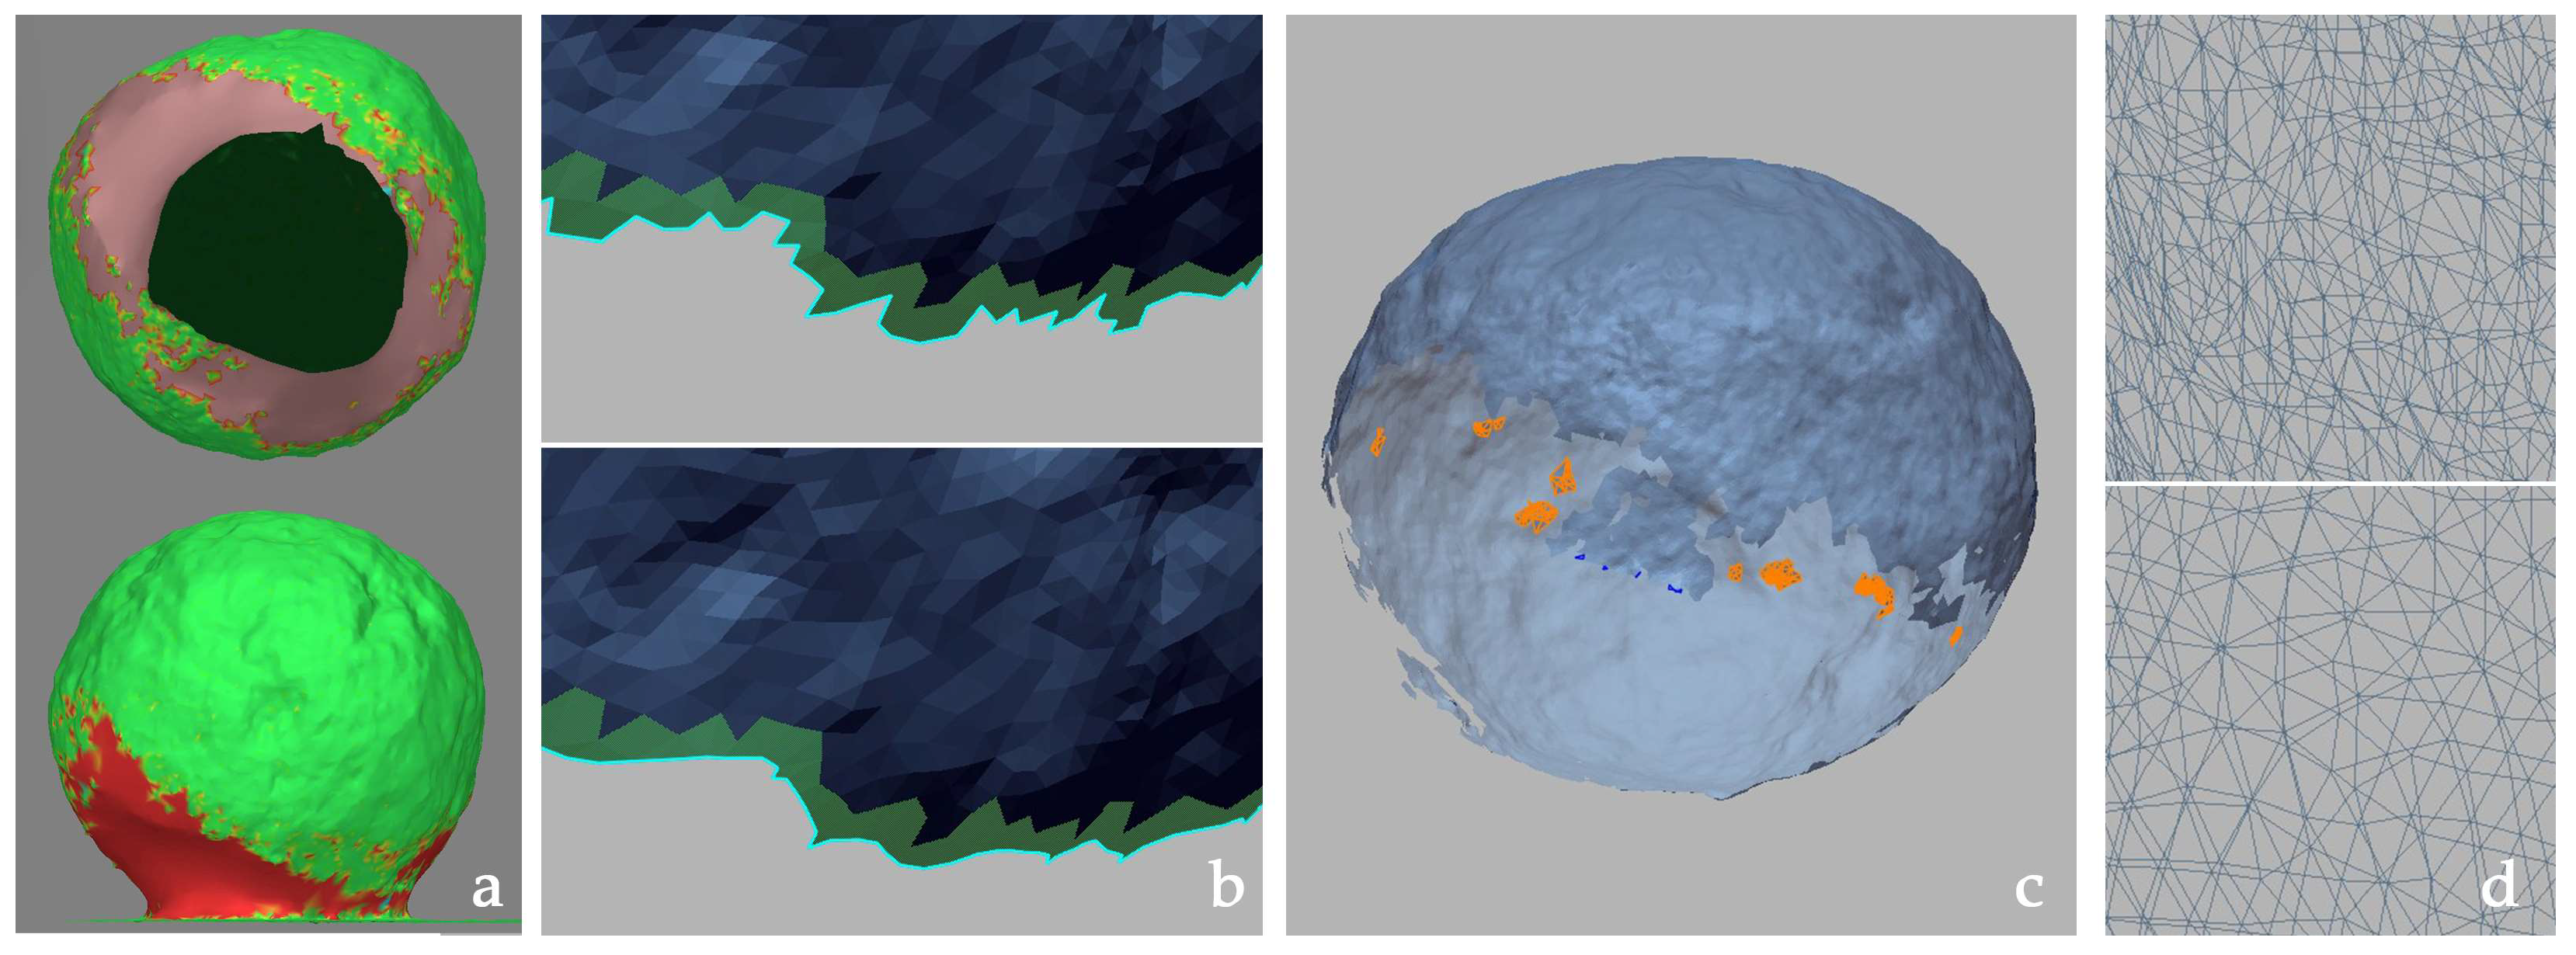
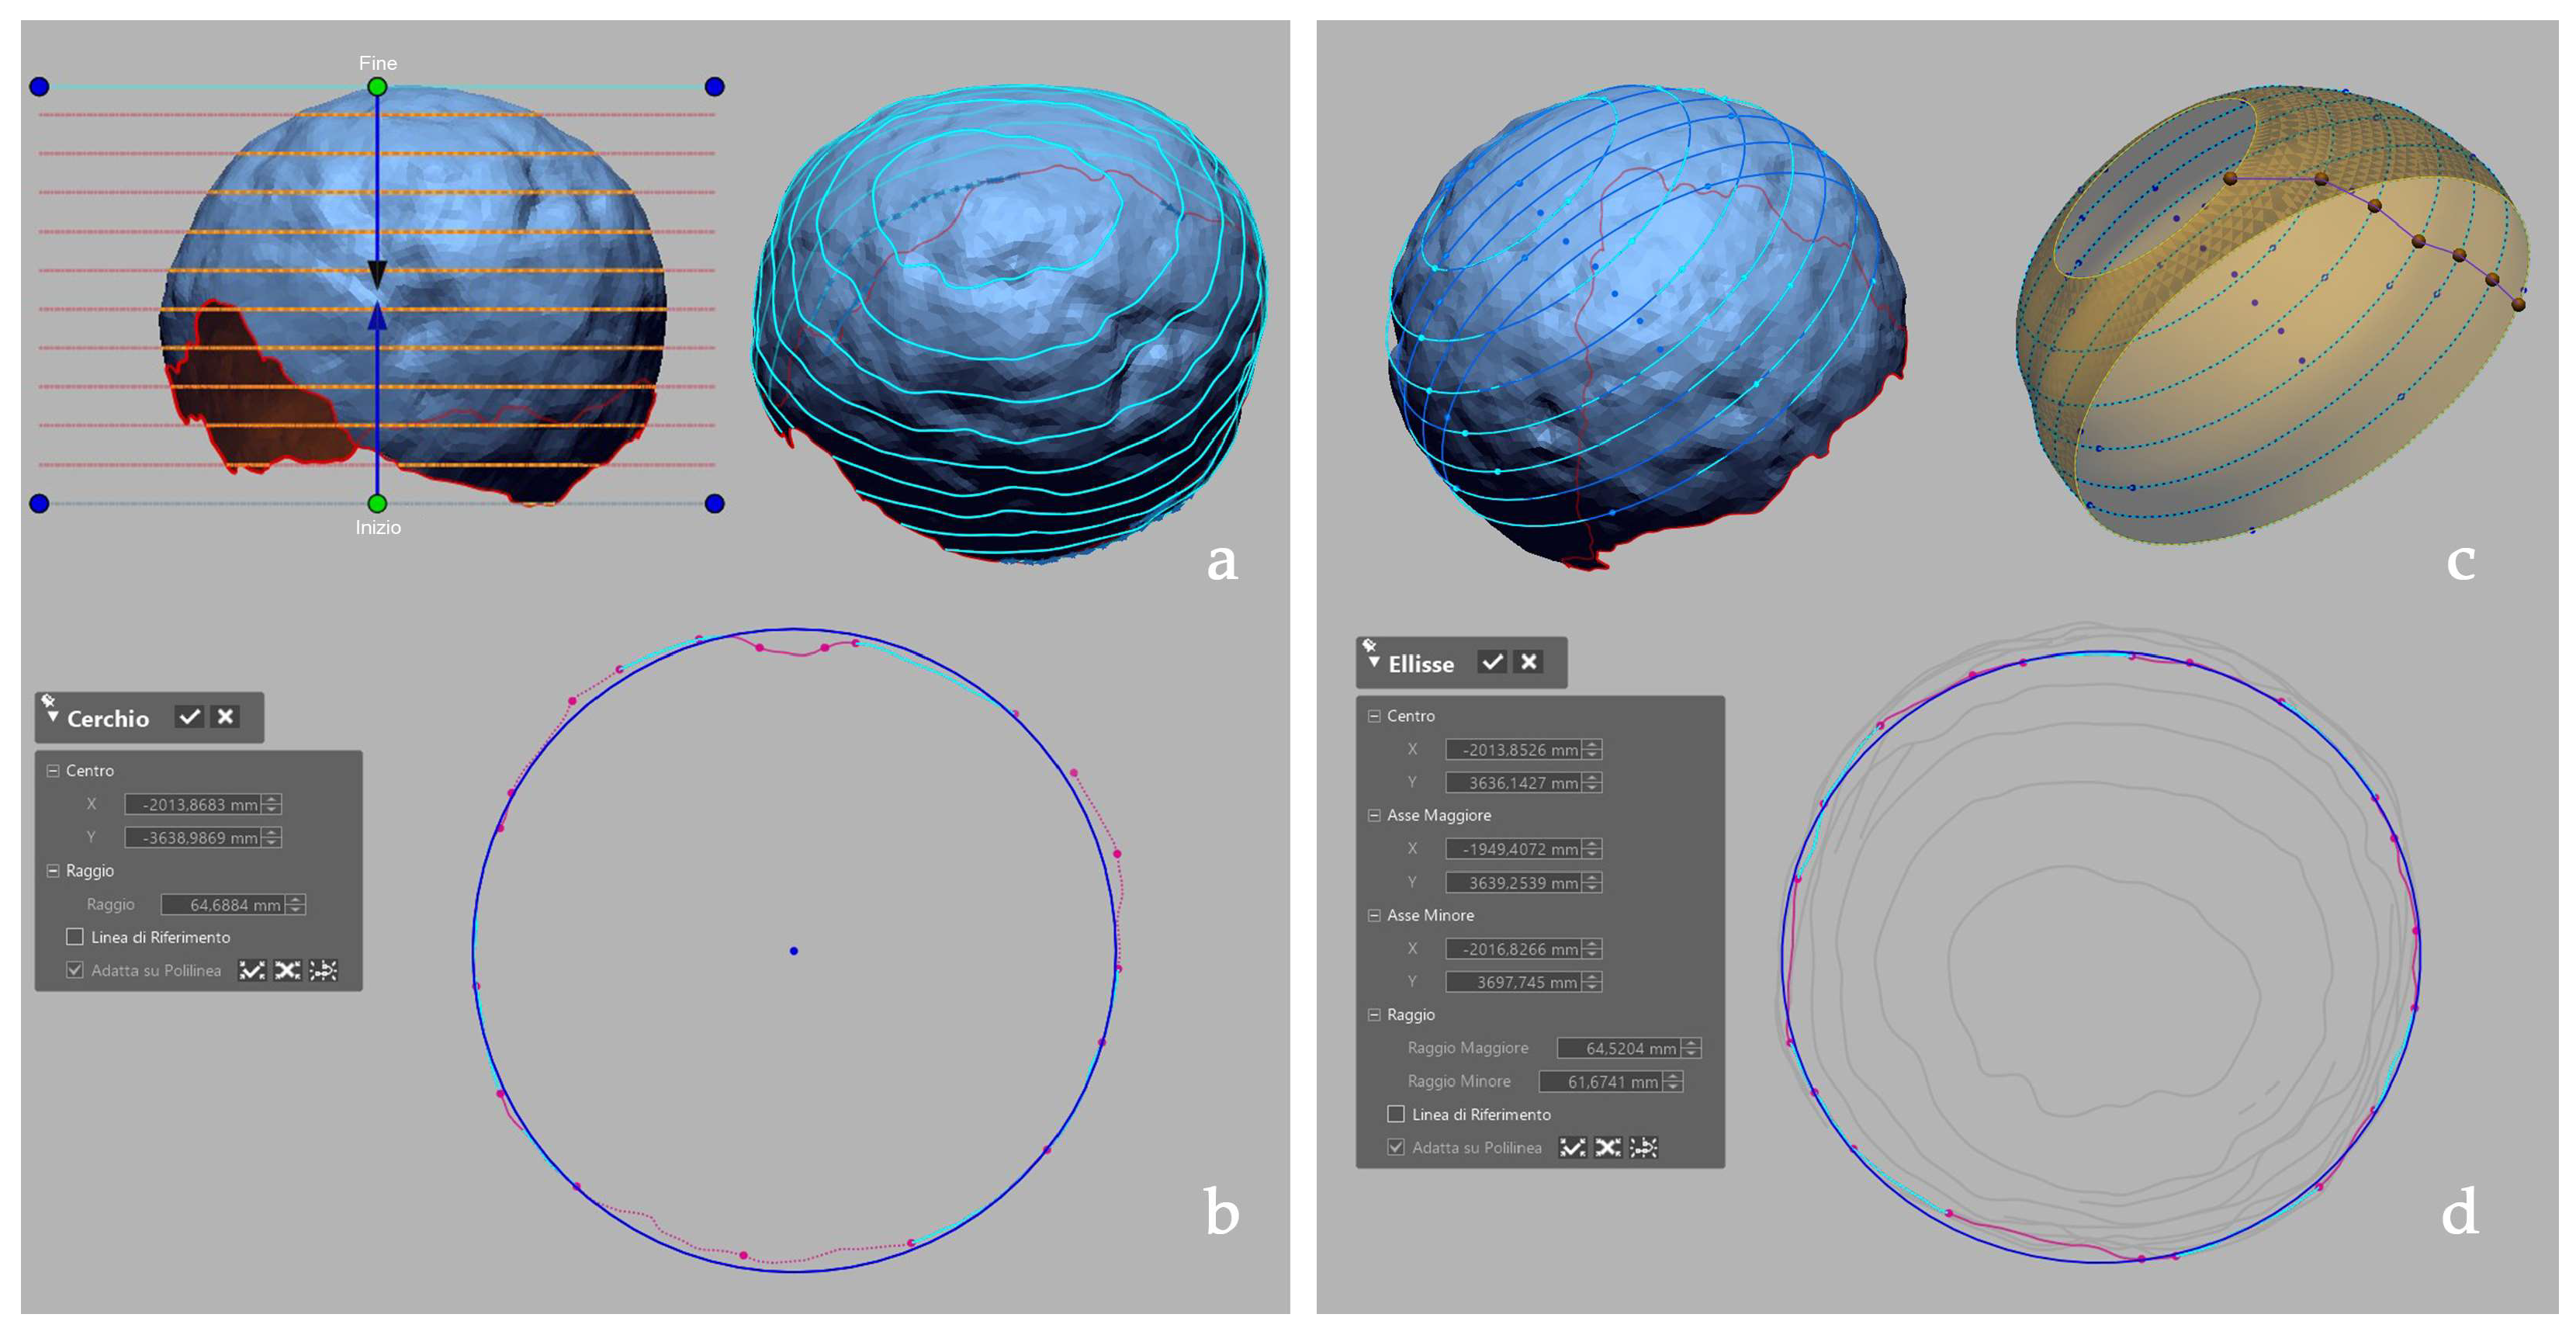
  • Initial mesh editing: The lower, less documented, and more uncertain part was removed by trimming the edges to eliminate unreliable polygonal surfaces. Most image processing software also includes built-in tools for filtering and assessing model confidence (a). Irrelevant parts could be manually removed, especially because the objects were stacked, leading to unintended geometry reconstructions. The boundary editing tool extended the selection to refine edge regions affected by poor lighting or contact with other objects. Finally, an edge smoothing process was applied to improve surface continuity (b).
  • Surface refinement: Smoothing operations helped to eliminate inconsistencies caused by the presence of moss, lichen, or non-removable weed vegetation.
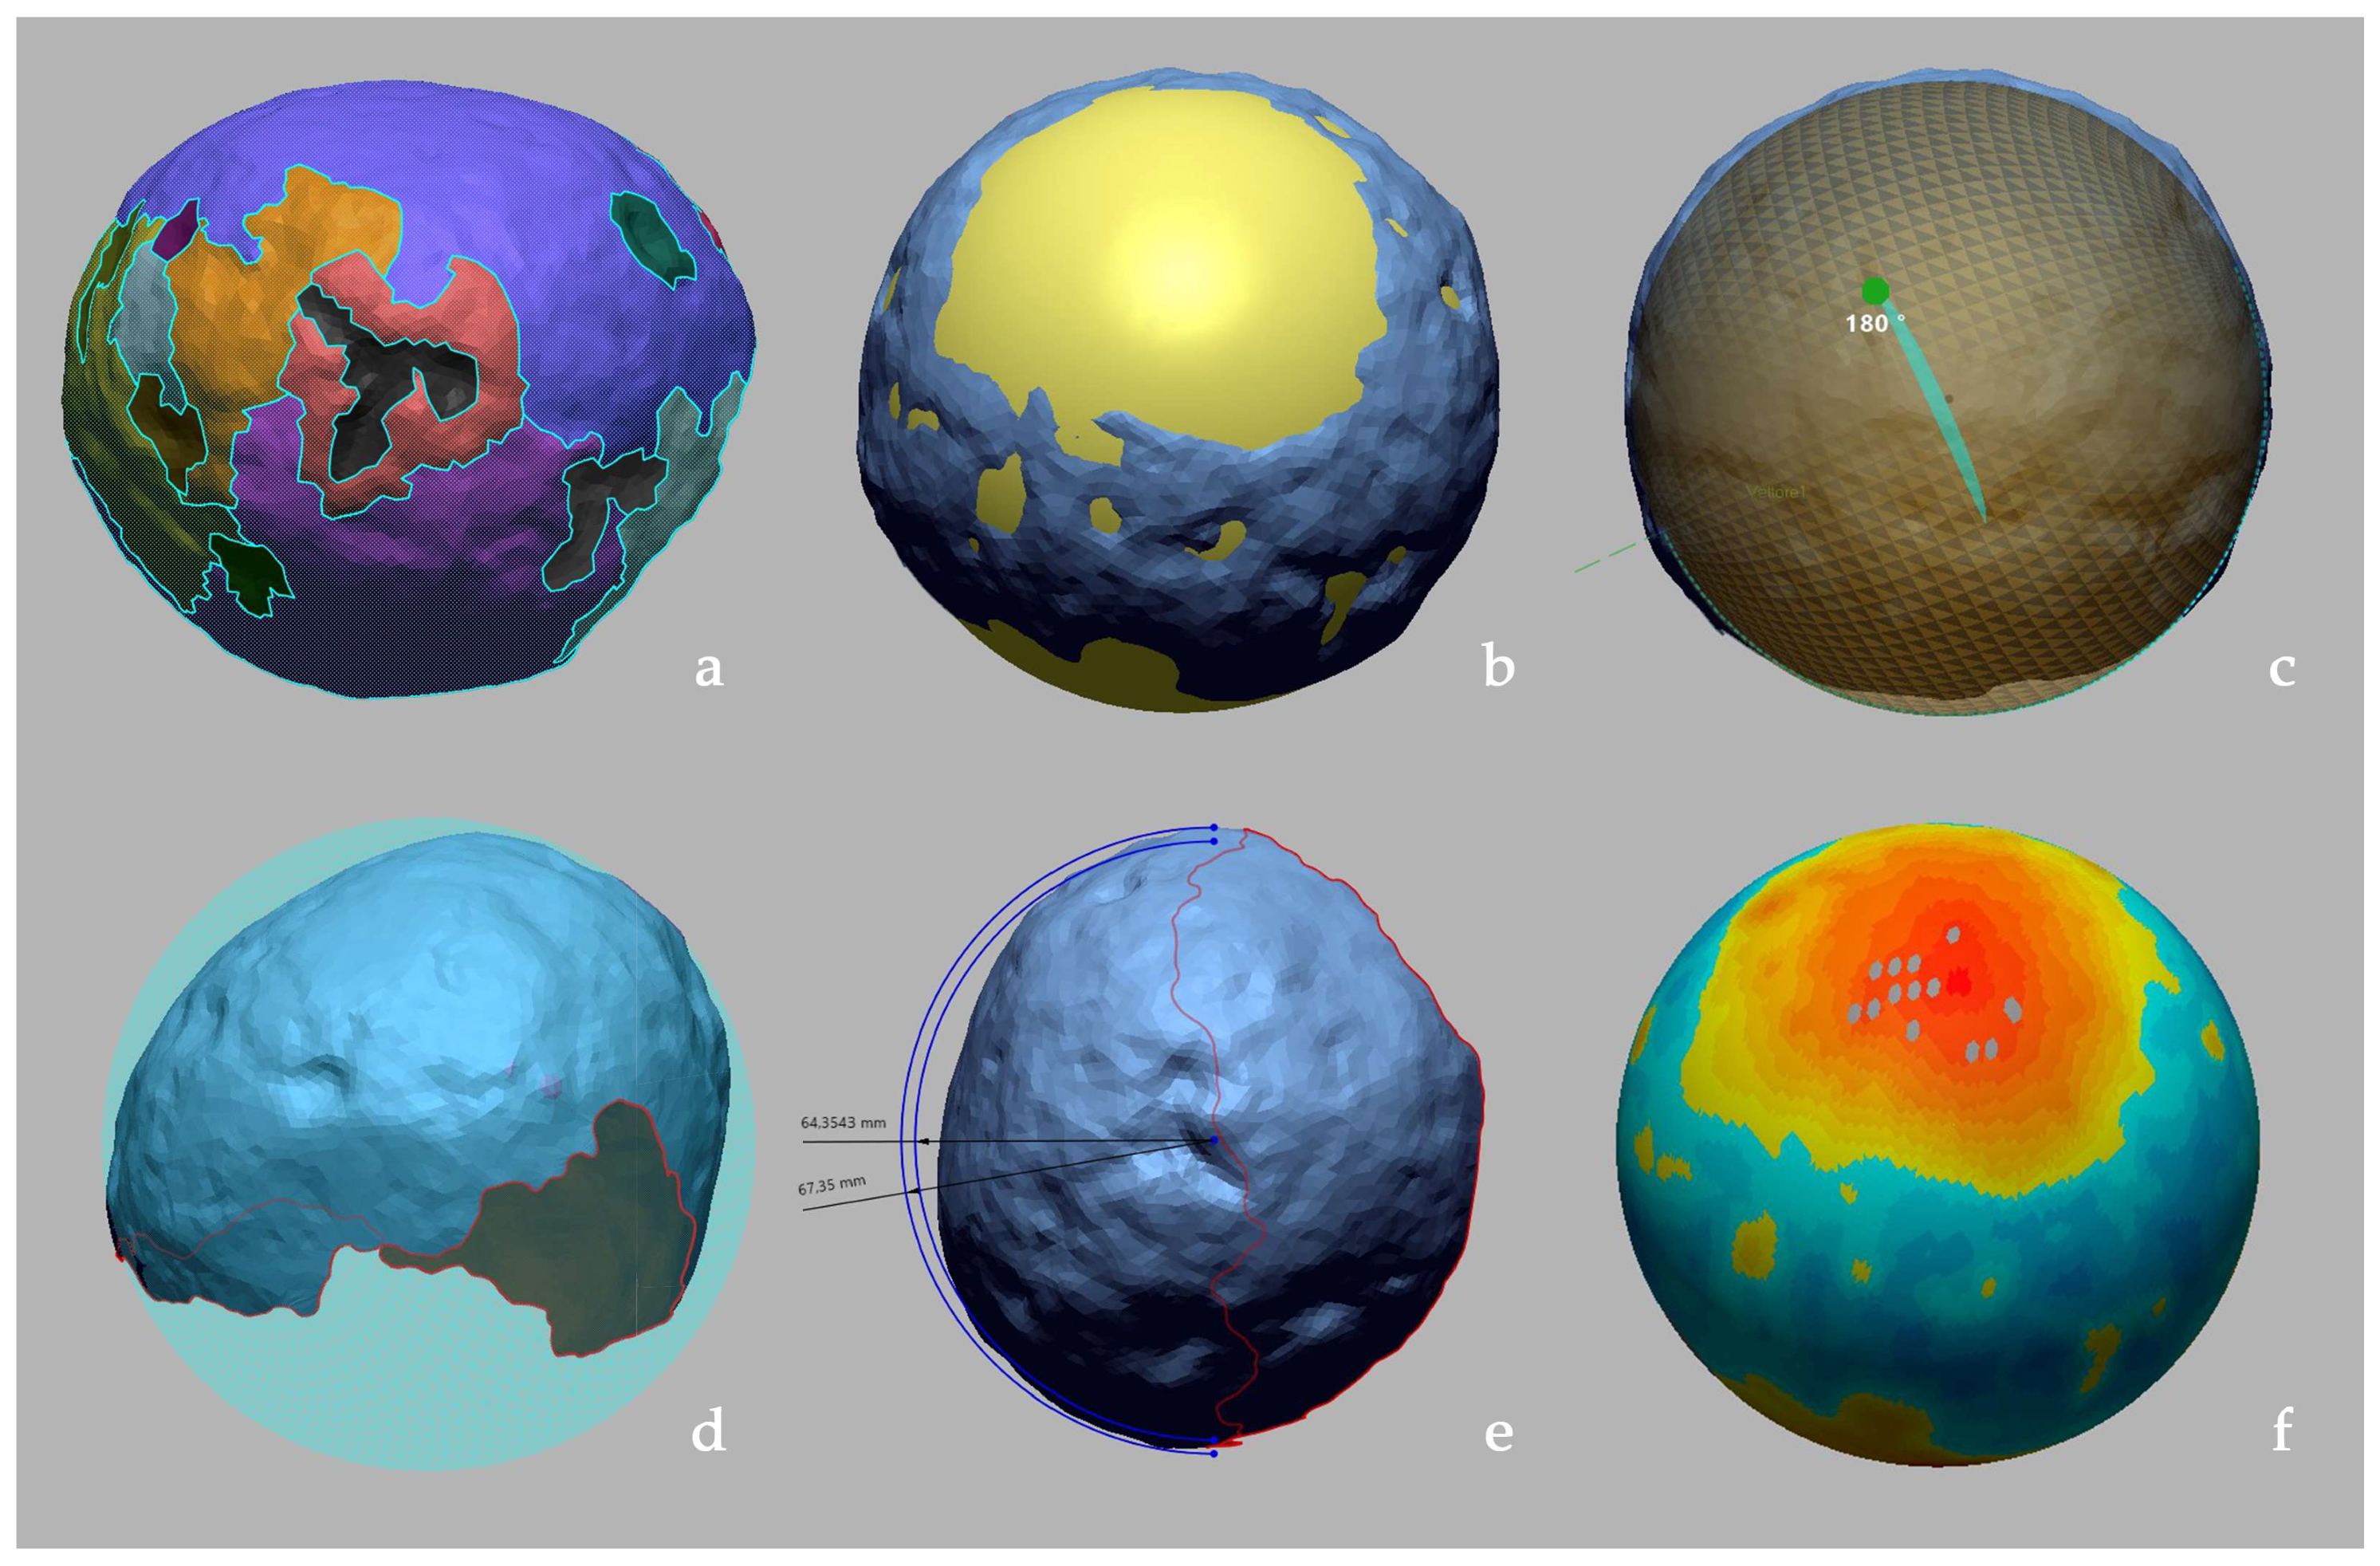
  • Mesh cleaning: Small hole-filling operations (within a certain size) and automatic corrections (e.g., removal of self-intersecting faces, minor and pendant faces, and clusters) improved the model’s accuracy (c);
  • Mesh optimization: Additional refinements were applied to regularize the mesh structure (d).
Once edited, the optimized models were re-textured into the photogrammetry software by reloading them with their original coordinates but with improved geometry. Due to the close stacking of objects, reprojection errors may have affected unrelated areas of the 3D model. These could be corrected by applying masks before generating the final texture.

3. Results

The geometric analysis of the obtained meshes can be conducted through different approaches: (i) Traditional methods, which involve taking approximate measurements and attaching photographs, as carried out in past studies [23,25,32]. While this provides valuable general information, it lacks precision. (ii) Manual Surface Reconstruction (MSR), where an expert operator extracts significant sections from the real survey to reconstruct the most accurate 3D shapes. This approach offers greater adherence to reality but is time-consuming. (iii) Automatic Surface Extraction (ASE), using software tools that approximate the objects as perfect theoretical spheres.
For MSR (Figure 5), a theoretical surface can be manually reconstructed by identifying key sections for shape analysis. This involves selecting multiple planes that intersect the existing portion of the object’s mesh at predefined intervals (a). The resulting polylines reliably describe the surface’s neighborhood and help to identify the most relevant sections for further modeling. From these polylines, best-fitting (B-F) circles can be obtained by excluding segments belonging to depressions (highlighted in pink), which result from material loss due to impact or natural stone defects during manufacturing (b). Alternatively, for a more precise reconstruction using loft surfaces, connecting different profiles (c), a set of B-F curves (ellipses) can be derived (d).
For ASE (Figure 6), using automatic primitives, it is possible to quickly extract simple solid geometric objects from a regionalized mesh or a portion of it. After filtering, the model must be automatically segmented, applying settings that account for mesh smoothness and uniformity, adjustable by the operator (a). This process segments the model into distinct color-coded regions, which the software automatically classifies as either freeform shapes or approximations of standard solids (spheres, cylinders, etc.). These regions, or a selected subset, such as excluding hollow parts caused by material breakage, can be used to extract surfaces or solids conforming to basic geometric primitives. In this case, the extracted shape is explicitly defined as a (partial or complete) sphere (b). The Automatic Surface Extraction suggests a spherical surface representing the average of the considered regions. However, it does not fully encompass the actual geometry; instead, it generates an approximate theoretical sphere. At this stage, the operator can adjust various parameters of the generated shape, including the radius and position of the semicircular profile of revolution, the position of the sphere’s center, and the vector passing through the center, acting as the axis for the 360° revolution of the profile. For instance, increasing the dimensions to contain the entire geometry requires modifying the semicircular profile’s radius. This adjustment affects the final reconstructed surface size (c). This approach is useful because initial analyses have shown that the geometry of the examined projectiles does not correspond to a perfect sphere but rather to a spheroid (d). Extracting multiple sections from the mesh reveals variations in radius measurements (e), sometimes differing by a few millimeters across different sections of the irregular mesh. By considering a set of three mutually orthogonal reference planes, it is necessary to define, especially for virtual simulations, whether to adopt a maximum or minimum bounding sphere within the given range. To visually verify deviations between the mesh and the reconstructed spherical surface, the Accuracy Analyzer tool can be used. This function measures deviations between two mesh bodies (base entity vs. reference entity), displaying results through a color-coded deviation bar. The scale ranges from yellow to red for positive values and light blue to dark blue for negative values. Additionally, the operator can set a tolerance threshold and analyze a histogram to monitor the distribution of deviation values (f).

4. Discussion and Future Developments

Regarding shape completion, minimizing manual user intervention, traditionally employed for completing missing parts, as discussed in previous sections, can be achieved by transitioning toward automated systems based on point clouds and machine learning [33]. Recent advances in single-frame shape reconstruction, including organic forms [34], could also be explored. However, these approaches require validation when dealing with objects originally designed to have specific geometric shapes, as our study focuses on the geometric analysis of ancient artifacts.
Although the methods used provided acceptable solutions, they proved less suitable when the object’s morphology was ovoidal and deviated significantly from a theoretical sphere, resembling instead an ellipsoid (Figure 7).
Rather than relying on automatic shape prediction, achieving a more accurate reconstruction would require generating a B-F ellipsoid directly from the available polygonal mesh [35]. This process requires a sufficiently large and evenly distributed set of surface points, ensuring that they are not located in depressions, fractures, or uncertainly reconstructed areas, to reliably approximate the object’s shape. To create a 3D ellipsoid from a given set of points, a fitting algorithm such as the Least Squares Ellipsoid Fitting (LSEF) method is typically used [36]. This method, based on least squares minimization, calculates the ellipsoid parameters (center, principal axes, and orientation) to best match the data. A test case was, therefore, performed using 30 surface points (a). The best-fitting ellipsoid was computed and found to closely align with the object’s shape. The calculation can be manually performed using Python 3.13.4 [37] or Rhinoceros/Grasshopper [38,39], processing spatial coordinates extracted from selected surface points. However, for this case study, the reconstruction was conducted automatically, providing only the spatial coordinates. The LSEF method, implemented via ChatGPT-4 [40], calculated key parameters (semi-axes, center position, orientation, and shape) and determined the best-fitting ellipsoid for the given partial surface (b). The method then proceeded to generate a polygonal mesh, allowing for a deviation analysis (c).
In the case examined, the object did not deviate significantly from a sphere, as the semi-axis values were nearly equal. However, the integration of AI-driven computation significantly reduced processing and data verification times. This method can be applied to future cases for broader and more in-depth studies.

5. Conclusions

The opportunity to document not only the impact craters on the city walls but also the stone projectiles that most likely caused them represents a unique chance to digitally compare both the dimensions of the holes and the blunt objects. This allows us to define a size range for the stone balls involved in the impacts, which is also essential for future virtual simulations of the firing power of Roman artillery.
This initial test, conducted exclusively through photogrammetric survey, will yield more precise dimensional data once a structured-light or triangulation scanner can be used. Such a method would provide not only higher resolution and detail quality but also greater measurement accuracy. Nevertheless, the current survey method already ensures a higher level of measurement reliability than what was achievable in antiquity (1st century BC) when producing and replicating stone projectiles. Therefore, the adopted procedure is expected to yield equally reliable and realistic results.
As a general consideration, once reliable measurements are obtained—currently sufficient for a preliminary study but better refined through range-based acquisition systems for further research on projectile mass—they can be compared to ancient units of measurement to identify potential discrepancies. For instance, the standard length of the Roman palmus was equal to one-quarter of a pes (Roman foot) and measured approximately 7.41 cm [41] (p. 8). This measurement aligns with the diameters of some of the impact cavities analyzed and with stone projectiles measuring 7 or 8 digiti in diameter (Roman digitus, each ≈ 1.85 cm, yielding approximately 12.95 cm or 14.80 cm, respectively), as found in the case studies. The data confirm the classification of two projectile size groups: larger projectiles, with diameters exceeding 9 Roman digiti (≈16.65 cm); smaller projectiles, with diameters ranging between 7 and 8 digiti (≈12–15 cm). The latter dimensions fall within the range proposed by Van Buren for the impact marks observed on the city walls [23] (p. 16), while according to Burns, only the 18 cm diameter balls (weighing 15 mina) matched the impact marks by physically fitting the missile into them [29] (p. 6).
Similar sandstone projectiles used in Roman artillery (ballistae) have been recorded in other countries, showing comparable dimensions with an average diameter ranging between 13.5 and 14.5 cm, with the average value equal to 14.3, corresponding to 9–10 librae balls [18] (Figure 2, p. 70). These findings confirm that beyond their roughly spherical shape, which remained imperfect due to the need for rapid production, the preferred size of projectiles was dictated by the mechanical constraints of the ballistae. The weight of these projectiles was calibrated to match the standard firing power of Roman siege weapons.
Further research and ongoing analysis of a larger sample of digitized case studies will contribute to a deeper understanding of the stone projectiles used in Roman artillery, particularly those probably used during the Sullan siege of Pompeii.

Funding

This research was supported by the project “SCORPiò-NIDI”, CUP B53D23022100006 (DD n. 1012/2023), funded by the Italian Ministry of Research under the PRIN (call DD n. 104/2022) funding initiative.

Institutional Review Board Statement

Not applicable.

Informed Consent Statement

Not applicable.

Data Availability Statement

Research data are available upon request.

Acknowledgments

The author would like to express her gratitude to the management and the appointed officials of the offices of the Pompeii Archaeological Park for granting authorizations for site access and survey operations.

Conflicts of Interest

The authors declare no conflicts of interest.

Abbreviations

The following abbreviations are used in this manuscript:
3DThree-Dimensional
ASEAutomatic Surface Extraction
CHCultural Heritage
B-FBest-fitting
LSEFLeast Squares Ellipsoid Fitting
MSRManual Surface Reconstruction
SfMStructure from Motion

References

  1. Fico, D.; Rizzo, D. (Eds.) Conservation Methodologies and Practices for Built Heritage; MDPI—Multidisciplinary Digital Publishing Institute: Basel, Switzerland, 2025; ISBN 978-3-7258-2743-5. [Google Scholar]
  2. Guarnieri, A.; Vettore, A.; El-Hakim, S.; Gonzo, L. Digital Photogrammetry and Laser Scanning in Cultural Heritage Survey. In Proceedings of the ISPRS XX Symposium, Istanbul, Turkey, 15 June 2004; Volume 2, pp. 1–6. [Google Scholar]
  3. Fassi, F.; Achille, C.; Fregonese, L.; Monti, C. Multiple Data Source for Survey and Modelling of Very Complex Architecture. Int. Arch. Photogramm. Remote Sens. Spat. Inf. Sci. 2010, XXXVIII, 234–239. [Google Scholar]
  4. Fascia, R.; Barbieri, F.; Gaspari, F.; Ioli, F.; Pinto, L. From 3D Survey to Digital Reality of a Complex Architecture: A Digital Workflow for Cultural Heritage Promotion. Int. Arch. Photogramm. Remote Sens. Spat. Inf. Sci. 2024, XLVIII-2-W4-2024, 205–212. [Google Scholar] [CrossRef]
  5. Astorga González, E.M.; Municio, E.; Noriega Alemán, M.; Marquez-Barja, J.M. Cultural Heritage and Internet of Things. In GoodTechs ’20: Proceedings of the 6th EAI International Conference on Smart Objects and Technologies for Social Good, Antwerp, Belgium, 14–16 September 2020; Association for Computing Machinery: New York, NY, USA, 2020; pp. 248–251. [Google Scholar] [CrossRef]
  6. Casillo, M.; Colace, F.; Gaeta, R.; Lorusso, A.; Santaniello, D.; Valentino, C. Revolutionizing Cultural Heritage Preservation: An Innovative IoT-Based Framework for Protecting Historical Buildings. Evol. Intell. 2024, 17, 3815–3831. [Google Scholar] [CrossRef]
  7. Costantino, C.; Prati, D.; Predari, G.; Bartolomei, C. 3D Laser Scanning Survey for Cultural Heritage. A Flexible Methodology to Optimize Data Collection. Int. Arch. Photogramm. Remote Sens. Spat. Inf. Sci. 2020, XLIII-B2-2020, 821–828. [Google Scholar] [CrossRef]
  8. Li, F.; Spettu, F.; Achille, C.; Vassena, G.; Fassi, F. The Role of Web Platforms in Balancing Sustainable Conservation and Development in Large Archaeological Site: The Naxos Case Study. Int. Arch. Photogramm. Remote Sens. Spat. Inf. Sci. 2024, XLVIII-2-W8-2024, 303–310. [Google Scholar] [CrossRef]
  9. Spiess, F.; Waltenspül, R.; Schuldt, H. The Sketchfab 3D Creative Commons Collection (S3D3C). arXiv 2024, arXiv:2407.17205. [Google Scholar] [CrossRef]
  10. Bertacchi, S.; Juan Vidal, F.; Fantini, F. Ancient Architectural Design Interpretation: A Framework Based on Alexandrian Manuals. Acta IMEKO 2024, 13, 1–9. [Google Scholar] [CrossRef]
  11. Adembri, B.; Cipriani, L.; Bertacchi, G. Guidelines for a Digital Reinterpretation of Architectural Restoration Work: Reality-Based Models and Reverse Modelling Techniques Applied to the Architectural Decoration of the Teatro Marittimo, Villa Adriana. ISPRS-Int. Arch. Photogramm. Remote Sens. Spat. Inf. Sci. 2017, XLII-5/W1, 599–606. [Google Scholar] [CrossRef]
  12. Eramo, E.; Cinque, G.E. The Vault of the So-Called Serapeum: An Ellipsoidal Geometry at Hadrian’s Villa. In Graphic Horizons; Hermida González, L., Xavier, J.P., Pernas Alonso, I., Losada Pérez, C., Eds.; Springer Nature Switzerland: Cham, Switzerland, 2024; pp. 51–58. [Google Scholar] [CrossRef]
  13. Rossi, A. The Survey of the Ballistic Imprints for a Renewed Image of Unearthed Pompeii. Nexus Netw. J. 2024, 26, 307–324. [Google Scholar] [CrossRef]
  14. Bertacchi, S.; Gonizzi Barsanti, S.; Rossi, A. Geometry of Wall Degradation: Measuring and Visualising Impact Craters in the Northern Walls of Pompeii. SCIRES-IT-Sci. Res. Inf. Technol. 2024, 14, 111–128. [Google Scholar] [CrossRef]
  15. Russo, F.; Russo, F. 89 a.C. Assedio a Pompei: La Dinamica e Le Tecnologie Belliche Della Conquista Sillana Di Pompei; Edizioni Flavius: Pompei, Italy, 2005; ISBN 88-88419-32-2. [Google Scholar]
  16. Vitruvius, P. De Architectura; Gros, P., Ed.; Einaudi: Torino, Italy, 1997. [Google Scholar]
  17. Holley, A.E. The Ballista Balls from Masada. In Masada IV: The Yigael Yadin Excavations 1963–1965. Final Reports; Aviram, J., Foerster, G., Netzer, E., Eds.; Israel Exploration Society: Hebrew University of Jerusalem: Jerusalem, Israel, 1994; pp. 347–365. ISBN 978-965-221-010-4. [Google Scholar]
  18. Wilkins, A.; Barnard, H.; Rose, P.J. Roman Artillery Balls from Qasr Ibrim, Egypt. Sudan Nubia Sudan Archaeol. Res. Soc. 2006, 10, 64–78. [Google Scholar]
  19. Wilkins, A. Roman Imperial Artillery: Outranging the Enemies of the Empire, 3rd ed.; Archaeopress Roman Archaeology; Archaeopress: Oxford, UK, 2024; ISBN 978-1-80327-783-7. [Google Scholar]
  20. Maiuri, A. Studi e Ricerche Sulla Fortificazione di Pompei; Monumenti Antichi Pubblicati per cura della R. Accademia dei Lincei; Hoepli: Milano, Italy, 1929; Volume 33. [Google Scholar]
  21. Giglio, M.; Pesando, F. La Guerra sociale, l’assedio e la fine di Pompei sannitica. In Proceedings of the Pompei 79 d.C. Una Storia Romana, Roma, Italy, 6 November 2020–31 January 2021; Torelli, M., Ed.; Electa: Milano, Italy, 2020; pp. 144–151, ISBN 978-88-9282-011-1. [Google Scholar]
  22. Di Marco, U.; Molari, P.G. Archimede ed il sistema di caricamento della balista da un talento utilizzata nella fortezza dell’Eurialo di Siracusa. In Proceedings of the 4th International Conference|Atti dell’8° Convegno Nazionale, Naples, Italy, 11 December 2020; D’Agostino, S., d’Ambrosio Alfano, F.R., Eds.; Cuzzolin: Napoli, Italy, 2020; Volume I, pp. 393–408. [Google Scholar]
  23. Van Buren, A.W. Further Pompeian Studies. MAAR 1932, 10, 7–54. [Google Scholar] [CrossRef]
  24. Piranesi, F.; Guattani, G.A. Antiquités de la Grande Grèce, Aujourd’hui Royaume de Naples, Gravées par François Piranesi; Piranesi Leblanc: Paris, France, 1804; Volume 1. [Google Scholar]
  25. Van Buren, A.W. Further Studies in Pompeian Archaeology. MAAR 1925, 5, 103–113. [Google Scholar] [CrossRef]
  26. Fiorelli, G. Pompeianarum Antiquitatum Historia; s.n.: Napoli, Italy, 1862; Volume 2. [Google Scholar]
  27. Fiorelli, G. Gli Scavi di Pompei dal 1861 al 1872 Relazione al Ministro della Istruzione Pubblica di Giuseppe Fiorelli; Tipografia italiana nel liceo V. Emanuele: Napoli, Italy, 1873. [Google Scholar]
  28. Schumacher, G. Tell El Mutesellim. Bericht Über Die 1903 Bis 1905 Mit Unterstützung SR. Majestät Des Deutschen Kaisers Und Der Deutschen Orientgesellschaft Vom Deutschen Verein Zur Erforschung Palästinas Veranstalteten Ausgrabungen; Rudolf Haupt: Leipzig, Germany, 1908. [Google Scholar]
  29. Burns, M. Pompeii under Siege: A Missile Assemblage from the Social War. JRMES 2015, 14/15, 1–10. [Google Scholar]
  30. Agisoft Metashape Professional. Available online: https://www.agisoft.com/ (accessed on 1 February 2025).
  31. 3D Systems Geomagic Design X. Available online: https://www.3dsystems.com/software/geomagic-design-x (accessed on 1 February 2025).
  32. Maiuri, A. Pompei. Isolamento della cinta murale tra la Porta Vesuvio e la Porta Ercolano. Not. Degli Scavi Antich. 1943, VII, 275–314. [Google Scholar]
  33. Tesema, K.W.; Hill, L.; Jones, M.W.; Ahmad, M.I.; Tam, G.K.L. Point Cloud Completion: A Survey. IEEE Trans. Vis. Comput. Graph. 2024, 30, 6880–6899. [Google Scholar] [CrossRef] [PubMed]
  34. Diao, H.; Jiang, X.; Fan, Y.; Li, M.; Wu, H. 3D Face Reconstruction Based on a Single Image: A Review. IEEE Access 2024, 12, 59450–59473. [Google Scholar] [CrossRef]
  35. Eramo, E.; Fantini, F. An Integrated Approach for Investigating Roman Cupolas: From Segmented Models to Trikentron Analyis. Disegnarecon 2024, 17, 5.1–5.12. [Google Scholar] [CrossRef]
  36. Li, Q.; Griffiths, J.G. Least Squares Ellipsoid Specific Fitting. In Proceedings of the Geometric Modeling and Processing 2004 (GMP’04), Beijing, China, 13–15 April 2004; pp. 335–340. [Google Scholar] [CrossRef]
  37. Python. Available online: https://www.python.org (accessed on 23 March 2025).
  38. Rhinoceros (Rhino 3D). Available online: https://www.rhino3d.com (accessed on 1 February 2025).
  39. Grasshopper. Algorithmic Modeling for Rhino. Available online: https://www.grasshopper3d.com (accessed on 23 March 2025).
  40. ChatGPT (OpenAI). Available online: https://openai.com/chatgpt (accessed on 2 April 2025).
  41. Molari, P.G.; Maraldi, M.; Angelini, G.; Bignami, S.; Lionello, G. La ricostruzione della balista di Vitruvio. In Proceedings of the Quinta Giornata di Studio Ettore Funaioli (V GEF), Bologna, Italy, 15 July 2011; 2012; pp. 1–26. [Google Scholar] [CrossRef]
Figure 1. Several stone projectiles attributed to the siege of Sulla in the 1st century BC are preserved in the Antiquarium of Porta Marina. Scholars have also recorded additional ones kept in the excavation deposits [15] (pp. 33, 93), but the initial study focuses only on the stone projectiles displayed to the public, here visible in the former exhibition layout (a,b).
Engproc 96 00003 g001
Figure 2. A comparison of (left) the presumed blunt projectile launched and (right) its presumed effect on the city walls (not to scale). Historical pictures: (a) “Missiles in the Museum of the Forum” (Plate 2, Figure 1, 1932); (b) “Marks of the Sullan Bombardment, Pompeii” (Plate 60, Figure 1, 1925). Photograph credits: [23,25].
Engproc 96 00003 g002
Figure 3. Image processing phase with Metashape (a); reconstructed polygonal mesh model, shown with (b) and without texture (c).
Engproc 96 00003 g003
Figure 4. Processing steps for mesh editing: the model confidence of the reconstructed mesh (a); edge smoothing before and after application (b, above-bottom); mesh editing and cleaning (c); mesh optimization before and after application (d, above-bottom).
Engproc 96 00003 g004
Figure 5. Processing steps for MSR reconstruction: (a) multiple plane section for B–F main circle extraction (b); (c,d) B-F ellipses extraction for loft reconstruction.
Engproc 96 00003 g005
Figure 6. Processing steps for ASE reconstruction: (a) mesh regionalization; (b) automatic sphere extraction; (c) parameter modification; (d) spheroid case study; (e) minimum/maximum radius for the bounding sphere; (f) deviation between mesh and theoretical sphere.
Engproc 96 00003 g006
Figure 7. Processing steps for automatic ellipsoid reconstruction: (a) selected surface points; (b) automatically generated 3D ellipsoid using the LSEF method implemented in ChatGPT; (c) cross-sections deviation analysis between mesh and 3D ellipsoid.
Engproc 96 00003 g007
Disclaimer/Publisher’s Note: The statements, opinions and data contained in all publications are solely those of the individual author(s) and contributor(s) and not of MDPI and/or the editor(s). MDPI and/or the editor(s) disclaim responsibility for any injury to people or property resulting from any ideas, methods, instructions or products referred to in the content.

