Abstract
This study presents a 39-year spatiotemporal analysis of shoreline variability at Topocalma Beach (Chile) using satellite-derived data collected between 1985 and 2024. A total of 350 satellite images were processed with CoastSat and DSAS v6.0 to quantify erosional and accretional trends across distinct beach sectors. The results show persistent erosion in the proximal zone near the Topocalma wetland and localized accretion in the distal (southern) segment. These changes are closely associated with the 2010 Maule earthquake and tsunami, strong ENSO phases, and an increase in storm surge activity since 2015. The spatiotemporal beach width model reveals distinct phases of retreat and short-term post-seismic stabilization, followed by a shift to sustained erosion. Overall, this study underscores the limited natural recovery capacity of the beach and highlights the utility of satellite-based monitoring tools for coastal resilience planning in data-limited regions.
1. Introduction
Coastal environments are important natural systems that provide valuable services for the prevention of natural hazards (such as storminess, wave climate, and climate extremes) and habitat for both biological diversity and human use [1]. Marine, atmospheric, and terrestrial processes, including wave energy, sediment supply, and climate variability, e.g., ENSO (El Niño–Southern Oscillation) and SAM (Southern Annular Mode), all contribute to the complexity of the morphodynamics that emerge on varying spatial and temporal scales [2,3].
Interest in shoreline retreat, degradation of coastal ecosystems, and the increasing exposure of infrastructure has grown over the last few decades, especially in microtidal sandy coasts with high seasonal and interannual variability [4,5]. Although in situ monitoring programs have generated valuable information, their limited spatial and temporal coverage has led to the growing use of satellite-based techniques. These methods offer scalable and cost-effective alternatives for long-term shoreline monitoring in areas with scarce ground data [6,7,8].
In the past few decades, satellite remote sensing has emerged as a powerful and reliable tool for studying coastal change. With the development of platforms such as Landsat (5 to 9) and Sentinel-2, and shoreline detection algorithms such as CoastSat V 2.6 and SAET V 2.0, it has become possible to monitor changes in shoreline position over multiple decades [9,10,11]. This is particularly important in regions with limited or poor-quality field data, as it enables continuous and large-scale surveillance, contributing to the development of improved decision-support tools for coastal management [12,13].
In Chile, Topocalma Beach, in the O’Higgins Region, is a micromareal sandy system of high environmental and geomorphological value; however, there are no detailed integrated long-term analyses of shoreline change. This research gap is filled by this study, which investigates the spatial and temporal shoreline dynamics of Topocalma between 1985 and 2024, using satellite-derived shorelines from Landsat and Sentinel images. The aim of this study is to recognize erosion–accretion trends and to assess the potential influence of climate (ENSO and SAM) and earthquake events on the coastal morphodynamic behavior to advance the understanding of climate-induced shoreline responses and to contribute to the development of a forecasting tool for implementation in integrated coastal management.
2. Material and Methods
2.1. Study Area
Topocalma Beach is located in the commune of Litueche, Cardenal Caro Province, within the Libertador General Bernardo O’Higgins Region of central Chile (Figure 1). It is situated on a high-energy open coast exposed to a continuous supply of southwesterly swells from the Pacific Ocean, and is characterized by a microtidal regime [14] and a steep continental shelf that focuses wave energy on the nearshore [15].
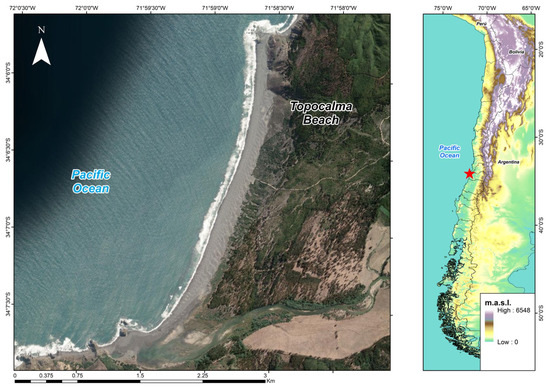
Figure 1.
Location of Topocalma Beach in the commune of Litueche, Cardenal Caro Province, Libertador General Bernardo O’Higgins Region, central coast of Chile.
The beach is approximately 6.5 km long and is adjacent to the Topocalma Estuary, which is a fluvial system that significantly affects sediment transport and coastal morphology in the area [15,16]. This coastal region is also tectonically active and has experienced several devastating earthquakes and tsunamis in recent decades, namely the 2010 Maule earthquake [16]. And the cove is within a Marine Coastal Nature Sanctuary, Piedra del Viento y Topocalma, emphasizing not just its ecological value, but the importance of offering conservation measures which recognize the natural ebb and flow of a shoreline.
2.2. Satellite Data and Shoreline Extraction
This study employed multi-decadal satellite imagery to extract shoreline positions for Topocalma Beach between 1985 and 2024. Data sources included Landsat 5 TM, Landsat 7 ETM+, Landsat 8 and 9 OLI, as well as Sentinel-2 MSI missions. More than 350 shoreline positions were generated using CoastSat 2.6, an open-source Python 3.11.5 toolkit designed for semi-automated shoreline detection [17].
The CoastSat workflow applies band-ratio techniques—typically using red/NIR combinations—and sub-pixel edge detection to delineate the land–water interface in cloud-free, low-tide images. Only scenes with minimal cloud cover and favorable tidal conditions were selected for processing. CoastSat integrates supervised classification methods with spectral indices to achieve precise shoreline delineation, reaching an estimated accuracy of approximately 8.2 m [13].
Its open-source architecture allows researchers and coastal managers to adapt the tool to their specific needs. CoastSat is available on GitHub 2.6 and includes extensive documentation and example workflows in Jupyter Notebooks, facilitating its application in geospatial analysis environments. Moreover, its integration with Google Earth Engine enables efficient extraction of long-term shoreline datasets from Landsat and Sentinel-2 imagery, making it a valuable resource for monitoring sandy coasts across multiple temporal scales [17].
To assess seasonal variability, satellite images were filtered to include only those acquired during the austral summer (December–February) and winter (June–August). All preprocessing and shoreline extraction steps were conducted within Google Earth Engine and Python environments [18].
Tidal corrections were performed using the FES2022 global tide model (Finite Element Solution), as no tide gauge or buoy instrumentation is available for the study area.
2.3. Erosion Rate Analysis
Shoreline positions extracted from satellite imagery were analyzed using the Digital Shoreline Analysis System (DSAS) version 6.0, a plugin developed by the U.S. Geological Survey for use with ArcGIS [18]. A series of transects, spaced every 100 m, were generated perpendicular to a manually defined baseline along the shoreline. Shoreline change rates (in meters per year) were estimated using the linear regression rate (LRR) method, which calculates the slope of the best-fit line through all shoreline positions over the study period.
In parallel with the statistical analysis, a spatiotemporal model was constructed using Python and R to visualize shoreline evolution and identify morphodynamic phases. This model facilitated the segmentation of time periods associated with erosional and accretional trends, allowing for the identification of changes linked to interannual and multi-year environmental forcings.
2.4. Validation and Environmental Data Integration
To assess the accuracy of the satellite-derived shoreline data for Topocalma Beach, ground-truth observations were collected through UAV-based photogrammetry and GPS-RTK surveys conducted in 2023. These measurements served as benchmarks to validate shoreline positions extracted using the CoastSat workflow.
For this study, three representative transects were selected across the proximal, central, and distal sectors to compare CoastSat-derived shoreline positions against high-resolution UAV data. Due to the limited number of ground control points, no statistical metrics (e.g., RMSE, MAE, bias) were formally computed for Topocalma. Instead, the transects confirmed positional agreement within CoastSat’s expected error range (less than 10 m), supporting the reliability of the method.
The validation methodology follows the framework proposed by [19], which demonstrated that CoastSat achieves subpixel shoreline detection accuracy using satellite imagery. Their evaluation across 120 transects reported an average RMSE of 8.23 m, MAE of 6.38 m, and low systematic bias, establishing CoastSat as a reliable tool for decadal shoreline monitoring.
2.5. Climate Wave
The analysis was developed from the regional model Wave Watch III, developed jointly by NOAA/NCEP, Delft University of Technology, and NASA. This model generates the spectral action density balance equation that describes the evolution in space and time of wave fields influenced by wind, currents, and bathymetry. Three parameters of the simulations were considered in the study: significant wave height (Hs) in m, peak period in seconds, and dominant wave direction in degrees [20].
We further characterized large-scale ocean–atmosphere variability using the Oceanic Niño Index (ONI), the NOAA primary diagnostic tool for monitoring ENSO that gives an index for the oceanic part of the ENSO phenomenon (i.e., El Niño–Southern Oscillation). The ONI is produced as the running mean of SST anomalies in the Niño 3.4 region (5° N–5° S, 120°–170° W) over a period of three months, centered on the middle month, and based on a centered 30-year base period; the SSTs are based on ERSSTv5 SST climatology [21].
Positive anomalies greater than +0.5 °C for five or more consecutive seasons are characteristic of El Niño conditions, and negative anomalies of less than −0.5 °C are indicative of La Niña episodes. Anomalous values that fall between ±0.5 °C are considered to be ENSO-neutral. The ONI is generally considered one of the stronger ENSO indices because it accounts for persistent SST anomalies, which are often accompanied by associative atmospheric responses, such as Walker circulation relocations and tropical convection pattern alteration [22].
3. Results
3.1. Seasonal Erosion Trends
Seasonal analysis revealed marked differences in shoreline behavior between austral summer and winter months (Figure 2).
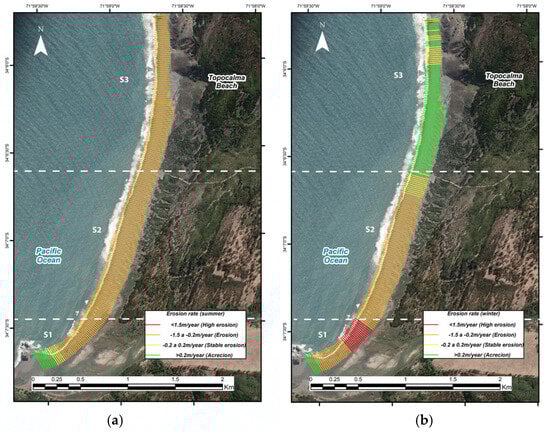
Figure 2.
Seasonal shoreline change rates at Topocalma Beach. (a) Summer period. (b) Winter period. Erosion and accretion classified by DSAS linear regression (m/year).
During summer (Figure 2a), the beach exhibited widespread erosion. The central sector (S2) recorded the highest average erosion rate at −0.69 m/year, followed by the proximal sector (S1) with −0.60 m/year, and the distal sector (S3) with −0.58 m/year. Despite the generalized retreat, localized stability and slight accretion were observed near the Estero Topocalma (S1), likely influenced by fluvial sediment dynamics.
The accretion observed in the proximal southern sector (S1) can be attributed to fluvial discharge processes, particularly hypopycnal flows. These buoyant flows transport sediments seaward in diluted plumes, promoting wide dispersal without significant seabed accumulation. Such dynamics play a crucial role in sediment deposition and morphology at river mouths [23,24].
In winter (Figure 2b), the pattern shifted. The distal sector (S3) experienced the most intense erosion, reaching −1.11 m/year, likely due to direct exposure to storm-driven wave energy. The central sector (S2) showed a reduced retreat at −0.29 m/year, and notably, the proximal sector (S1) showed a positive rate of +0.40 m/year, indicating seasonal accretion.
These seasonal contrasts underscore the role of varying wave regimes in sediment transport. While summer is typically influenced by longer-duration swell waves, the increased occurrence of swell-induced events in recent years has intensified summer erosion, particularly in S2 and S1. In contrast, winter is dominated by high-energy storm systems, which intensify sediment loss, especially in the proximal sector. Additionally, longshore sediment transport, acting predominantly from north to south, further contributes to the spatial redistribution of erosion and accretion patterns observed across the beach.
3.2. Long-Term Shoreline Change (1985–2024)
Between 1985 and 2024, Topocalma Beach showed a general trend of shoreline retreat, with marked differences across the three defined sectors: S1 (south, proximal area near the Estero Topocalma), S2 (central sector), and S3 (north, distal area) (Figure 3).
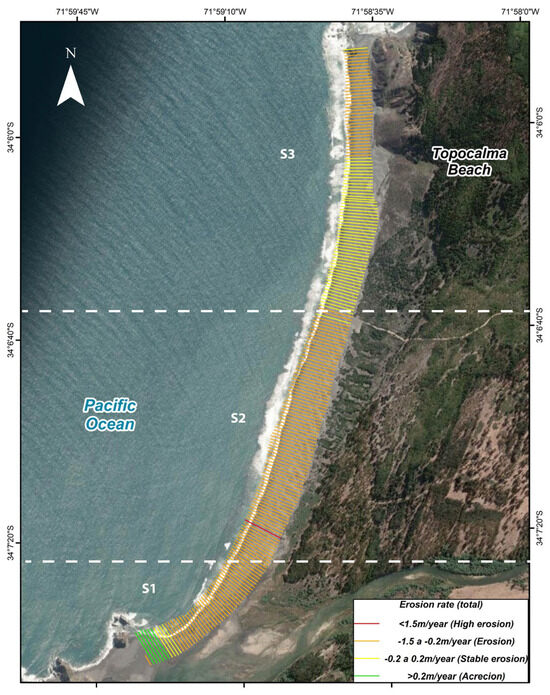
Figure 3.
Net shoreline change rates for the entire study period (1985–2024). Persistent erosion observed in the proximal and central sectors.
Over the entire study period, the proximal sector (S1) (which includes the mouth of the Estero Topocalma) exhibited the highest average erosion rate, reaching −0.63 m/year. This reflects a long-term sediment deficit in this area, likely driven by reduced sediment supply and persistent offshore transport.
The central sector (S2) showed a moderate shoreline retreat of −0.42 m/year, indicating transitional morphodynamic behavior modulated by the interplay of longshore drift and incident wave energy.
The distal sector (S3), located at the northern end of the beach, presented the lowest erosion rate, averaging −0.15 m/year. This relative stability may be attributed to the accumulation of sediments from south-to-north coastal transport or to localized protection because of rock outcrops.
This relative stability may be associated with reduced exposure to high-energy wave action or lower sediment mobility compared to other sectors. Alternatively, it may reflect short-term sediment retention linked to local bathymetric or hydrodynamic conditions, though further analysis would be required to confirm these dynamics.
3.3. Spatiotemporal Variability of Beach Width
The proximal sector (S1) presented the highest morphodynamic dynamism during the study period (1985–2024). Although it was relatively stable until the early 2000s, the sector has ultimately been in a state of erosion since 2008, with beach width losses of over 40 m, and persistent erosion appears to be reflecting its high sensitivity to seismic and climatic forcings during times of multiannual thermal anomalies and high-energy wave events (Figure 4).
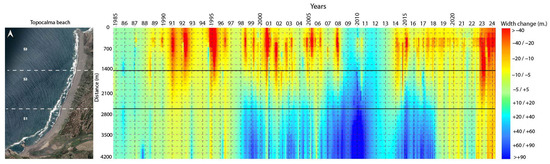
Figure 4.
Spatiotemporal model of beach width variation (1985–2024). Warm colors indicate erosion phases; cool colors represent accretion.
The central sector (S2) was characterized by alternating periods of moderate erosion and temporary stability between 1985 and 2010. However, since 2015, a shift toward a chronic erosional regime is recognized, with beach widths decreasing by between 10 and 20 m, possibly because of the delayed morphodynamic response to the Maule earthquake (2010) and an exacerbating of wave energy collections related to the 2015–16 El Niño episode, registering a thermal anomaly above +2.6 °C.
Two periods of marked erosion were detected in the distal sector (S3). The first developed between 1991 and 1994 with >40 m of beach width loss, possibly related to preceding events preceding the 1997–1998 El Niño, marked by increasingly intense swell activity and large thermal anomalies. The following episode was recorded from 2022 to 2024. It was within the framework of continuous thermal anomalies and revealed a significant increase in the wave action in the systems, which was compatible with the information reported by the Chilean Climate Report published in 2022 and by simulations of the Chilean Wave Climate Atlas. This is indicative of some interplay between the interannual variability and the regional warming influencing the coastal retreat.
3.4. Climate and Wave Forcing
The central Chilean coast is characterized by a highly energetic wave regime influenced by southwesterly swells originating in the mid-latitudes of the South Pacific. Significant wave height (Hs) ranges between 1.8 and 2.5 m annually, with peak values generally observed during the austral winter (Figure 5). This wave climate is not constant, as it is modulated by large-scale climate phenomena such as the El Niño–Southern Oscillation (ENSO) and the Southern Annular Mode (SAM), which generate pronounced intra-seasonal and interannual variability [25,26,27].
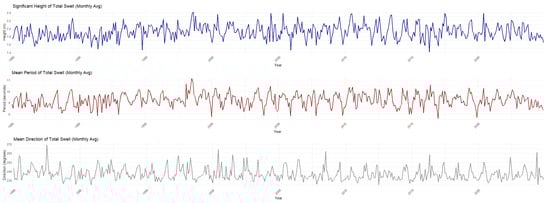
Figure 5.
Significant wave height (m) (blue); period (seconds) (red) and direction (°) (gray). Source: Era5 reanalysis (ECMW).
Figure 6 shows that strong El Niño episodes in 1997–98, 2015–16, and 2023–24 coincided with sustained negative phases of the Southern Oscillation Index (SOI) and minimum values of the Oceanic Niño Index (ONI).
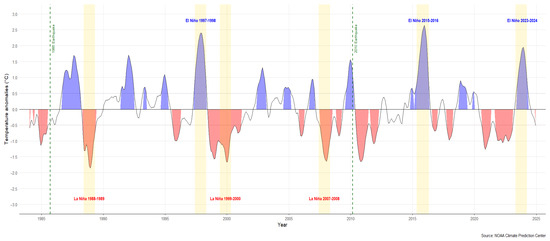
Figure 6.
ONI (1984–2024) with key ENSO events. El Niño (blue) and La Niña (red).
During the 2015 El Niño (Figure 6), a major storm impacted the central coast of Chile on August 8. It was an unusual event, combining strong wind gusts (up to 110 km/h), very low atmospheric pressure (991 hPa), and high waves (significant wave height reaching 7.2 m off Valparaíso) [28,29]. Together, these conditions caused serious erosion and damaged port structures, and coastal protection works. This event shows that ENSO-related changes can worsen local hazards. In addition, the amount of wave energy arriving at the coast increased, especially near Valparaíso. Although the Hs values did not rise much, the wave period and direction did reach historical highs. This mismatch, known as spectral asymmetry, has also been seen in the North Pacific, where El Niño swells travel far, losing height but lasting for a longer duration. This shift makes coastlines more exposed, and it might help explain shoreline retreats of more than 40 m at several Chilean sites. In contrast, during La Niña, cooler ocean temperatures, lower sea levels, and more southerly waves are common. Depending on the coastal shape, this can help stabilize or even build up the shoreline.
4. Conclusions
The spatiotemporal study of the shoreline morphodynamics of Topocalma Beach (1985–2024) showed spatial and seasonal patterns in the behavior of the coast. Long-term erosional trends were predominant throughout the entire sector, with the most intense and consistent retreat at the distal southern sector (S3) where overnight shoreline change rates of >−1.2 m/year, were observed. The central area (S2) presented mean but continuous erosion, while the proximal sector (S1), near the Estero Topocalma, was more variable, alternating between localized accretion and stability in some periods.
Seasonal variability was also evident: during the austral winter, the proximal sector (S1) experienced the highest erosion rates, surpassing −1.5 m/year, likely associated with storm-driven wave activity. In contrast, the summer season showed more pronounced erosion in the distal sector (S3), driven by long-period swells and net sediment transport from south to north along the beach profile. These results highlight the combined influence of seasonal wave energy and sediment dynamics in shaping shoreline responses at different spatial scales.
The influence ENSO modulates both erosion and accretion processes in exposed beaches of the southeastern Pacific. During the ENSO warm phase (El Niño), there is an increase in coastal exposure as the wave energy increases and the time for sediment recovery is shortened, with periods of La Niña tending to promote relative stability parameterized by local morphologic settings. The detection of these patterns from spectral analysis, time series, and satellite observations suggests the inclusion of the ENSO signal in predictive systems and coastal planning. This is even more applicable in the context of climate change, which will result in more regular and likely stronger ENSO events, and will also have implications for spatial planning and shoreline resilience.
Topocalma’s changing coastline has been tracked over the past four decades thanks to satellite imagery from the Landsat and Sentinel missions. Such images have been critical for measuring coastal changes over time in a repetitive and reliable manner that allows us to detect trends, identify areas of erosion, and enhance risk assessment. This kind of satellite monitoring is particularly useful for making decisions about the management and protection of dynamic coastlines with high energy, such as Topocalma, where both the wave action and the tectonics will always guide the coastal changes.
One of the main constraints associated with using satellite imagery for coastal monitoring in Central Chile is the presence of the coastal trough, an atmospheric condition expressed as a layer of stratiform clouds, which is enhanced during the early morning—at the time of day when most optical satellite overpasses occur (Landsat, Sentinel-2, etc.). This cloud coverage results in the lack of operation of the SH, which cannot continuously capture cloud-free images for the detection of shoreline and other dynamic processes.
However, these limitations are slowly being remedied with new satellite sensors that have shorter revisit times, nodal orbit configurations, and more sensitive multi-spectral technologies. The deployment of constellations such as PlanetScope, Sentinel-2B, and high-resolution commercial missions has enhanced the revisit frequency and the probability of obtaining cloud-free scenes even in the presence of unfavorable atmospheric conditions. These improvements, combined with finer spatial resolution, allow for stronger and more frequent monitoring of coastal dynamics at broader spatial scales, even in regions that have historically been challenging to monitor due to the presence of continuous cloud coverage, which constrained the use of the multitemporal method.
Author Contributions
Conceptualization, W.P.-M. and I.B.d.U.; methodology, W.P.-M. and I.B.d.U.; software, J.V.-J.; validation, J.V.-J. and I.D.-Q.; formal analysis, W.P.-M.; investigation, W.P.-M. and I.B.d.U.; resources, I.B.d.U. and W.P.-M.; data curation, W.P.-M.; writing—original draft preparation, W.P.-M.; writing—review and editing, W.P.-M. and I.B.d.U.; visualization, J.V.-J. and I.D.-Q.; supervision, W.P.-M.; project administration, I.B.d.U. and W.P.-M.; funding acquisition, I.B.d.U. and W.P.-M. All authors have read and agreed to the published version of the manuscript.
Funding
This research was funded by Agencia Nacional de Investigación y Desarrollo (Concurso de Investigación Tecnológica FONDEF 2023), and by the project MONCOSTA Red nacional de monitoreo de la costa chilena (Proyecto ID IT 23I0069).
Institutional Review Board Statement
Not applicable.
Informed Consent Statement
Not applicable.
Data Availability Statement
Dataset can be available at https://gorev.moncosta.org/ (accessed on 3 January 2025).
Conflicts of Interest
The authors declare no conflicts of interest.
References
- Short, A.D.; Jackson, D.W.T. Beach morphodynamics. In Treatise Geomorphology; Shroder, J.F., Ed.; Academic Press: San Diego, CA, USA, 2013; Volume 10, pp. 106–129. [Google Scholar] [CrossRef]
- Barnard, P.L.; Erikson, L.H.; Foxgrover, A.C.; Finzi Hart, J.A.; Limber, P.; O’ Neill, A.C.; van Ormondt, M.; Vitousek, S.; Wood, N.; Hayden, M.K.; et al. Dynamic flood modeling essential to assess the coastal impacts of climate change. Sci Rep. 2019, 9, 4309. [Google Scholar] [CrossRef]
- Harley, M.D.; Turner, I.L.; Short, A.D.; Ranasinghe, R. Interannual variability and controls of the Sydney wave climate. Int. J. Climatol. 2010, 30, 1322–1335. [Google Scholar] [CrossRef]
- Luijendijk, A.; Hagenaars, G.; Ranasinghe, R.; Baart, F.; Donchyts, G.; Aarninkhof, S. The State of the World’s Beaches. Sci Rep. 2018, 8, 6641. [Google Scholar] [CrossRef]
- Konlechner, T.M.; Kennedy, D.M.; O’Grady, J.J.; Leach, C.; Ranasinghe, R.; Carvalho, R.C.; Luijendijk, A.P.; McInnes, K.L.; Ierodiaconou, D. Mapping spatial variability in shoreline change hotspots from satellite data; a case study in southeast Australia. Estuar. Coast. Shelf Sci. 2020, 246, 107018. [Google Scholar] [CrossRef]
- Scott, J.W.; Moore, L.R.; Harris, W.M.; Reed, M.D. Using the Landsat 7 Enhanced Thematic Mapper Tasseled Cap Transformation to Extract Shoreline. U.S. Geological Survey Open-File Report 03–272. 2003. Available online: http://pubs.usgs.gov/of/2003/0272/ (accessed on 20 May 2025).
- Splinter, K.D.; Turner, I.L.; Davidson, M.A.; Barnard, P.; Castelle, B.; Oltman-Shay, J. A generalized equilibrium model for predicting daily to interannual shoreline response. J. Geophys. Res. Earth Surf. 2014, 119, 1936–1958. [Google Scholar] [CrossRef]
- Barnard, P.L.; Short, A.D.; Harley, M.D.; Splinter, K.D.; Vitousek, S.; Turner, I.L.; Allan, J.; Banno, M.; Bryan, K.R.; Doria, A.; et al. Coastal vulnerability across the Pacific dominated by El Niño/Southern Oscillation. Nat. Geosc. 2015, 8, 801–807. [Google Scholar] [CrossRef]
- Ozturk, D.; Sesli, F.A. Shoreline change analysis of the Kizilirmak Lagoon Series. Ocean Coast Manag. 2015, 118, 290–308. [Google Scholar] [CrossRef]
- Vos, K.; Splinter, K.D.; Harley, M.D.; Simmons, J.A.; Turner, I.L. CoastSat: A Google Earth Engine-enabled Python toolkit to extract shorelines from publicly available satellite imagery. Environ. Model. Softw. 2019, 122, 104528. [Google Scholar] [CrossRef]
- Palomar-Vázquez, J.; Pardo-Pascual, J.E.; Almonacid-Caballer, J.; Cabezas-Rabadán, C. Shoreline Analysis and Extraction Tool (SAET): A New Tool for the Automatic Extraction of Satellite-Derived Shorelines with Subpixel Accuracy. Remote Sens. 2023, 15, 3198. [Google Scholar] [CrossRef]
- Pardo-Pascual, J.E.; Almonacid-Caballer, J.; Cabezas-Rabadán, C.; Fernández-Sarría, A.; Armaroli, C.; Ciavola, P.; Montes, J.; Souto-Ceccon, P.E.; Palomar-Vázquez, J. Assessment of satellite-derived shorelines automatically extracted from Sentinel-2 imagery Using SAET. Coastal Eng. 2024, 188, 104426. [Google Scholar] [CrossRef]
- Vos, K.; Splinter, K.D.; Palomar-Vázquez, J.; Pardo-Pascual, J.E.; Almonacid-Caballer, J.; Cabezas-Rabadán, C.; Kras, E.; Luijendijk, A.; Kalkoen, F.; Almeida, L.P.; et al. Benchmarking satellite-derived shoreline mapping algorithms. Commun. Earth Environ. 2023, 4, 345. [Google Scholar] [CrossRef]
- Jara-Muñoz, J.; Melnick, D.; Brill, D.; Strecker, M.R. Segmentation of the 2010 Maule Chile earthquake rupture from a joint analysis of uplifted marine terraces and seismic-cycle deformation patterns. Quat. Sci. Rev. 2015, 113, 171–192. [Google Scholar] [CrossRef]
- Martínez, C.; Grez, P.W.; Martín, R.A.; Acuña, C.E.; Torres, I.; Contreras-López, M. Coastal erosion in sandy beaches along a tectonically active coast: The Chile Study Case. Prog. Phys. Geogr. 2021, 46, 250–271. [Google Scholar] [CrossRef]
- Alegría, C.; Angélica, M. Levantamiento hidrogeológico en cuencas pluviales costeras en la Región del Libertador Bernardo O’Higgins, del Maule y del Bío-Bío, etapa 2. Dirección General de Aguas; Aqualogy Medioambiente Chile S.A.; DGA, División de Estudios y Planificación. 2014. Available online: https://bibliotecadigital.ciren.cl/handle/20.500.13082/32744 (accessed on 20 May 2025).
- Almonacid-Caballer, J.; Sánchez-García, E.; Pardo-Pascual, J.E.; Balaguer-Beser, A.A.; Palomar-Vázquez, J. Evaluation of annual mean shoreline position deduced from Landsat imagery as a mid-term coastal evolution indicator. Mar. Geol. 2016, 372, 79–88. [Google Scholar] [CrossRef]
- Himmelstoss, E.A.; Henderson, R.E.; Farris, A.S.; Kratzmann, M.G.; Bartlett, M.K.; Ergul, A.; McAndrews, J.; Cibaj, R.; Zichichi, J.L.; Thieler, E.R. Digital Shoreline Analysis System, version 6.0.; U.S. Geological Survey: Reston, VA, USA, 2024. [CrossRef]
- Briceño-de-Urbaneja, I.; Pardo-Pascual, J.E.; Cabezas-Rabadán, C.; Aguirre, C.; Martínez, C.; Pérez-Martínez, W.; Palomar-Vásquez, J. Characterization of Multi-Decadal Beach Changes in Cartagena Bay (Valparaíso, Chile) from Satellite Imagery. Remote Sens. 2024, 16, 2360. [Google Scholar] [CrossRef]
- Tolman, H.L. Treatment of unresolved islands and ice in wind wave models. Ocean. Model. 2003, 5, 219–231. [Google Scholar] [CrossRef]
- Huang, B.; Thorne, P.W.; Banzon, V.F.; Boyer, T.; Chepurin, G.; Lawrimore, J.H.; Menne, M.J.; Smith, T.M.; Vose, R.S.; Zhang, H. Extended Reconstructed Sea Surface Temperature, Version 5 (ERSSTv5): Upgrades, Validations, and Intercomparisons. J. Clim. 2017, 30, 8179–8205. [Google Scholar] [CrossRef]
- NOAA (National Oceanic and Atmospheric Administration). 2023. Available online: https://origin.cpc.ncep.noaa.gov/products/analysis_monitoring/ensostuff/ONI_v5.php (accessed on 10 April 2023).
- Gibbs, A.E.; Jones, B.; Richmond, B.M. A GIS Compilation of Vector Shorelines and Coastal Bluff Edge Positions, and Associated Rate-of-Change Data for Barter Island; U.S. Geological Survey Data: Alaska, NSW, USA, 2020. [CrossRef]
- Wright, L.D. Sediment transport and deposition at river mouths: A synthesis. Geol. Soc. Am. Bull. 1977, 88, 857–868. [Google Scholar] [CrossRef]
- Hemer, M.A.; Church, J.A.; Hunter, J.R. Variability and trends in the directional wave climate of the Southern Hemisphere. Int. J. Climatol. 2010, 30, 475–491. [Google Scholar] [CrossRef]
- Stopa, J.E.; Cheung, K.F. Periodicity and patterns of ocean wind and wave climate. J. Geophys. Res. Oceans 2014, 119, 5563–5584. [Google Scholar] [CrossRef]
- Aguirre, C.; Rutllant, J.A.; Falvey, M. Wind waves climatology of the Southeast Pacific Ocean. Int. J. Climatol. 2017, 37, 4288–4301. [Google Scholar] [CrossRef]
- Winckler, P.; Contreras-López, M.; Campos-Caba, R.; Beyá, J.F.; Molina, M. El temporal del 8 de agosto de 2015 en las regiones de Valparaíso y Coquimbo, Chile Central. Lat. Am. J. Aquat. Res. 2017, 45, 622–648. [Google Scholar] [CrossRef]
- Carvajal, M.; Contreras-López, M.; Winckler, P.; Sepúlveda, I. Meteotsunamis Occurring Along the Southwest Coast of South America During an Intense Storm. Pure Appl. Geophys. 2017, 174, 3313–3323. [Google Scholar] [CrossRef]


Disclaimer/Publisher’s Note: The statements, opinions and data contained in all publications are solely those of the individual author(s) and contributor(s) and not of MDPI and/or the editor(s). MDPI and/or the editor(s) disclaim responsibility for any injury to people or property resulting from any ideas, methods, instructions or products referred to in the content. |
© 2025 by the authors. Licensee MDPI, Basel, Switzerland. This article is an open access article distributed under the terms and conditions of the Creative Commons Attribution (CC BY) license (https://creativecommons.org/licenses/by/4.0/).