1. Introduction
Air pollution is a significant health concern identified by the World Health Organization (WHO), as exposure to it can lead to serious health issues and climate impacts. The WHO revealed that 99% of the global population breathes air containing pollutant levels exceeding safe guidelines [
1]. Indoor particulate level (IPL) is notably higher than outdoor particulate level (OPL), with IPL being approximately 20% higher in naturally ventilated buildings than mechanically ventilated ones [
2].
Volatile organic compounds (VOCs) are found in pesticides, gasoline, and paint, as well as in vehicle emissions and fuel burning [
3]. Exposure to high VOC levels can cause health issues such as drowsiness, dizziness, headaches, and even cancer. High concentrations of air pollutants pose significant health risks, not only outdoors but also indoors, as the latter has heightened pollution levels.
However, studies on the characteristics of VOC and PM2.5 emissions are lacking even though VOC in high concentrations can cause health risks and illnesses. Therefore, we characterize six common household pollutants in this study by identifying and analyzing their concentrations, and potential health impacts within indoor environments. By understanding these pollutants in detail, information on their behavior and interactions with various air filtration systems is provided. The findings of this study contribute to developing more effective strategies in improving indoor air quality.
2. Literature Review
Air quality, a critical indicator of environmental and health safety, reflects the presence of solid particles and pollutants. Good air quality means minimal pollutants, while poor air quality indicates harmful levels. With current technology, pollutant concentrations are measured using the air quality index (AQI). To improve air quality, various air purification systems are used. For instance, an in-vehicle air purifier effectively filters VOCs better than existing ones [
4]. A real-time particulate matter monitoring system has been developed using microcontrollers and mobile apps, successfully identifying pollution levels in various locations.
Air pollutants pose significant health and environmental risks, prompting organizations such as the Environmental Protection Agency (EPA) to regulate them to safe levels. Ground-level ozone, unlike stratospheric ozone, forms by chemical reactions involving nitrogen and VOCs, worsening asthma and ecosystems. VOCs, often derived from man-made chemicals in paints and refrigerants, can reach concentrations of two to five times higher indoors than outdoors. Particulate matter, a mix of solid particles and liquid droplets, is classified by size (PM10 and PM2.5) and is only observable with a microscopy. Sulfur dioxide (SO2), from fossil fuel combustion and volcanic activity, can irritate the skin and respiratory system. Nitrogen dioxide (NO2), also from burning fossil fuels, similarly inflames airways and poses serious health risks.
3. Methodology
Conceptual Framework
We used unfiltered air, Sansevieria trifasciata (snake plant), a PM2.5 sensor, and a VOC sensor in this study. The snake plant was selected for its air-filtering capabilities, while the sensors were used to measure pollutant concentrations. We designed a multilayered filtration system with biofiltration (enhanced with activated carbon), high-efficiency particulate air (HEPA), and electrostatic filters. A graphic user interface (GUI) was developed to display and record real-time data from sensors. The outputs displayed PM2.5 and VOC levels. The data were displayed and recorded by the GUI.
The prototype air filter system is initialized at the hotspot. It then loads the program so that the integrated PMS5003 and SGP30 sensors begin collecting TVOC and PM2.5 data. These data are stored in a database for statistical analysis and historical reference. Real-time data are updated on the GUI and graphically represented. The system then returns to data collection, completing the cycle (
Figure 1).
The system is composed of ten parts, as shown in
Figure 2. The air enters the system with the help of the inlet fan which is processed by the filters included in the system. These filters are layered upon one another and comprise a HEPA filter, activated carbon, an electrostatic filter, and a snake plant. The air sucked into the system passes through these filters and is then released by the outlet fan. Two sensors are used to detect the concentrations of PM2.5 and TVOC. The data gathered by the sensors are then stored using Raspberry Pi, which acts as a server and is finally communicated to the mobile device or personal computer of the user.
The system was deployed in a room of 2 × 3 × 2.7 m (27.7 m
2) (
Figure 3). The room was isolated from the living room and had one window. The window and door of the room were closed throughout the experiment (
Figure 3).
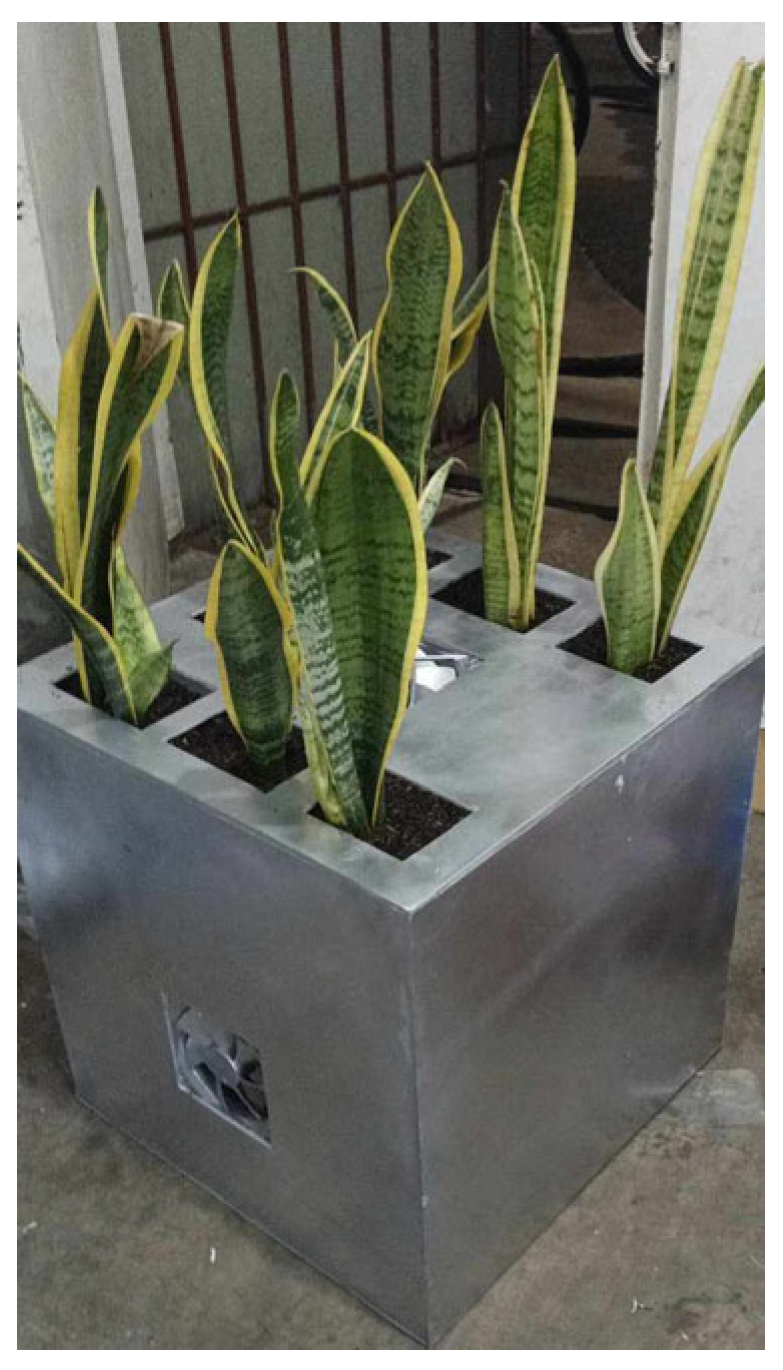
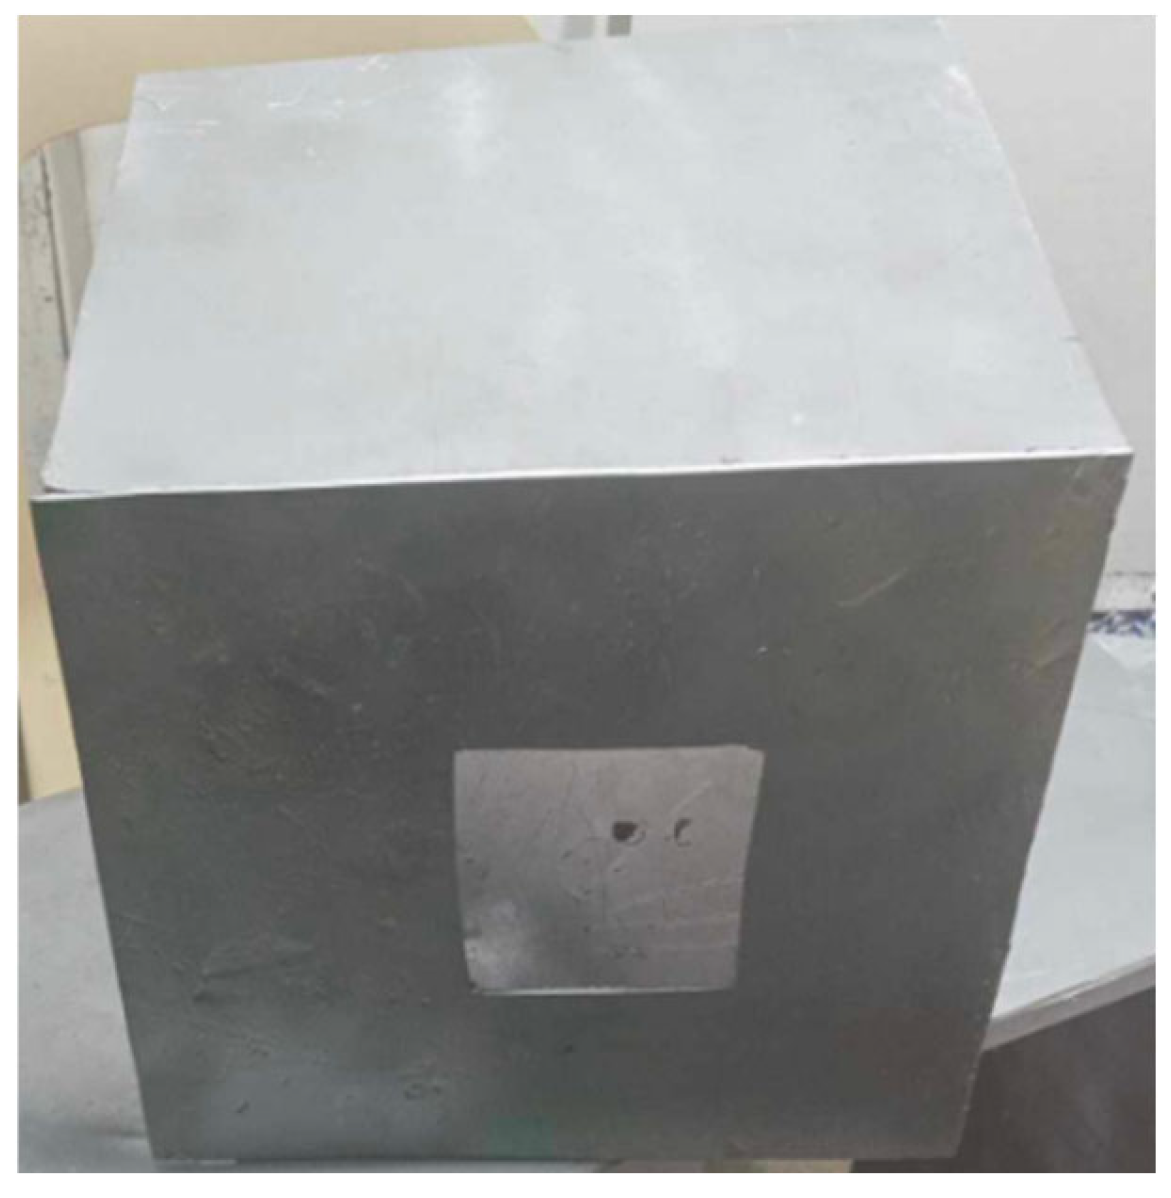
In the system, the plant box was made of Sintra board with a dimension of 18 × 18 × 18 inches. Two inlet fans were placed on two opposite sides of the box to serve as the input of the system. The circuitry of the system, including the Raspberry Pi and the electrostatic filter, was encased using two Sintra boards with mesh in the middle for the HEPA filter and activated carbon. For the biofiltration layer, snake plants with soil were placed in pockets on top of the system (
Figure 4,
Figure 5 and
Figure 6).
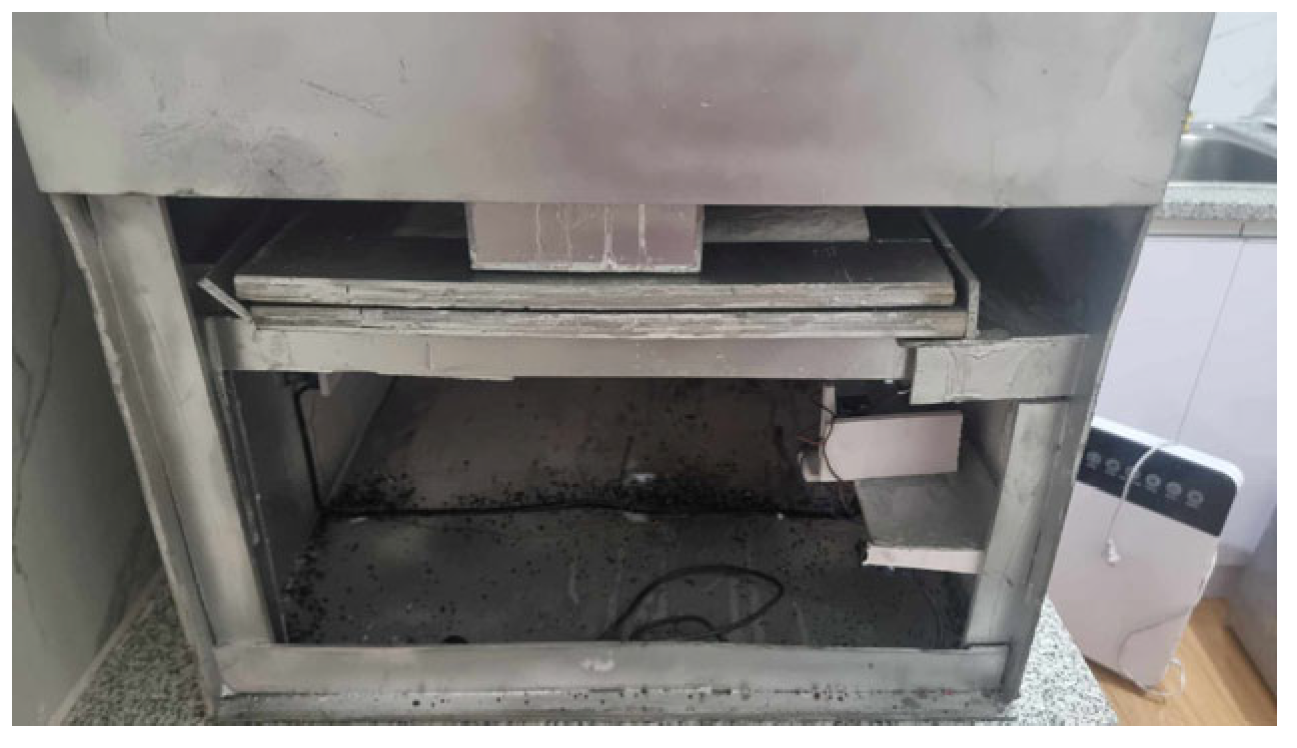
Figure 7 shows the inside of the prototype, specifically the activated carbon filter and its overall view, respectively.
A statistical analysis was conducted to test the significant difference in PM2.5 and VOC concentrations between a commercial air filter (A) and the proposed multilayered air filter system (B). We recorded pollutant levels every 2 h over 24 h to reduce the error. Before the experiment, the room was exposed to pollutants from common household activities [
5]. An independent sample t-test was used to assess the significance of the difference, with the null hypothesis revealing no significant difference and the alternative hypothesis revealing a significant difference in PM2.5 and VOC levels between the two filters. The sums (∑A and ∑B), the squares of their sums (∑A
2 and ∑B
2), and the sum of squares (∑A
2 and ∑B
2) were calculated, and the t-value was computed using these data. The alpha level used for this statistical analysis was 0.05.
In testing the air filter, six common household pollutants were selected due to their capacity to emit PM2.5 and VOCs. Vaping emits smoke and uses flavoring compounds such as formaldehyde. Burning cooking oil emits various sizes of particulate matter. Light propane gas (LPG) emits minimal particulate matter and VOC. Candles release carcinogenic toxins and soot which are considered harmful. Cigarette smoke produces fine particulate matter which can affect indoor air quality. Mosquito coil emits smoke and releases VOCs. Single-factor ANOVA was conducted to determine the significant difference between pollutants. A post hoc test was performed to determine the relationships between pollutants.
4. Results and Discussion
We analyzed the results of the commercial tester and the developed system. Differences were observed in the statistical data.
Common Household Pollutants
Table 1 shows the percentage of filtered TVOC. The percentage of filtered TVOC was calculated using the intake, which represents the volume of pollutants entering the system (1).
There were significant differences between the pollutants. A post hoc test was performed to determine the differences between the pollutants. The average percentage of TVOC in filtered vape displayed no significant differences when compared to mosquito coils, candles, and cigarettes, but had significantly lower VOC than frying and was higher than LPG. The mosquito coil showed no significant difference when compared to candles and cigarettes but emitted less VOC than frying and more than LPG. A total of 23.8% of TVOCs from LPG was filtered while 32.1, 32.4, 32.9, 33.2, and 42.9% of TVOCs from LPG, mosquito coils, vape smoke, candles, and frying were filtered (
Table 1 and
Table 2).
The
p-values of the different sources showed significant differences. A total of 83.3% PM 2.5 from vapes was filtered. A total of 85.1, 85.9, 87.1, 87.8, and 87.9% PM2.5 from frying, LPG, candles, mosquito coils, and cigarettes were filtered. There was no statistically significant difference between frying and LPG. Similarly, the candle, mosquito coil, and cigarette groups also exhibited no significant differences (
Table 3 and
Table 4).
5. Conclusions
Significant differences existed among the tested pollutants in terms of TVOC and PM2.5 concentrations. For TVOC from candles, mosquito coils, and cigarettes, there were no significant differences between a commercial air filter and the proposed multilayered air filter system. After filtering, the lowest concentration levels of TVOC were recorded from frying (42.9%), while the highest concentration levels were associated with LPG (23.8%). Significant differences were found among the pollutants in terms of PM2.5 concentrations between the filtering capacity of the two systems. Frying and LPG showed similar results in terms of PM2.5, while candles, mosquito coils, and cigarettes did not show significant differences in terms of PM2.5. The amount of PM2.5 filtered from vapes was 83.3% as the least filtered pollutant, while that of cigarettes was 87.9% as the most filtered one. These results highlight the varying impacts of different pollutants on indoor air quality. This research contributes to the characterization of pollutants with the aim of improving indoor air quality and future designs and standards in air filtration systems.
Author Contributions
Conceptualization, M.G.B. and J.A.C.; methodology, J.A.C.; software, M.G.B.; validation, G.V.M., M.G.B., and J.A.C.; formal analysis, M.G.B. and J.A.C.; investigation, M.G.B. and J.A.C.; resources, M.G.B. and J.A.C.; data curation, M.G.B. and J.A.C.; writing-original draft preparation, M.G.B. and J.A.C.; writing-review and editing, G.V.M., M.G.B. and J.A.C.; visualization, M.G.B. and J.A.C.; supervision, G.V.M.; project administration, M.G.B. and J.A.C.; funding acquisition, M.G.B. and J.A.C. All authors have read and agreed to the published version of the manuscript.
Funding
This research received no external funding.
Institutional Review Board Statement
Not applicable.
Informed Consent Statement
Not applicable.
Data Availability Statement
The data presented in this study are available in this manuscript.
Conflicts of Interest
The authors declare no conflict of interest.
References
- World Health Organization. Air Pollution. Available online: https://www.who.int/health-topics/air-pollution#tab=tab_1 (accessed on 15 October 2022).
- Fu, N.; Kim, M.K.; Huang, L.; Liu, J.; Chen, B.; Sharples, S. Experimental and numerical analysis of indoor air quality affected by outdoor air particulate levels (PM1.0, PM2.5 and PM10), room infiltration rate, and occupants’ behaviour. Sci. Total Environ. 2022, 851, 158026. [Google Scholar] [CrossRef] [PubMed]
- Giri, B.S.; Sarowgi, A.; Kaushik, Y.; Pal, A.; Jaiswal, A.; Kumari, S.; Singh, H.; Sonwani, R.; Thivaharan, V.; Singh, R.S. Indoor potted plant based biofilter: Performance evaluation and kinetics study. Indian J. Exp. Biol. 2019, 57, 879–886. [Google Scholar]
- Agullo, K.V.T.; Sasis, J.P.A.; Sese, J.T. Air Purification System for Air Quality Monitoring In-Vehicle. In Proceedings of the 2022 International Electronics Symposium (IES), Surabaya, Indonesia, 9–11 August 2022; pp. 136–141. [Google Scholar] [CrossRef]
- Acceptable Standard Deviation (SD)—LabCE.com, Laboratory Continuing Education. Available online: https://www.labce.com/spg49741_acceptable_standard_deviation_sd.aspx (accessed on 14 October 2022).
| Disclaimer/Publisher’s Note: The statements, opinions and data contained in all publications are solely those of the individual author(s) and contributor(s) and not of MDPI and/or the editor(s). MDPI and/or the editor(s) disclaim responsibility for any injury to people or property resulting from any ideas, methods, instructions or products referred to in the content. |
© 2025 by the authors. Licensee MDPI, Basel, Switzerland. This article is an open access article distributed under the terms and conditions of the Creative Commons Attribution (CC BY) license (https://creativecommons.org/licenses/by/4.0/).


