1. Introduction
As global power demand increases, renewable energy is increasingly used. Renewable energy alleviates the depletion of fossil fuels and mitigates the impacts of climate change, contributing to environmental sustainability [
1,
2,
3,
4]. Recently, photovoltaic (PV) technology has been significantly advanced, and the installed capacity of PV systems continues to increase globally [
5]. The growth of PV technology has been driven by its pollution-free nature, noiselessness, cost-effectiveness, modularity, ease of installation, reliability, and wide availability [
6]. However, PV systems are often deployed in harsh environments, such as on rooftops or in wastelands [
7]. Prolonged exposure to these conditions inevitably leads to various faults that negatively impact system performance, reduce power generation, and, in several cases, result in severe hazards such as fires [
8,
9]. Thus, the implementation of advanced fault detection and diagnosis techniques is critical to improving the reliability, efficiency, and safety of PV systems [
10].
References [
11,
12,
13,
14,
15,
16,
17] provide a detailed overview of fault types in PV systems and various fault detection and diagnosis methods, which are categorized into visual and thermal methods (VTMs) and electrical-based methods (EBMs). VTMs are mainly used to detect panel damage, discoloration, browning, and surface contamination, while EBMs are used to determine the electrical characteristics of modules or strings in PV systems [
16]. As an EBM, the I-V characteristic analysis (IVCA) method is widely used in assessing the performance of PV modules or strings owing to its effectiveness. An I-V curve represents all possible operating currents and voltages of a PV module or string under real-time irradiance and temperature conditions. From this curve, key electrical parameters, such as the open-circuit voltage, short-circuit current, maximum power point, and fill factor, are estimated [
9,
18]. The I-V curve’s profile changes depending on the fault type and severity. Thus, IVCA is useful in identifying fault types and severity by comparing the output characteristics of modules or strings under both normal and abnormal conditions [
19].
In this study, we explored the application of MATLAB/Simulink software to model various types of faults in PV systems, including module degradation as well as open-circuit, short-circuit, shading, and hotspot faults. The I-V characteristics associated with these faults were measured on a PV site and were analyzed. By utilizing curve fitting and analyzing the I-V characteristics, potential faults and their severity in PV systems were diagnosed.
In this article,
Section 2 introduces the modeling and validation of the PV model within the simulation framework.
Section 3 details the modeling methods for module aging as well as open-circuit, short-circuit, shading, and hotspot faults, along with an analysis of their I-V characteristics. In
Section 4, real measurement data from a PV site are presented for fault diagnosis through curve fitting. Finally,
Section 5 summarizes the key findings of this paper.
2. Modeling and Simulation
To model various faults in PV systems, the accuracy of the PV site’s simulation model must be established and verified. From the specification of the PV module, the key parameters of the standard test conditions (STC) were identified, as shown in
Table 1. STC refers to an air mass of 1.5, irradiance of 1000 W/m², and a module temperature of 25 °C [
20]. Based on the module parameters, a simulation model of the PV site was developed using MATLAB/Simulink, as illustrated in
Figure 1. The PV site operated 22 series-connected modules, each containing 60 cells.
Table 2 presents the simulation results for this PV site. The simulated open-circuit voltage was 869 V for the 22 series-connected modules, and the simulated peak power was 6710 W (305 × 22 = 6710). By comparing the data in
Table 1 and
Table 2, the accuracy of the simulation model was calculated.
3. Simulation and Analysis of Common Faults
This section outlines the modeling methods for common DC-side faults in photovoltaic (PV) systems using MATLAB/Simulink software, including module degradation as well as open-circuit, short-circuit, shading, and hotspot faults. Additionally, it provides an analysis of the I-V characteristics corresponding to each fault type.
3.1. Module Degradation
Degradation is a phenomenon of material deterioration. PV modules operating in harsh environments undergo aging due to prolonged exposure to elements such as wind and rain [
11]. Under ideal conditions, the module’s parallel resistance (
Rsh) is high, and its series resistance (
Rs) is low, optimizing the conversion efficiency of the PV cells. However, as degradation occurs,
Rsh decreases or
Rs increases, significantly reducing the module’s output power [
21]. In the modeling process, ideal conditions are represented by setting
Rsh to 10 Ω and
Rs to 0.001 Ω. To simulate module degradation,
Rsh is reduced or
Rs is increased.
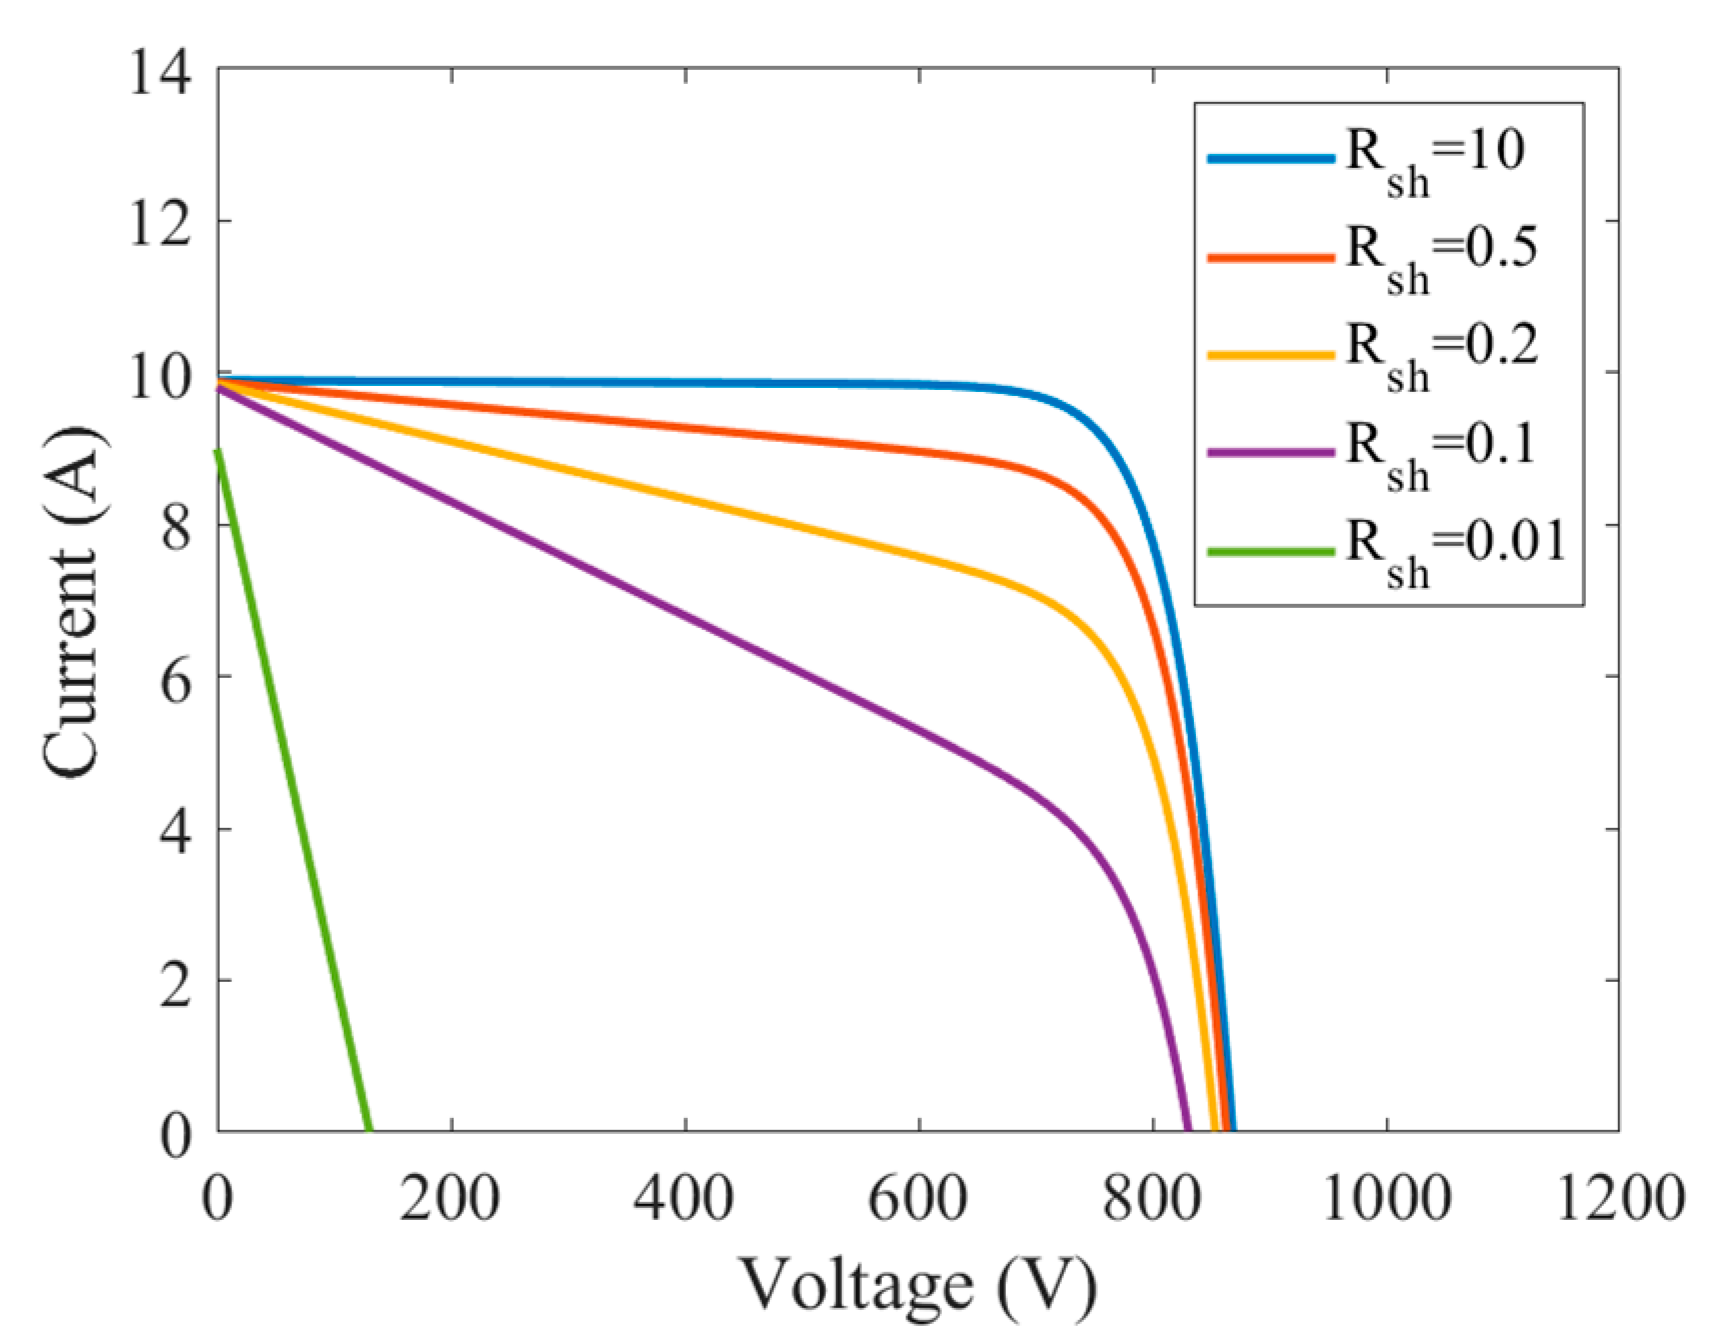
Figure 2 illustrates the effect of changes in
Rsh on the I-V characteristics. The figure shows that as
Rsh decreases, the current at the maximum power point significantly drops. The slope of the I-V curve gradually decreases as
Rsh is reduced from 10 to 0.01 Ω.
Figure 3 depicts the effect of changes in
Rs on the I-V characteristics, demonstrating that an increase in
Rs results in a substantial reduction in the voltage at the maximum power point. The maximum power point decreases as
Rs increases.
3.2. Open-Circuit Fault (OCF)
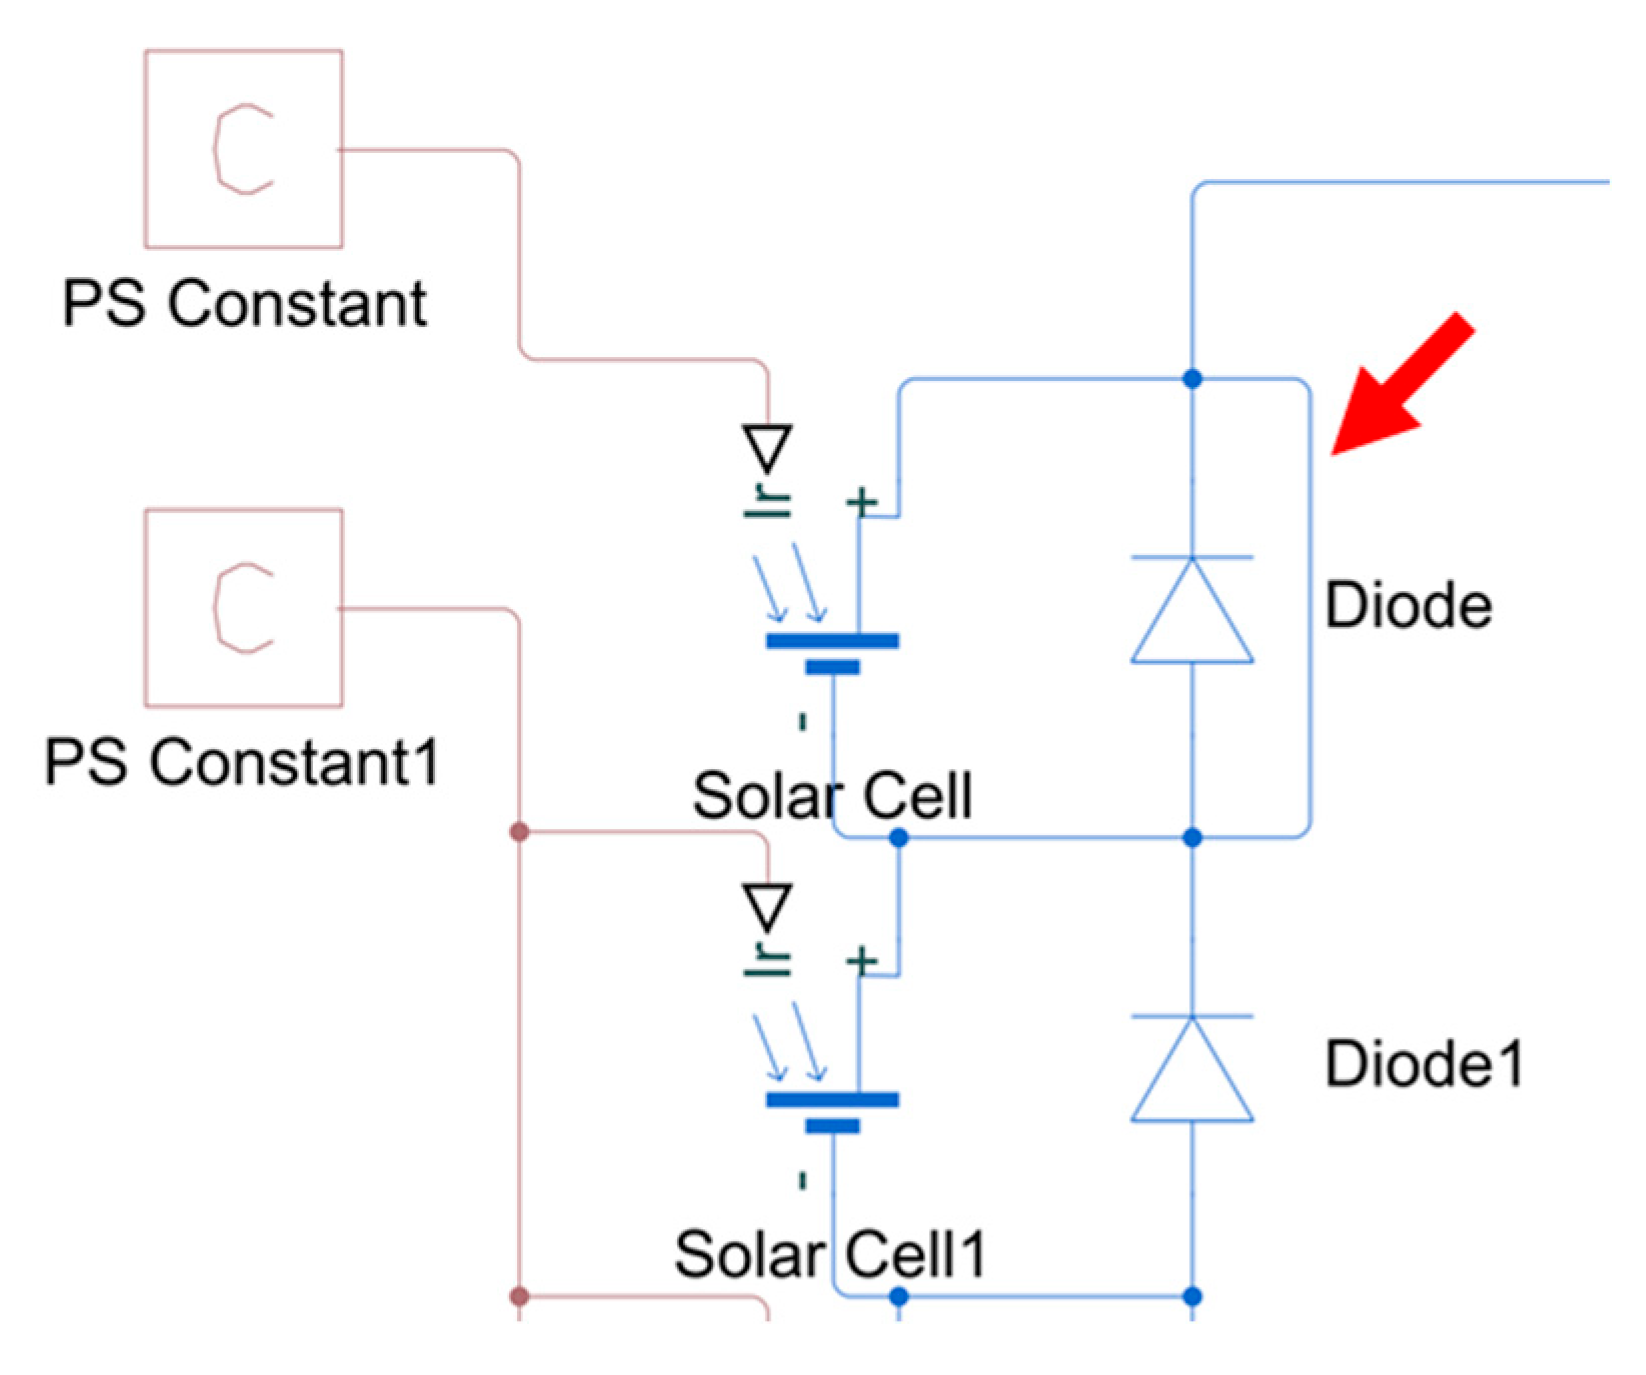
An OCF occurs when one or more strings are disconnected from the PV array, typically due to broken cells or improper connections between components. When a PV string is disconnected, no current flows, resulting in zero power output. Consequently, with an open-circuit fault, both the short-circuit current and maximum power decrease as the number of disconnected strings increases, while the open-circuit voltage remains almost unaffected [
14,
22]. To simulate an open-circuit fault, a module is disconnected from a string, as shown by the red arrow in
Figure 4. When multiple strings in the PV array experience an open-circuit fault, the short-circuit current decreases, but the open-circuit voltage remains nearly constant.
3.3. Short-Circuit Fault (SCF)
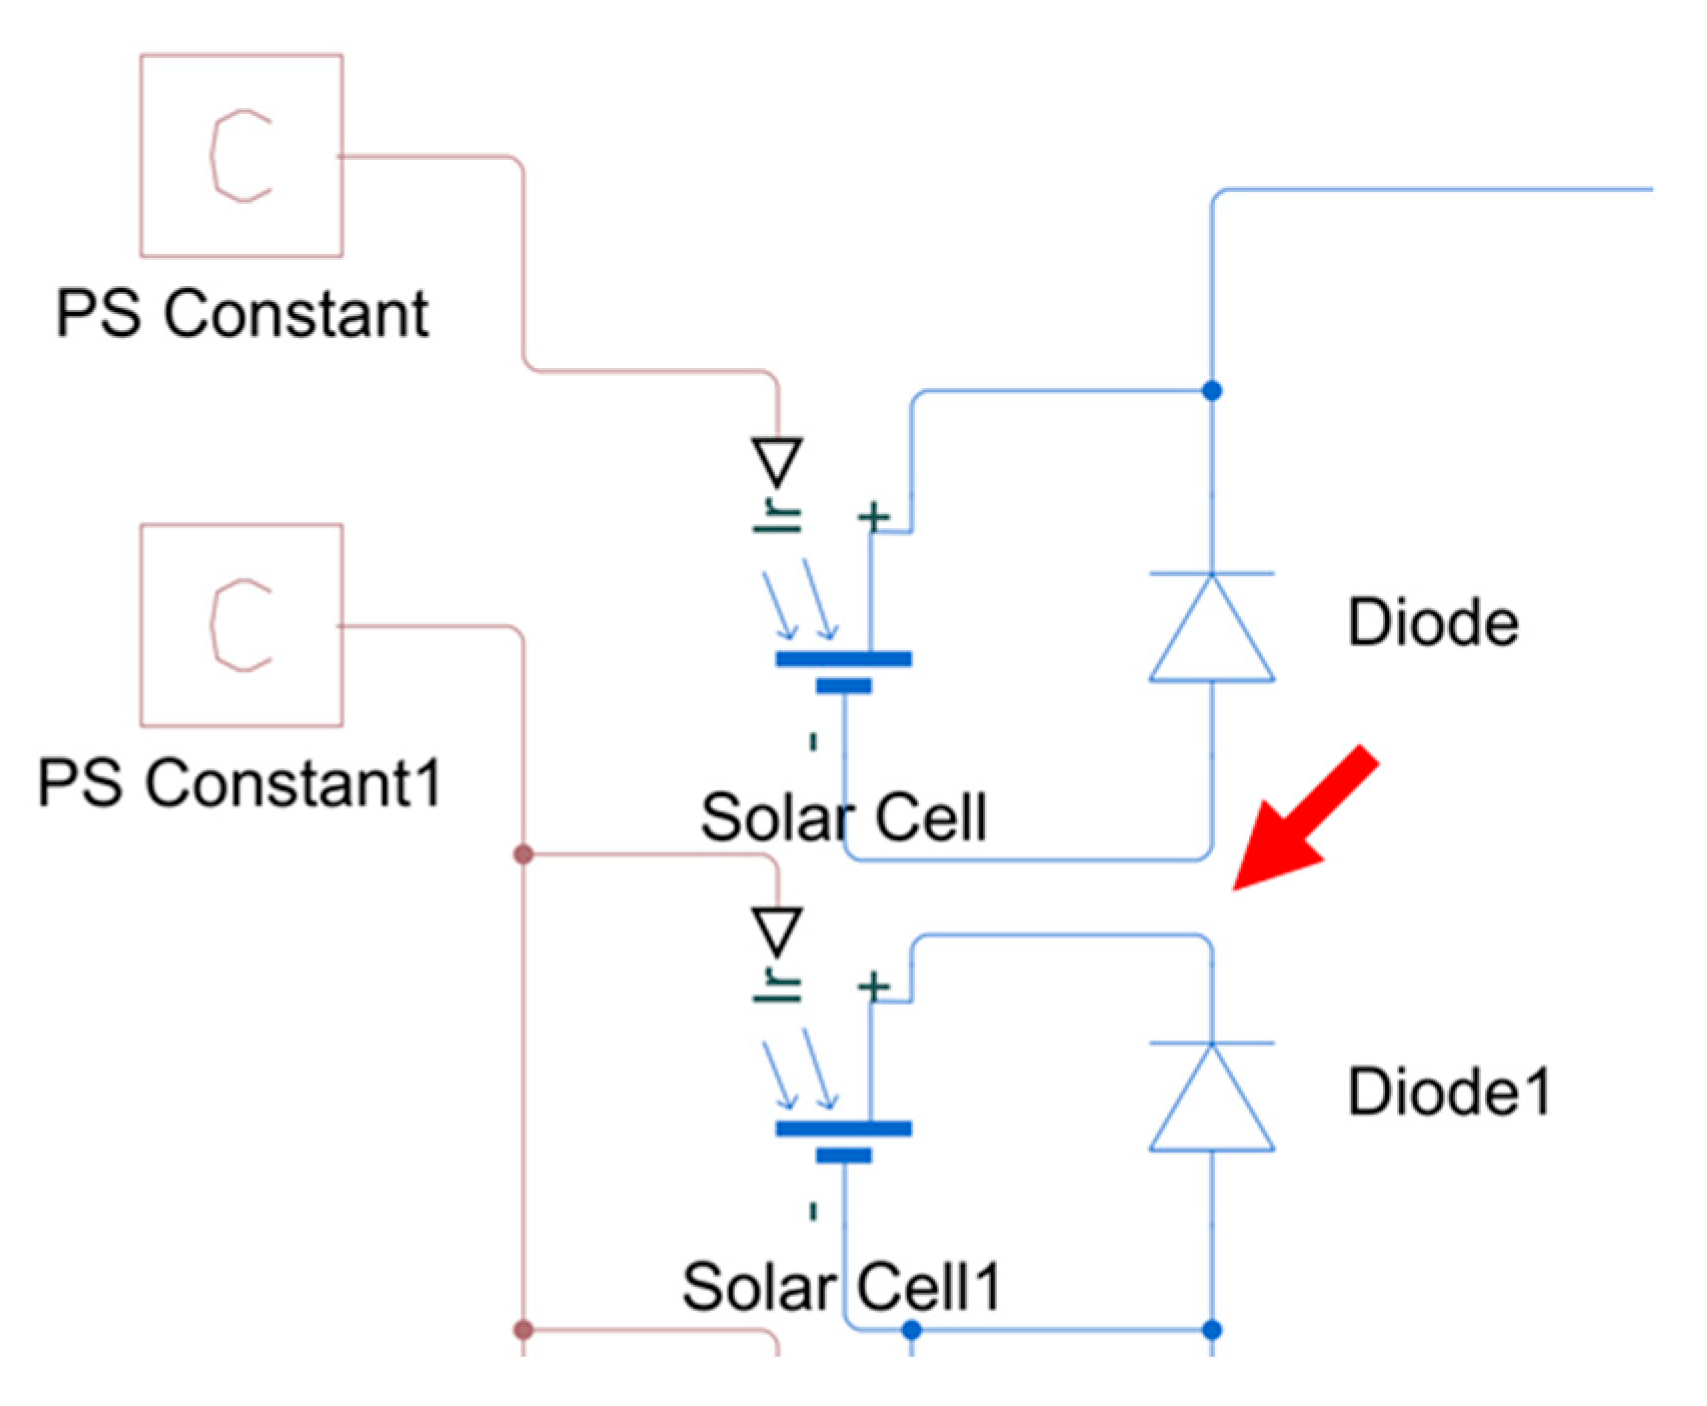
An SCF occurs when points with different potentials in the PV array are unintentionally connected, typically due to manufacturing defects or improper connections between components [
13]. Since mismatched currents flow through the affected modules, SCFs are extremely dangerous if not detected promptly. When modules in a PV string are short-circuited, only a minimal current flows through the module according to Ohm’s law, causing a reduction in the open-circuit voltage of the PV string. In modeling, short-circuit faults are simulated by connecting both terminals of a module with a wire, as shown by the red arrow in
Figure 5.
Figure 6 illustrates the I-V characteristics under a short-circuit fault. As the number of short-circuited modules increases, the open-circuit voltage of the PV array decreases, while the short-circuit current remains nearly constant. Therefore, as the open-circuit voltage decreases considerably, short-circuit faults occur in the PV module.
3.4. Shading Fault (SF)
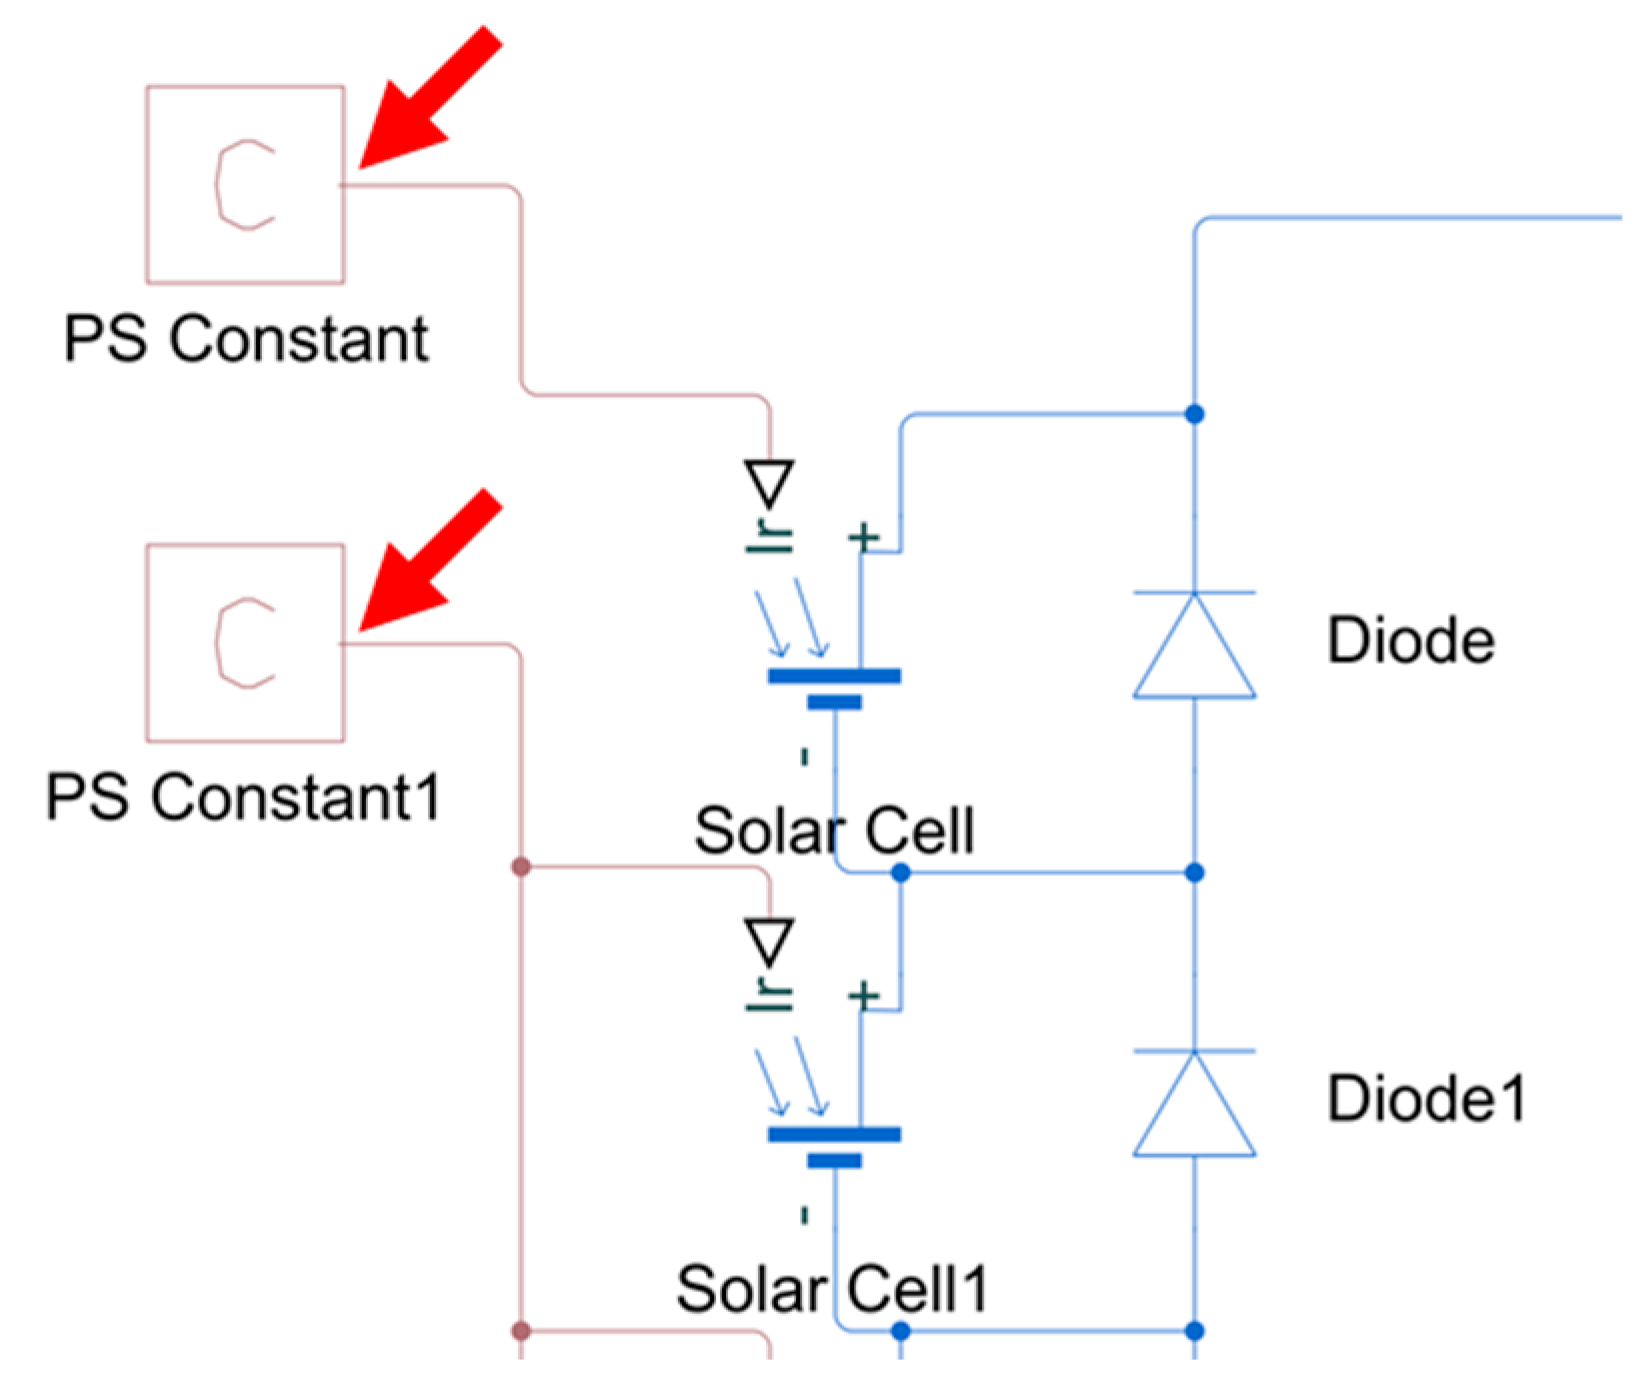
An SF occurs when a part or all of a PV array is shaded, resulting in a reduction in output power. Common causes of shading faults include cloud cover, snow accumulation, and dust pollution, with such faults typically being temporary phenomena [
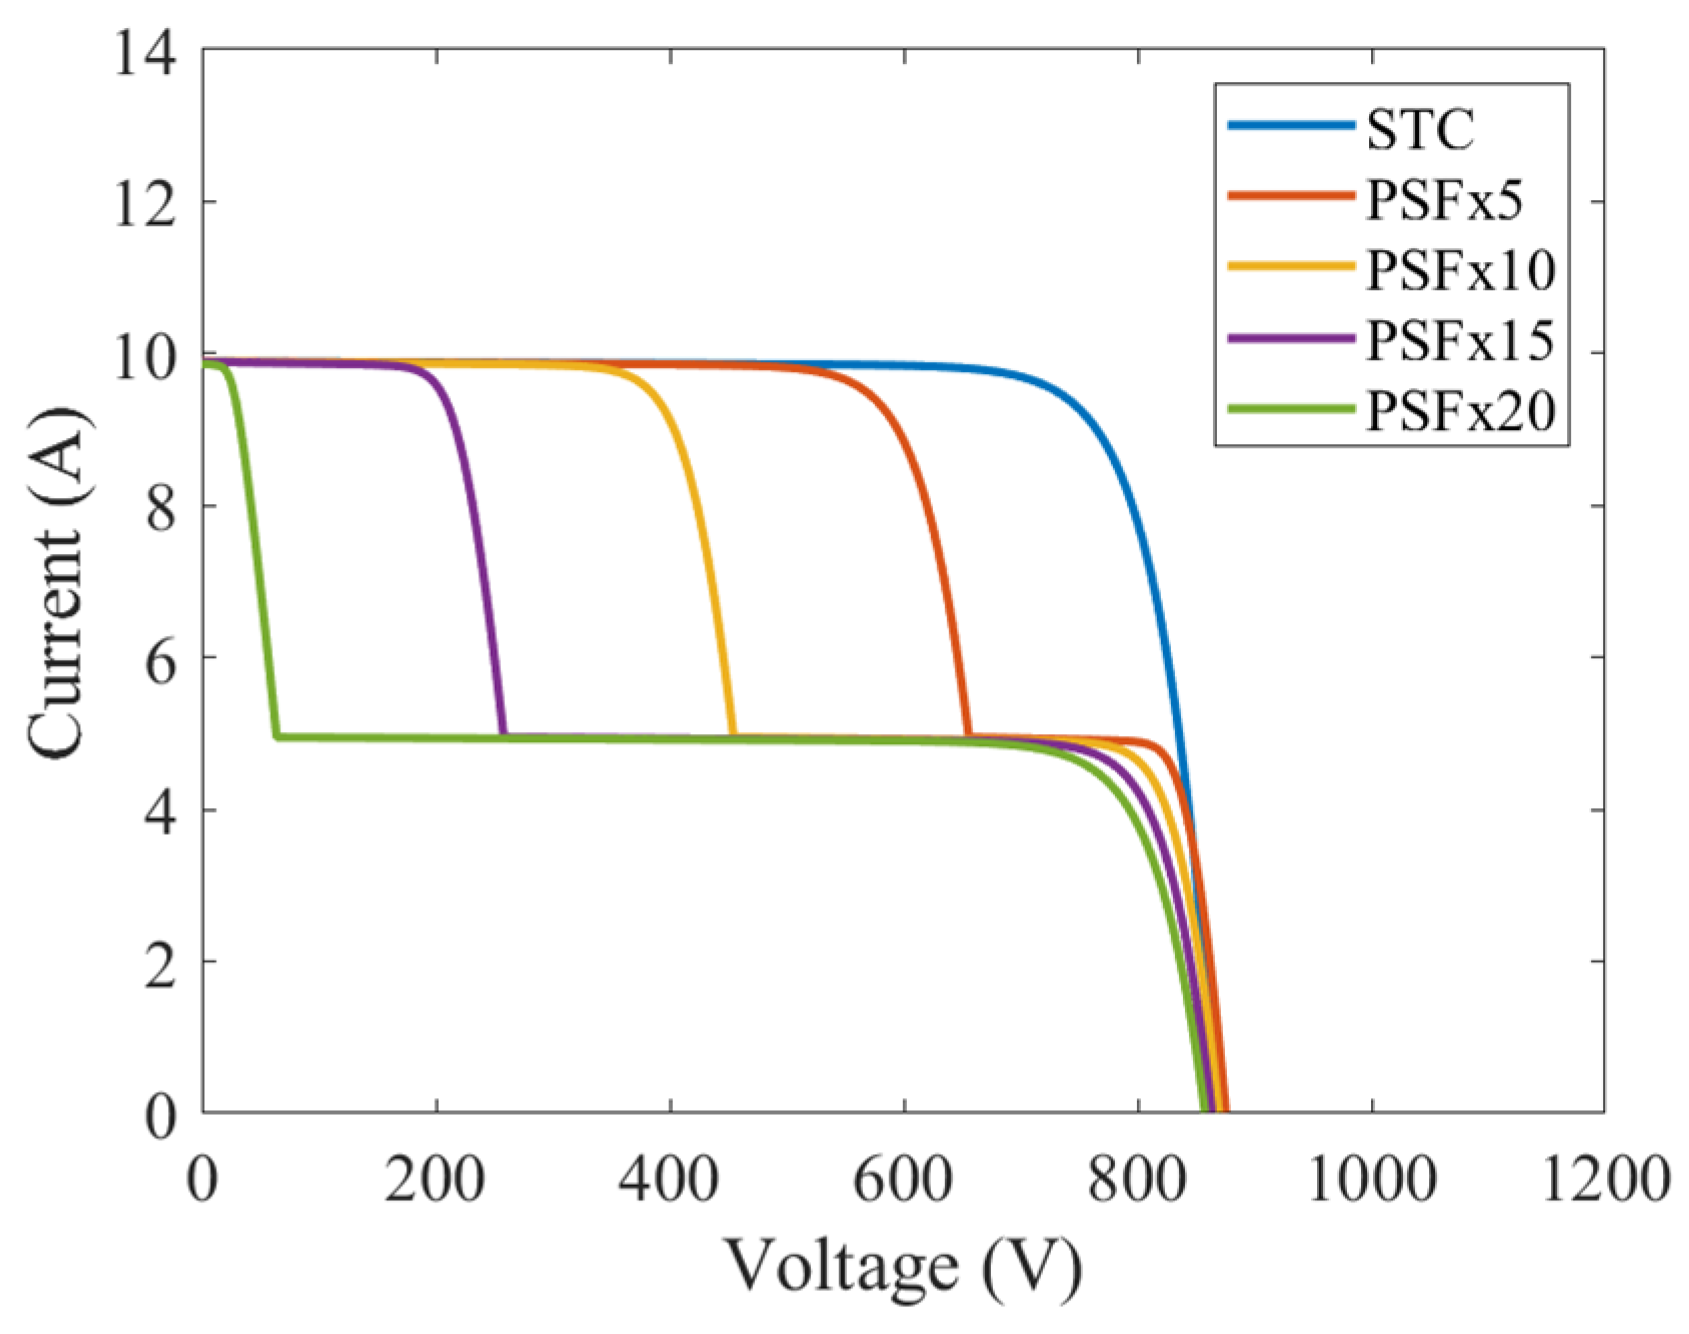
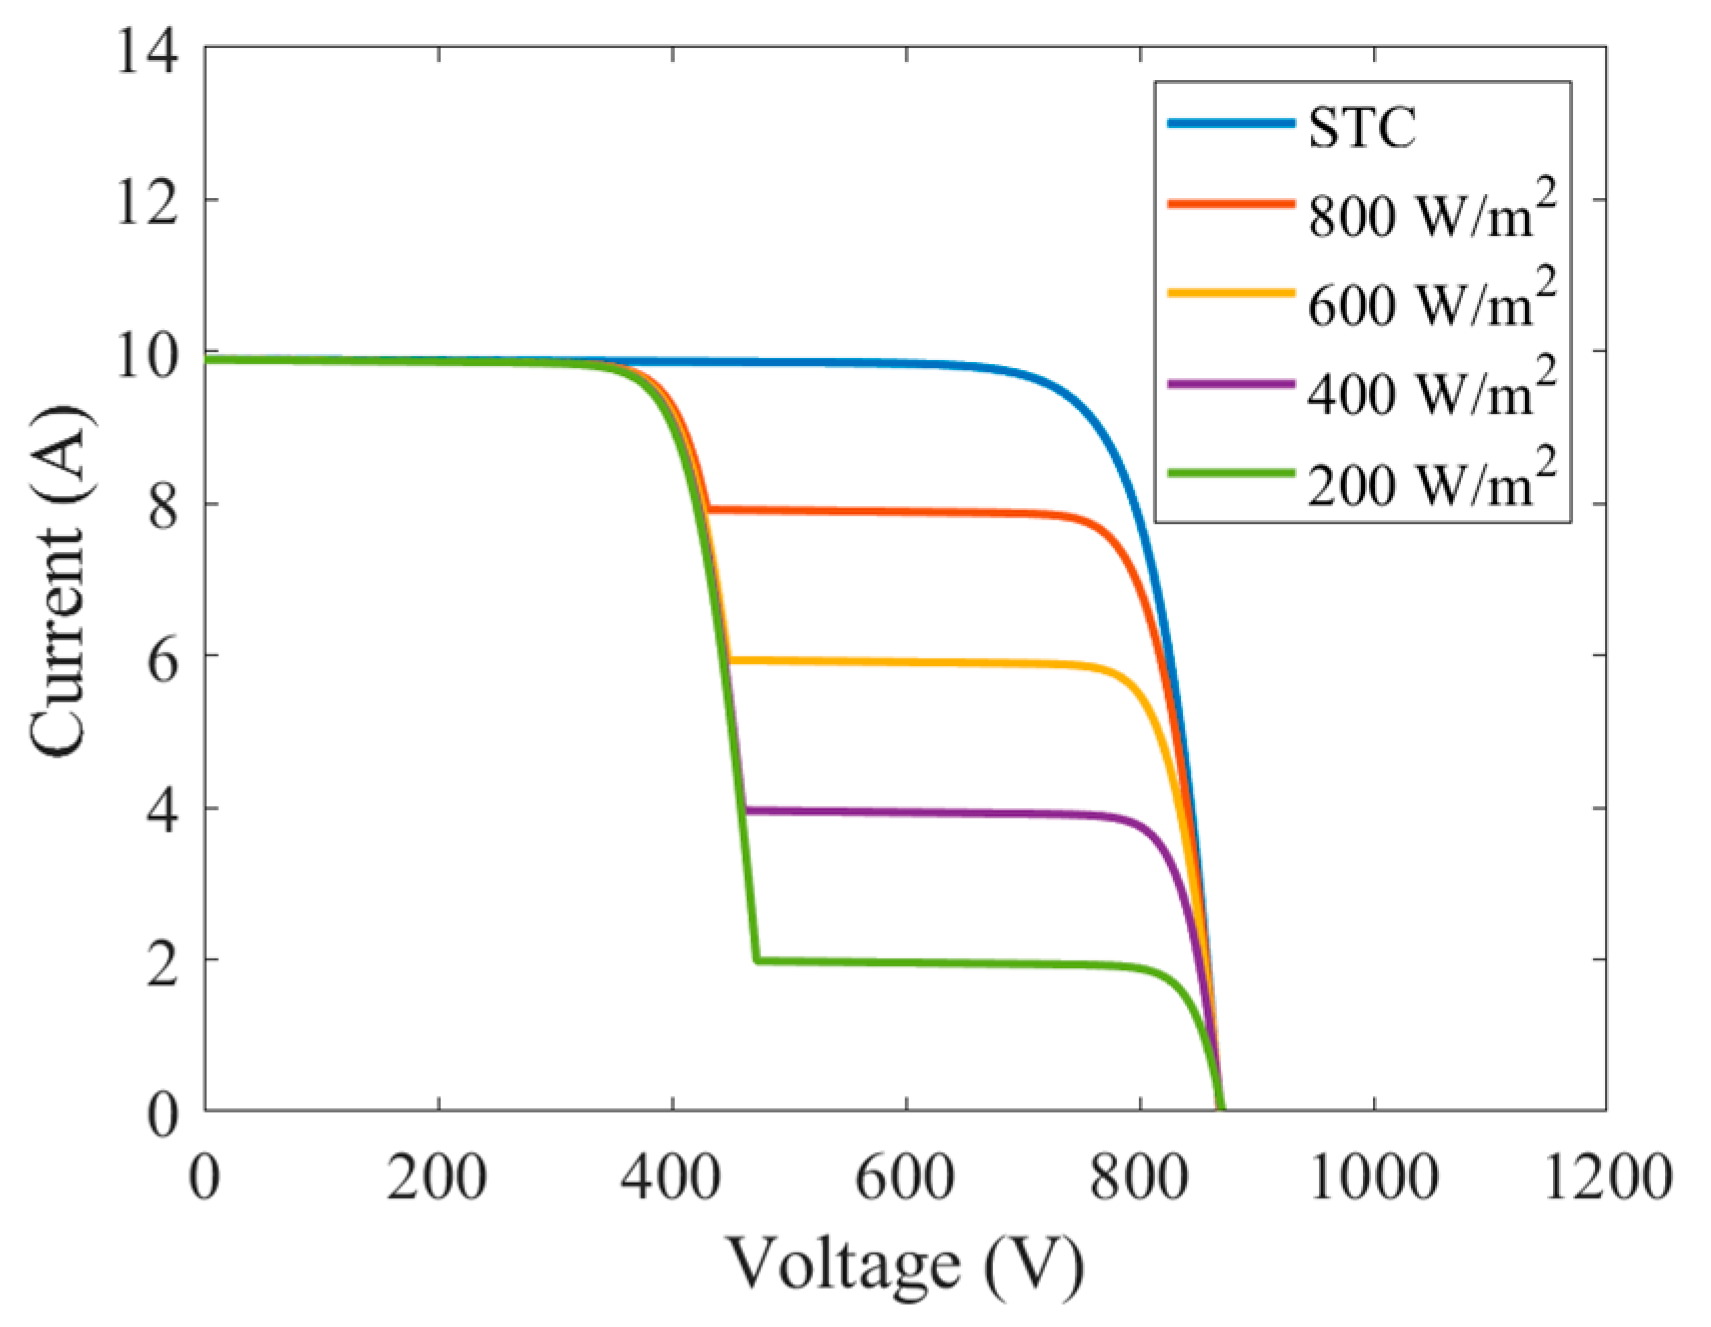
12]. When partial shading faults (PSFs) occur in a PV array, the forward voltage of the bypass diode presents multiple peaks in the I-V curve, indicating a reduction in the maximum power. If the shading persists for an extended period, components operating at high temperatures develop hotspots [
21]. In modeling, shading faults can be simulated by reducing the irradiance of certain modules, as shown by the red arrow in
Figure 7.
Figure 8 illustrates the relationship between the number of shaded modules and I-V characteristics, while
Figure 9 explains the relationship between shading irradiance and I-V characteristics.
As the number of shaded modules increases, the voltage at the knee point decreases, while the short-circuit current of the PV array remains nearly constant. Furthermore, as the irradiance of the shaded modules decreases, the current at the knee point also decreases, but the open-circuit voltage of the PV array remains nearly unchanged.
3.5. Hotspot Fault (HSF)
An HSF occurs when a shaded or defective cell becomes a load due to reverse bias voltage, thereby consuming power generated by other cells and causing a local temperature increase [
23]. The causes of HSFs include panel aging, snow accumulation, dust pollution, manufacturing defects, and cell cracks. The severity of such faults depends on the degree and duration of the mismatch between current and voltage within the PV module [
14]. When part of a PV array experiences HSFs, the irradiance reduces and the temperature increases. In a model, HSFs are simulated by adjusting the irradiance and temperature of specific modules.
Figure 10 illustrates the I-V characteristics of an HSF. The HFS changes the slope of the I-V curve and decreases the open-circuit voltage of the PV array, while the short-circuit current remains nearly unchanged.
4. Example of Fault Diagnosis in a PV System
The I-V curve provides critical parameter information on the operational status of a PV array. A fault in a PV system changes the I-V curve with the type and severity of the fault and significantly influences the extent of these alterations. By comparing the I-V characteristics of a PV array under fault conditions and under normal conditions, potential faults are identified. The I-V curves of a PV system are simulated under various fault conditions using different models. Alternatively, after measuring the I-V curve with faults, curve fitting techniques are used to explore the I-V characteristics. These curves are compared with the I-V characteristics under normal conditions to diagnose the type and severity of the fault.
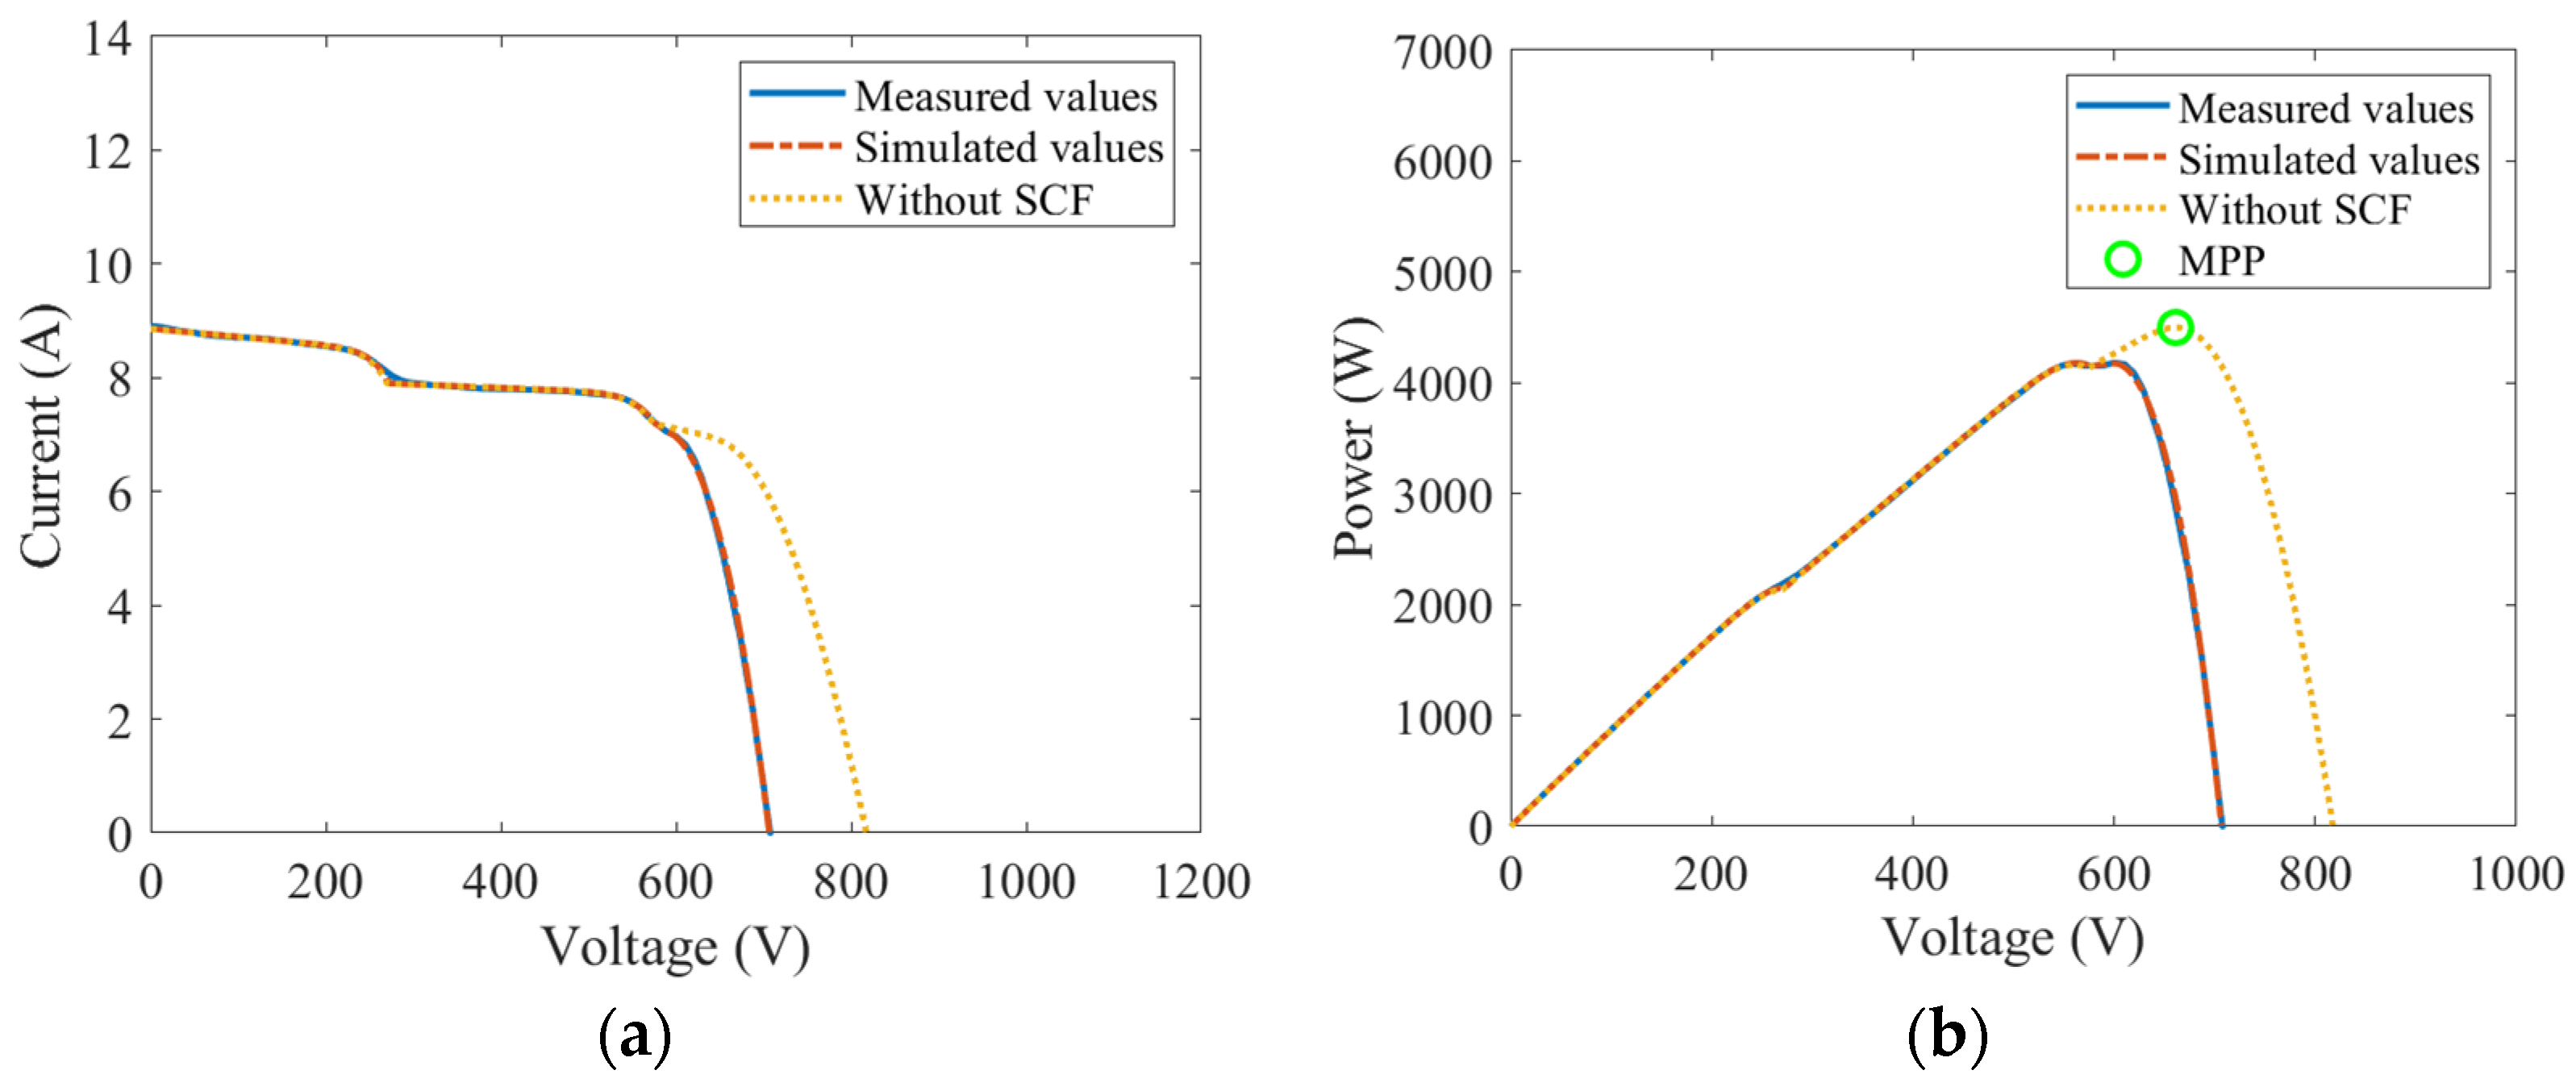
Figure 11 presents a diagnostic example based on I-V characteristics. After measuring the actual I-V curve at a PV site in this study, a curve was fitted. By comparing the model parameters and I-V characteristics of the curve under normal conditions, we diagnosed the fault type of the PV system. The array consisted of one string with 22 modules, with 3 sets of modules experiencing short-circuit faults and 19 sets showing degradation faults without open-circuit faults. Among the degraded modules, 10 sets displayed shading faults, with 9 sets experiencing a shading level of 11.1% and 1 set a level of 16.9%. The fault condition was diagnosed by curve fitting based on the I-V characteristics of the faults. SCFs were simulated to reduce the open-circuit voltage; module degradation was simulated by decreasing the shunt resistance (
Rsh) or increasing the series resistance (
Rs); and shading faults were simulated by reducing the irradiance of certain modules to increase the peak output. Then, the shading level was assessed based on the extent of the irradiance reduction.
Assuming that the three modules with short-circuit faults represented the worst conditions among the degraded modules, the results were simulated after repairing the short-circuit faults. The maximum output power of the PV array increased by approximately 7.7%.
5. Conclusions
The global installed PV capacity surpassed 1 TW in 2022, with this year earning the title “the year of terawatt solar”. With the rapid growth of the photovoltaic industry, fault detection and diagnosis techniques for various PV systems have been researched and developed. In particular, simple, low-cost, and effective detection methods based on I-V characteristic analysis have been used to assess the performance of PV systems. In this study, a practical fault diagnosis method was developed. Firstly, methods for detecting common faults in PV systems were reviewed using MATLAB/Simulink software. Module degradation, OCFs, SCFs, SFs, and HSFs were diagnosed, and the I-V characteristics of each fault were analyzed. Through curve fitting of the I-V characteristics of the faults, the fault diagnosis method was validated in terms of its effectiveness for identifying potential faults and assessing their severity.
Author Contributions
Conceptualization, Y.-K.W.; methodology, Y.-K.W.; software, J.-H.L.; validation, J.-H.L. and Y.-K.W.; formal analysis, Y.-K.W.; investigation, J.-H.L.; resources, J.-H.L.; data curation, J.-H.L.; writing—original draft preparation, J.-H.L.; writing—review and editing, Y.-K.W.; visualization, J.-H.L.; supervision, Y.-K.W. All authors have read and agreed to the published version of the manuscript.
Institutional Review Board Statement
Not applicable.
Informed Consent Statement
Not applicable.
Data Availability Statement
Data are available in this manuscript.
Conflicts of Interest
The authors declare no conflict of interest.
References
- Jaiswal, K.K.; Chowdhury, C.R.; Yadav, D.; Verma, R.; Dutta, S.; Jaiswal, K.S.; Karuppasamy, K.S.K. Renewable and sustainable clean energy development and impact on social, economic, and environmental health. Energy Nexus 2022, 7, 100118. [Google Scholar] [CrossRef]
- Yang, D.; Wang, W.; Gueymard, C.A.; Hong, T.; Kleissl, J.; Huang, J.; Perez, M.J.; Perez, R.; Bright, J.M.; Xia, X.; et al. A review of solar forecasting, its dependence on atmospheric sciences and implications for grid integration: Towards carbon neutrality. Renew. Sustain. Energy Rev. 2022, 161, 112348. [Google Scholar] [CrossRef]
- Zare, A.; Simab, M.; Nafar, M. Fault diagnosis in photovoltaic modules using a sraightforward voltage-current characteristics evaluation. Renew. Energy Res. Appl. 2023, 4, 269–279. [Google Scholar]
- Parsa, H.R.; Sarvi, M. Online fault diagnosis, classification, and localization in photovoltaic systems. IEEE Trans. Instrum. Meas. 2024, 73, 1–8. [Google Scholar] [CrossRef]
- Tabatabaei, S.A.; Formolo, D.; Treur, J. Analysis of performance degradation of domestic monocrystalline photovoltaic systems for a real-world case. Energy Procedia 2017, 128, 121–129. [Google Scholar] [CrossRef]
- Kalay, M.Ş.; Kılıç, B.; Sağlam, Ş. Systematic review of the data acquisition and monitoring systems of photovoltaic panels and arrays. Sol. Energy 2022, 244, 47–64. [Google Scholar] [CrossRef]
- Chen, X.; Jiang, M.; Ding, K.; Yang, Z.; Zhang, J.; Cui, L.; Hasanien, H.M. Fault prediagnosis, type identification and degree diagnosis method of the photovoltaic array based on the current-voltage conversion. IEEE Trans. Power Electron. 2024, 39, 16708–16719. [Google Scholar] [CrossRef]
- Sarikh, S.; Raoufi, M.; Bennouna, A.; Ikken, B. Characteristic curve diagnosis based on fuzzy classification for a reliable photovoltaic fault monitoring. Sustain. Energy Technol. Assess. 2021, 43, 100958. [Google Scholar] [CrossRef]
- Ma, M.; Zhang, Z.; Yun, P.; Xie, Z.; Wang, H.; Ma, W. Photovoltaic module current mismatch fault diagnosis based on I-V data. IEEE J. Photovolt. 2021, 11, 779–788. [Google Scholar] [CrossRef]
- Perny, M.; Saly, V.; Packa, J.; Klucha, R. Testing, analysis and diagnostics of chosen faults of photovoltaic systems. In Proceedings of the 24th International Scientific Conference on Electric Power Engineering (EPE), Kouty nad Desnou, Czech Republic, 15–17 May 2024. [Google Scholar]
- Aghaei, M.; Kolahi, M.; Nedaei, A.; Sridharan, N.V.; Eskandari, A.; De Oliveira, A.K.V.; Sugumaran, V.; Ruther, R.; Parvin, P.; Esmailifar, S.M. A holistic study on failures and diagnosis techniques in photovoltaic modules, components and systems. In Proceedings of the International Conference on Future Energy Solutions (FES), Vaasa, Finland, 12–14 June 2023. [Google Scholar]
- Muhammad, N.; Ridzuan, N.M. A review of fault detection and diagnosis approaches for photovoltaic systems using voltage and current analysis. In Proceedings of the IEEE 4th International Conference in Power Engineering Applications (ICPEA), Pulau Pinang, Malaysia, 4–5 March 2024. [Google Scholar]
- Osmani, K.; Haddad, A.; Lemenand, T.; Castanier, B.; Alkhedher, M.; Ramadan, M. A critical review of PV systems’ faults with the relevant detection methods. Energy Nexus 2023, 12, 100257. [Google Scholar] [CrossRef]
- Venkatakrishnan, G.R.; Rengaraj, R.; Tamilselvi, S.; Harshini, J.; Sahoo, A.; Saleel, C.A.; Abbas, M.; Cuce, E.; Jazlyn, C.; Shaik, S.; et al. Detection, location, and diagnosis of different faults in large solar PV system—A review. Int. J. Low-Carbon Technol. 2023, 18, 659–674. [Google Scholar] [CrossRef]
- Ba, L.D.; Wu, Y.K.; Pham, M.H. Fault identification and diagnosis methods for photovoltaic system: A review. In Proceedings of the 7th International Conference on Applied System Innovation (ICASI), Chiayi, Taiwan, 24–25 September 2021. [Google Scholar]
- Hong, Y.Y.; Pula, R.A. Methods of photovoltaic fault detection and classification: A review. Energy Rep. 2022, 8, 5898–5929. [Google Scholar] [CrossRef]
- Yang, B.; Zheng, R.; Han, Y.; Huang, J.; Li, M.; Shu, H.; Su, S.; Guo, Z. Recent advances in fault diagnosis techniques for photovoltaic systems: A critical review. Prot. Control. Mod. Power Syst. 2024, 9, 36–59. [Google Scholar] [CrossRef]
- Sarikh, S.; Raoufi, M.; Bennouna, A.; Benlarabi, A.; Ikken, B. Fault diagnosis in a photovoltaic system through I-V characteristics analysis. In Proceedings of the 9th International Renewable Energy Congress (IREC), Hammamet, Tunisia, 20–22 March 2018. [Google Scholar]
- Zbib, B.; Sheikh, H.A. Fault detection and diagnosis of photovoltaic systems through I-V curve analysis. In Proceedings of the International Conference on Electrical, Communication, and Computer Engineering (ICECCE), Istanbul, Turkey, 12–13 June 2020. [Google Scholar]
- The, C.J.Q.; Drieberg, M.; Soeung, S.; Ahmad, R. Simple PV modeling under variable operating conditions. IEEE Access 2021, 9, 96546–96558. [Google Scholar]
- Xu, Q.; Li, X.; Feng, C.; Wang, R. Review on fault characterization and diagnosis technique in photovoltaic systems. In Proceedings of the IEEE Transportation Electrification Conference and Expo, Asia-Pacific (ITEC Asia-Pacific), Haining, China, 28–31 October 2022. [Google Scholar]
- Abhijith; Bindu, S. Fault detection classification and identification in PV array. In Proceedings of the International Conference on Control, Communication and Computing (ICCC), Thiruvananthapuram, India, 19–21 May 2023. [Google Scholar]
- Espinosa, A.R.; Bressan, M.; Giraldo, L.F. Failure signature classification in solar photovoltaic plants using RGB images and convolutional neural networks. Renew. Energy 2020, 162, 249–256. [Google Scholar] [CrossRef]
| Disclaimer/Publisher’s Note: The statements, opinions and data contained in all publications are solely those of the individual author(s) and contributor(s) and not of MDPI and/or the editor(s). MDPI and/or the editor(s) disclaim responsibility for any injury to people or property resulting from any ideas, methods, instructions or products referred to in the content. |
© 2025 by the authors. Licensee MDPI, Basel, Switzerland. This article is an open access article distributed under the terms and conditions of the Creative Commons Attribution (CC BY) license (https://creativecommons.org/licenses/by/4.0/).

