Proceeding Paper

Application of a Convolutional Neural Network in a Terrain-Based Tire Pressure Management System †

by
Carl Luis C. Ledesma
1,
Charlothe John I. Tablizo
1,
Emmanuel A. Salcedo
1,
Marites B. Tabanao
1,
Emmy Grace T. Requillo
1,* and
John Paul T. Cruz
2
1
College of Engineering and Architecture, Mapúa Malayan Colleges Mindanao, Davao City 8000, Philippines
2
School of Electrical, Electronics, and Computer Engineering, Mapúa University, Manila 1002, Philippines
*
Author to whom correspondence should be addressed.
Presented at the 2024 IEEE 6th Eurasia Conference on IoT, Communication and Engineering, Yunlin, Taiwan, 15–17 November 2024.
Eng. Proc. 2025, 92(1), 75; https://doi.org/10.3390/engproc2025092075
Published: 20 May 2025
(This article belongs to the Proceedings of 2024 IEEE 6th Eurasia Conference on IoT, Communication and Engineering)

Abstract

:
Improper car tire pressure affects dynamics, fuel economy, and driver safety. Current central tire inflation systems (CTISs) regulate tire pressure relative to its reference value. However, the current CTIS is limited in its automation, as the system requires the loading of present conditions and the manual input of terrain conditions. Therefore, the system lacks intelligent components which would increase its efficiency. Adding a terrain recognition feature to the current CTIS technology, the tire pressure management system (TPMS) described in this paper enhances the capability to adjust to the ideal tire pressure according to the terrain condition. In this study, we integrate a terrain recognition component which uses a convolutional neural network (CNN), specifically, ResNet-18, into the TPMS to classify and detect terrain conditions and apply the correct pressure level. A one-tire terrain-based TPMS model was developed through system integration. The system was tested under flat, uneven, and soft terrain conditions. The CNN model demonstrated 95% accuracy in classifying the chosen terrains, with demonstrated adaptability to nighttime environments. Inflation and deflation tests were conducted at varying speeds and terrains, and the results showed longer inflation times at higher pressure ranges, while deflation times remained consistent regardless of pressure range. A negligible impact on inflation and deflation speed was observed at speeds below 15 km/h. Instantaneous response time between the microcontrollers increases efficiency in the overall CTIS process.

1. Introduction

The existing central tire inflation system (CTIS) requires the manual input of terrain conditions in order to adjust the tire pressure accordingly. The CTIS is dependent on terrain conditions, and the input requires drivers to manually select and identify the terrain type in a control unit, while depending on the drivers for input control. The absence of an intelligent component capable of accurately and promptly classifying the type of terrain potentially hinders the CTIS from achieving efficiency.
Tire pressure influences the driving of vehicles, making it an essential parameter in driving [1]. All car tires have recommended nominal tire pressures provided by the manufacturer, in order to ensure the best performance under normal conditions. Under-inflation or over-inflation of tires negatively impacts their performance. Under-inflation and over-inflation also cause road accidents due to blowouts, vulnerability to punctures, and poor mobility [2]. Moreover, under-inflated tires require more fuel than inflated tires [3]. They increase fuel consumption and negatively impact the vehicle’s fuel economy. Under-inflation of about 25% increases rolling by 10%, which increases fuel consumption by 1.4% [4].
The recommended tire pressure is limited to only normal load and road conditions. However, in off-road conditions, different terrains require different tire pressures to ensure the best performance, minimum tire wear, and prevention of slippage. Also, tire deformation affects tire performance, as the tire shape conforms to the terrain, which allows maximum surface contact, causing better traction and less slippage. Three relevant factors affecting tire pressure are vertical wheel load, tire pressure, and terrain [5]. Thus, variances in the terrain require changes in tire pressure to attain the optimum tire deformation.
The current CTIS can only adjust the tire pressure by using buttons and is not automated with respect to maintaining the tire pressure. The current CTIS does not consider the current temperature of the tire, the vehicle’s loading condition, or the vehicle’s speed when adjusting the tire pressure [2]. No studies regarding the integration of external factors such as terrain conditions with the automation of CTIS have been undertaken. Therefore, we integrated field terrain recognition into the design of CTIS to benefit manufacturers and drivers.

2. Objectives

We utilized a convolutional neural network (CNN), ResNet-18, to detect terrain features and classify them accurately (with an accuracy of higher than 90%). We employed transfer learning to train a pre-existing model on a gathered dataset to enhance the model’s ability. Signals sent to an electromechanical inflation instrument are used to correct the tire pressure in various terrain conditions. Between its mechanical and electronic components, the system has adequate communication interfaces, especially between the control units and the sensors. The gathered data are used to develop a design proposal for terrain-recognizing CTIS.

3. Methods

3.1. Terrain-Recognizing Component

We utilized the ResNet-18 architecture for terrain recognition and tire pressure adjustment. ResNet-18 demonstrated strong performance in image classification for detecting and classifying terrain types. A total of 3900 images were collected across three terrain categories, with a ratio of 7:2:1, for training, validation, and testing datasets. The output layer had three neurons, classifying flat, uneven, and soft terrains (Figure 1).
For the terrain recognition, three terrain datasets from Davao City were obtained to emulate a vehicle “dashcam” perspective. These datasets were used to train the model through transfer learning, with additional augmented images obtained via random resizing, flipping, and rotation. The images were adjusted for brightness, contrast, and saturation. They were also augmented in terms of the dataset size to enhance the model’s generalizability in recognizing orientations and conditions. An algorithm was created, defining a region of interest (ROI) which was localized on road lanes 5–10 m ahead of the vehicle (Figure 2 and Figure 3).

3.2. Electromechanical Pneumatic and Drive Systems

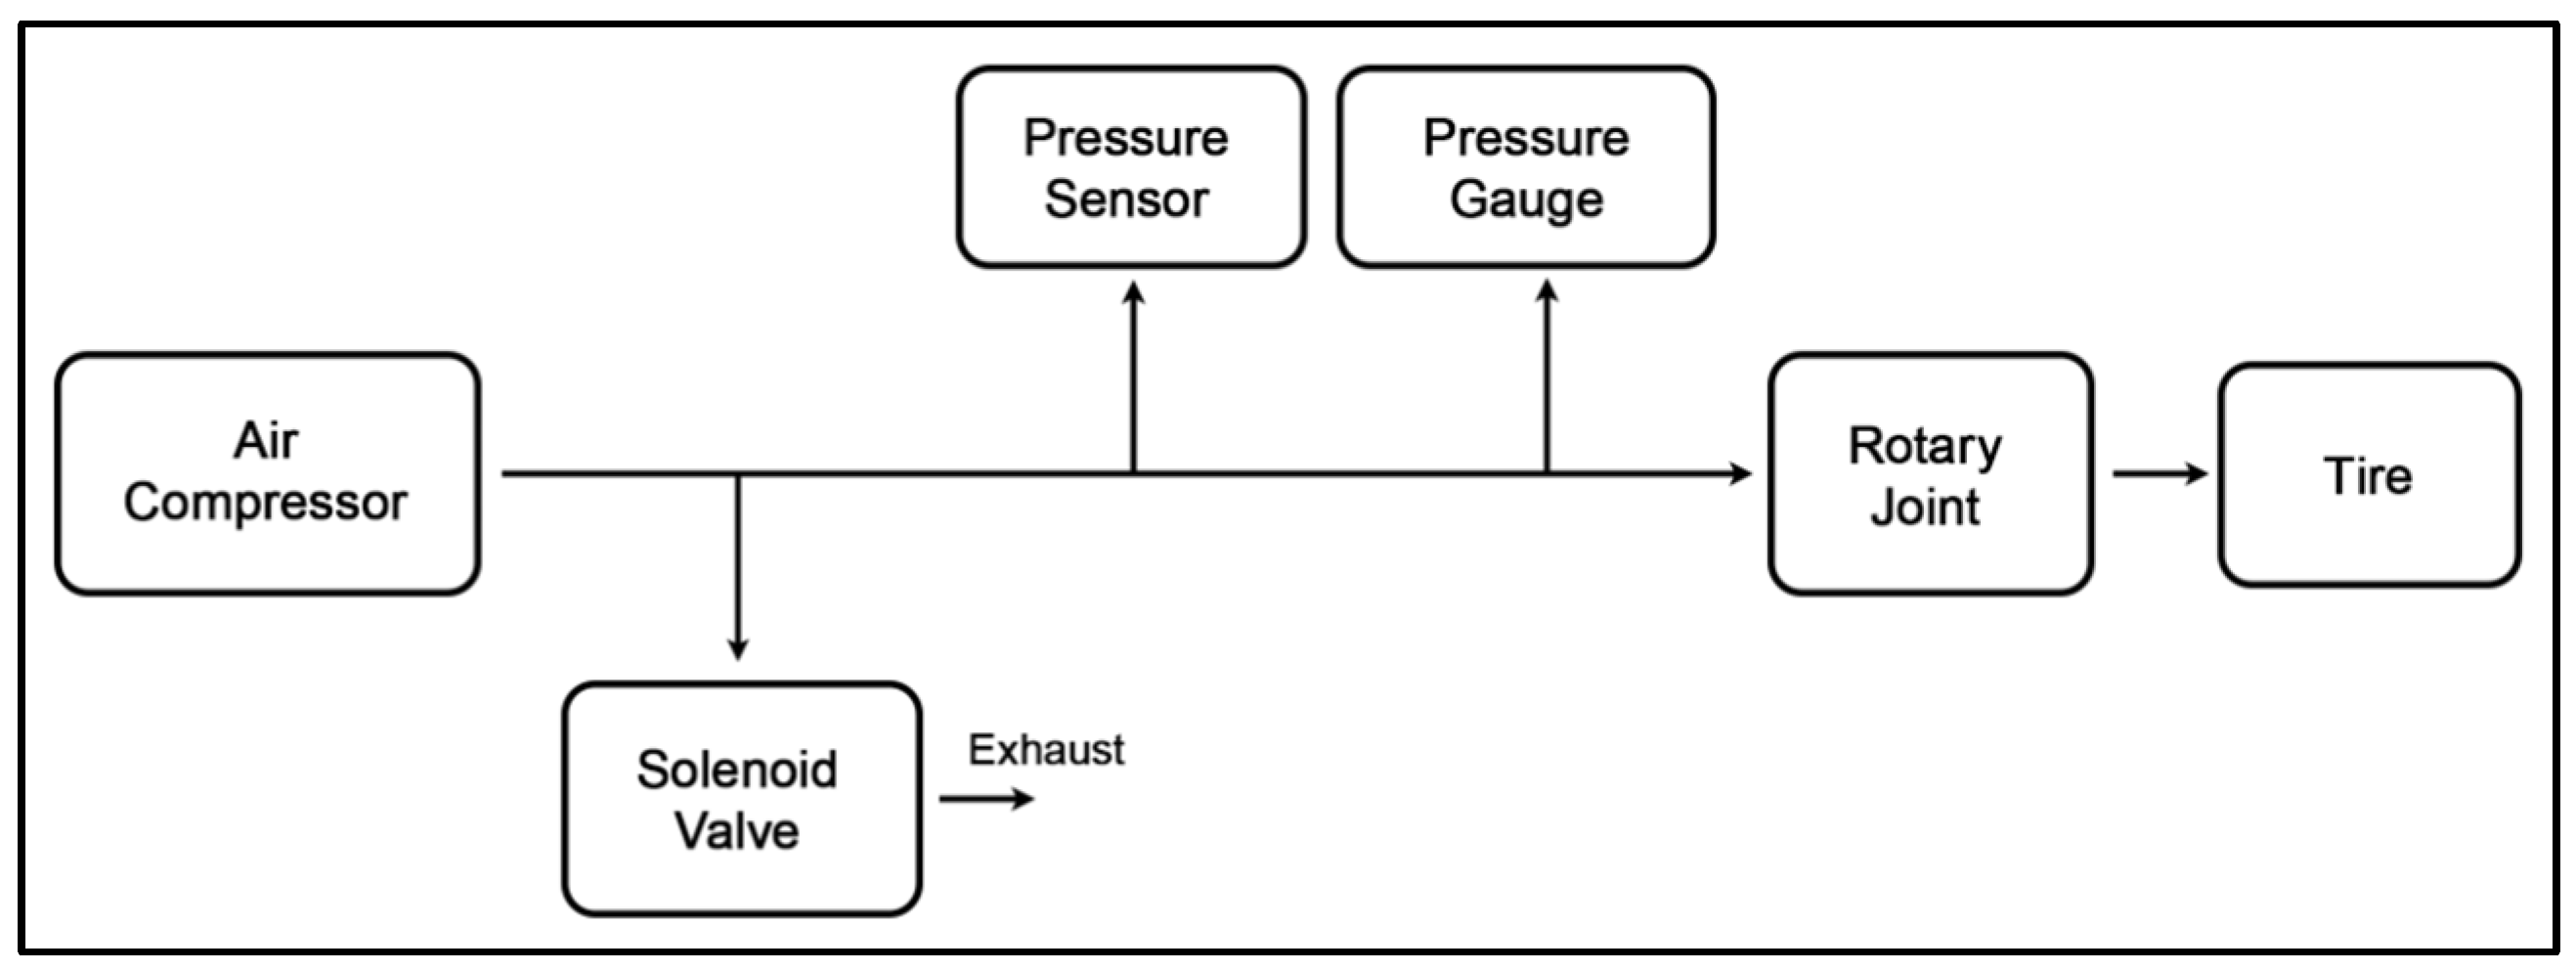
The design of the inflation system involves an air compressor. The air compressor (TOTAL Inc., Davao City, Philippines) used in the study is powered at 12 V by a DC battery (Motolite, Davao City, Philippines) or a power supply unit (PSU) (Golden Bull, Davao City, Philippines). Another major component is the solenoid valve (CreateLabz, Davao City, Philippines), which controls the discharge of air in the one tire model tested in this study. The system inflates the tire (Bridgestone, Davao City, Philippines) using the air compressor and deflates it by opening the solenoid valve. The design of the system and the connection of the components are presented in Figure 4 and Figure 5.
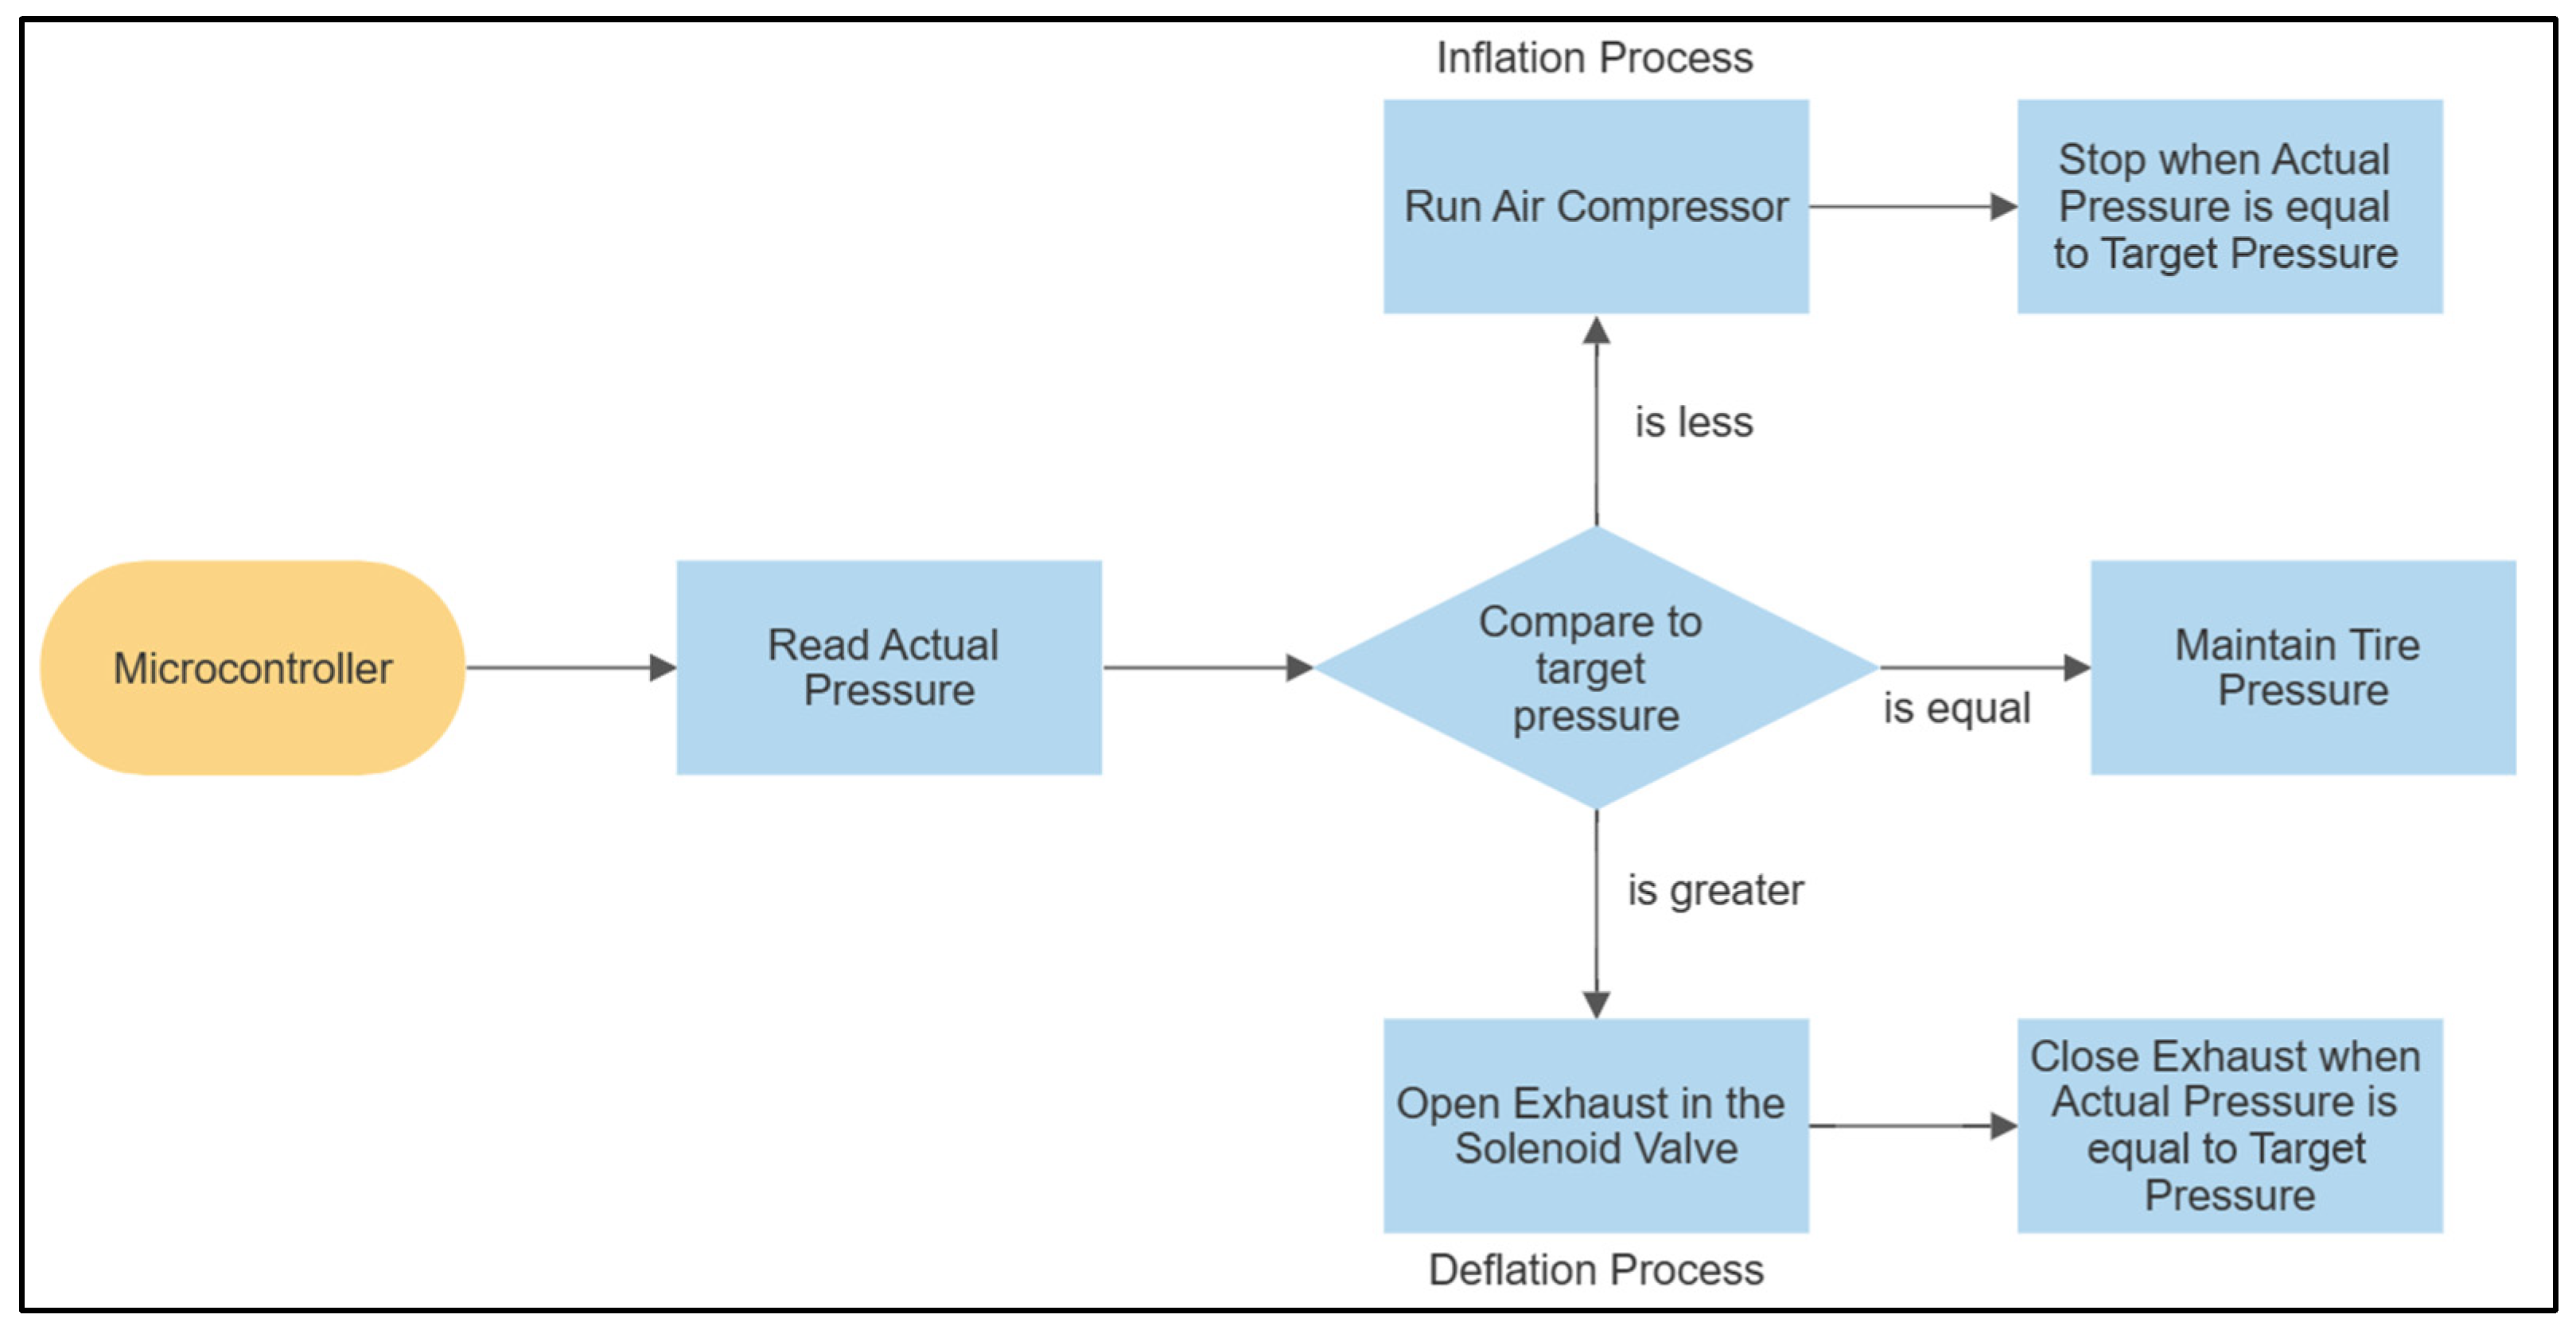
The flowchart in Figure 4 shows the inflation and deflation process. The main input is the actual tire pressure measurement. Then, it is compared to the target pressure, which is a preset pressure value relative to the current terrain. When the actual pressure is less than the target pressure, the air compressor is activated until the actual pressure is equal to the target pressure. When actual pressure is less than the target pressure, the solenoid valve is activated periodically to release air until the actual pressure is equal to the target pressure. When the actual and target pressures are equal, no mechanism is activated, thus, the pressure is maintained.
The pneumatic system in Figure 5 represents how the different pneumatic components are connected. The arrow lines represent the path of air between the components.
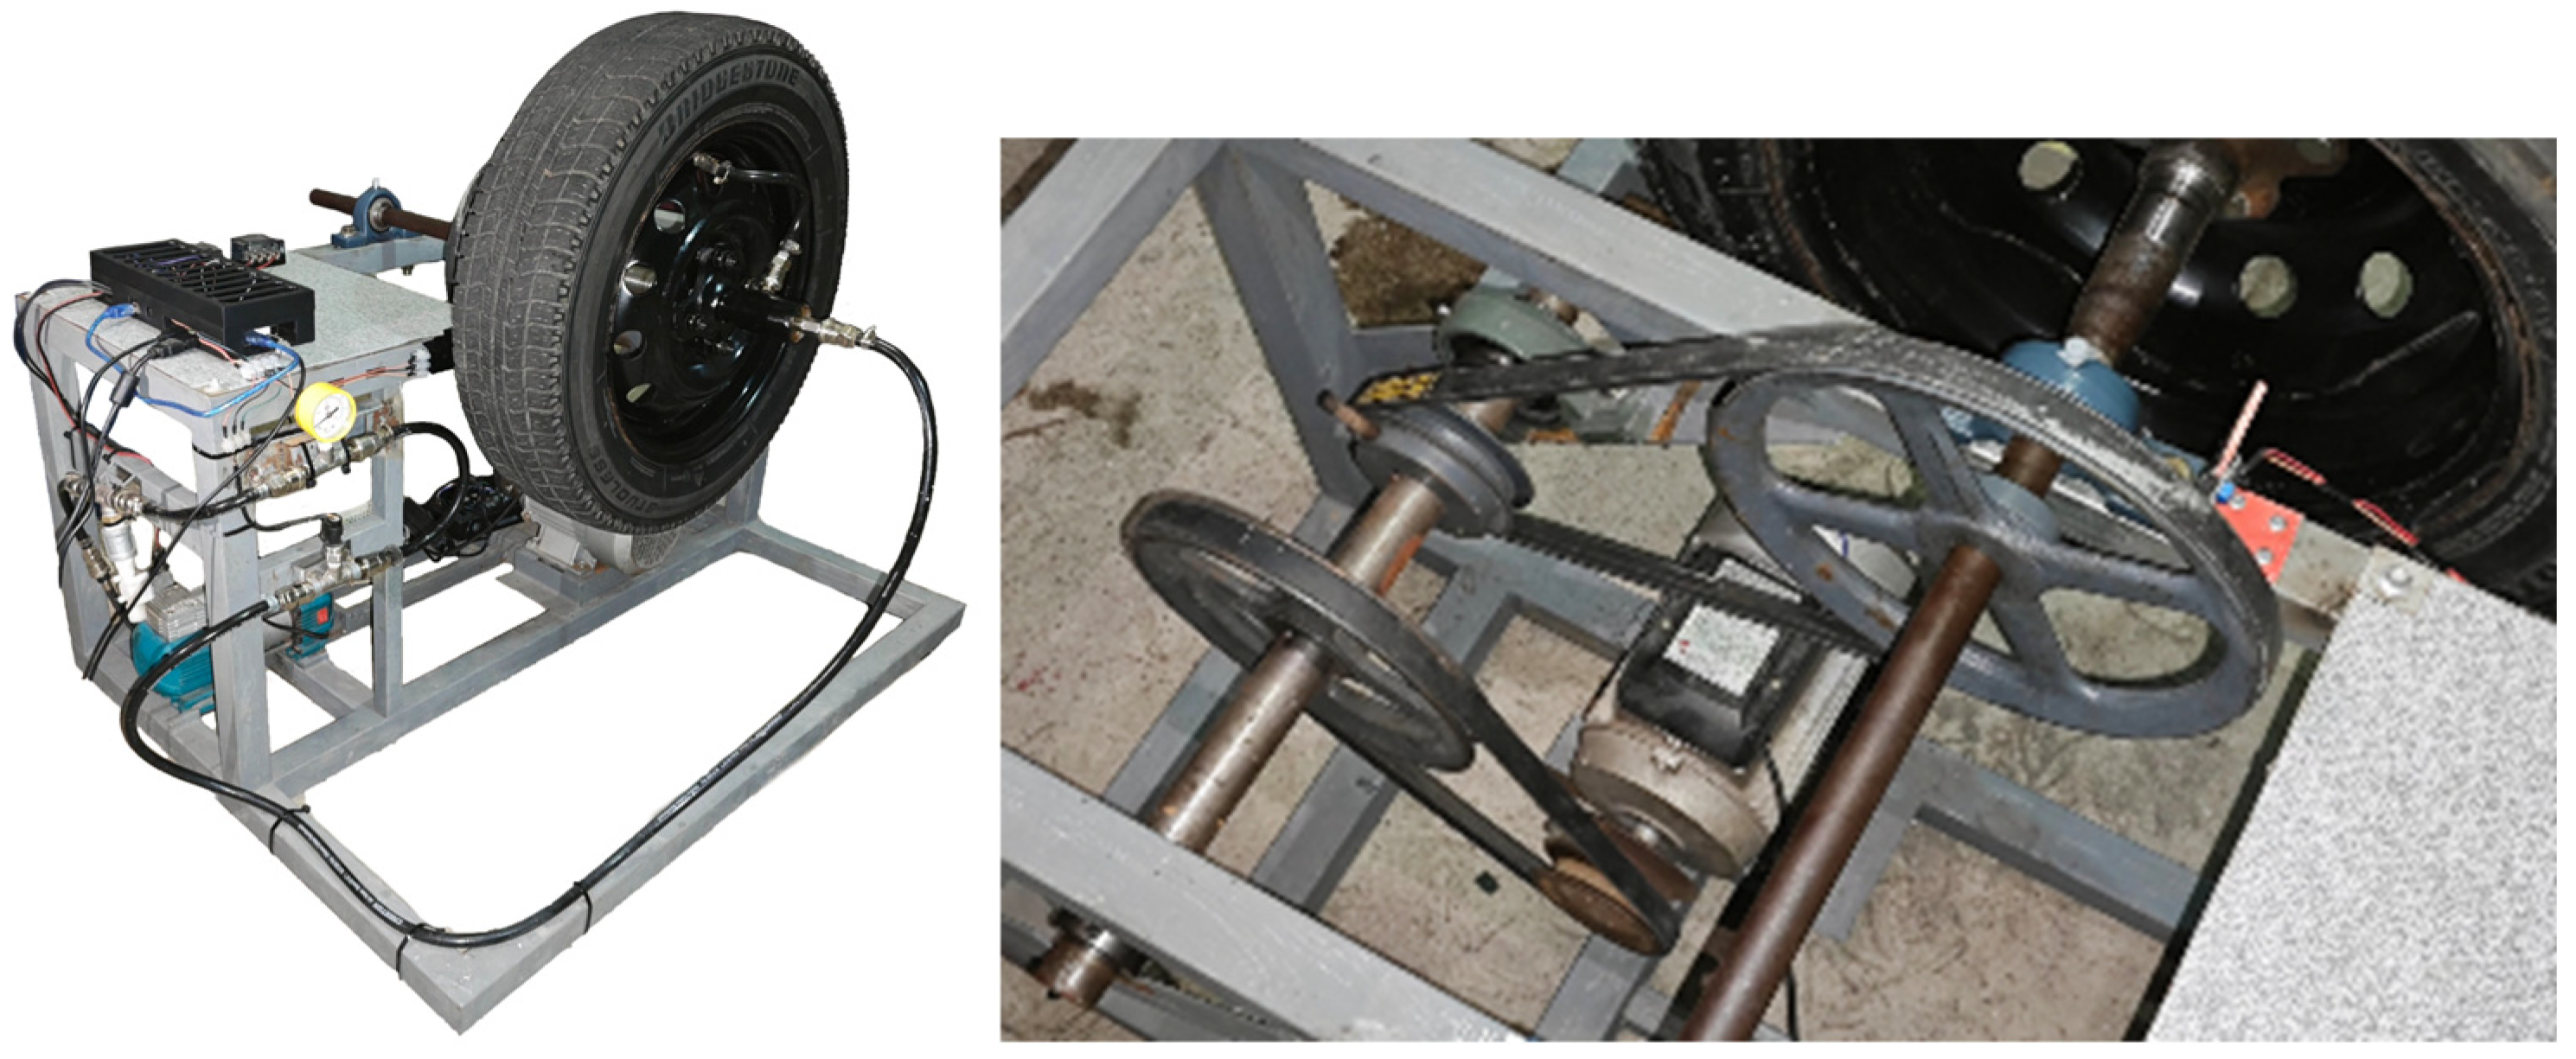
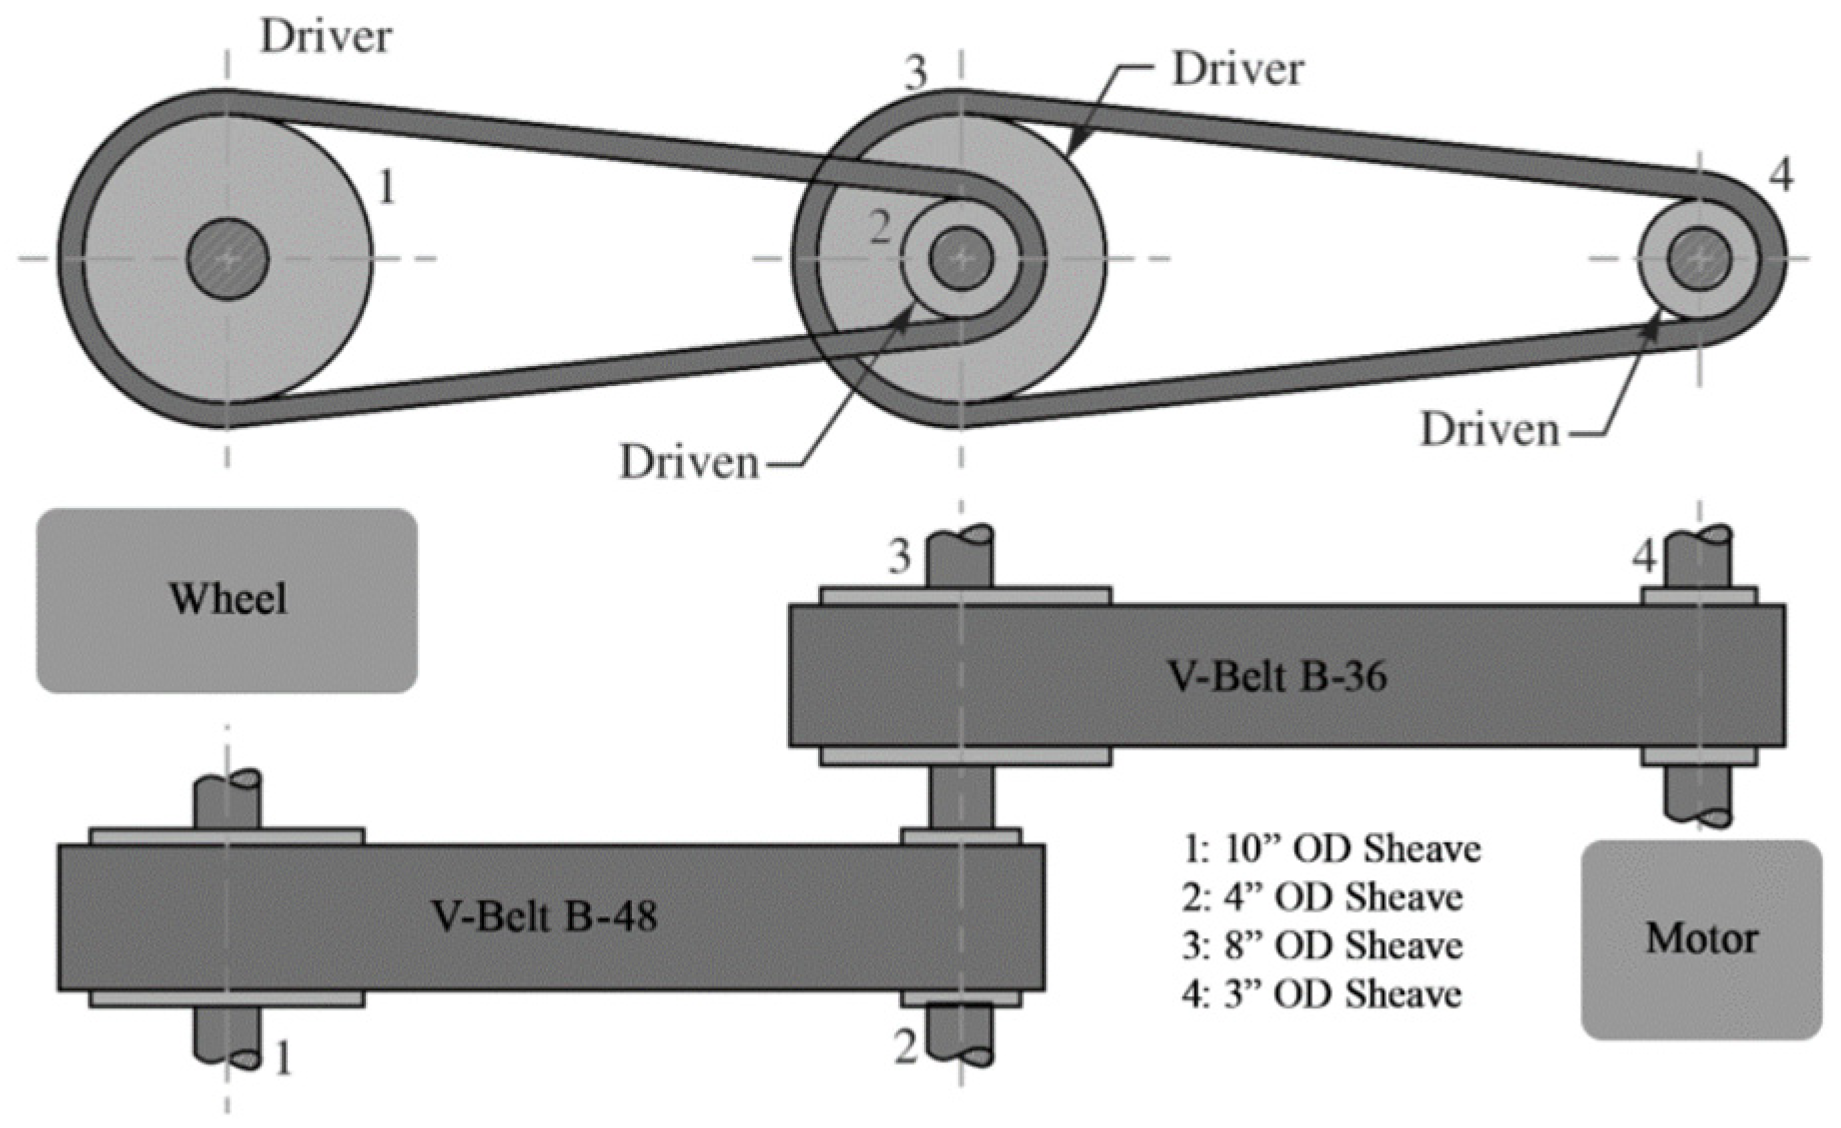
The 3D model of the single-wheel testbed is illustrated in Figure 6, which includes labels to the components. The actual fabricated model is shown in Figure 7, showing the whole assembly as well as the close-up view to the drive belt system. The drive belt system is utilized to simulate a rotating wheel during inflation and deflation. The wheel assembly was driven by a standard three-horsepower, single-phase motor through a 4-pulley belt drive system. Figure 8 shows the setup of the belt drive system that drives the wheel.
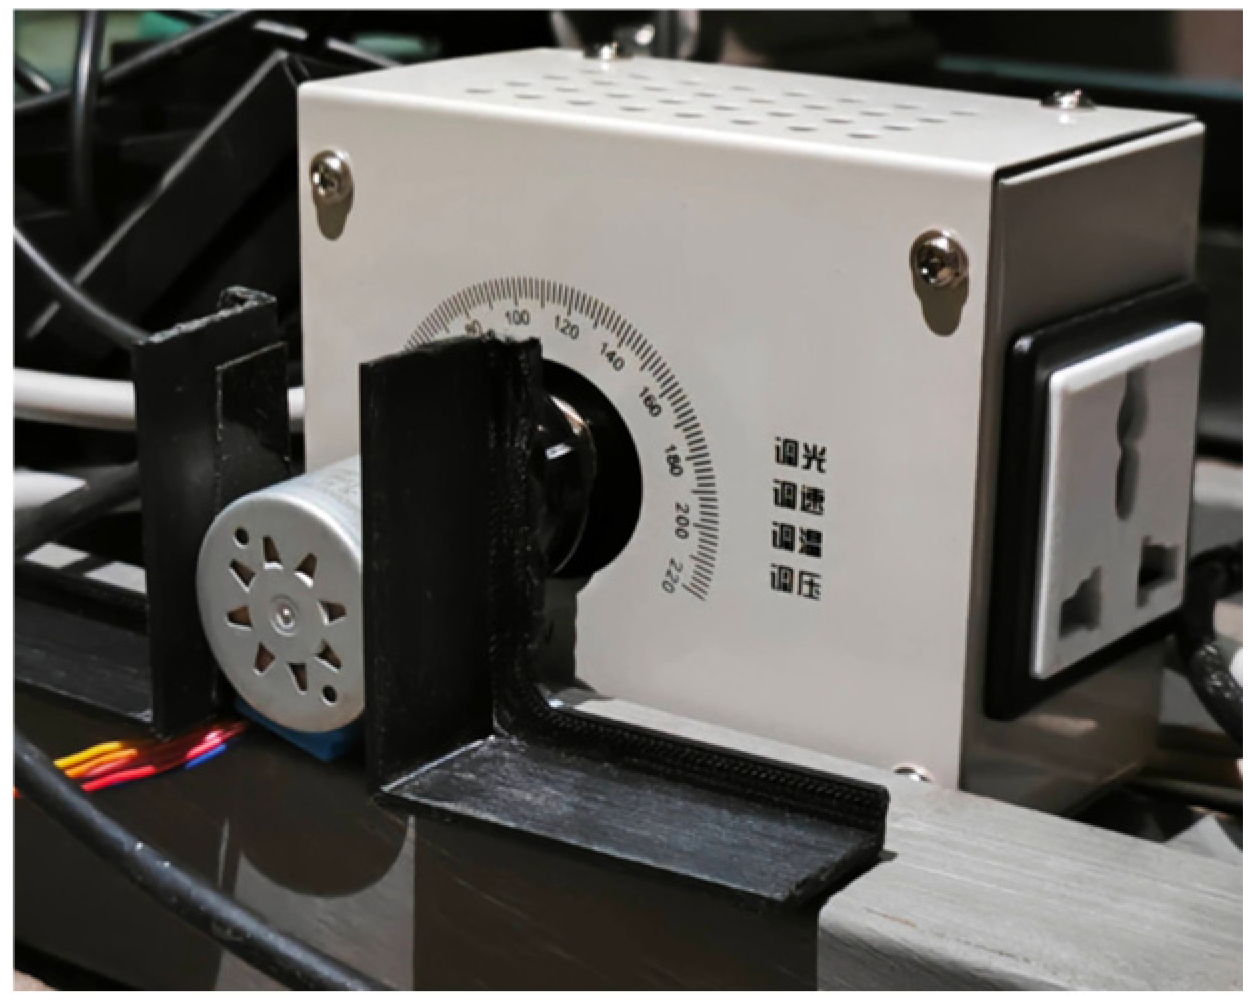
The speed of the motor was 2800 rpm, which was reduced to 400 rpm through the pulley train. To control the changes in the speed of the wheel, an AC dimmer switch was used along with a stepper motor; the mechanism was driven by a pedal switch. The pedal switch acts as a throttle, activating the stepper motor and turning the AC dimmer knob. Periodic activation of the pedal switch was necessary to avoid stalling and maintain a low speed (Figure 9).
The Chinese inscriptions in the image, from top to bottom, are translated as “Light Adjustment”, “Speed Adjustment”, “Temperature Adjustment”, and “Voltage Adjustment”. These labels indicate that the device, is capable of regulating various parameters depending on its application. It can be used to control lighting intensity, motor speed, heating levels, or voltage output. In this project, the AC dimmer is used specifically as a speed adjustment device, allowing precise control over the rotational speed of an electric motor.
To calculate the speed for the pitch line velocity, Equation (1) was used. The outer diameter of the tire, according to its specifications, was 0.547 m. The normal driving speed was 40 km/h, while the speed for inflation and deflation was 15 km/h. The corresponding speeds were calculated as 390 and 150 rpm.
N = V π D 1000   m 1   k m 1   h r 60   m i n s
where N : S p e e d   i n   r p m ;   V : P i t c h   l i n e   v e l o c i t y   i n   k p h ; and D : D i a m e t e r   o f   w h e e l   i n   m .
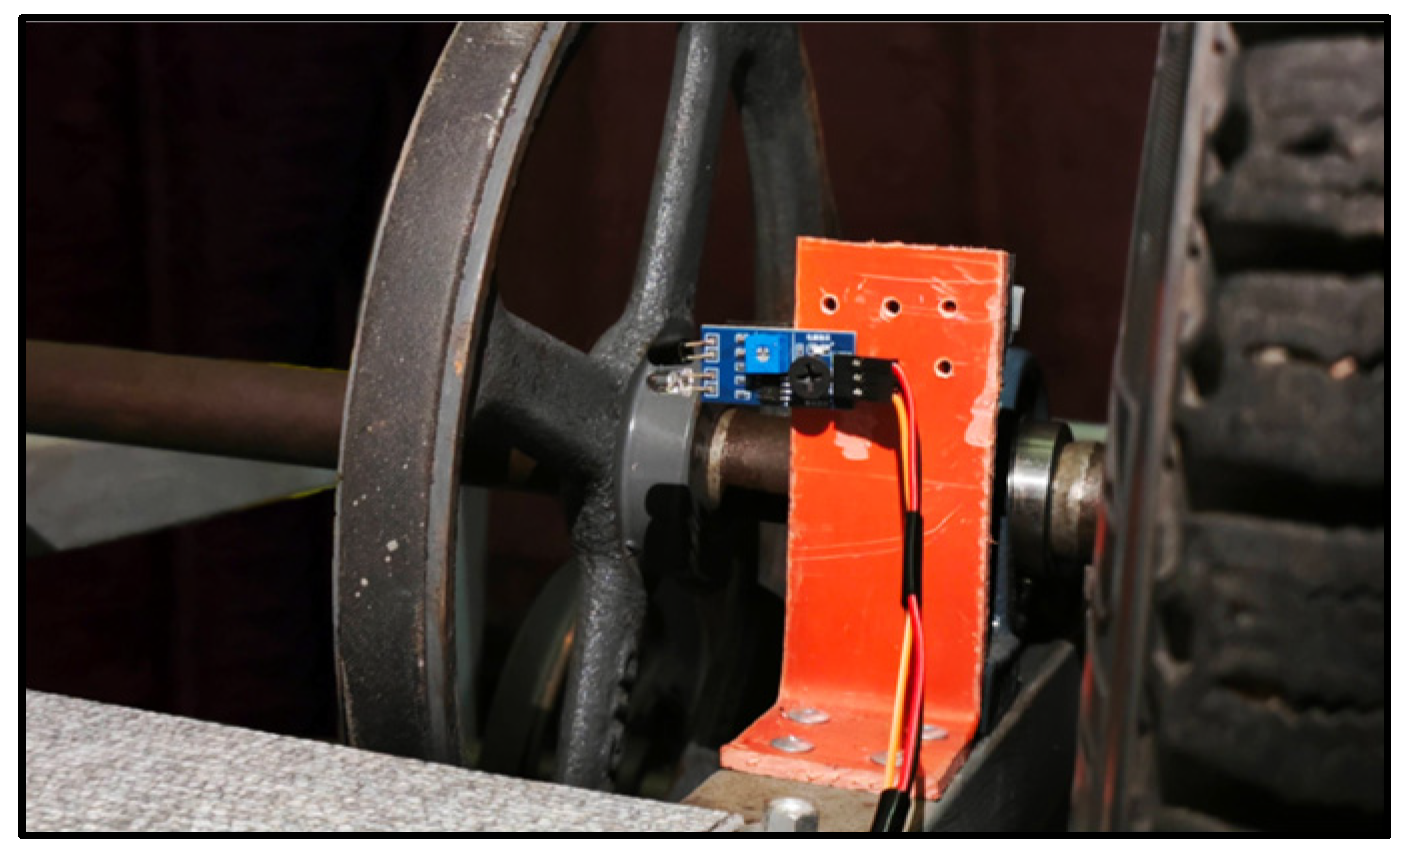
To monitor the speed of the wheel, an improvised tachometer using a standard infrared (IR) sensor was utilized. The infrared sensor was mounted in the frame that faced the spokes of the counter shaft sheave. It detected the spokes of the sheave when they passed through the sensor’s line of sight. Hence, the speed of the wheel was determined by calculating the number of passes divided by the number of spokes within a short period (Figure 10) [7].

3.3. System Integration of Terrain-Based TPMS

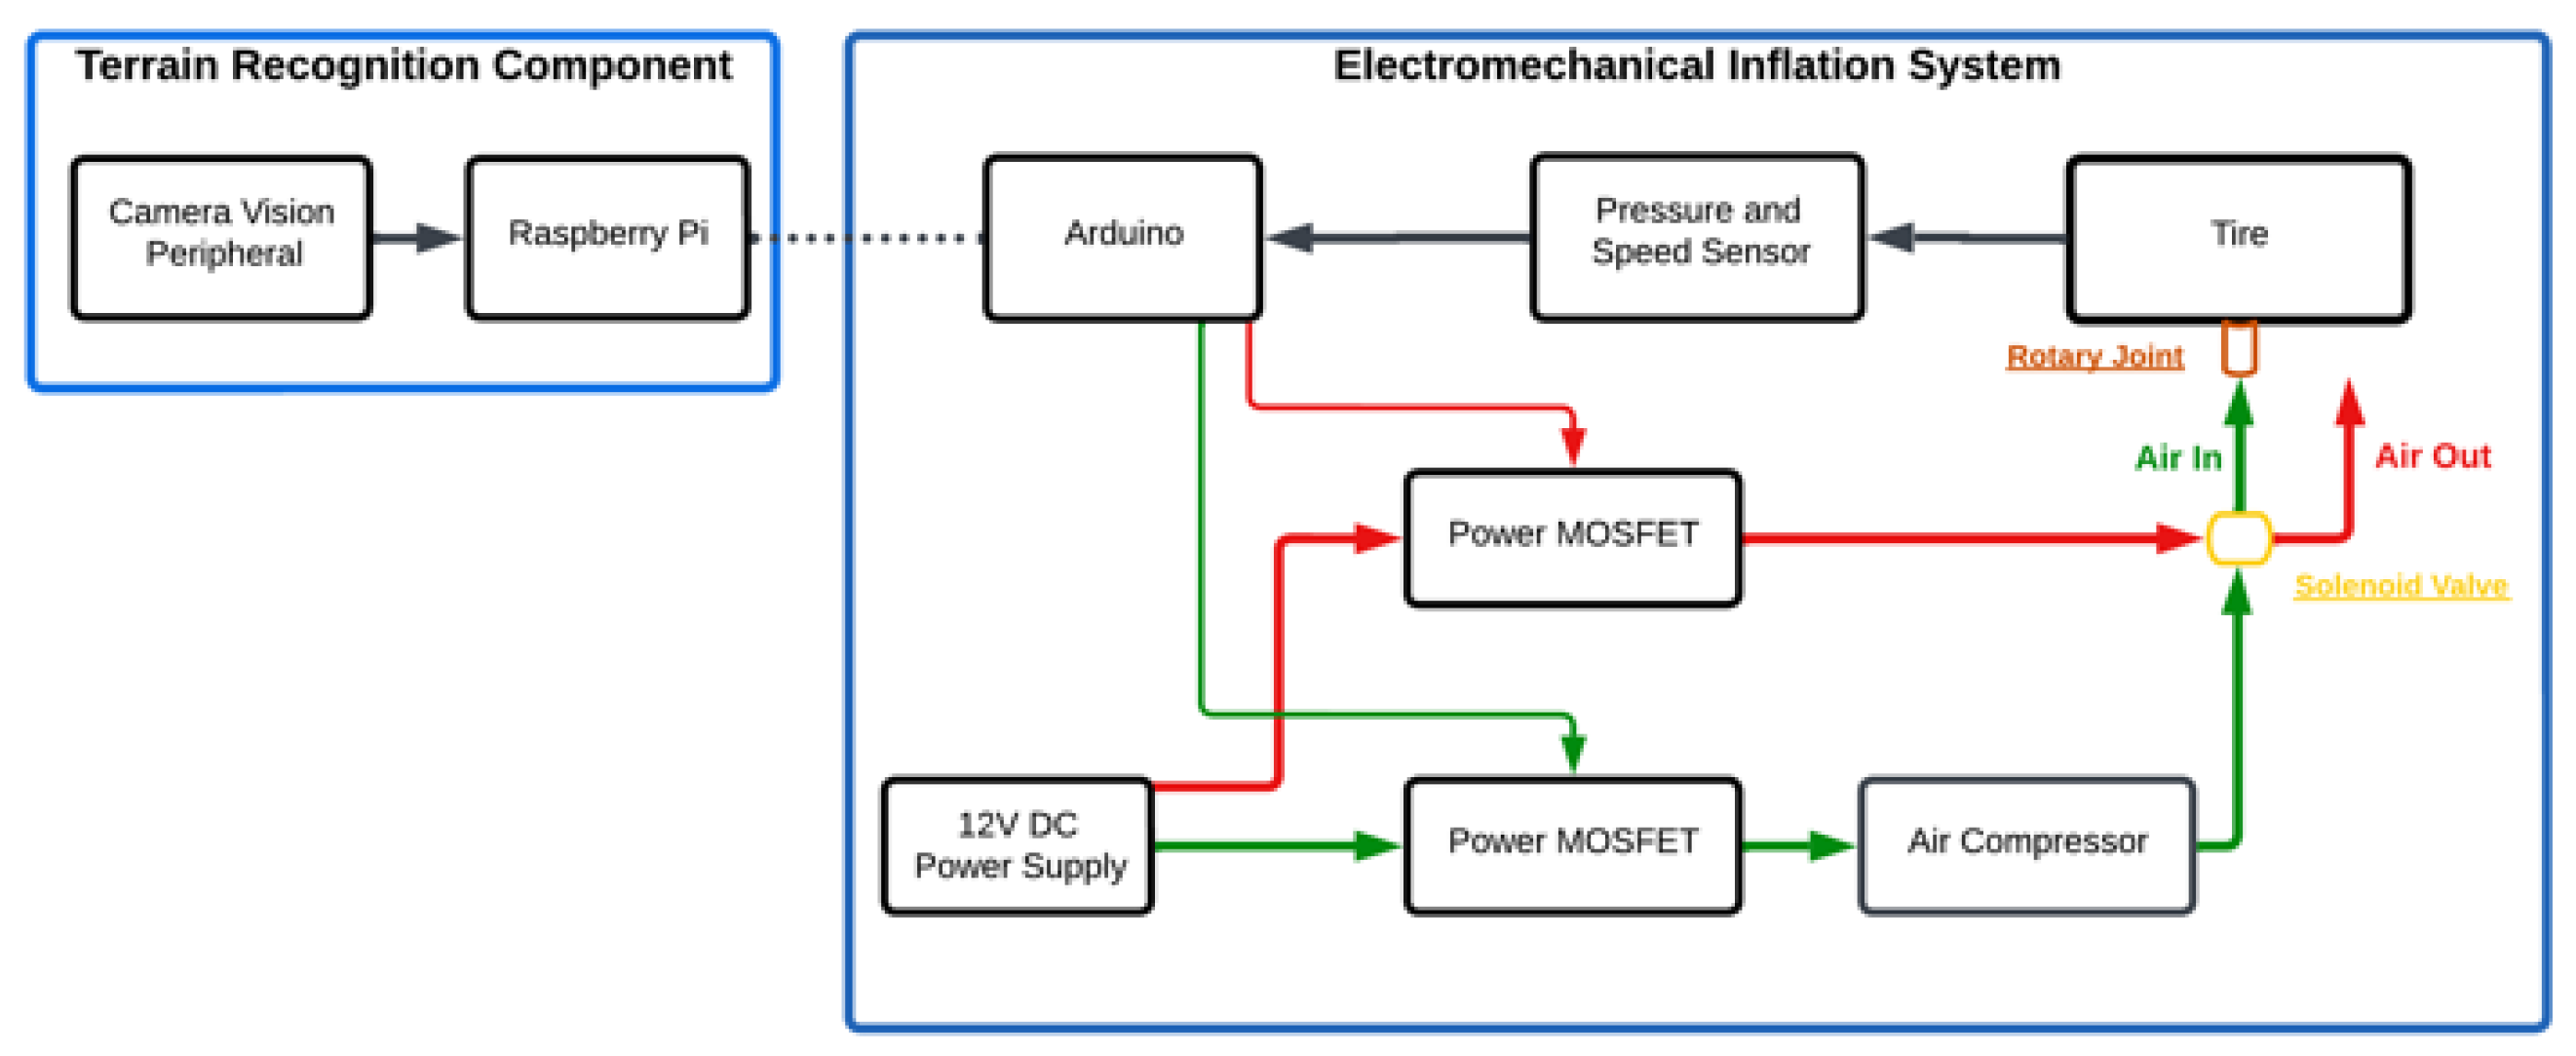
The terrain-based TPMS developed in this study included the terrain-recognizing component and the electromechanical inflation system using microcontrollers. The system was integrated as shown in Figure 11.
Two microcontrollers were included in the system, each controlling its own subsystems. These two microcontrollers were connected serially. In the terrain-recognizing component, a Raspberry Pi 4 Model B processed images and categorized them according to the predetermined terrain conditions in the algorithm. An Arduino microcontroller controlled the electromechanical inflation system. Upon receiving signals from the Raspberry Pi microcontroller, the Arduino microcontroller correspondingly sent signals to the switches to either start the air compressor for inflation or open the exhaust of the solenoid valve for deflation until the desired tire pressure was obtained.

3.4. Protection of Electronic Components from Mechanical Vibrations

In the electromechanical inflation system, the actively vibrating components were the air compressor and motor. The isolation mounts were used to dampen the vibration induced by the equipment. Specifically, foam pads were used as an interface to isolate the electronic equipment (i.e., microcontroller and embedded modules) from the system’s vibration. Electronic boxes encased the sensitive components, including the air compressor, motor, and rotary joint, to minimize induced noise.

4. Results and Discussion

4.1. Terrain Recognition Algorithm

The CNN models were evaluated through transfer learning to identify the best model for terrain recognition. Each model’s output layer was modified to classify three terrain types, and the models were trained for 10 epochs with different training times and classification accuracies. Model performance was assessed using 10% of the dataset. A confusion matrix, precision, recall, and F1-score were used to interpret and compare actual and predicted results. The best model for terrain classification was determined based on these comparative results.
Different accuracies were observed for differently trained models (Table 1). Similar models were trained using different deep layers, such as the different versions available for ResNet and VGG. Each trained model showed an accuracy of over 90% on the test data, which indicated effective performance.
Figure 12 shows the confusion matrix used to quantify correct and incorrect classifications. The true-positive value was 97, comprising 96 instances for uneven terrain, and 93 true-positive values for soft terrain. The precision was 0.9536, indicating that the model predicted 95.36% of all positive classifications. The recall was 0.9533, showing that the model captured 95.33% of all positive classes. The f1-score was 0.9534, indicating a good balance between the precision and recall values.
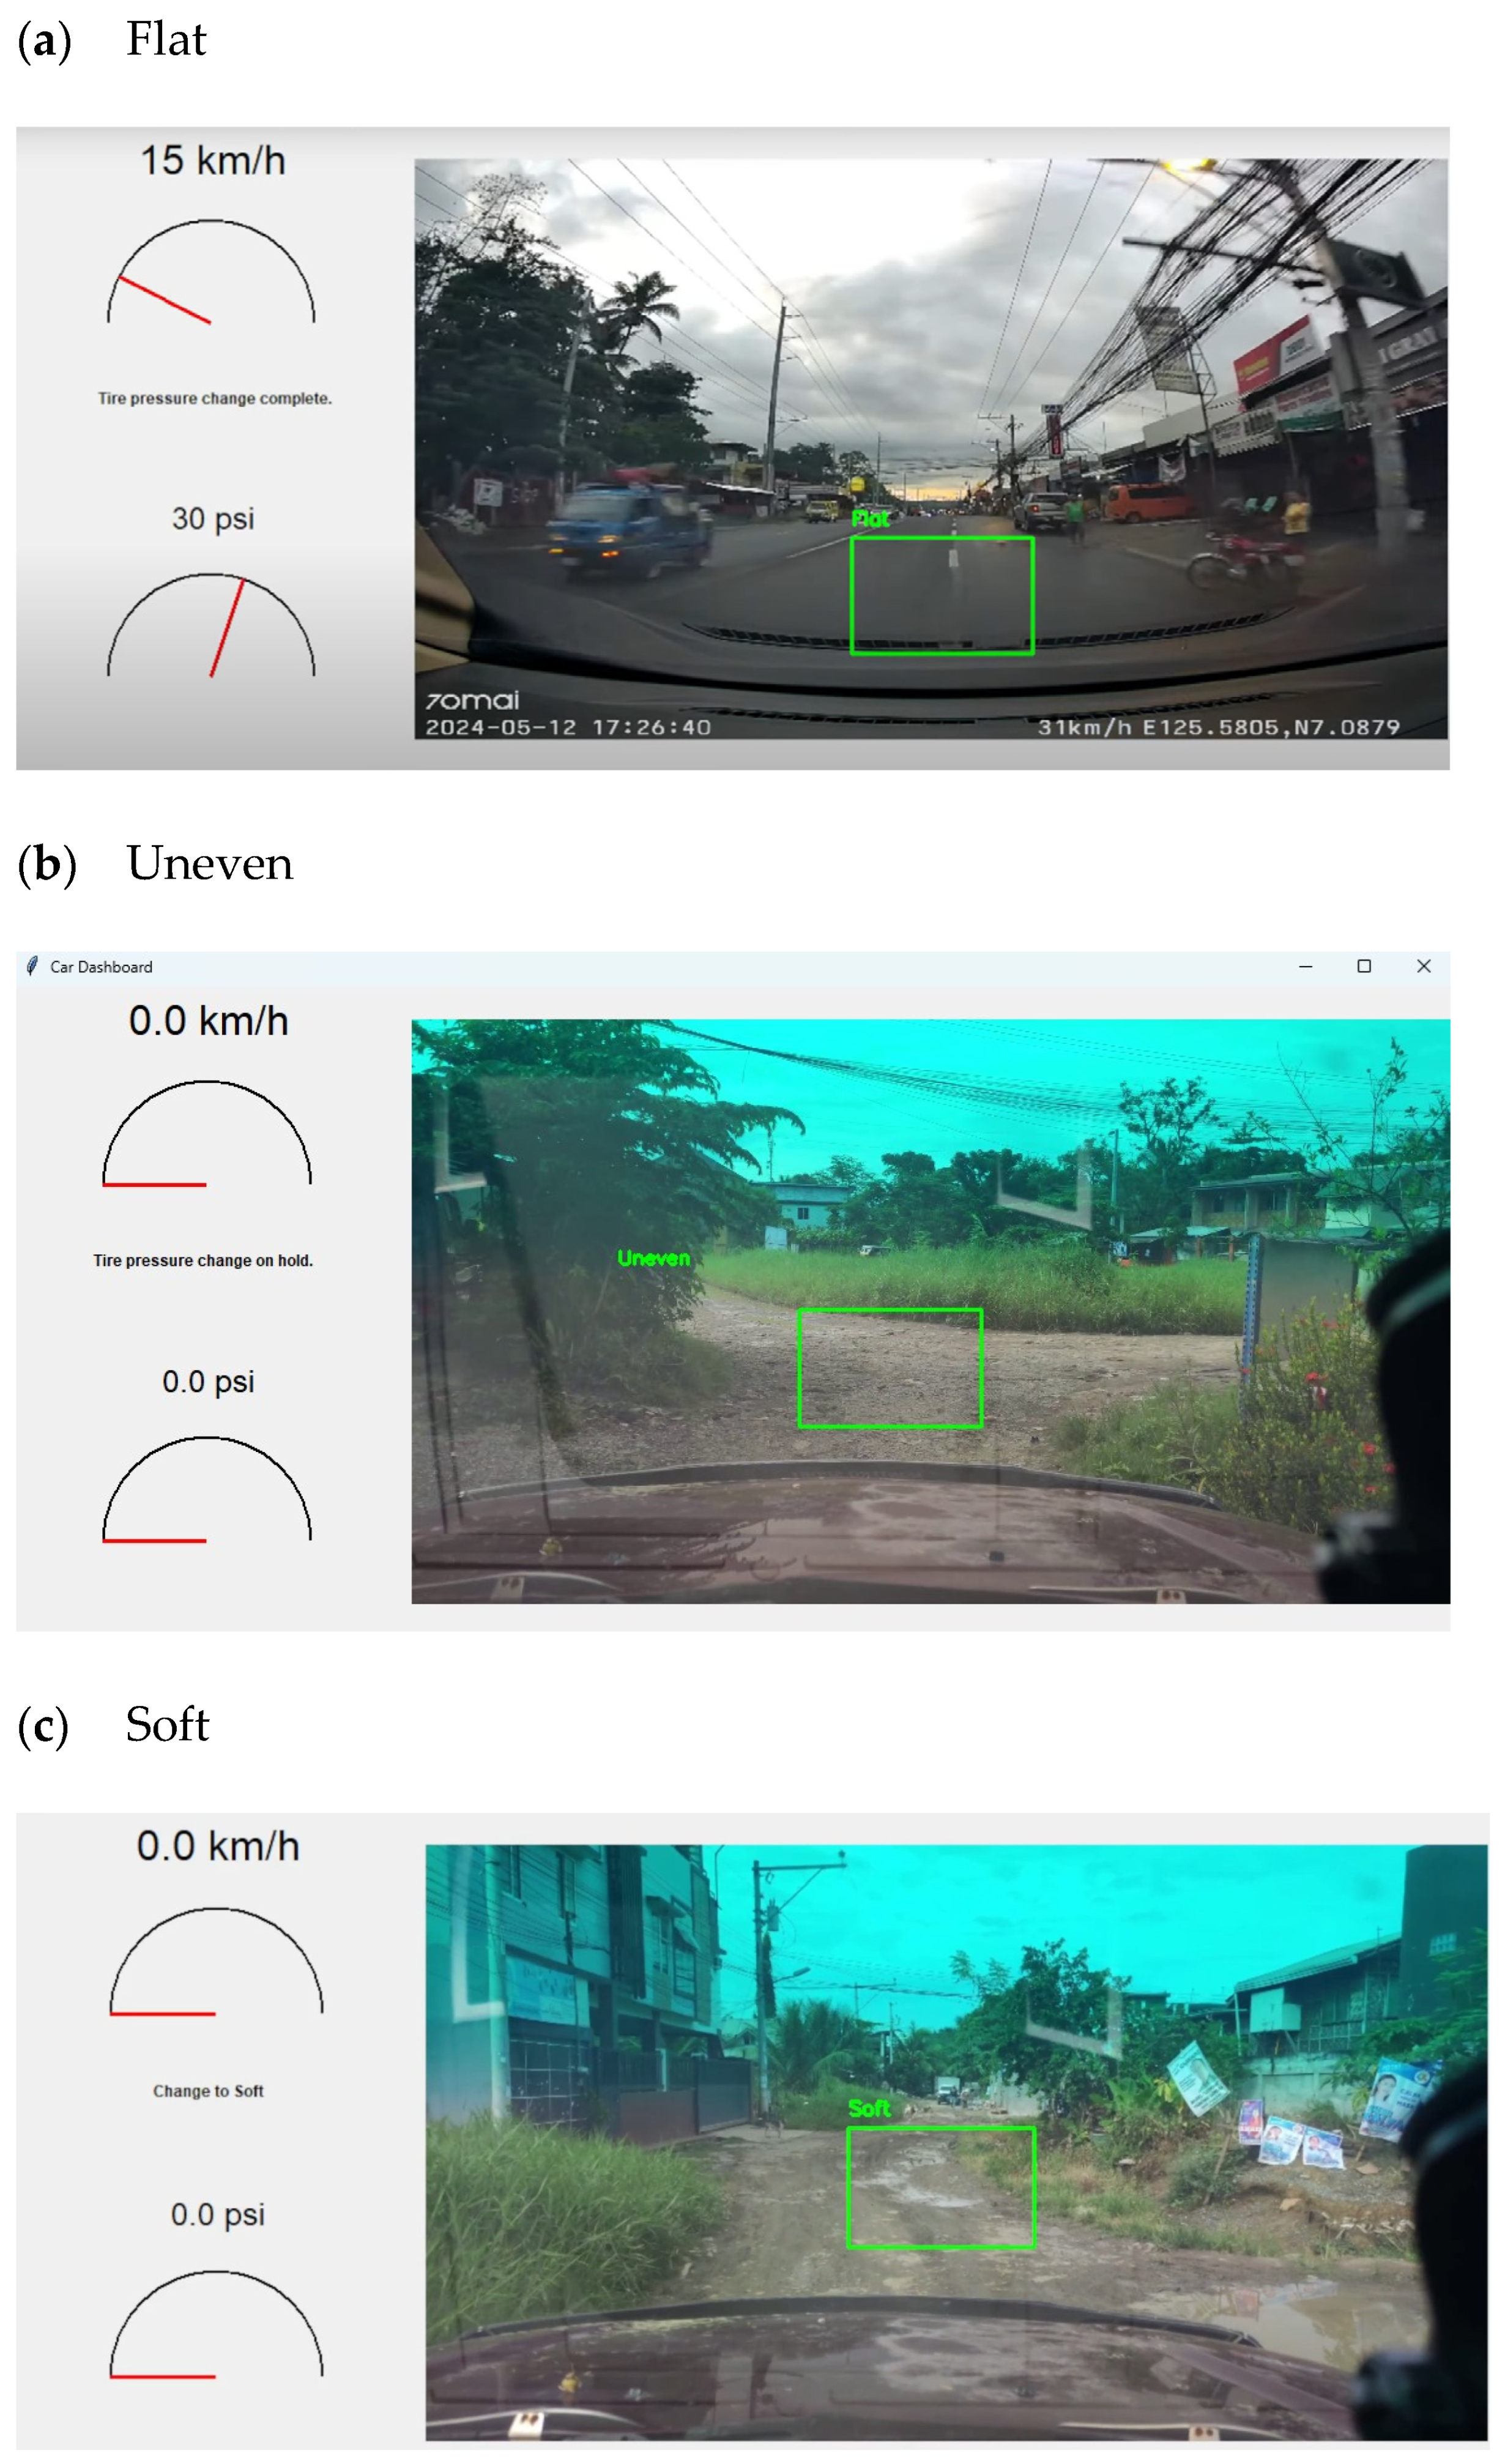
Figure 13 shows the simulation of the terrain recognition algorithm using the dashcam video footage. A queuing system was implemented using an array to output a change to the designated terrain after five consecutive similar classifications. The output was sent by the Arduino microcontroller.
ResNet-18 demonstrated higher accuracy than the other trained models (Table 1). The accuracy, precision, recall, and F1-score were higher than 95%, indicating an effective performance in learning and generalizing the images. The ResNet-18 and the Xception models showed similar accuracy, with notable disparities in training duration. The Xception model required 22,455 s to train the model, whereas ResNet-18 needed 3731 s.

4.2. Static Stress and Modal Frequency Tests

The structural integrity of the single-wheel test bed was tested through the static stress simulation in Fusion 360. The simulation was conducted to test the frame of the single-wheel test bed with the weight of the tires and its rim as the load in the system. The integrity of the system was stable, with a factor of safety not below 13.571. This signified that the frame of the single-wheel testbed withstood the load of the tire without significant deformations of the mechanical components. The frequency of vibration due to the air compressor was low, and without direct detrimental effects on the electronic components. Low-frequency vibrations cause mechanical stress and are easily mitigated through the use of dampeners. The frequency of the vibration of the air compressor does not match the modal frequency in the modal displacement of the single-wheel testbed’s frame.

4.3. Tire Pressure Management System Tests

The electromechanical system consisted of mechanical components such as the tire and other pneumatic components, and electronic components such as the solenoid and compressor. The system was tested in a series of inflations and deflations. The test involved measuring the time required to inflate and deflate the tire to the recommended pressures at different terrains, categorized as flat, soft, and uneven terrain. Table 2 summarizes the correlation between inflation/deflation rates and the time taken at varying speeds (0, 15, and 40 km/h). For inflation, across all test ranges, the average time to inflate increases as speed increases.
In the 0–30 PSI range, the average inflation time was 128.12 s at 0 km/h, 129.50 s at 15 km/h, and 135.68 s at 40 km/h. Similarly, for the 22–26 PSI range, the times were 17.01, 17.56, and 19.09 s, respectively. For PSI values of 26–30, the inflation time was 25.54 s at 0 km/h, 26.34 s at 15 km/h, and 28.05 s at 40 km/h. For PSI values of 22–30, the time was 43.16 s at 0 km/h, 44.49 s at 15 km/h, and 46.41 s at 40 km/h. The R2 values for these ranges were 0.9574, 0.9851, 0.9960, and 0.9985, respectively, indicating a strong correlation between inflation time and speed. There was a direct relationship between the speed and the inflation time required to reach a target pressure. The deflation test result revealed that deflation time slightly decreased as vehicle speed increased. For PSI values of 26–30, deflation times decreased from 9.48 s at 0 km/h to 8.40 s at 40 km/h, and a similar trend was observed for PSI values of 22–30. The R2 values ranged from 0.9710 to 0.9989, indicating a strong correlation between speed and deflation time and an indirect relationship between speed and deflation time.

4.4. System Integration

System integration tests involved the simulation of communication between the Arduino and Raspberry Pi 4 controllers and the inflation/deflation system. The Raspberry Pi 4 ran the terrain-recognizing algorithm and subsequently transmitted the terrain classification code to the Arduino to control the inflation/deflation of the system. The communication protocol employed between the two microcontrollers was I2C. There were no issues associated with the Raspberry Pi 4’s communication with the Arduino. With a baud rate of 9600 bauds and transmitting single-character terrain code (0, 1, and 2), the response time was instantaneous. However, there were observed fluctuations in the transducer’s pressure reading (Table 3).
Based on the data, at 22 PSI, the mean value of the five simulations was 22.11, which suggested a small positive deviation. The standard deviation was 0.4999, which suggested that the individual pressure readings vary by approximately 0.5 PSI. The standard error was 0.2236 (0.50%) indicating that there were no significant errors between the target PSI values and the PSI readings.
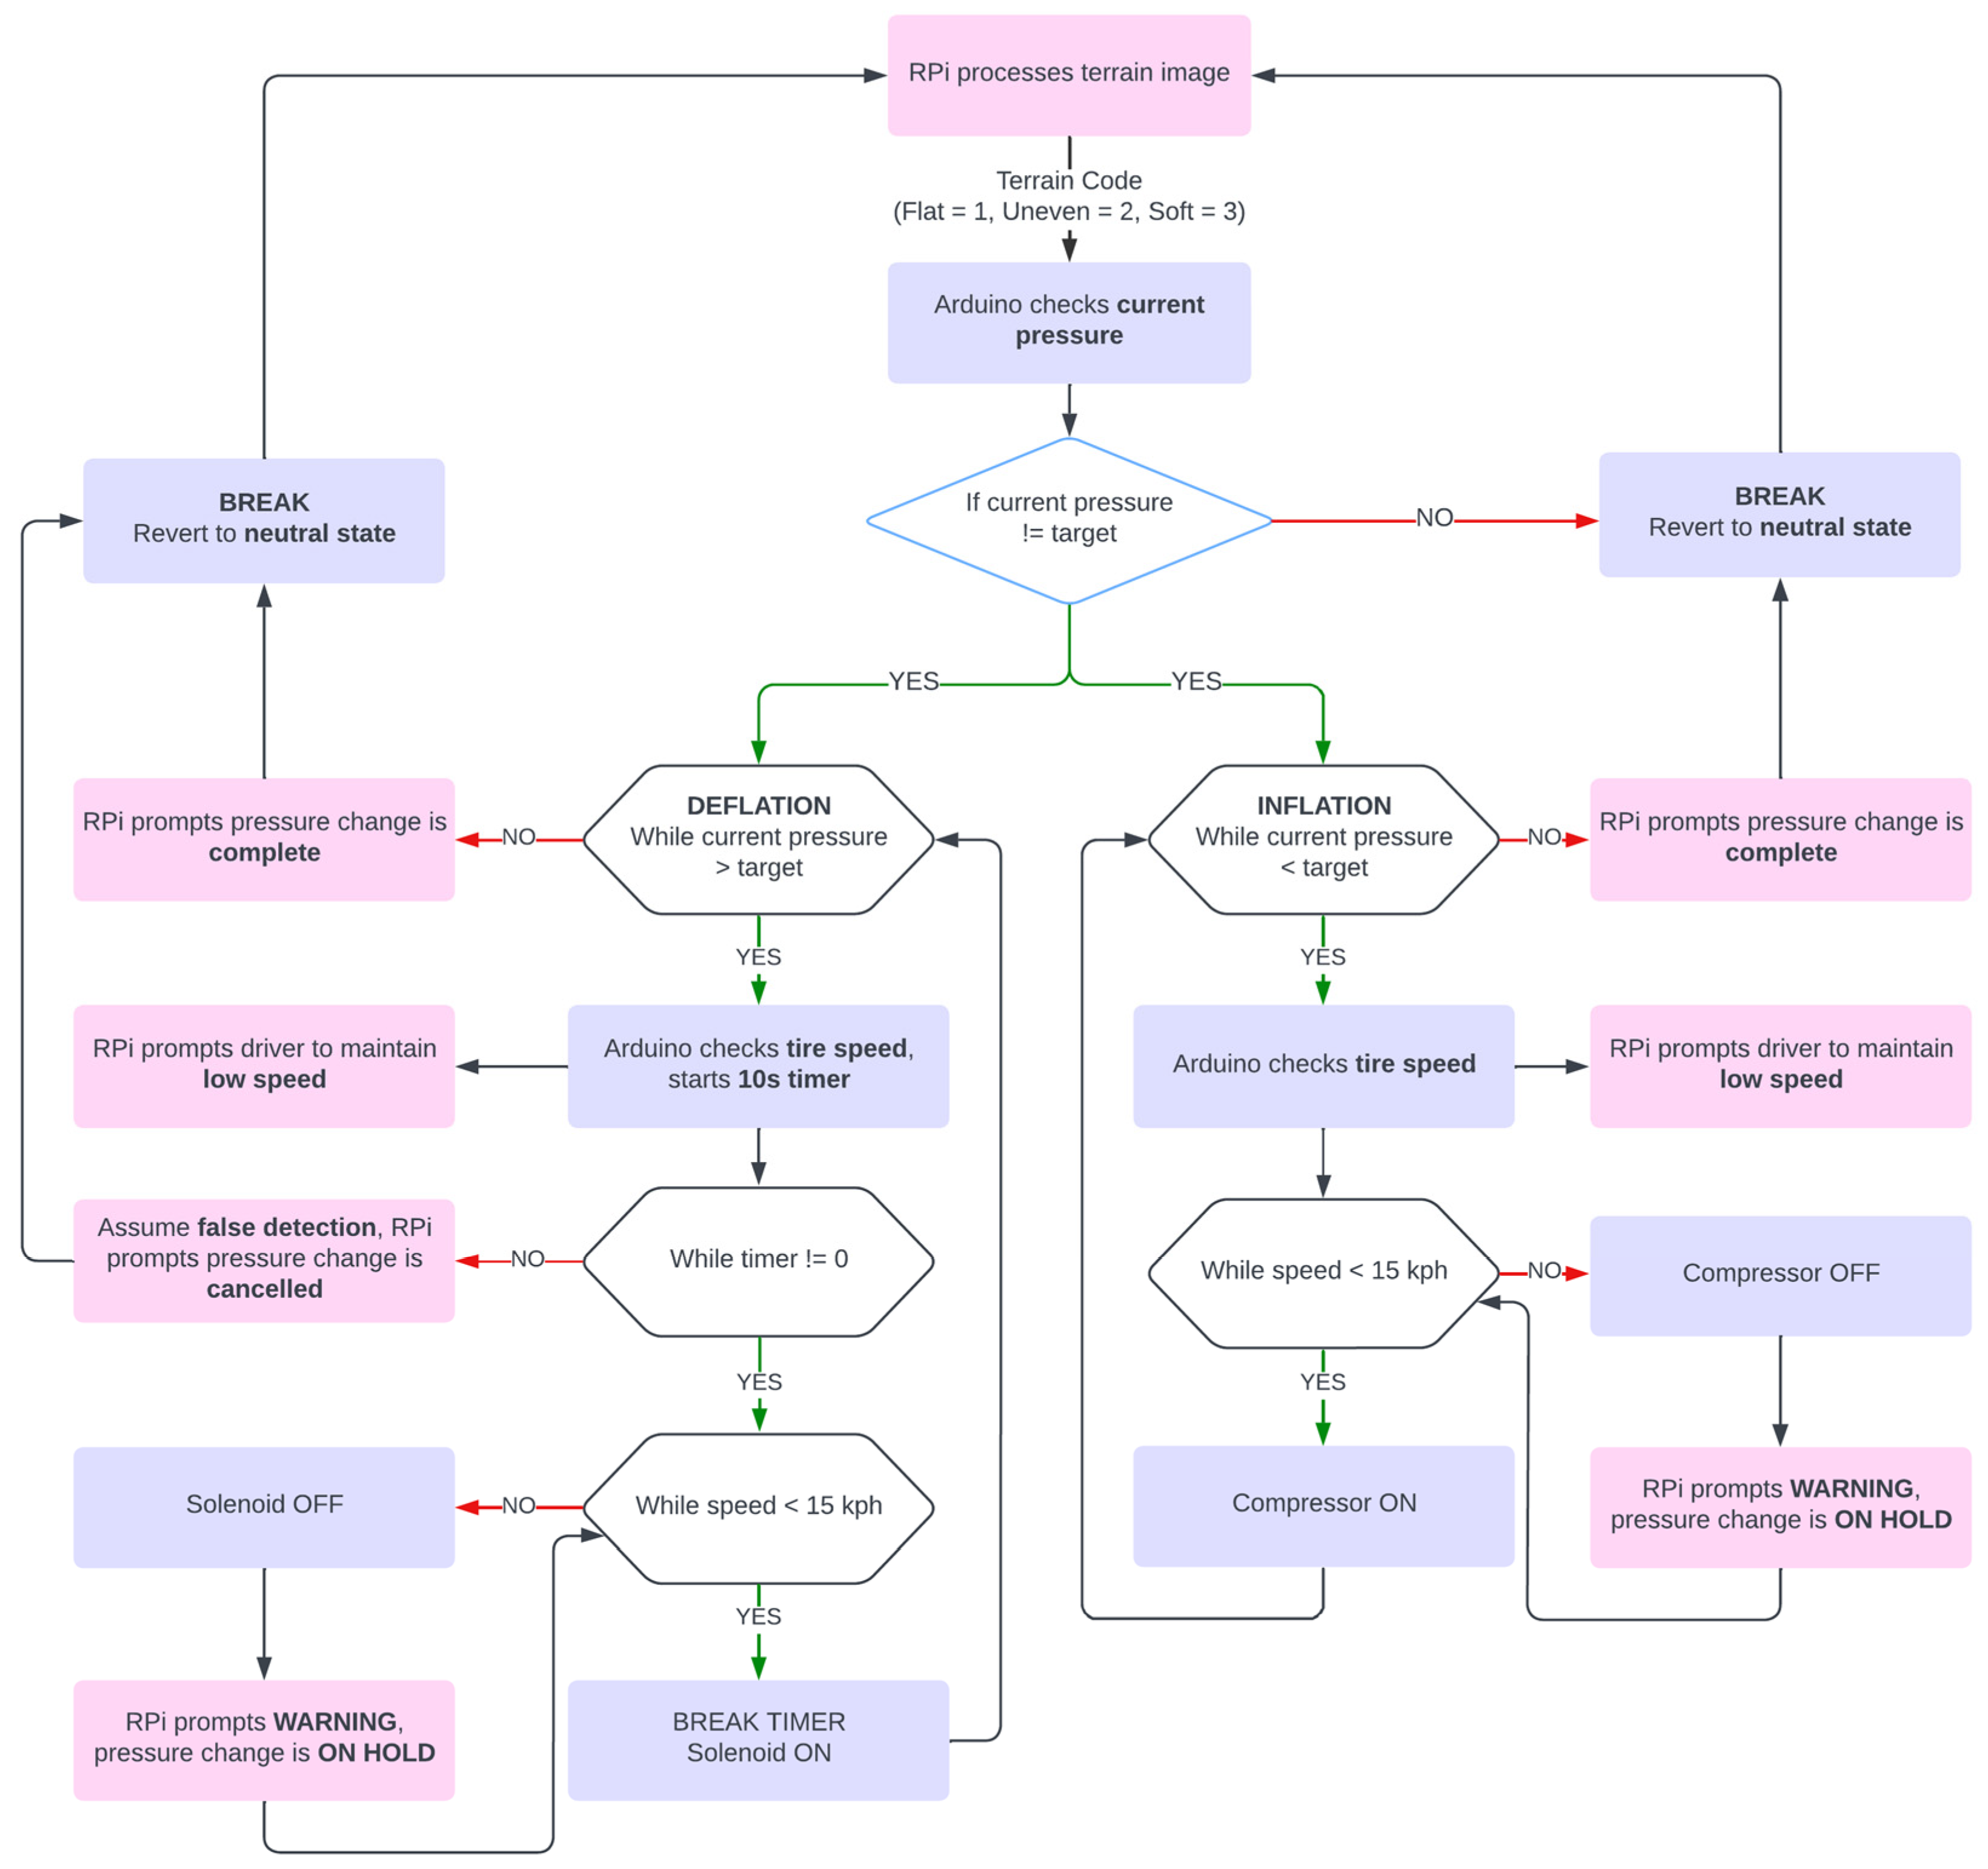
At 26 PSI, the mean value was 26.04, with a standard deviation of 0.4171. There was no significant error, and the standard error was 0.1703 (0.15%). The five simulations at 30 PSI showed a standard deviation of 0.2708, a standard error of 0.1211, and a percent error of 2.57%. There were minimal errors in the pressure readings. Overall, the results indicated that the fluctuation in the readings did not significantly affect the performance of the system. Based on the results, the operation of the TPMS was designed as shown in Figure 14.

5. Conclusions

We enhanced the performance of CTIS through the development of an automatic terrain recognition feature using the ResNet-18 model. The model demonstrated superior performance in terrain classification, with accuracy, precision, recall, and F1 score all exceeding 95%. This was achieved through real-time recognition and tire pressure adjustments based on terrain type. A queuing array system decreased the number of false positives, while the integration of the Arduino and Raspberry Pi 4 ensured efficient tire inflation and deflation with minimal pressure deviations. A significant correlation between inflation/deflation speed and optimal performance times was observed at speeds below 15 km/h. The terrain-based TPMS model represents a significant advancement in tire pressure management and enables applications for all-terrain vehicles, with the single-wheel testbed results highlighting its transformative potential in automotive technology. The study’s results show that there is room for refining model’s parameters by incorporating datasets to improve accuracy and stability. Advanced data augmentation techniques need to be employed to enhance the system’s application in adverse conditions. Future research needs to focus on vehicle compatibility to increase the adaptability of the TPMS with respect to various transmission types and gear configurations. Additionally, the integration of other internal sensors and the development of predictive modeling algorithms are necessary in order to optimize tire pressure management for various applications in automotive technology.

Author Contributions

Conceptualization, C.L.C.L., C.J.I.T. and E.A.S.; methodology, C.J.I.T. and E.A.S.; software, C.L.C.L.; validation, C.L.C.L., C.J.I.T. and E.A.S.; formal analysis, E.A.S.; investigation, C.J.I.T.; resources, C.L.C.L.; data curation, C.L.C.L., C.J.I.T. and E.A.S.; writing—original draft preparation, C.J.I.T.; writing—review and editing, E.A.S.; visualization, C.L.C.L.; supervision, M.B.T., E.G.T.R. and J.P.T.C.; project administration, M.B.T., E.G.T.R. and J.P.T.C.; funding acquisition, M.B.T. and E.G.T.R. All authors have read and agreed to the published version of the manuscript.

Funding

This research presentation was funded by Mapua Malayan Colleges Mindanao through the Office for Research, Development, and Innovation.

Institutional Review Board Statement

Not applicable.

Informed Consent Statement

Not applicable.

Data Availability Statement

Datasets were downloaded from open access websites. Meanwhile, newly created datasets by authors may be requested by sending an email to any of the authors.

Conflicts of Interest

The authors declare no conflict of interest.

References

  1. Birkland, C. It’s in the Air: Managing and Maintaining Tires to Increase Service Life. Fleed Equipment, 14 December 2017. Available online: https://www.fleetequipmentmag.com/managing-maintaining-truck-tires-increase-service-life/ (accessed on 11 January 2023).
  2. d’Ambrosio, S.; Mattei, E.D.; Vitolo, R.; Amati, N. Automatic adjustment of tire inflation pressure through an intelligent CTIS: Effects on the vehicle lateral dynamic behavior. Proc. Inst. Mech. Eng. Part D J. Automob. Eng. 2021, 235, 3487–3508. [Google Scholar] [CrossRef]
  3. Phelan, M. Proper tire pressure can keep you out of car accidents. USA Today, 4 July 2016. [Google Scholar]
  4. d’Ambrosio, S.; Vitolo, R. Potential impact of active tire pressure management on fuel consumption reduction in passenger vehicles. Proc. Inst. Mech. Eng. Part D J. Automob. Eng. 2018, 233, 961–975. [Google Scholar] [CrossRef]
  5. Janulevičius, A.; Pupinis, G.; Kurkauskas, V. How driving wheels of front-loaded tractor interact with the terrain depending on tire pressures. J. Terramechanics 2014, 53, 83–92. [Google Scholar] [CrossRef]
  6. Ramzan, F.; Khan, M.U.G.; Sajid, I. A Deep Learning Approach for Automated Diagnosis and Multi-Class Classification of Alzheimer’s Disease Stages Using Resting-State fMRI and Residual Neural Networks. J. Med. Syst. 2020, 44, 37. [Google Scholar] [CrossRef] [PubMed]
  7. Arduino Project Hub. 22 April 2023. Available online: https://projecthub.arduino.cc/mircemk/arduino-tachometer-rpm-meter-with-ir-sensor-module-a36d7c (accessed on 5 May 2024).
Figure 1. ResNet-18 architecture [6].
Engproc 92 00075 g001
Figure 2. Image samples.
Engproc 92 00075 g002
Figure 3. Original (left) and augmented (right) images.
Engproc 92 00075 g003
Figure 4. Inflation and deflation process.
Engproc 92 00075 g004
Figure 5. Pneumatic system.
Engproc 92 00075 g005
Figure 6. Three-dimensional single-wheel testbed model.
Engproc 92 00075 g006
Figure 7. Actual single-wheel testbed.
Engproc 92 00075 g007
Figure 8. Four-pulley belt drive system.
Engproc 92 00075 g008
Figure 9. Speed control using AC dimmer.
Engproc 92 00075 g009
Figure 10. Tachometer using IR sensor.
Engproc 92 00075 g010
Figure 11. Workflow of terrain-based TPMS.
Engproc 92 00075 g011
Figure 12. Confusion matrix of ResNet-18.
Engproc 92 00075 g012
Figure 13. Video simulation of terrain types: (a) flat, (b) uneven, and (c) soft.
Engproc 92 00075 g013
Figure 14. Final operational flow chart.
Engproc 92 00075 g014
Table 1. Comparison of the results of different models.
ModelAccuracyPrecisionRecallF1-Score
ResNet-180.95330.95360.95330.9534
ResNet-500.92000.92160.92000.9200
VGG160.91330.91300.91330.9130
VGG190.93330.93380.93330.9332
DenseNet0.92670.93020.92670.9264
Xception0.95000.95070.95000.9501
Table 2. Inflation/deflation rates at varying speeds and their correlations.
Test Range (PSI)Average Time at 0 kph (s)Average Time at 15 kph (s)Average Time at 40 kph (s)R2Correlation
Inflation
0–30128.12129.50135.680.9574Strong
22–2617.0117.5619.090.9851Strong
26–3025.5426.3428.050.9960Strong
22–3043.1644.4946.410.9985Strong
Deflation
30–269.489.138.400.9967Strong
26–229.879.458.830.9989Strong
30–2217.3317.0215.910.9710Strong
Table 3. Transducer pressure.
Target PSITrial 1Trial 2Trial 3Trial 4Trial 5MeanStd DevStd Error% Error
2221.6322.4721.5022.5022.4522.110.49990.22360.50
2625.5625.9626.5626.4925.6426.040.41710.17030.15
3030.6931.1330.4530.6230.9530.770.27080.12112.57
Disclaimer/Publisher’s Note: The statements, opinions and data contained in all publications are solely those of the individual author(s) and contributor(s) and not of MDPI and/or the editor(s). MDPI and/or the editor(s) disclaim responsibility for any injury to people or property resulting from any ideas, methods, instructions or products referred to in the content.