1. Introduction
Reliability is described as the power system’s ability to provide services to consumers continuously [
1]. The Philippine Distribution Code defined reliability as the capability of a system to execute a required task given a specified duration and environment [
2]. The interconnected power systems for generation, transmission, and distribution must have reliability. The distribution system’s reliability is mandated to supply uninterrupted power to customers for a given period under pre-determined operating conditions.
Reliability indices are used to measure the performance of a distribution network. The two approaches for the computation of reliability include the analytical and simulation methods. The analytical approach requires a mathematical model to calculate the reliability indices using direct numerical solutions [
3]. The analytical approach provides anticipation indices quickly [
4,
5]. The simulation method, on the contrary, is used to assess the reliability indices through the simulations of the system behavior and processes. Calculated reliability indices are used to assess the low-performing sections of the system and propose technical solutions. Reliability must reflect the needs of the end-users to optimize and reduce the total electricity cost [
6].
Recent study results show that power interruptions under the distribution system comprise more than 80% of the total recorded outages [
1,
7,
8]. The computation of reliability indices is vital in monitoring and analyzing the performance of a distribution system since it helps determine low-performing sections to reinforce the distribution network. It enables consistent reporting to supervise new personnel. The investment cost in upgrading the distribution system is related to the level of reliability. The higher the target reliability in a distribution system, the higher the cost of financial investments [
9,
10].
Several distribution utilities and electric cooperatives do not regularly compute reliability indices for the assessment or improvement of the quality of service. Manual computation methods are used, though they are prone to human errors. Therefore, we developed a new method for the assessment and evaluation of the power distribution system using an analytical method. The developed method was validated for the power distribution system of the Freeport Area of Bataan (FAB) using reliability assessment software.
2. Reliability Indices
The IEEE Standard 1366-2012 is announced for standardizing power distribution system reliability indices and investigating factors that affect the performance of the utility [
11]. Accurate and continuous reporting practices are formulated for power distributors. It is also necessary to supervise new personnel in the distribution network with tools for the assessment and evaluation of performance. The IEEE Standard 1366-2012 classifies the reliability indices as sustained interruption, load-based, and momentary indices. The standard also defines the common dimension of the reliability of distribution utilities as system average interruption frequency index (SAIFI), system average interruption duration index (SAIDI), customer average interruption frequency index (CAIFI), and customer average interruption duration index (CAIDI).
2.1. SAIFI
SAIFI is the frequency of an average consumer experiencing a sustained interruption over a specific time.
2.2. SAIDI
SAIDI shows the total duration of outage or interruption that an average consumer experiences during a specific time measured in minutes.
2.3. CAIDI
CAIDI defines the average duration needed to reinstate distribution services.
2.4. CAIFI
CAIFI presents the average frequency of consumers experiencing sustained interruptions. The customer is counted once, regardless of the number of times they experience an outage or interruption.
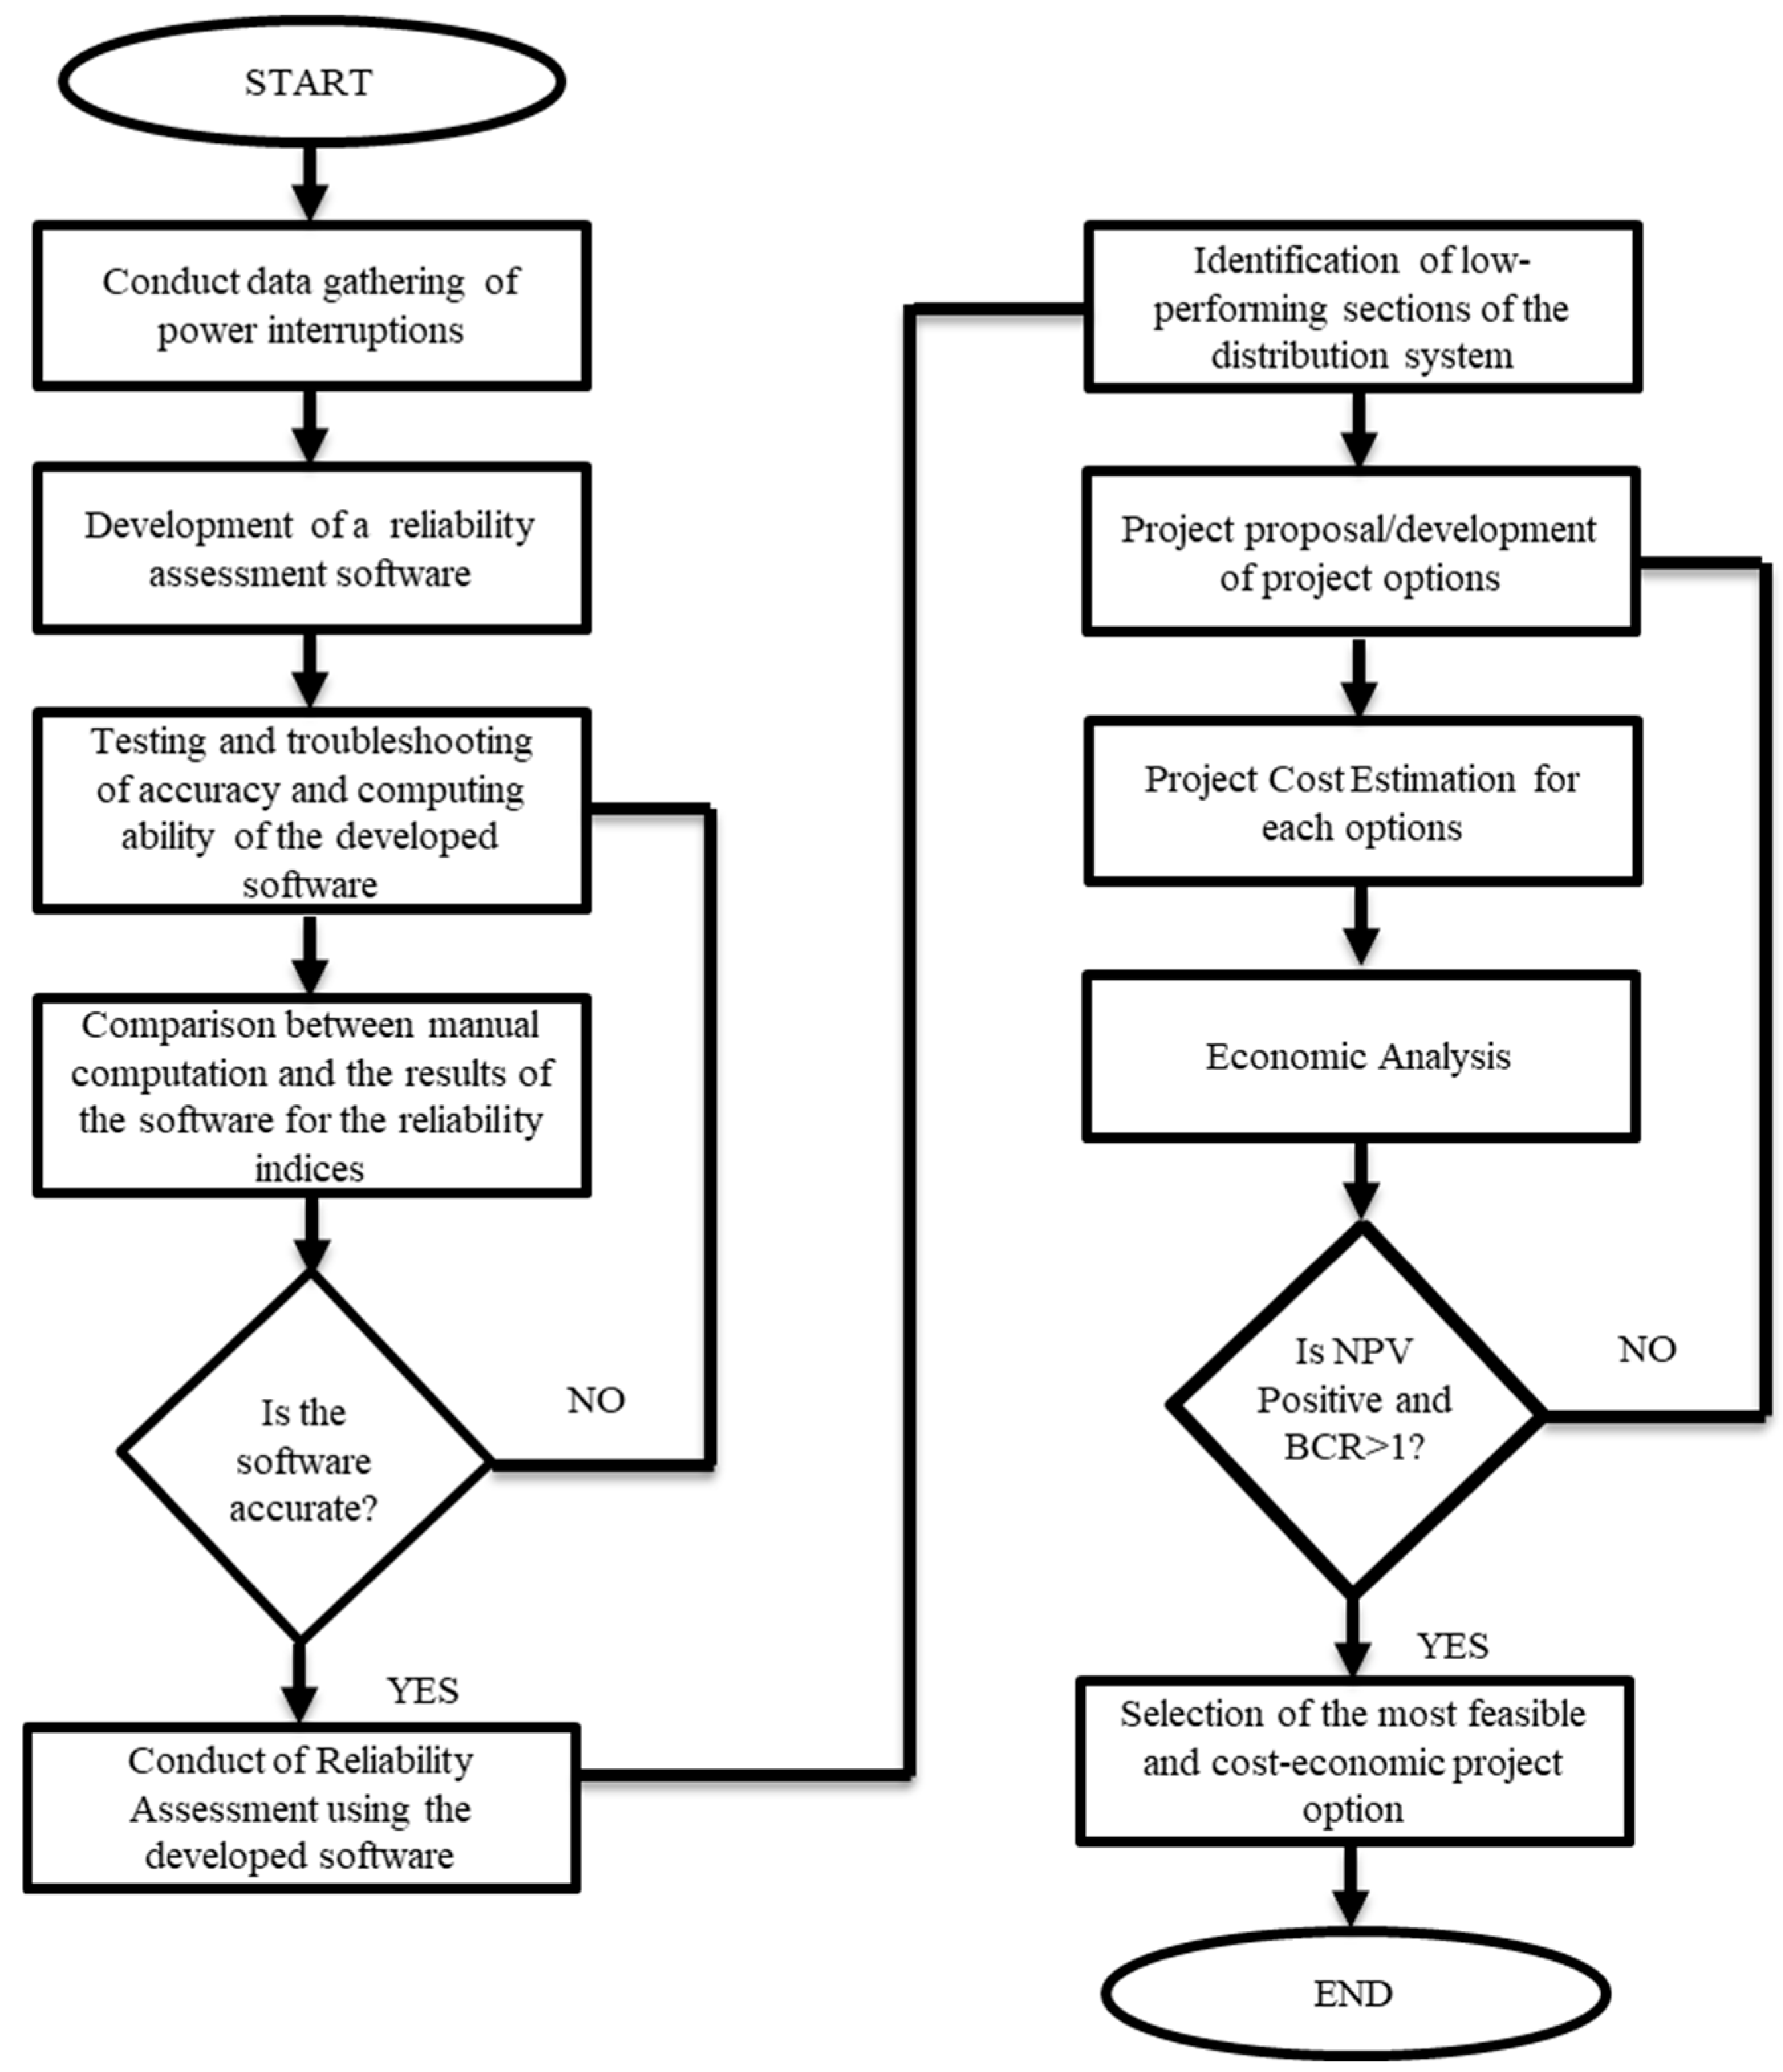
3. Reliability Assessment Process Flow
The reliability assessment of the distribution system of the FAB was conducted in five phases: (a) gathering inputs; (b) development of reliability assessment software; (c) reliability assessment; (d) project proposal; and (e) economic analysis.
For the gathering of inputs, the interruption data from FAB-Distribution Utility was collected and sorted according to the range of interruptions to be analyzed (i.e., years covered). In the second phase, we developed reliability assessment software using Microsoft Visual Studio. The software calculates reliability indices. The indices calculated by the software and manual computation were compared. In the third phase, the reliability indices for the previous three years were calculated using the software to determine the low-performing sections of the power distribution network. In the fourth phase, technical options were used to identify equipment and components and estimate project costs. In the last phase, economic analysis was conducted to determine economic feasibility and efficiency (
Figure 1).
4. Results and Discussion
4.1. Software Development
To test the software’s computing ability, 36 cases during the years 2018–2020 were selected. A Pearson correlation was calculated for SAIFI, SAIDI, CAIFI, and CAIDI. The result showed the perfect match of the indices. The convenience of using the developed software was also assessed. Five engineers tested the software and manually computed the values of the reliability indices. The outages in December 2020 were used for the validation. The case included 17 outages, including four forced outages. The average time for manual computation was 3.60 min, while 0.58 min was spent on software computation. A paired sample t-test was conducted for the duration of manual and software computations. At a two-tailed p-value of 0.0001, the difference between the paired groups of data was significant. Therefore, the time for software computations was significantly shorter than that for manual computations.
4.2. Reliability Assessment
Table 1 shows the 3-year average of the annual SAIFI, SAIDI, CAIFI, and CAIDI of the distribution system of FAB.
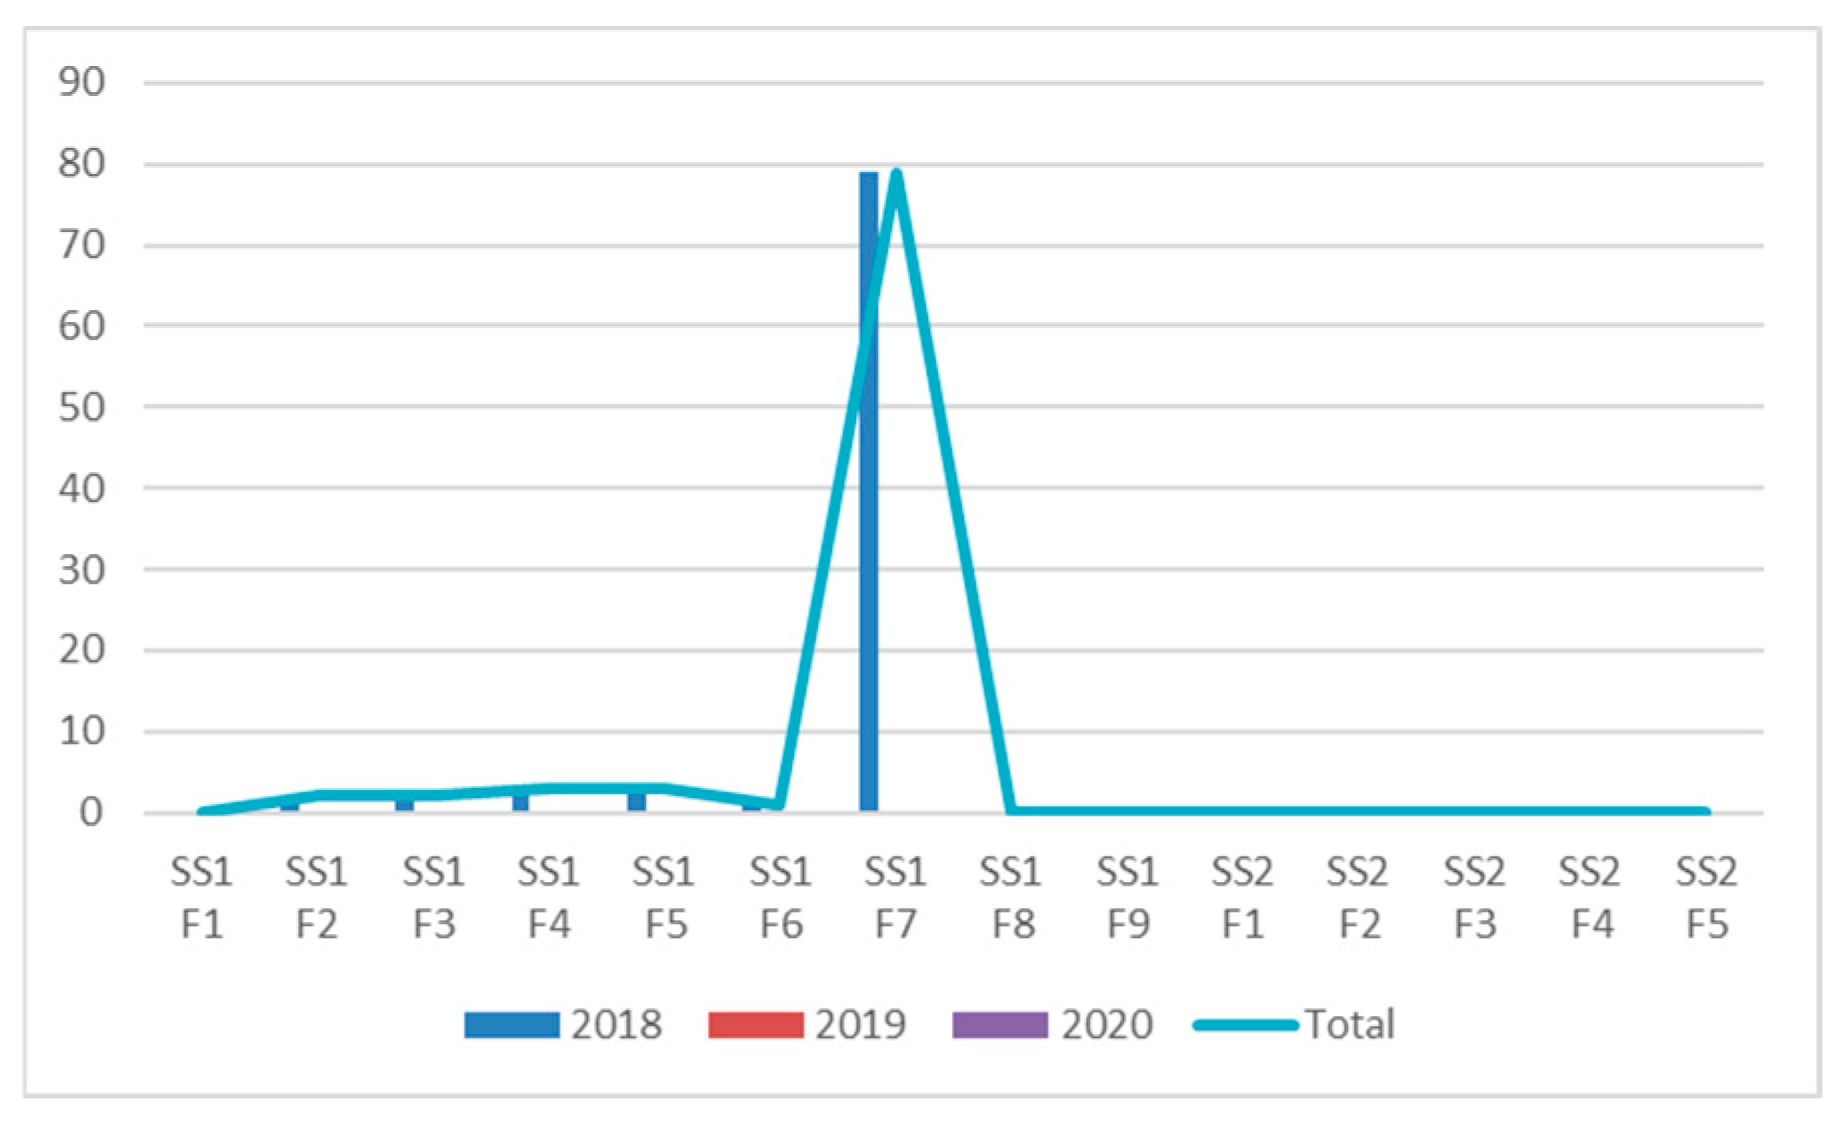
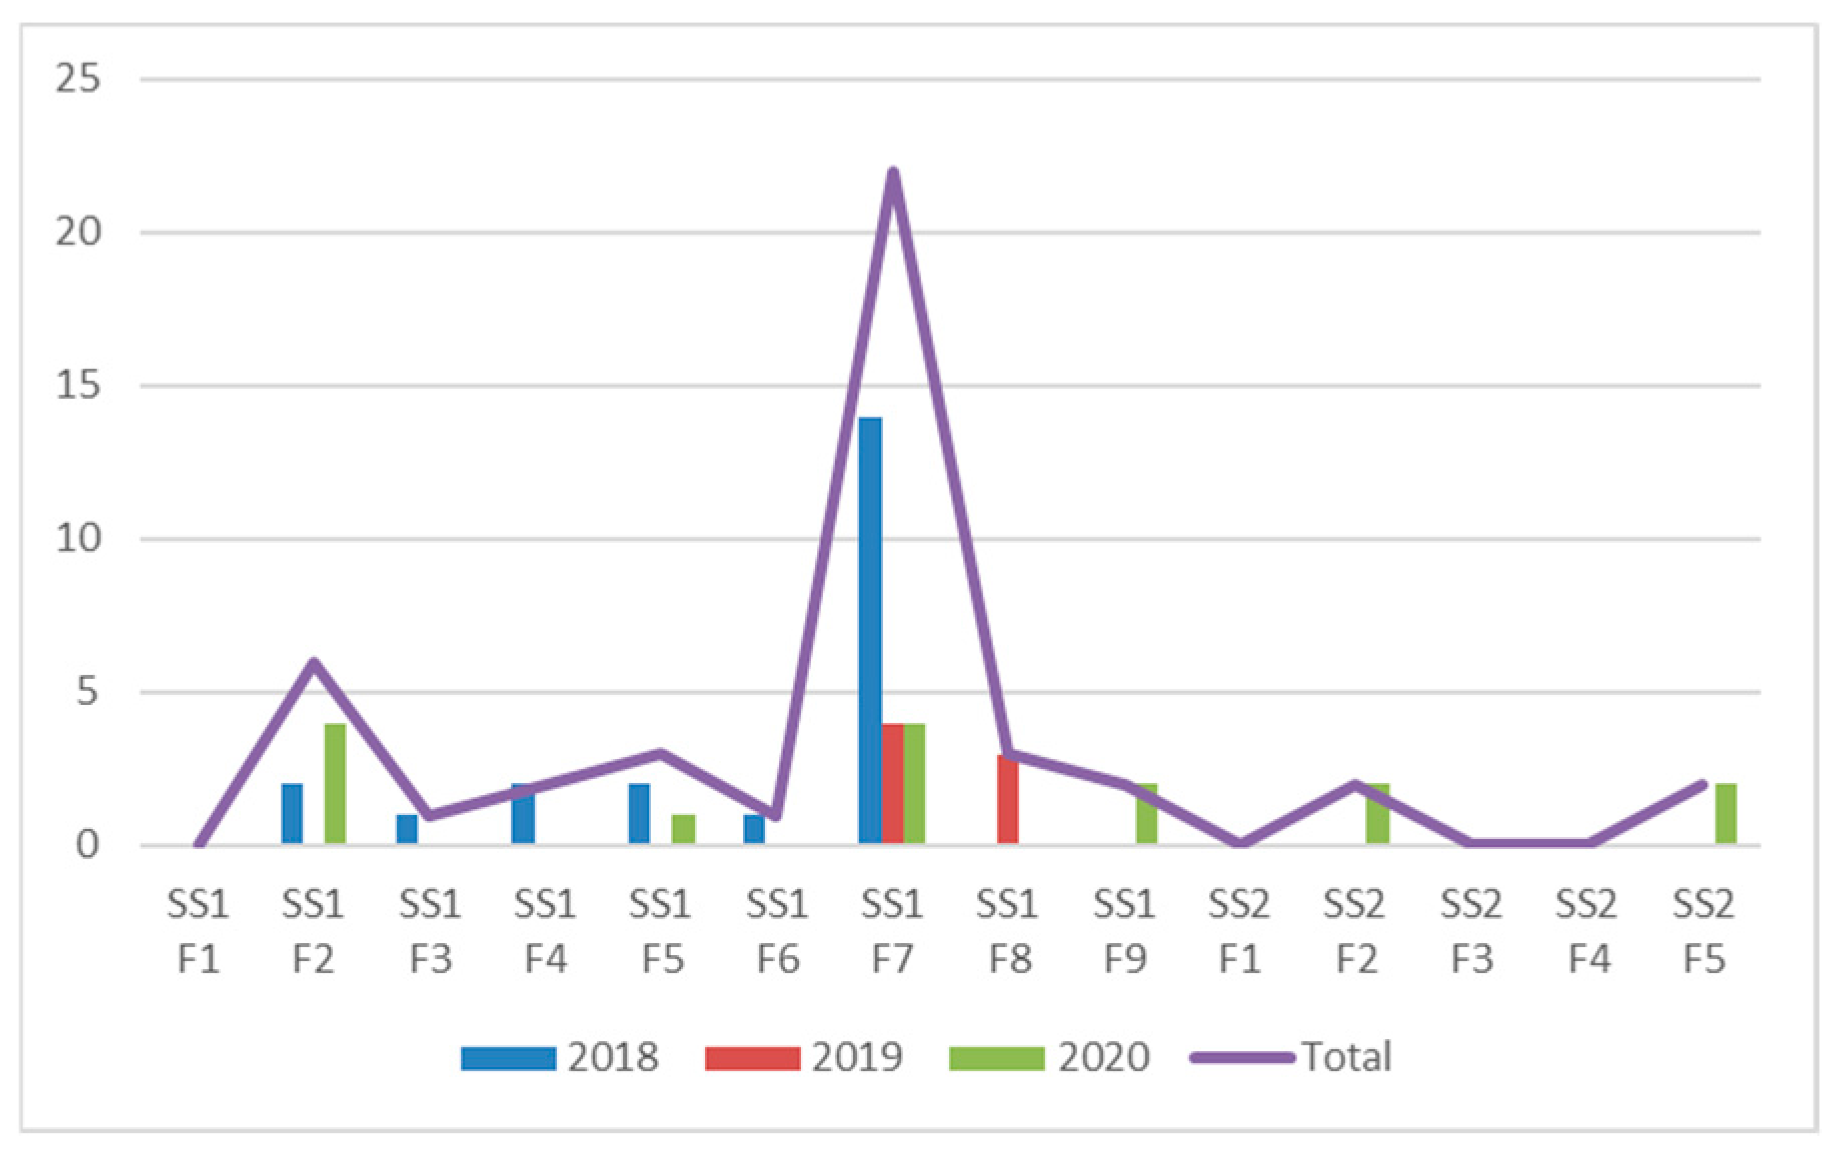
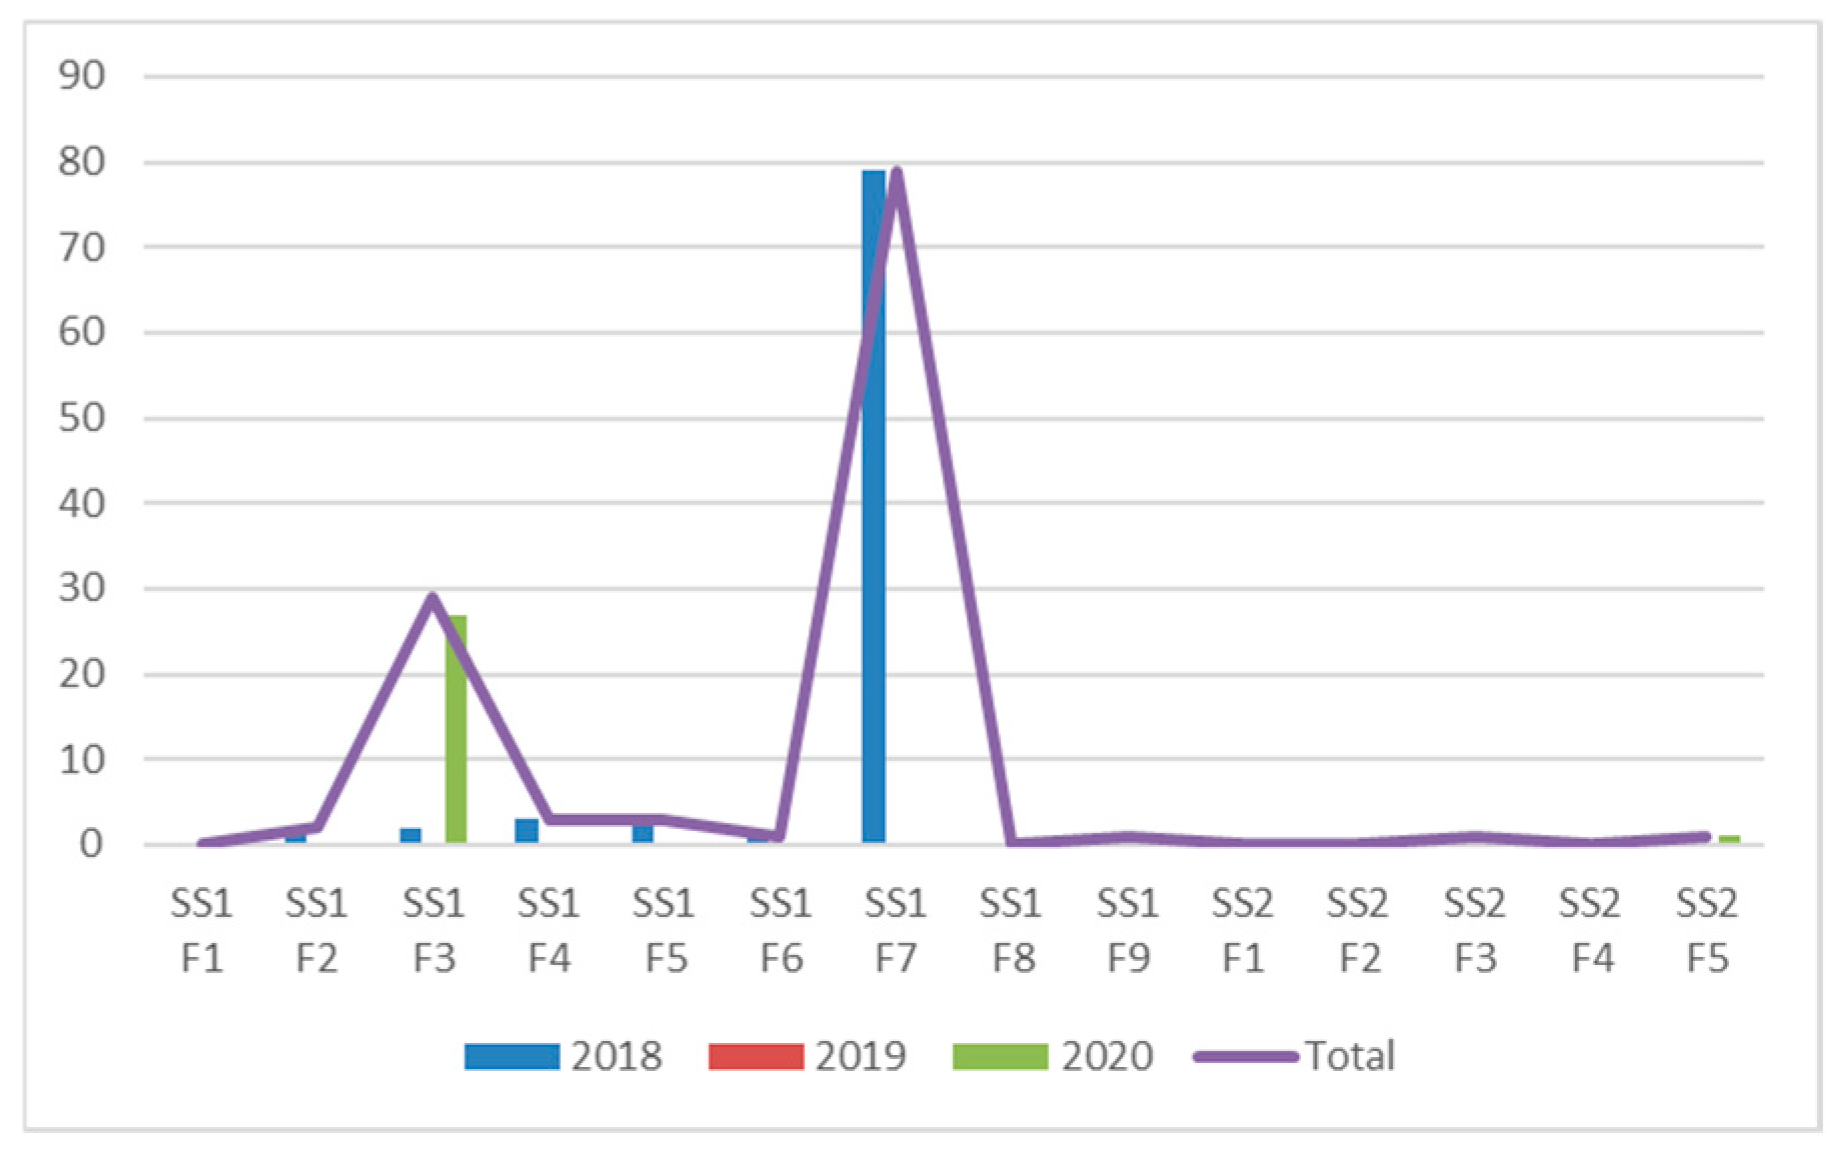
Table 2 presents the monthly averages of the reliability indices (SAIFI, SAIDI, CAIFI, and CAIDI) for the identification of low-performing sections of the distribution system of FAB.
For 36 months from 2018 to 2020, 17, 3, 10, and 4 months had lower values for SAIFI, SAIDI, CAIFI, and CAIDI than the average, as shown in
Table 3.
By using the monthly average of reliability indices in
Table 2, we analyzed the low-performing sections of the network of FAB.
Figure 2,
Figure 3,
Figure 4 and
Figure 5 show the number and duration of forced outages and their SAIFI, SAIDI, CAIFI, and CAIDI.
Based on the historical data of forced outages, the most problematic sections of the network of FAB in terms of frequency and outage duration in SAIFI, SAIDI, CAIFI, and CAIDI were Feeders 2, 4, and 7 under Substation 1.
4.3. Project Proposal and Economic Analysis
The common cause of the forced outages of Feeders 2, 4, and 7 was momentary faults along the distribution lines. Hence, it is necessary to continuously supply power to the loads of Feeders 2, 4, and 7.
Option 1 solution is to install a redundant distribution line with a single-outage (N-1) contingency of the subject lines. Since the specifications of the currently installed feeder lines are not provided, a 13.8 kV feeder line must be employed in the conductors and poles of typical sizes and ratings. The conductor and pole are assumed to be an ACSR, #336.4MCM 26/7 STD, and a 40-foot Bare, 3.0 mm, 86 Micron with a load capacity of 500 kg. The costs of the distribution line components were estimated from the National Electrification Administration (NEA) memorandum on 24 May 2022, using the Equipment and Materials (EM) Price Index 2022 [
12]. A span of 100 m between the 13.8 kV distribution poles was assumed to determine the required number of poles. Feeders 2 and 4 are 1000 m long, while Feeder 7 is 2000 m long (
Table 4).
One of the viable options is to install the distribution lines from bare to insulated type of conductor. This does not require new poles but expensive insulated conductors and longer shutdown hours (
Table 5).
Cost–benefit analysis (CBA) was used to select an appropriate project. CBA is used to estimate the cost against the benefit of the proposed projects to determine their feasibility. Two options are considered for the installation of new distribution lines that will serve as redundancy or single outage (N-1) contingency for the outage of the existing lines of Feeders 2, 4, and 7. Other options include insulating the existing distribution. One of the variables to consider is the power to the loads of Feeders 2, 4, and 7. However, the data on a specific load of each feeder is not available. Therefore, the load distribution of feeders is conducted to approximate the energy delivered in each feeder. Assumptions for the calculation of NPV and CBA are summarized in
Table 6.
The estimated cost of production loss is the monetary loss to the customers of FAB during a power interruption. According to the study conducted by the Philippine Electricity Market Corporation, Singapore’s WESM price cap is equal to 90% of the value of the loss load. Assuming Singapore’s price cap and the Philippine WESM Price cap of 6245 PHP/MWhr or 6.245 PHP/Kwhr, the value of the loss load is approximated at 6.94 Php/kWhr.
Table 7 shows the average hours of forced outage and
Table 8 shows the combined forced and other outages in the sensitivity analysis.
Option 1 has a positive NPV and a BCR greater than 1 if the total outage duration is more than 7 h. BCR was 2.04 for all outage duration for forced and other outages (
Table 9).
Option 2 shows that BCR is 2.30 for forced and other outages. The results of the CBA shows that option 2 is more feasible than option 1 since its BCR is 2.30 in Case 4 (
Table 10).
5. Conclusions
An effective method was developed for the reliability assessment of the distribution system in FAB. Reliability assessment software was developed to automatically calculate SAIFI, SAIDI, CAIFI, and CAIDI. Their values, calculated manually and by the software, showed a linear relationship. The software also shortened the average time to 0.58 min, compared with 3.60 min of manual computation. The paired sample t-test result showed that the difference in computation time between the paired groups of data was statistically significant.
For reliability assessment, the software shows its effectiveness in calculating the monthly and annual values of SAIFI, SAIDI, CAIFI, and CAIDI. We computed the 3-year annual and monthly averages of reliability indices. The 3-year monthly averages of reliability indices showed that 17, 3, 10, and 4 months among 36 months presented lower SAIFI, SAIDI, CAIFI, and CAIDI than the averages. By studying the forced and other outages, the low-performing sections of the distribution system of FAB (Feeders 2, 4, and 7) were determined. After identifying the low-performing sections, two options were proposed to alleviate and reduce power interruptions. The forced outages of Feeders 2, 4, and 7 were caused by sustained and momentary faults along the distribution lines. Hence, it is necessary to allow the continuous power supply to Feeders 2, 4, and 7 and install redundant feeder lines and distribution line installments. Option 1 requires a cost of PHP 4,524,000.00 while Option 2 requires PHP 3,588,000.00.
CBA was used to determine the most feasible option. Sensitivity analysis was used in the CBA by setting the average annual outage hours of Feeders 2, 4, and 7. The results of the economic analysis proved that Option 2 is more feasible than Option 1 since Option 2 results in higher BCR in all cases. Both options have positive NPVs greater than 1. Option 2 requires the installment of insulated conductors to supply reliable power to the low-performing sections of the distribution system.
Author Contributions
Conceptualization, J.R.C. and R.V.M.S.; methodology, J.R.C.; software, J.R.C.; validation, R.V.M.S.; formal analysis, J.R.C.; investigation, J.R.C.; resources, J.R.C.; data curation, J.R.C.; writing—original draft preparation, J.R.C. and R.V.M.S.; writing—review and editing, J.R.C. and R.V.M.S.; visualization, J.R.C.; supervision, R.V.M.S.; project administration, J.R.C.; funding acquisition, none. All authors have read and agreed to the published version of the manuscript.
Funding
This research received no external funding.
Institutional Review Board Statement
Not applicable.
Informed Consent Statement
Not applicable.
Data Availability Statement
Data is unavailable due to privacy.
Acknowledgments
I would like to offer all the praise and glory to the Almighty God who has bestowed his guidance on me to accomplish this thesis. I would like to acknowledge my adviser and research partner, Engr. Ronald Vincent M. Santiago, who has given relentlessly his technical and non-technical knowledge and advice on this thesis from the start to the end. I would like to also extend my gratitude to my colleagues in the National Transmission Corporation, especially the Utilities Management Department, for supporting and giving me the necessary data and information that I needed for my study. Lastly, I could not have done it without the untiring support of my family who were always there to help me throughout the journey of my study.
Conflicts of Interest
Author Jomel R. Cristobal was employed by the company National Transmission Corporation. The remaining authors declare that the research was conducted in the absence of any commercial or financial relationships that could be construed as a potential conflict of interest.
References
- Definition of “Adequate Level of Reliability; North American Electric Reliability Corporation (NERC): Washington, DC, USA, 2007.
- Philippine Distribution Code, 2017th ed.; Distribution Management Committee: Metro Manila, Philippines, 2017; p. 31.
- Billinton, R.; Allan, R.N. Reliability Evaluation of Power Systems, 2nd ed.; Springer: Berlin/Heidelberg, Germany, 1996. [Google Scholar]
- Tien, D.V.; Gono, R.; Leonomicz, Z. Reliability Evaluation of the Distribution Systems Using Analytical Technique. In Proceedings of the 2018 IEEE International Conference on Environment and Electrical Engineering and 2018 IEEE Industrial and Commercial Power Systems Europe (EEEIC/I&CPS Europe), Palermo, Italy, 12–15 July 2018. [Google Scholar]
- Zhang, T.; Wang, C.; Luo, F.; Yao, L. Analytical Calculation Method of Reliability Sensitivity Indexes for Distribution Systems Based on Fault Incidence Matrix. J. Mod. Power Syst. Clean Energy 2020, 8, 325–333. [Google Scholar] [CrossRef]
- Sekhar, P.C.; Deshpande, R.A.; Sankar, V. Evaluation and Improvement of Reliability Indices of Electrical Power Distribution System. In Proceedings of the 2016 National Power Systems Conference (NPSC), Bhubaneswar, India, 19–21 December 2016. [Google Scholar]
- Jin, X.; Song, Y.; Yang, W.; Lv, Y.; Li, Z. Research on planning strategy to achieve high reliability for urban distribution systems. In Proceedings of the 2019 IEEE 3rd International Electrical and Energy Conference (CIEEC), Beijing, China, 7–9 September 2019. [Google Scholar]
- Moloi, K.; Abe, B.T.; Nnachi, A.F.; Jordan, J.A. Root Cause Analysis and Performance Enhancement for Power System Network: A Case Study. In Proceedings of the 2019 IEEE AFRICON, Accra, Ghana, 25–27 September 2019. [Google Scholar]
- Liu, W.; Wang, Y.; Xue, J.; Sha, Z. Study on Distribution Network Planning Method Based on Reliability of Cost-Benefit Analysis. In Proceedings of the 2018 China International Conference on Electricity Distribution (CICED), Tianjin, China, 17–19 September 2018. [Google Scholar]
- Puri, K.R.; Subba, A.B.; Pelden, K.; Chhetri, R. Reliability Assessment of Distribution System through Cost Analysis. Int. J. Sci. Res. Eng. Dev. 2020, 3, 560–565. [Google Scholar]
- IEEE Standard 1366-2012; IEEE Guide for Electric Power Distribution Reliability Indices. IEEE: New York, NJ, USA, 2021.
- National Electrification Administration (NEA). Memorandum on Equipment and Materials Price Index 2022 (EMPI 2022); Memorandum dated 24 May 2022. Available online: https://www.nea.gov.ph/ao39/component/phocadownload/category/266-2022-memo (accessed on 10 November 2024).
| Disclaimer/Publisher’s Note: The statements, opinions and data contained in all publications are solely those of the individual author(s) and contributor(s) and not of MDPI and/or the editor(s). MDPI and/or the editor(s) disclaim responsibility for any injury to people or property resulting from any ideas, methods, instructions or products referred to in the content. |
© 2025 by the authors. Licensee MDPI, Basel, Switzerland. This article is an open access article distributed under the terms and conditions of the Creative Commons Attribution (CC BY) license (https://creativecommons.org/licenses/by/4.0/).


