Abstract
Greenhouse farming has brought a revolution in agriculture as it provides a climate favorable to crops all year round. Besides securing the production of foods of higher quality, it also extends the growing seasons and protects crops from pests and harsh weather. The greenhouse is centrally controlled by the user due to the technological advancements of devices such as cell phones and a control system of temperature, which is important for the plant. To realize remote real-time automated monitoring of the greenhouse based on the user settings, an Android app was developed in this study.
1. Introduction
Contemporary agricultural automation enables farmers to manage the internal environment of the greenhouse by recording all environmental parameters in a database for future analysis and remotely monitoring the data. Parameters need to be met when growing plants in traditional greenhouses. In greenhouse farming, appropriate temperature conditions need to be maintained with human intervention [1].
Climate variabilities include floods and droughts which hinder plant growth and cause the loss of billions of dollars in crops, especially during El Nio. Rainfall, agricultural productivity, and temperature-vegetation indicators are used for monitoring the drought, but soil moisture has rarely been used [2].
The implementation of the Internet of Things (IoT) enables remote monitoring and analysis of data. Additionally, a mobile application is used to showcase data in short-range wireless connectivity. This application is used to regulate temperature, humidity, light intensity, and soil moisture by collecting information from multiple sensors [3].
This study was carried out to explore the reliability of an application integrated with the remote monitoring of crops and monitored environmental parameters. The mobile application developed in this study was deployed on a mobile operating system.
2. Methodology
The concept of the integration of a mobile application for remote monitoring of crop development was introduced for the testing of the functionality of the mobile application.
2.1. Conceptual Framework
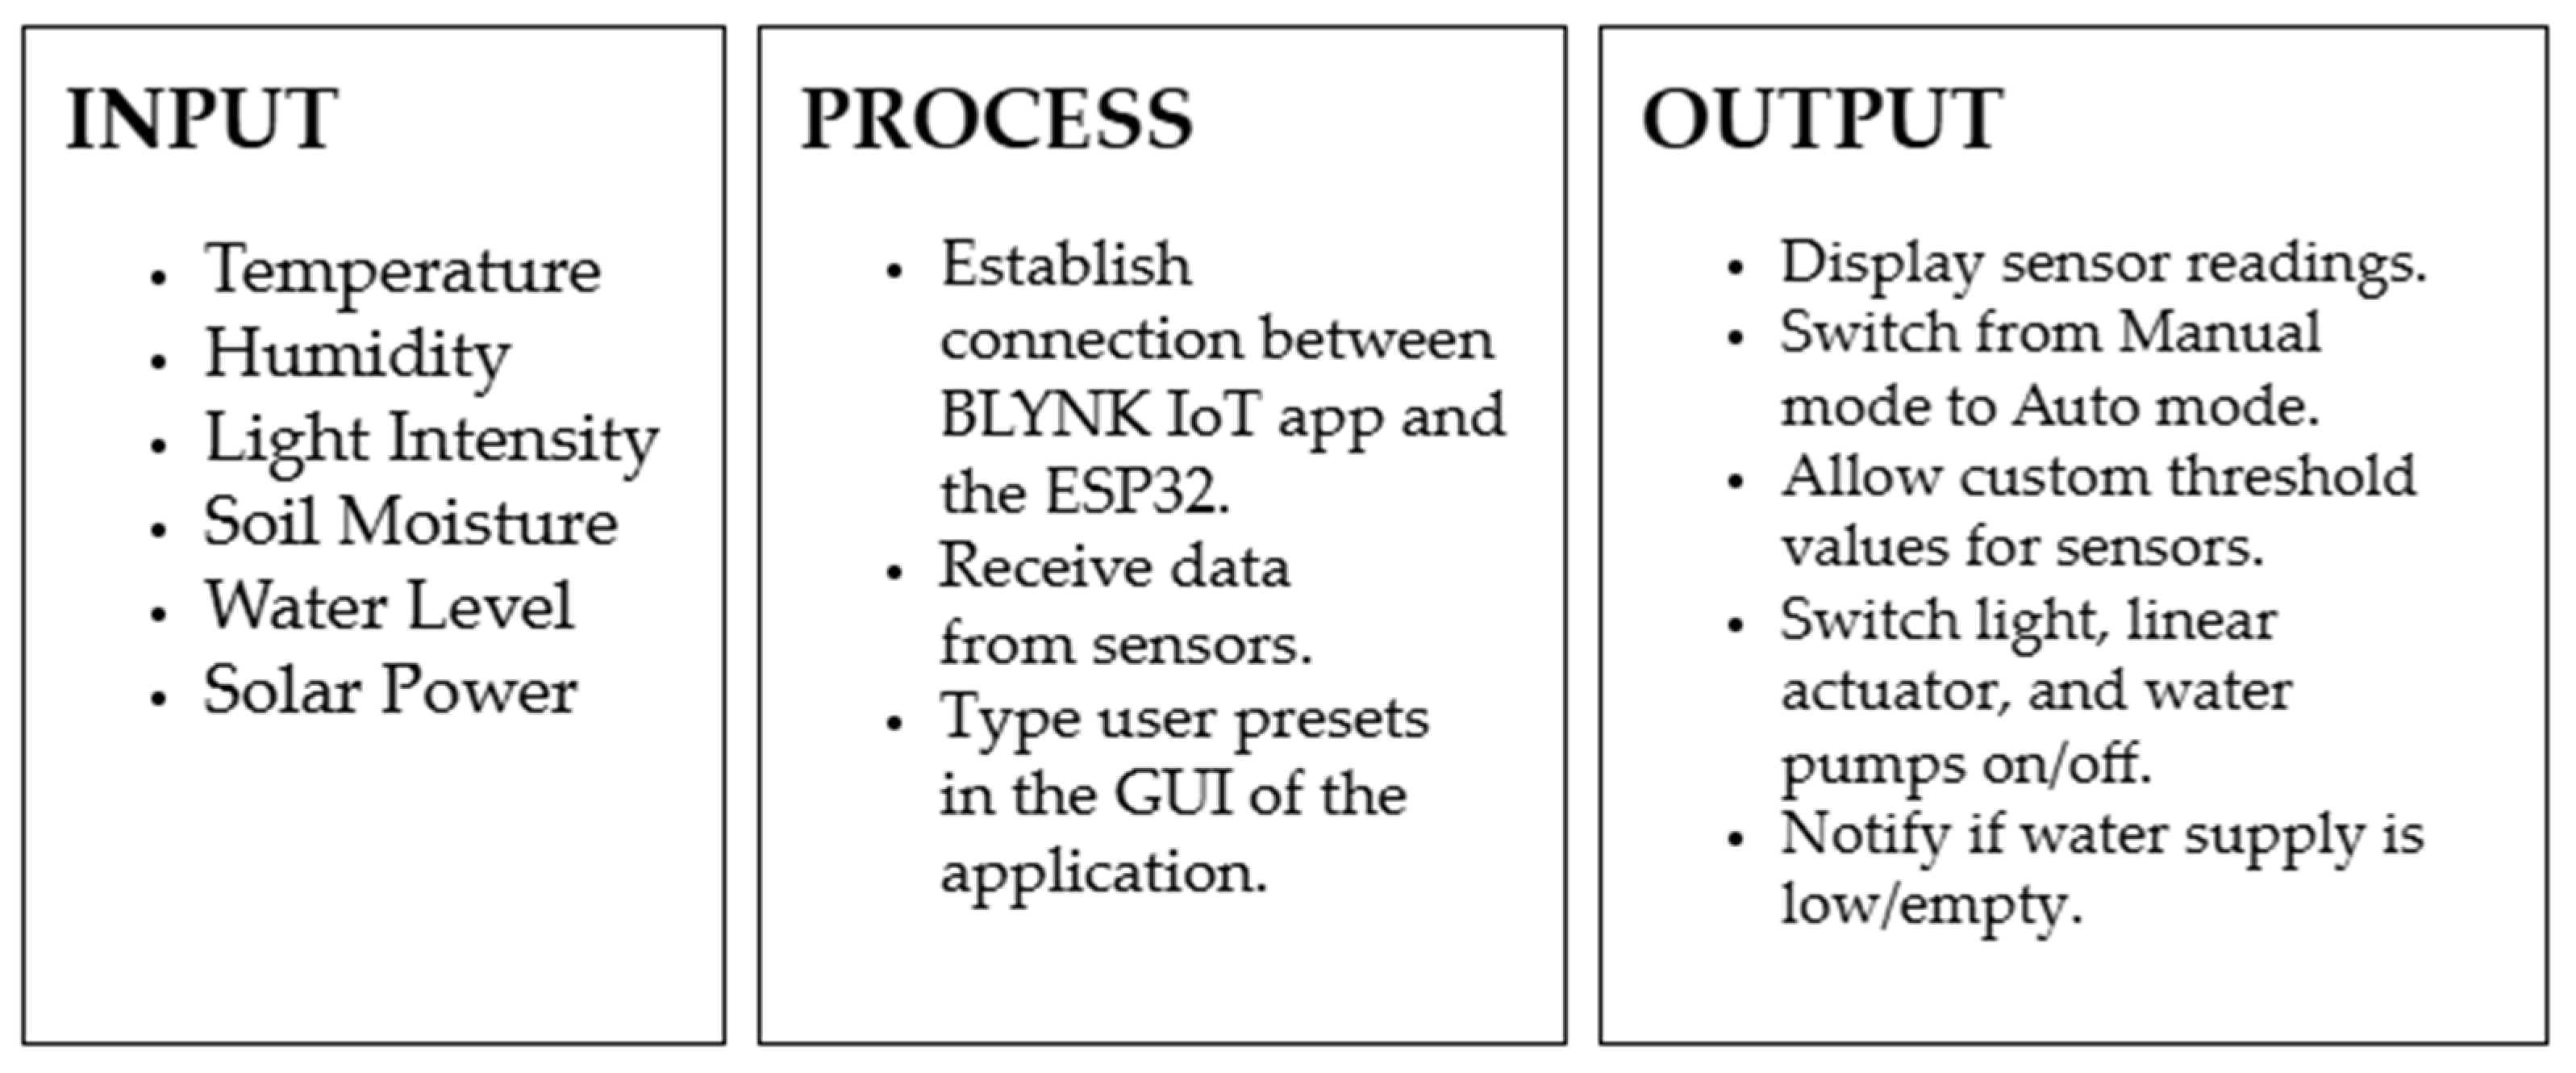
Figure 1 shows the developed autonomous greenhouse roof system that monitors temperature, humidity, light intensity, soil moisture, water level, and solar power. The system sends sensor readings to a mobile app for remote monitoring and control. The mobile application allows for the manipulation of components according to the threshold values. The system monitors water levels, and alerts users when the water level is low or the water tank is empty. The system is powered by solar power and battery backup.
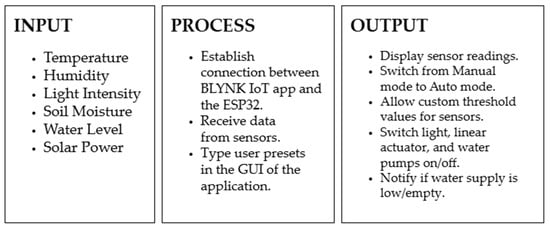
Figure 1.
Conceptual framework of this study.
2.2. Process Flow
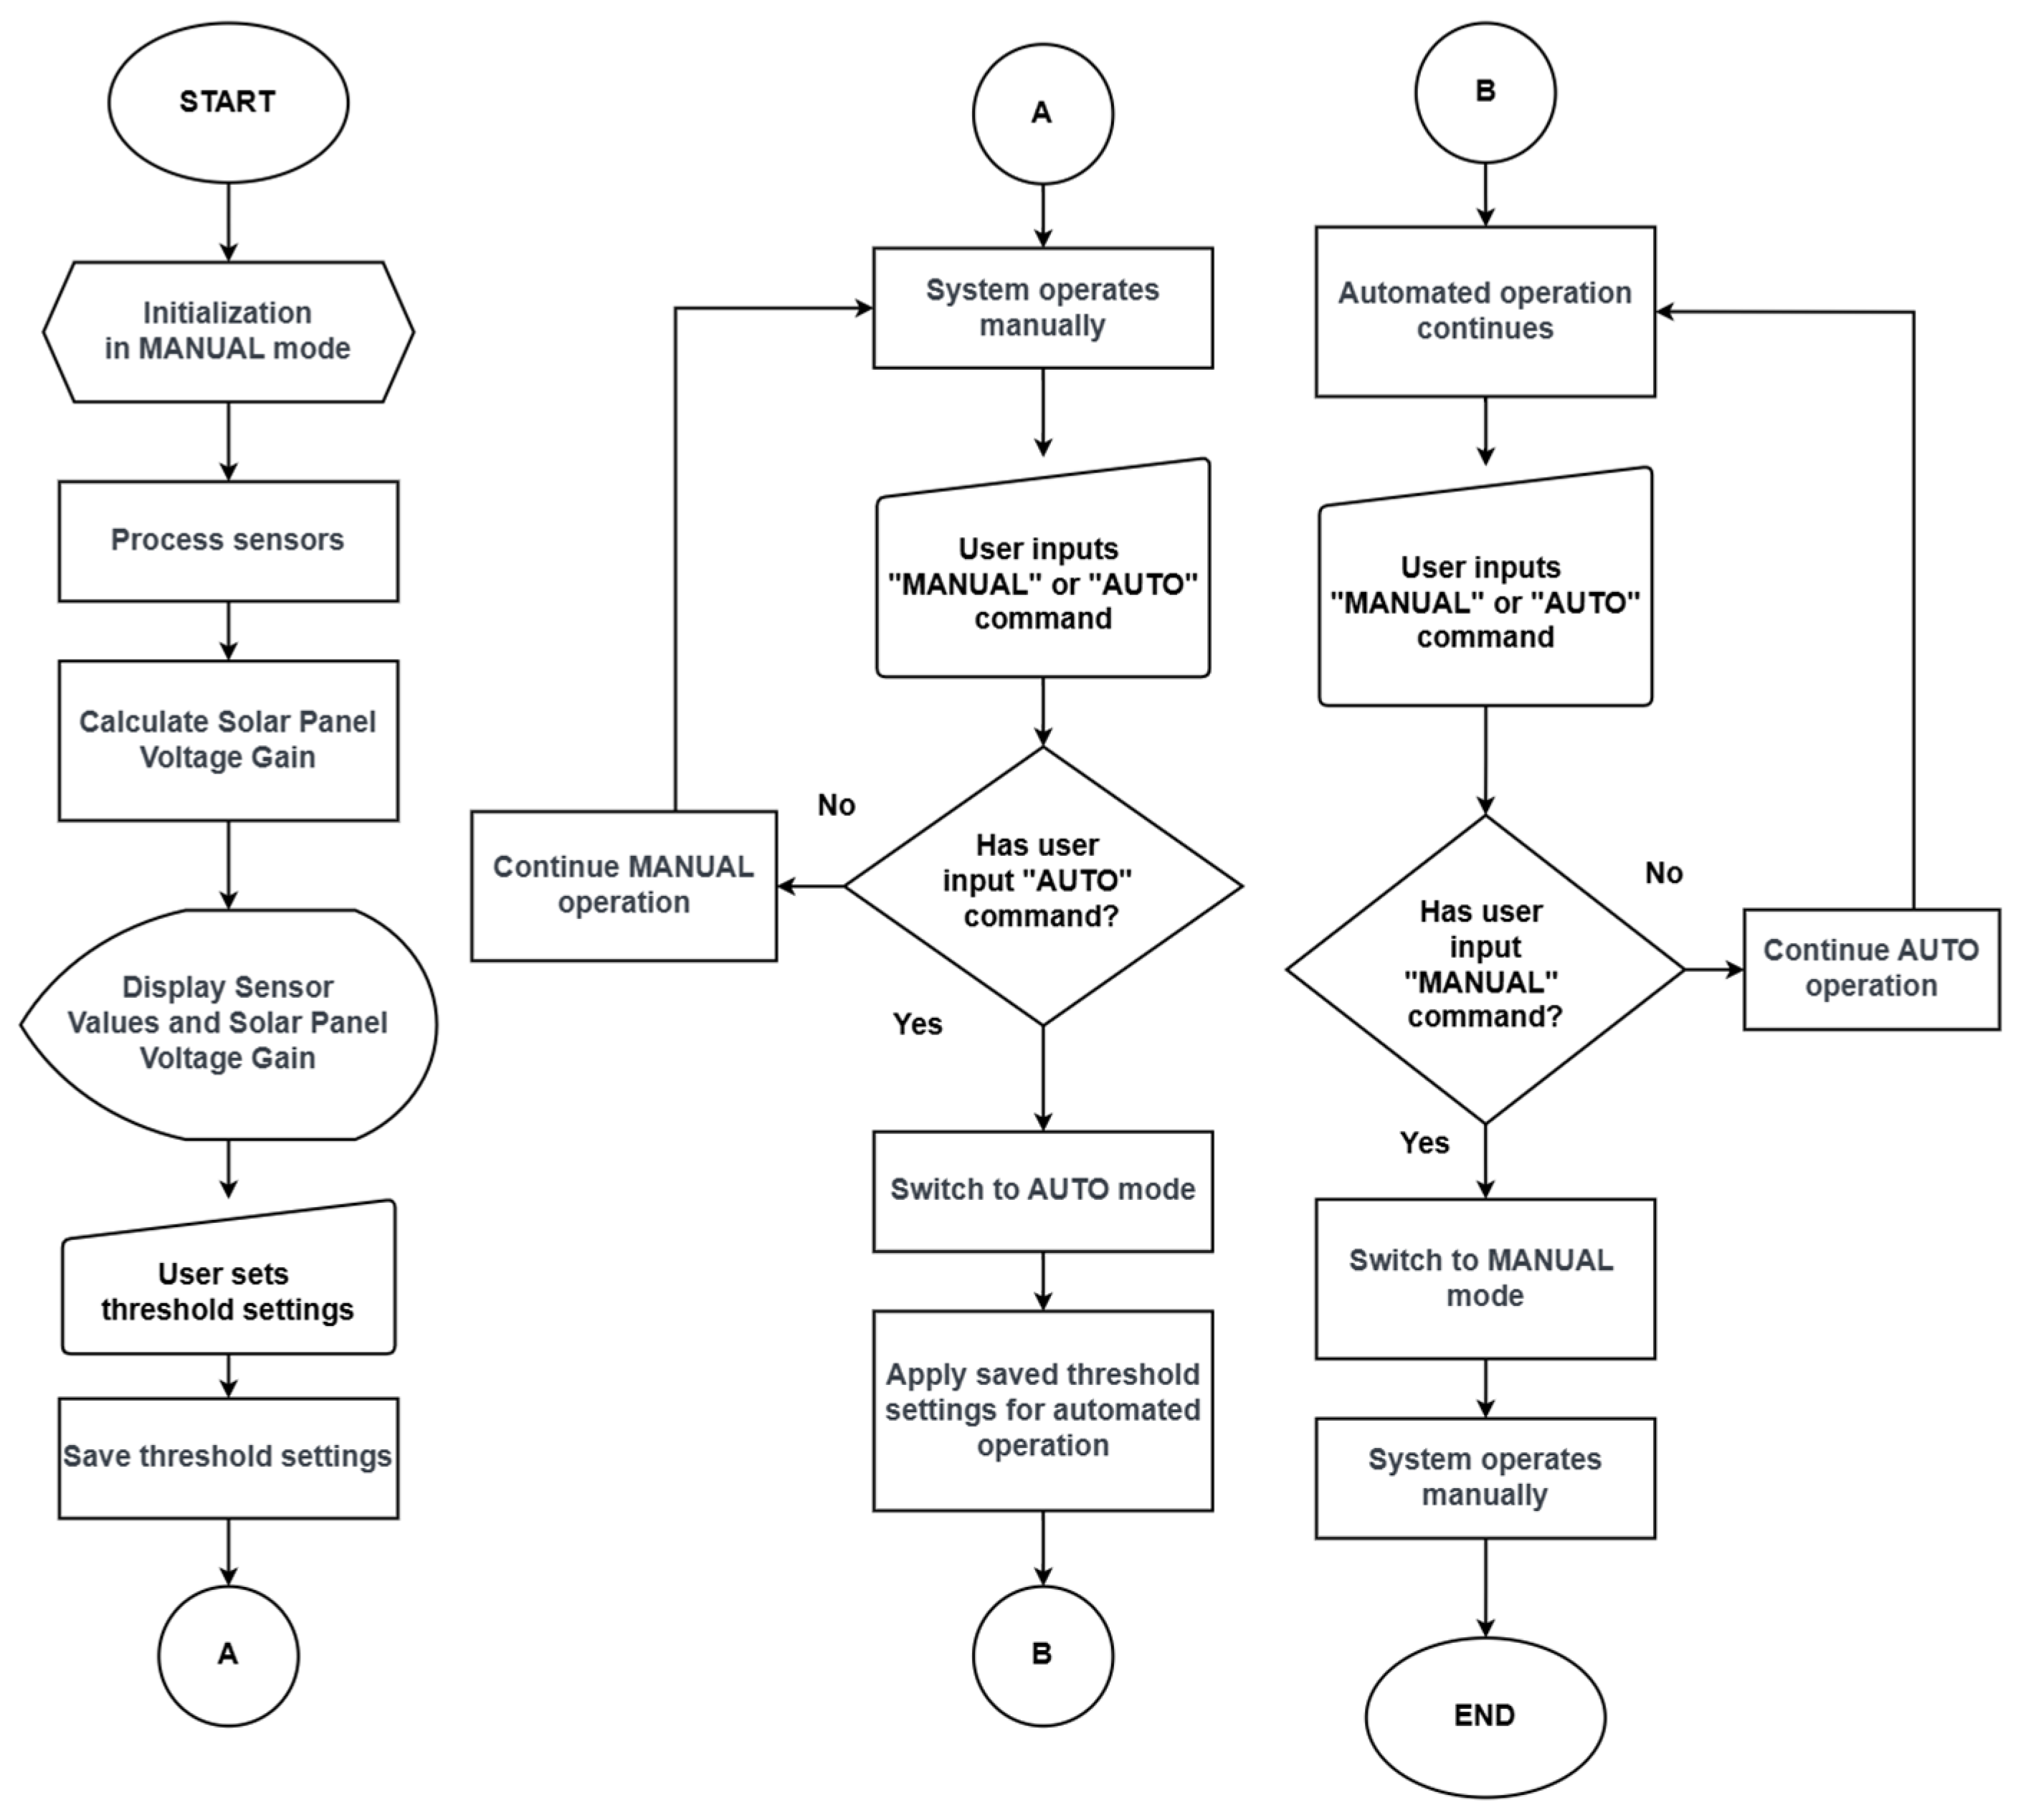
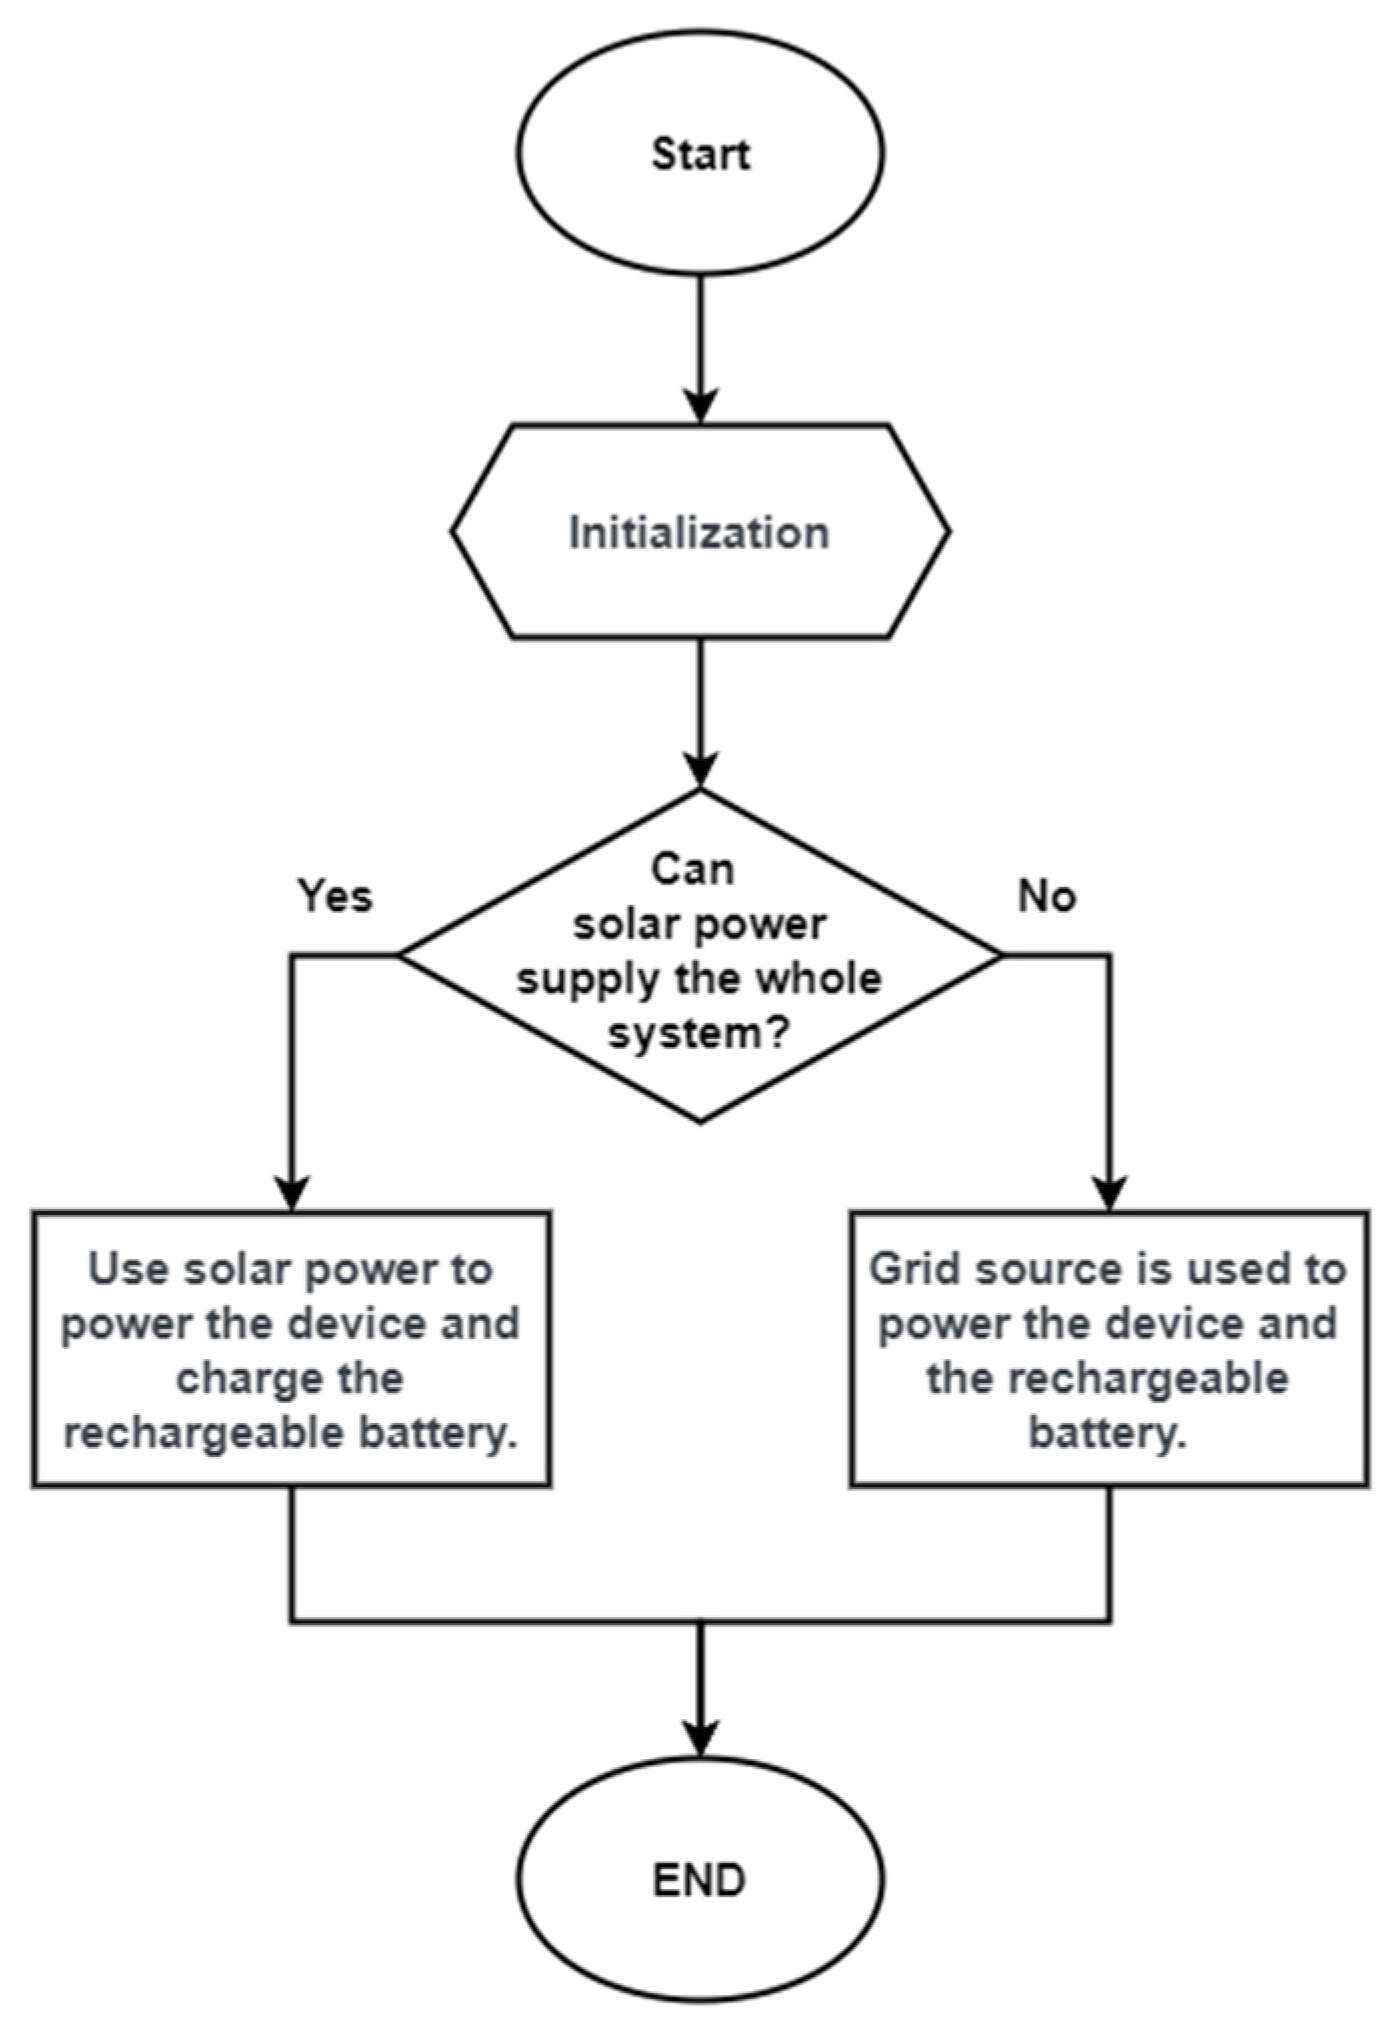
Figure 2 demonstrates the operation mode. Sensor data are displayed on the OLED screen. Users can choose the automatic or manual mode based on threshold levels and strict instructions.
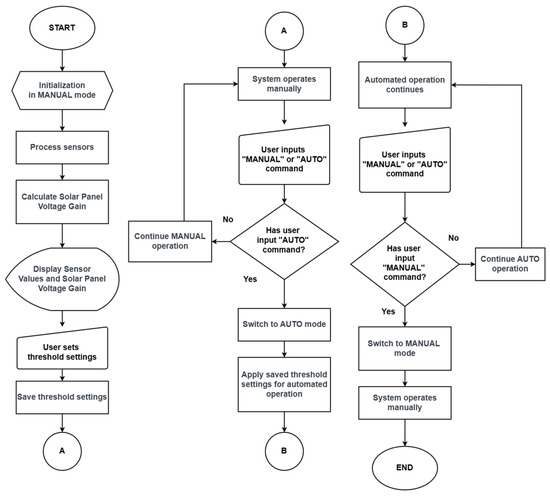
Figure 2.
Application process.
The system is powered by its rechargeable battery during the day with the solar panel. If the battery power is sufficient, a grid power source is used (Figure 3).
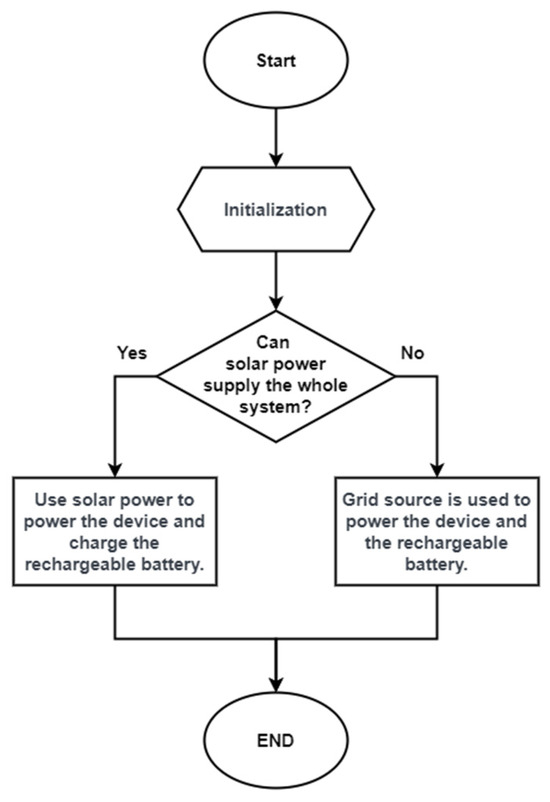
Figure 3.
Solar power and battery charging during the day.
The battery is used at night (Figure 4).
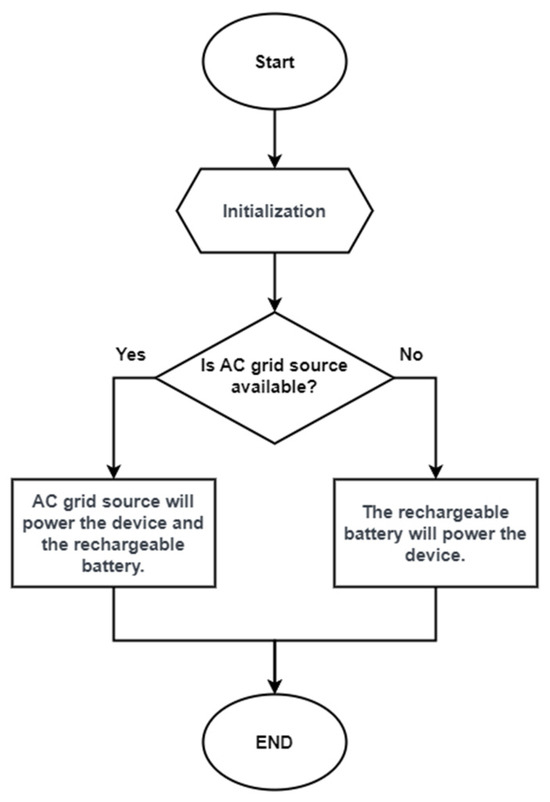
Figure 4.
Solar power and battery charge during the night.
2.3. Experimental Set-Up
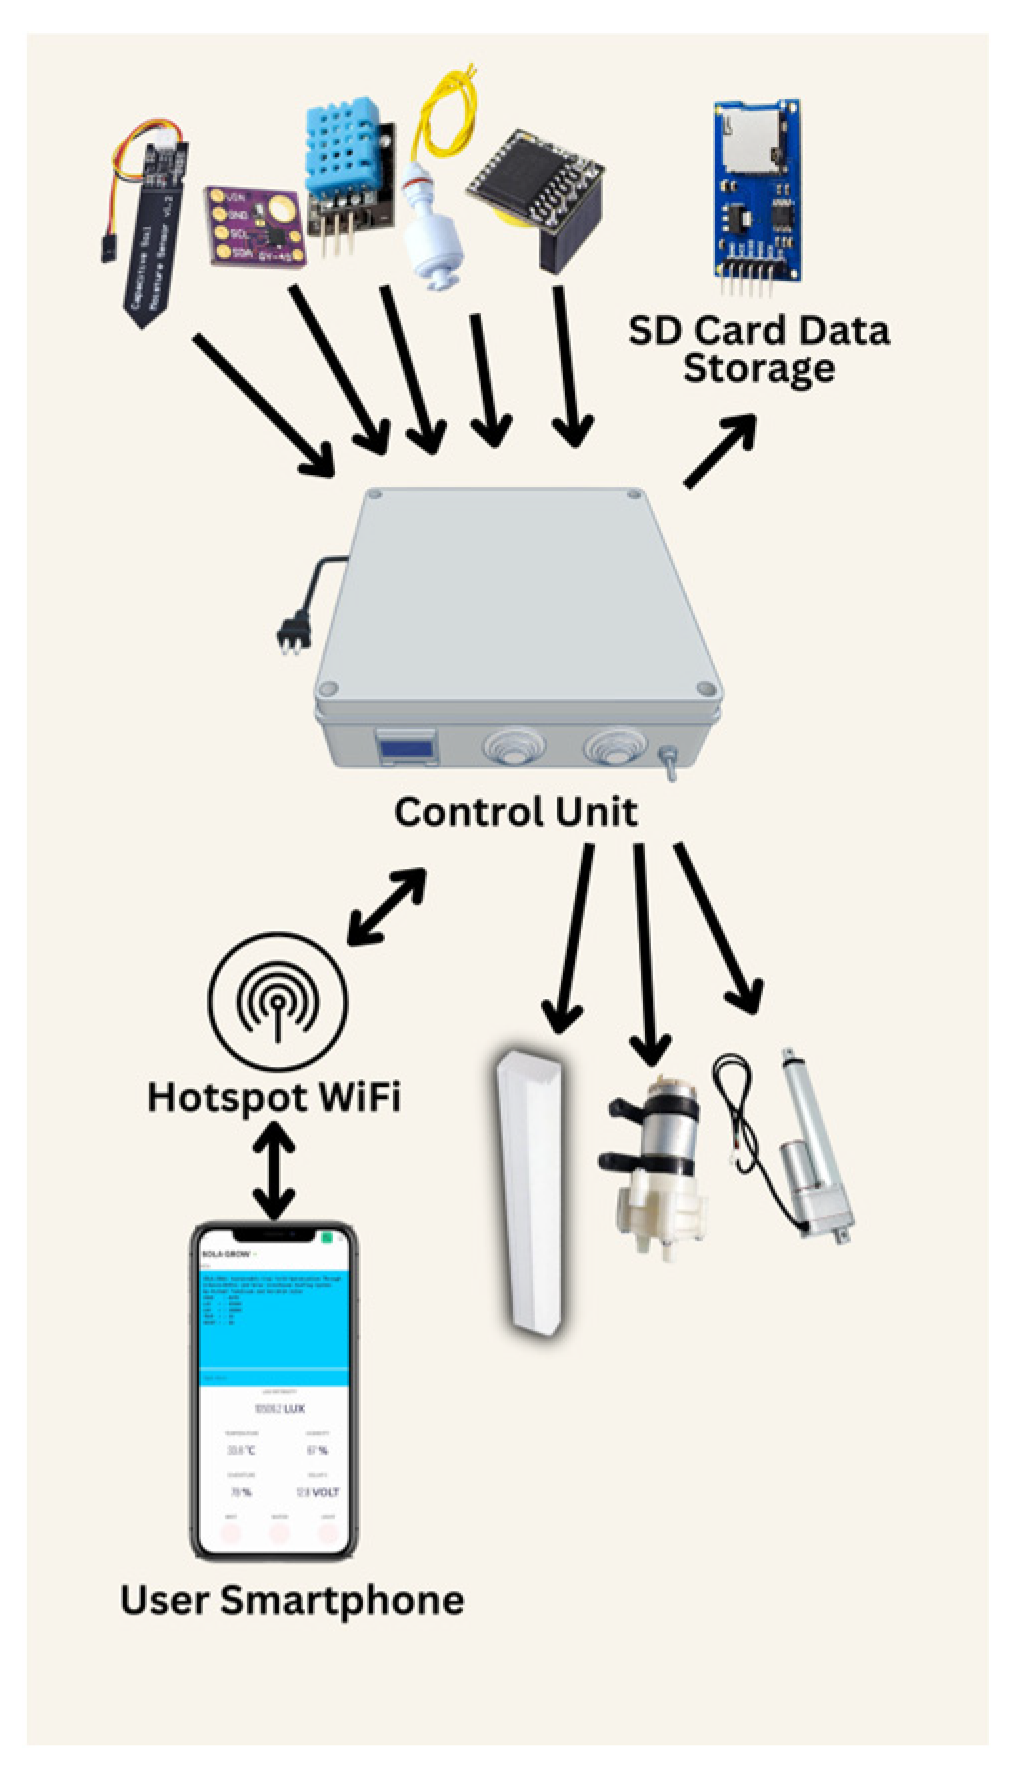
The Blynk mobile application is connected to environmental sensors and a control device for plant growth. The device includes sensors, networking components, hotspot Wi-Fi, and physical components including a light tube, water pumps, and actuators. Sensor data are recorded on a micro-SD card (Figure 5).
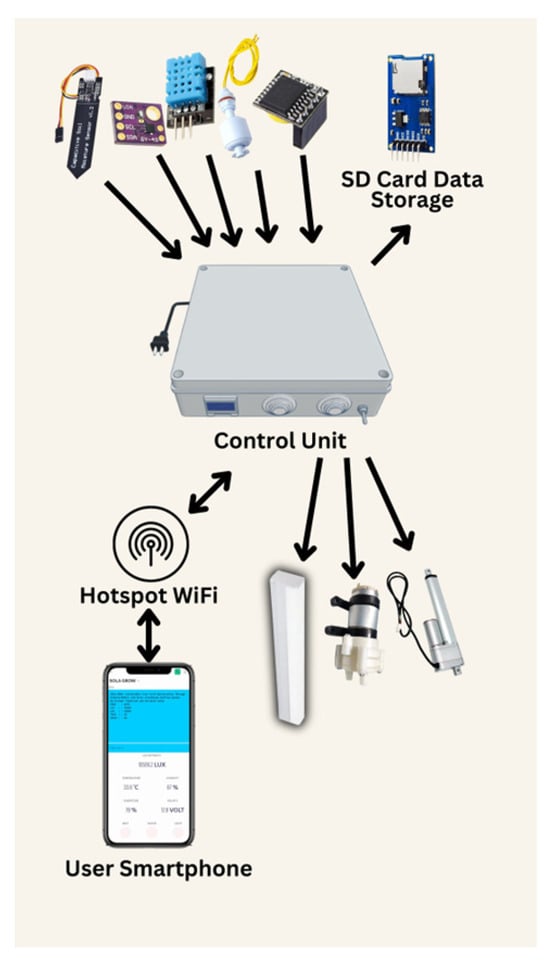
Figure 5.
Experimental set-up.
3. Results and Discussion
The automated greenhouse system sends sensor data. Its conceptual framework, block diagram, flowcharts, components, equipment, process flow, and data analysis are as follows.
3.1. Actual Experimental Set-Up
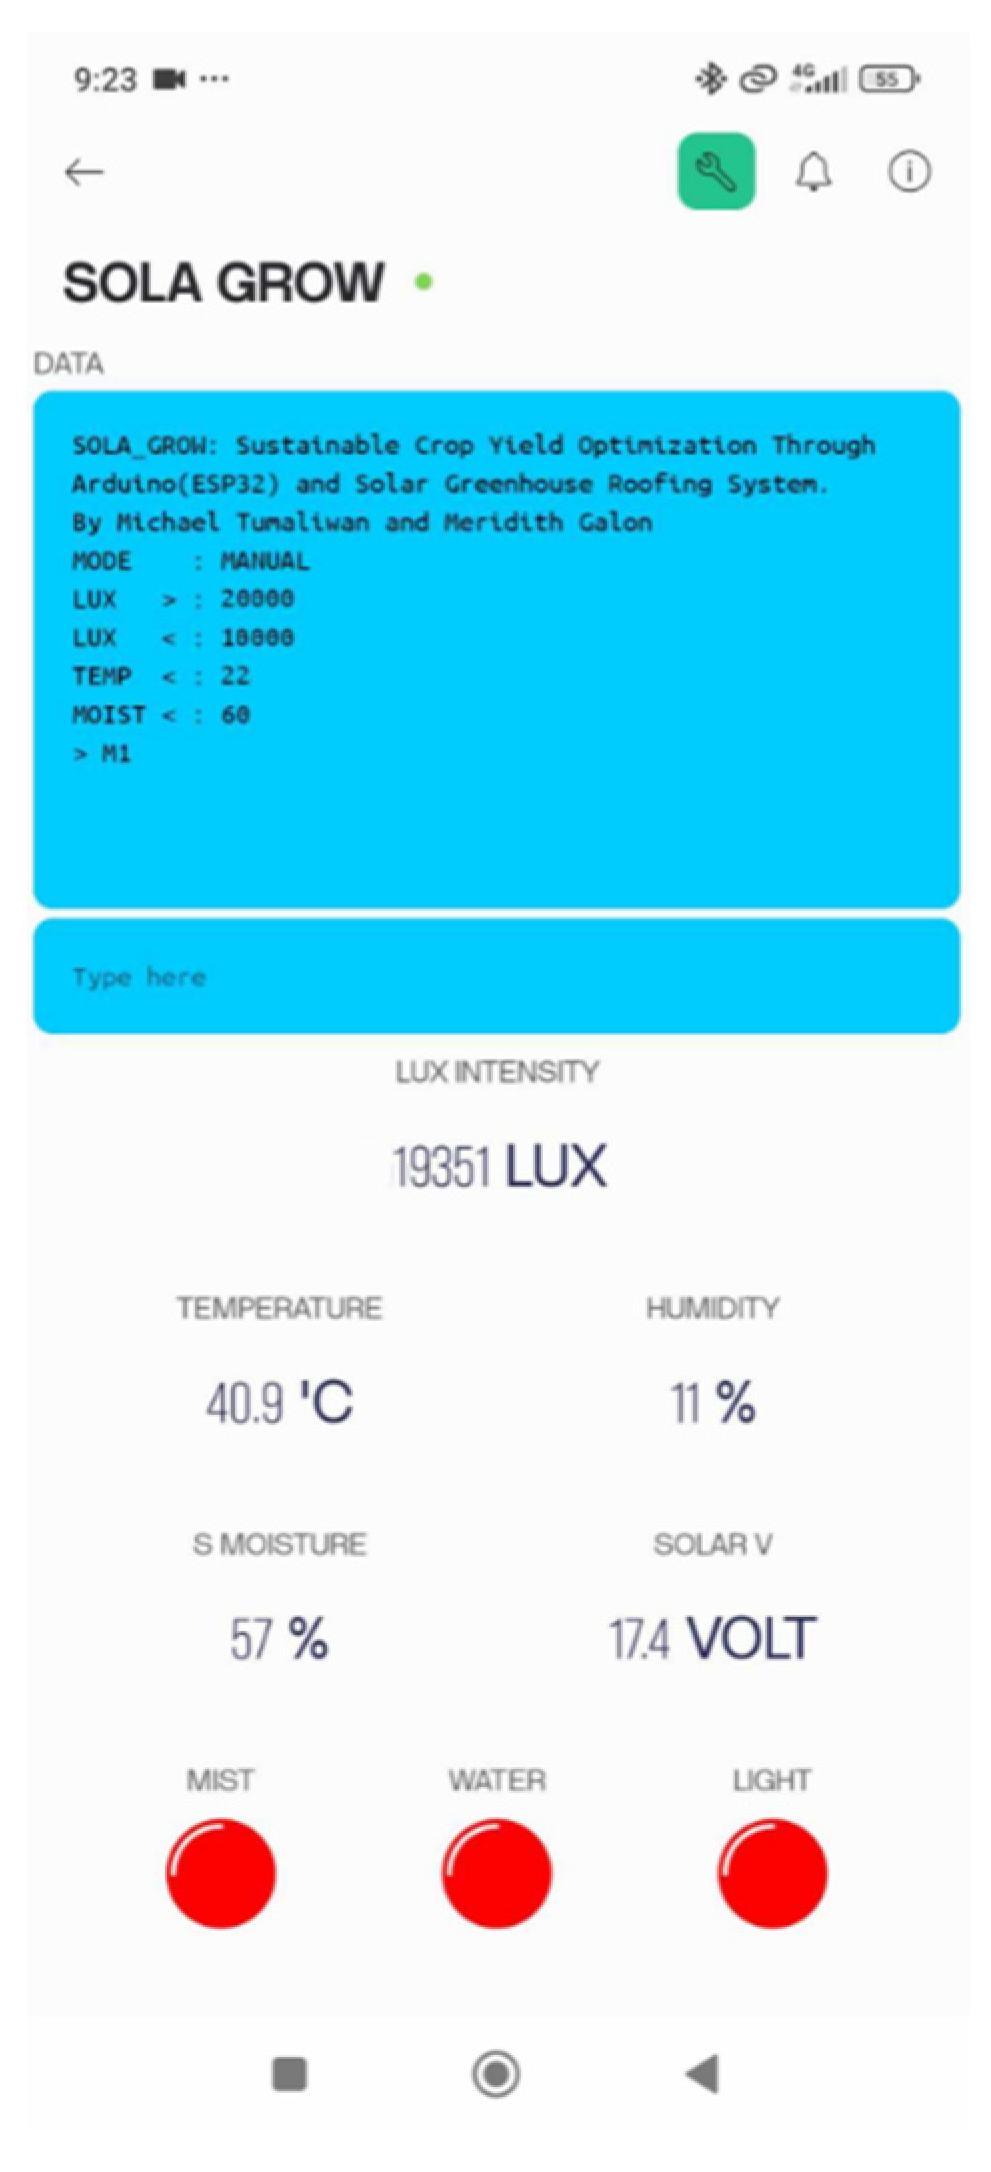
The Blynk mobile application displays control unit status and sensor threshold values through a command console. Light intensity, temperature, and soil moisture can be set to determine the optimal conditions for plant growth. The application also shows the operation status. The appropriate setting required to grow vegetables is adjustable. Light intensity is set to be between 10,000 and 10,000 LUX. Temperature is set to 22 °C, and the soil moisture is set to be a minimum of 60% [4] (Figure 6).
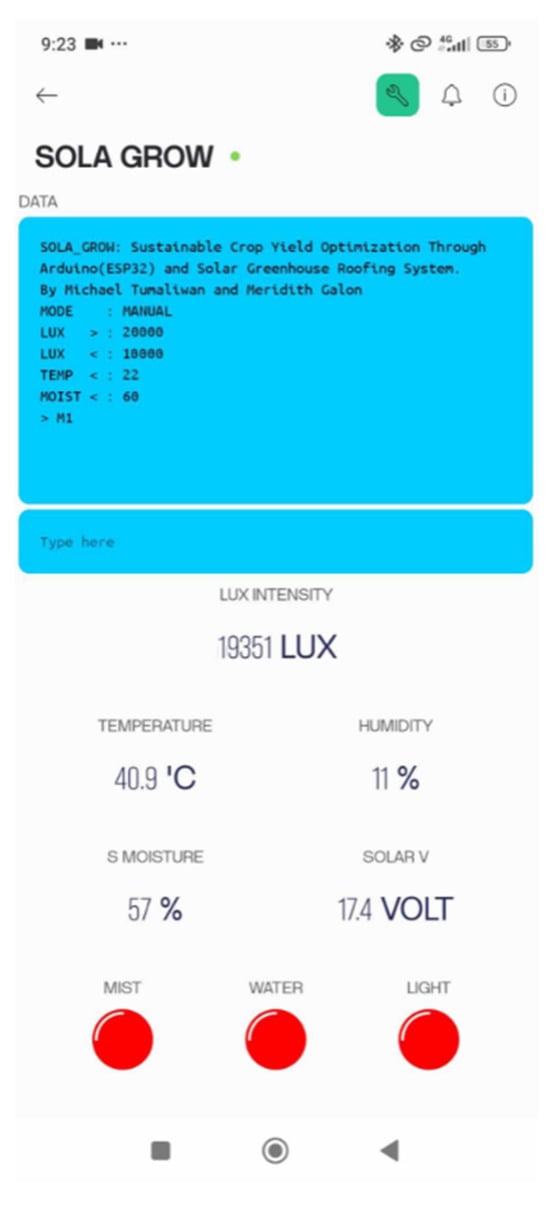
Figure 6.
Mobile application.
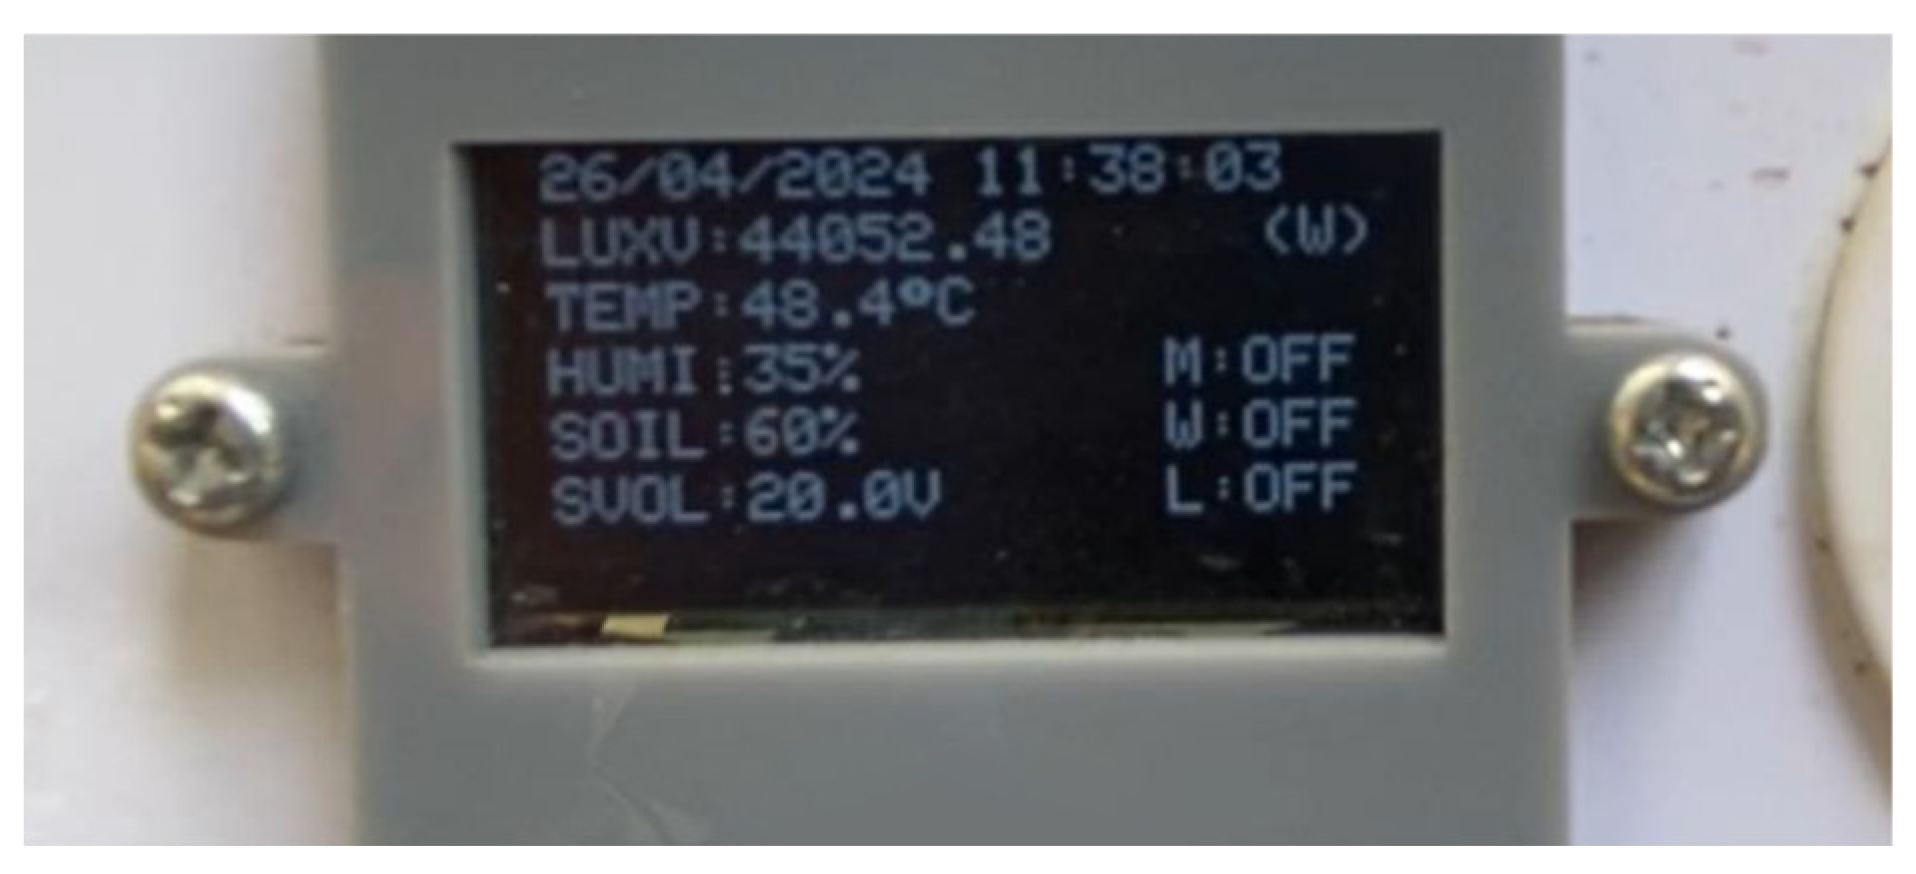
The mobile application displays sensor data and component status on the OLED panel connected to the control unit, providing real-time information on light intensity, temperature, humidity, soil moisture, and solar voltage (Figure 7).

Figure 7.
Real-time sensor data and control unit status.
3.2. Sensor Calibration
We tested the devices to evaluate the accuracy of each sensor connected to them. Table 1 shows the calibration result of the DTH11 sensor, which presents an error of 38% on the first trial. In trial 6, the data was stabilized, and the error decreased to 0.69%.

Table 1.
DTH11 temperature vs. air quality monitor temperature.
DTH11 humidity readings were compared with those of the reference device, showing fluctuations in errors from Trial 1 to 10, stabilizing at a level below 5% at Trial 10 (Table 2).
Table 2.
DTH11 humidity vs. air quality monitor humidity.
Table 3 shows the readings of the TA8120 Lux Meter to calibrate the MAX4409 sensor, with initial inaccuracies reaching 32.5% and a final inaccuracy of 2.06%.
Table 3.
MAX44009 ambient light sensor calibration.
3.3. Manual Mode Testing Through Blynk Application
Blynk application was evaluated for accuracy as shown in Table 4, Table 5, Table 6, Table 7, Table 8 and Table 9.
Table 4.
Remote testing of light intensity threshold command (‘LUX>= or LUX<=’).
Table 5.
Remote testing of temperature threshold command (‘TEMP<=’).
Table 6.
Remote testing of soil moisture threshold command (‘MOIST<=’).
Table 7.
Remote testing of linear actuator (OPEN or CLOSE command).
Table 8.
Remote testing of water pumps (ON or OFF command).
Table 9.
Remote testing of LED tube light (ON or OFF command).
3.4. Sample Environmental Data
The environmental sensor data from the greenhouse is shown in Table 10. It includes readings from 20 March 2024, between 12:18 A.M. and 11:12 P.M. The system, in autonomous mode, maintained thresholds of 45,000–20,000 LUX for light intensity, 35 °C for temperature, and 60% for soil moisture. Data was recorded every 1 h and 10 min.
Table 10.
Sample environmental sensor data—Week One—20 March 2024.
3.5. Gathered Environment Data from Sensors Within the Greenhouse
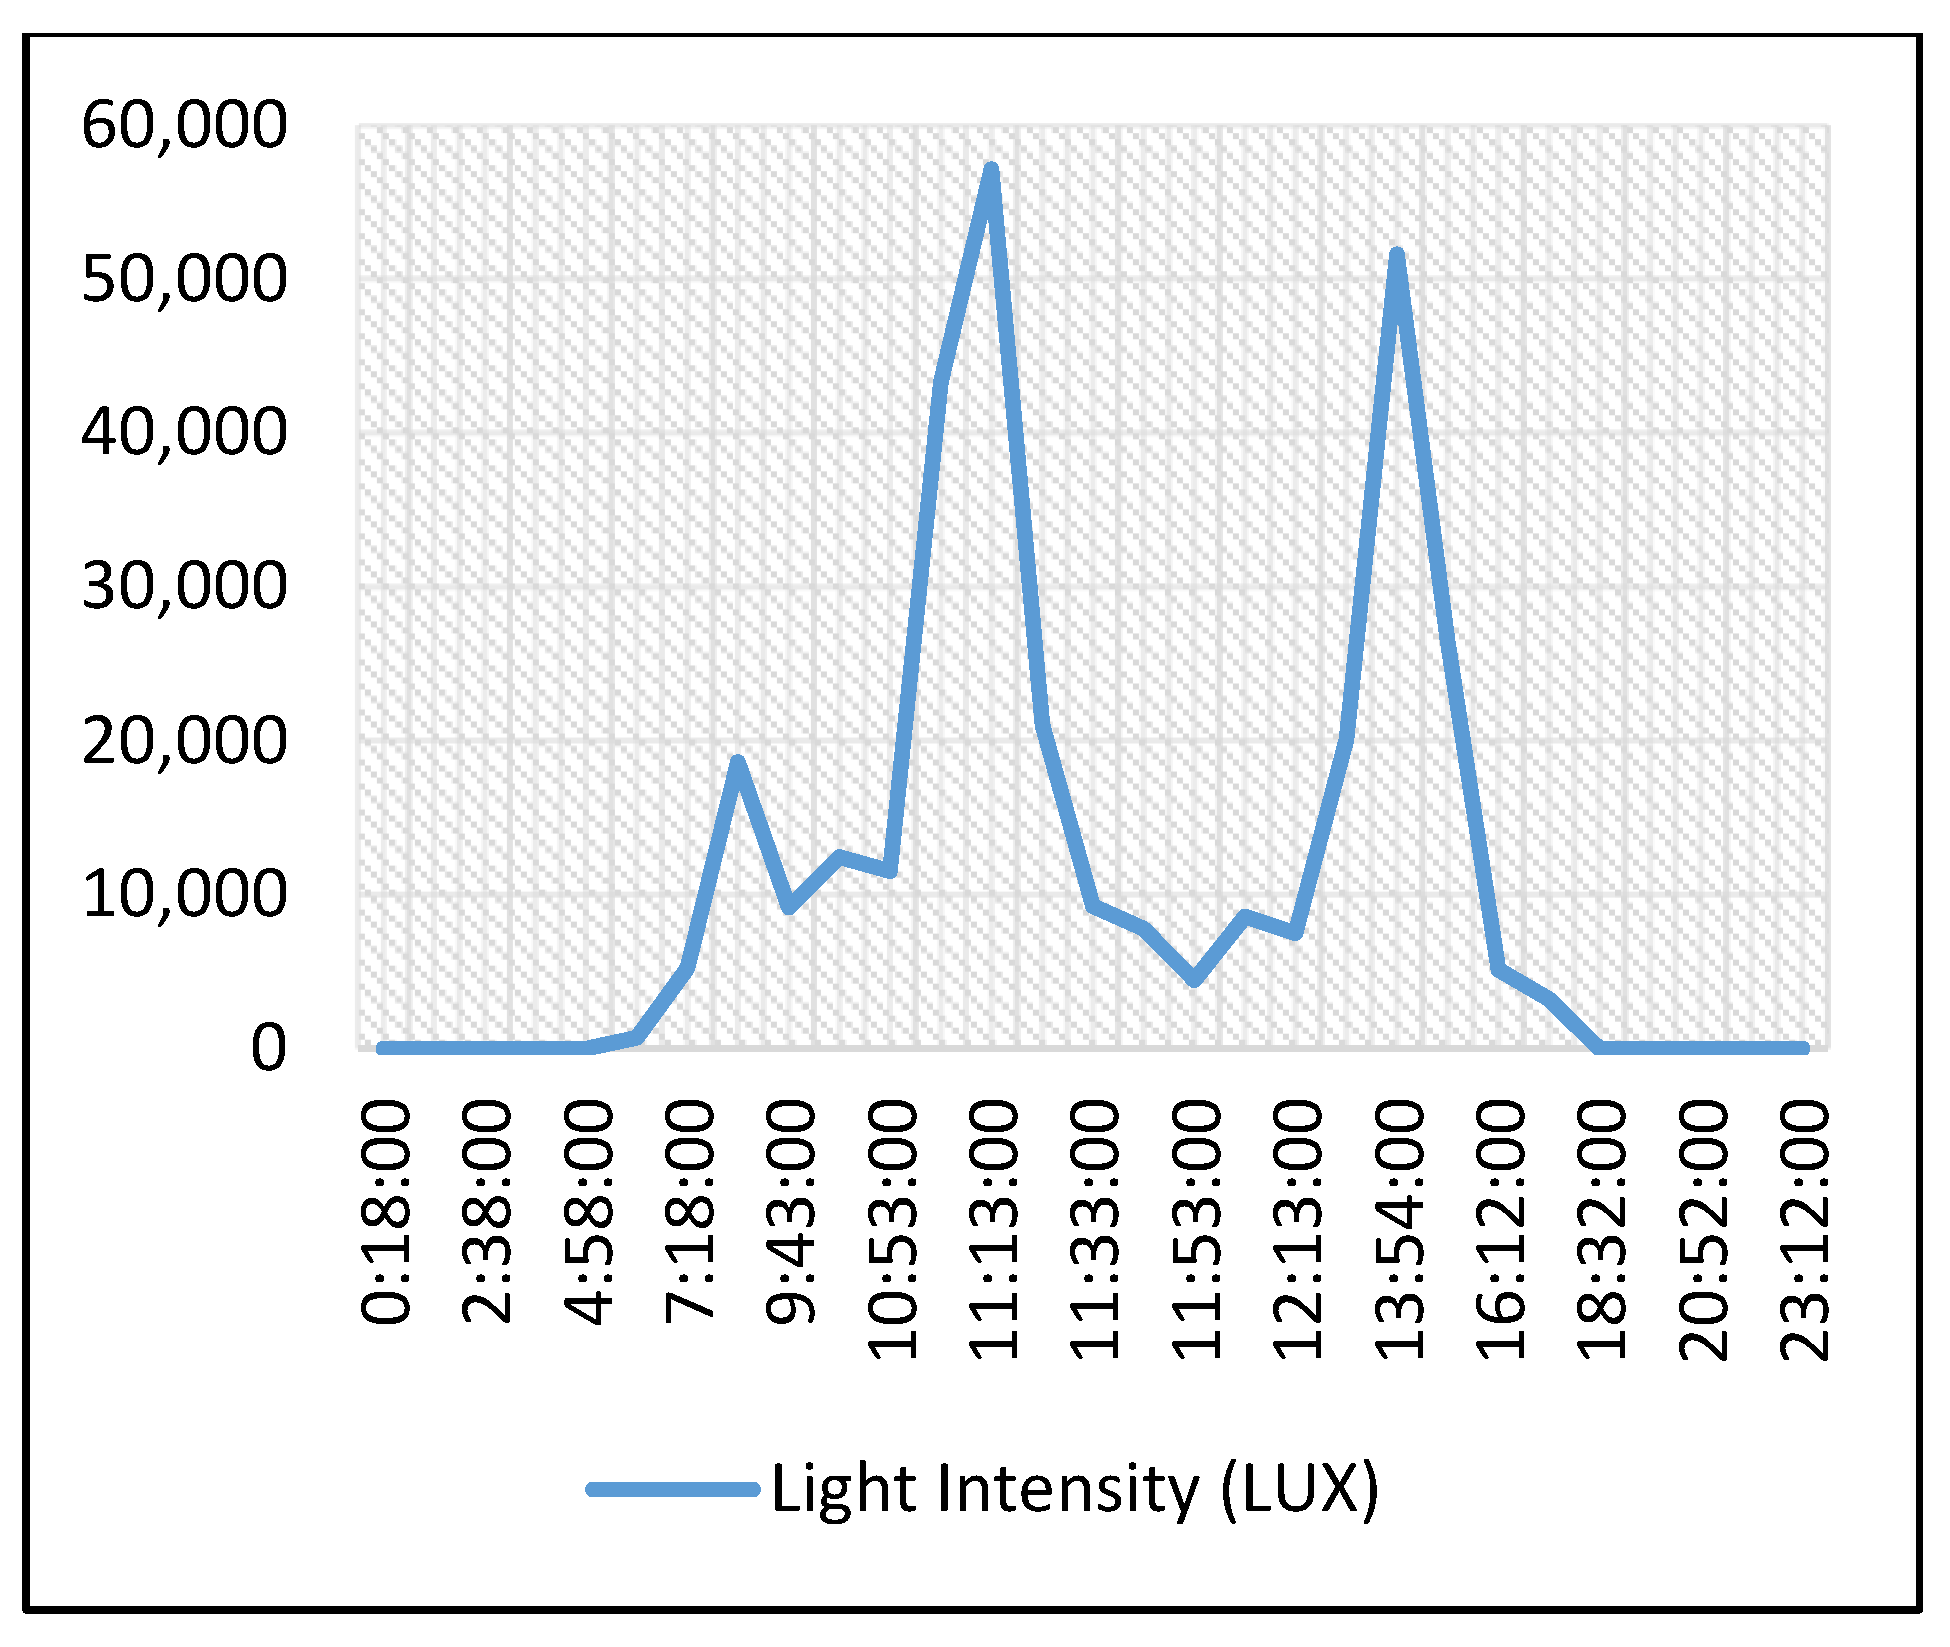
Figure 8 illustrates the variation in light intensity for the first week starting 20 March 2024. According to the graph, the light intensity peaks at 57,139.2 LUX at 11:13 A.M. Such a high value was caused by the sun, indicating that the roof system was positioned at 45° due to the intense heat. Its position was not adjusted to its original angle. In the night, the lux readings gradually decreased.
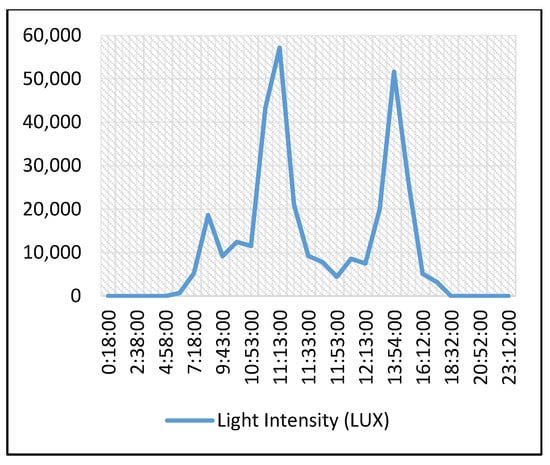
Figure 8.
Light intensity from 20 March 2024, using time plot series.
Figure 9 shows temperature and humidity from 20 March 2024, between 12:18 A.M. and 11:12 P.M. The temperature peaked at 43.0 °C at 9:43 A.M. and dropped to 25.8 °C at 4:58 A.M. Humidity started at 88% and decreased with the operation of the water pump, generally remaining below the maximum threshold.
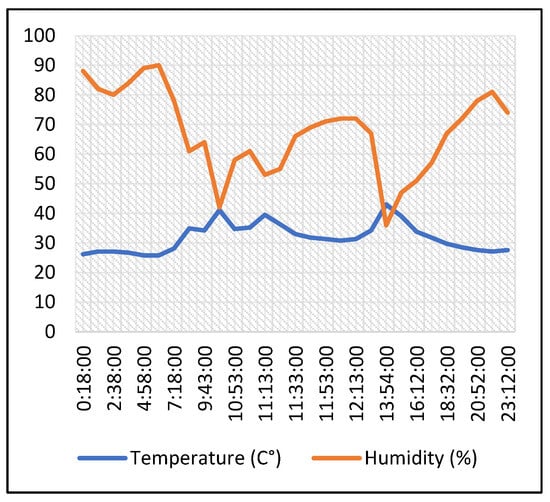
Figure 9.
Temperature and humidity data of 20 March 2024.
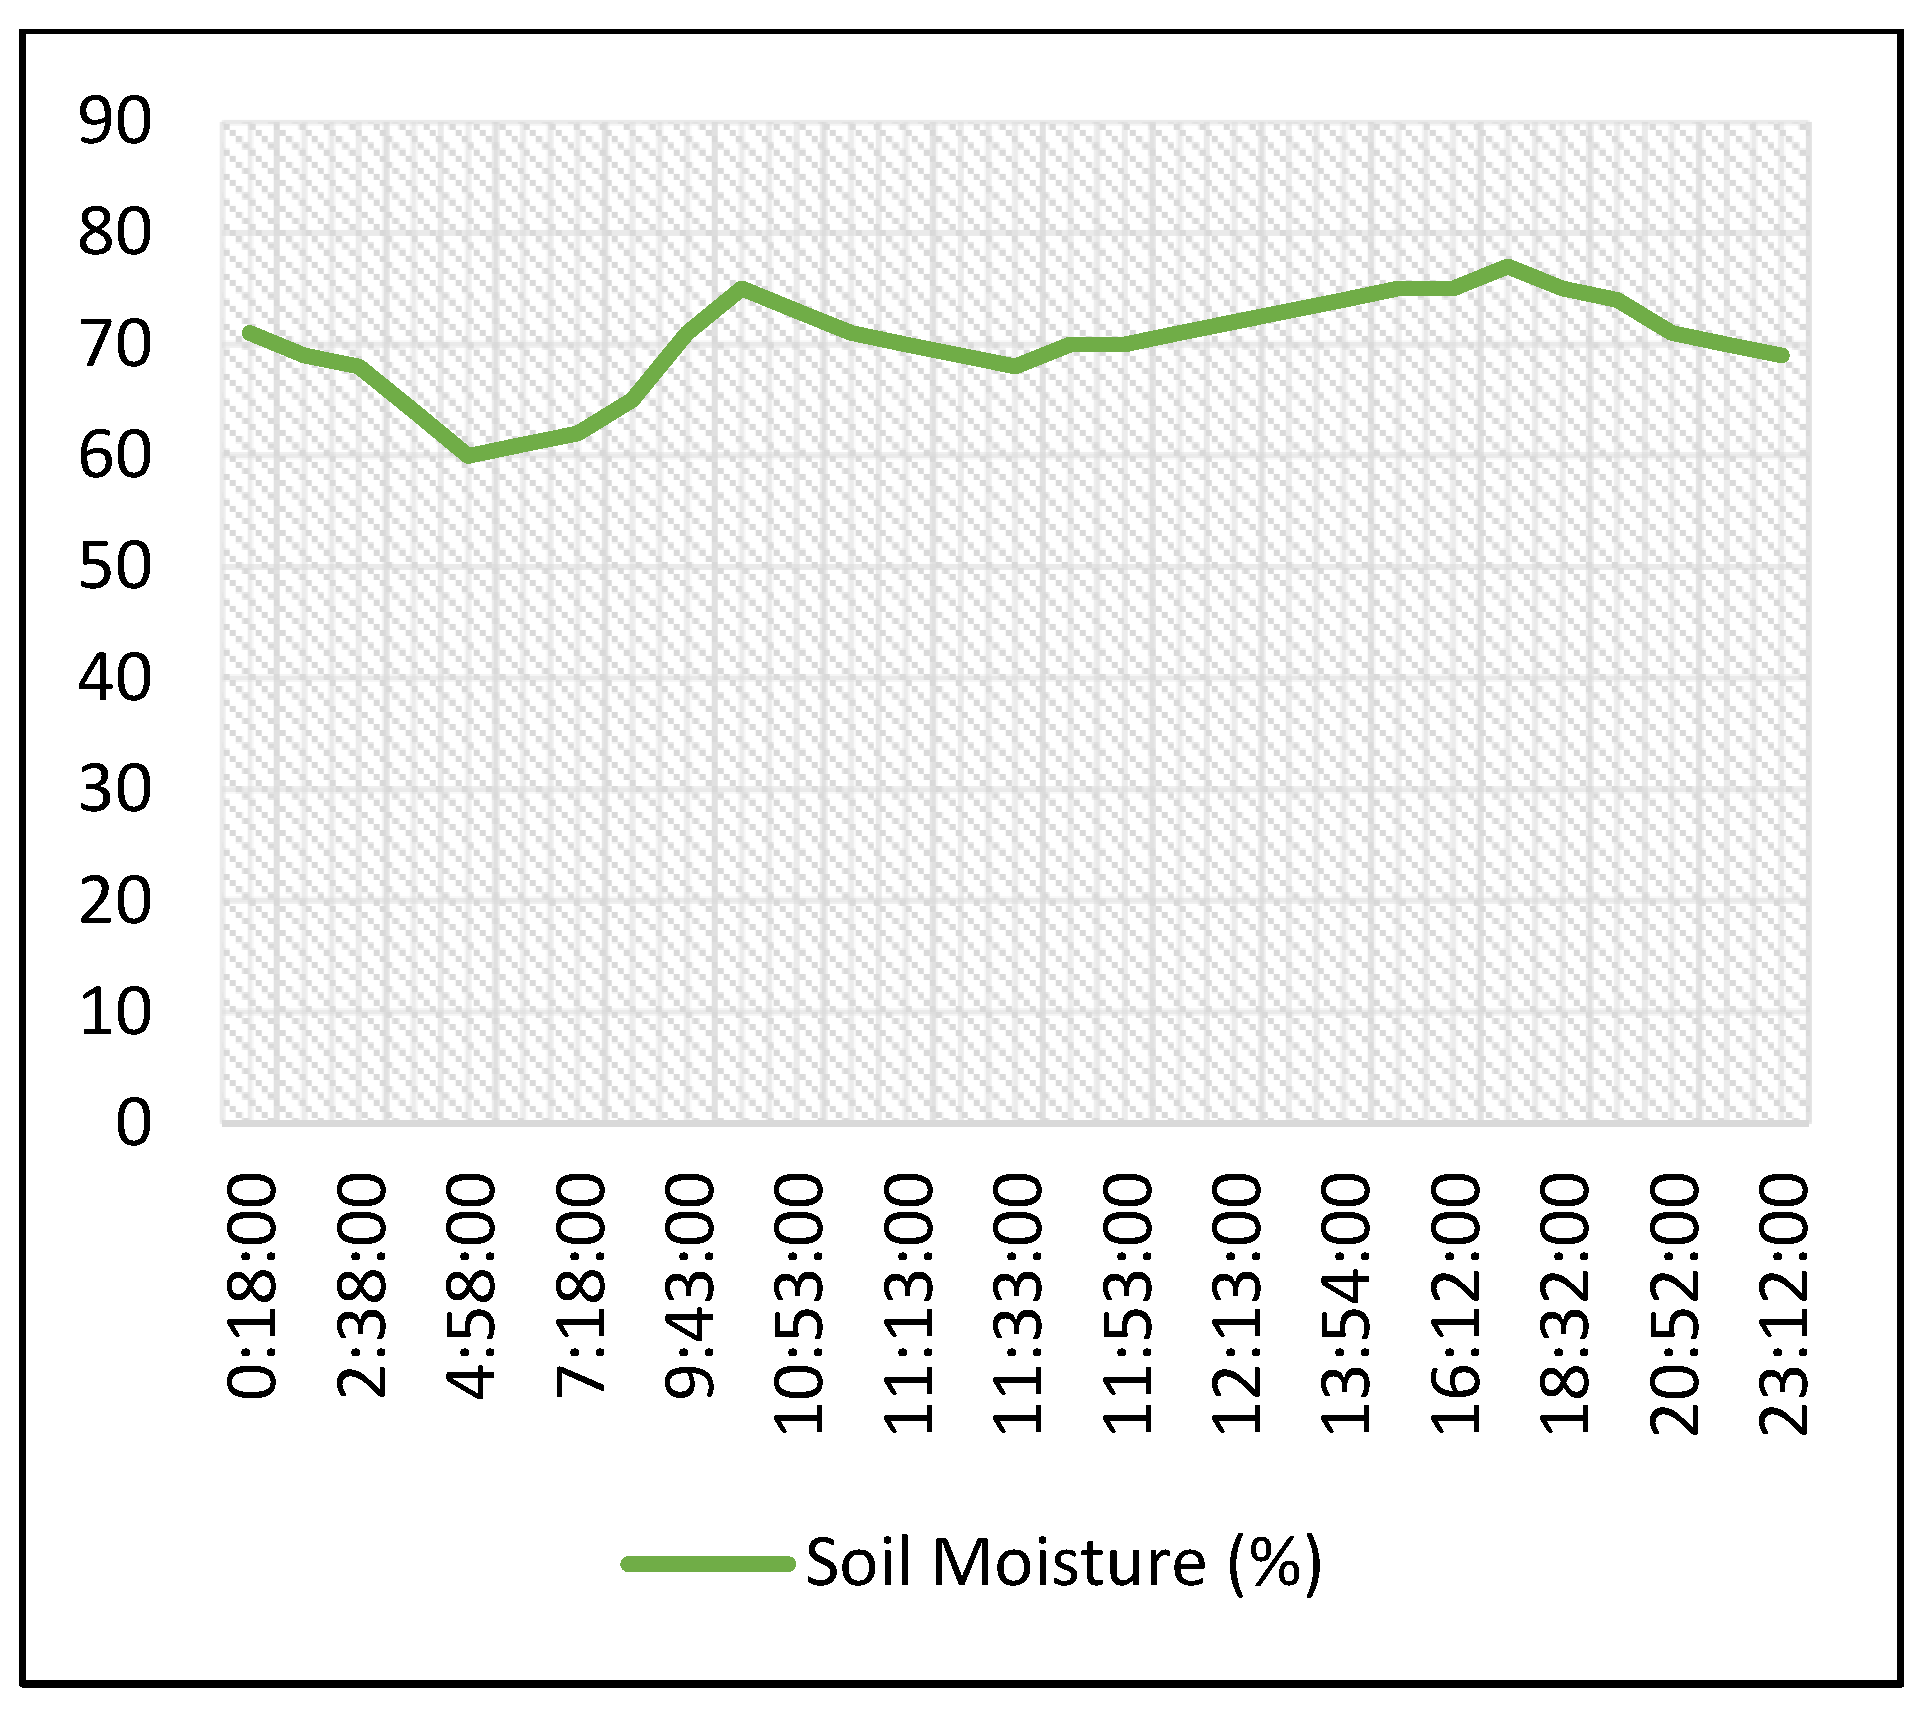
Figure 10 shows soil moisture from 20 March 2024, between 12:18 A.M. and 11:12 P.M. The threshold was 60%. At 12:18 A.M., soil moisture was 71%, so the water pump did not activate. The lowest recorded moisture was 55%, which triggered the pump until the level reached the threshold. After watering, moisture increased to 71%.
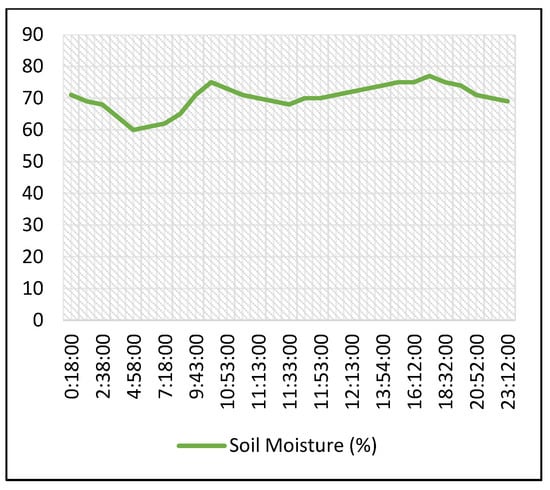
Figure 10.
Average soil moisture data.
3.6. Plant Growth
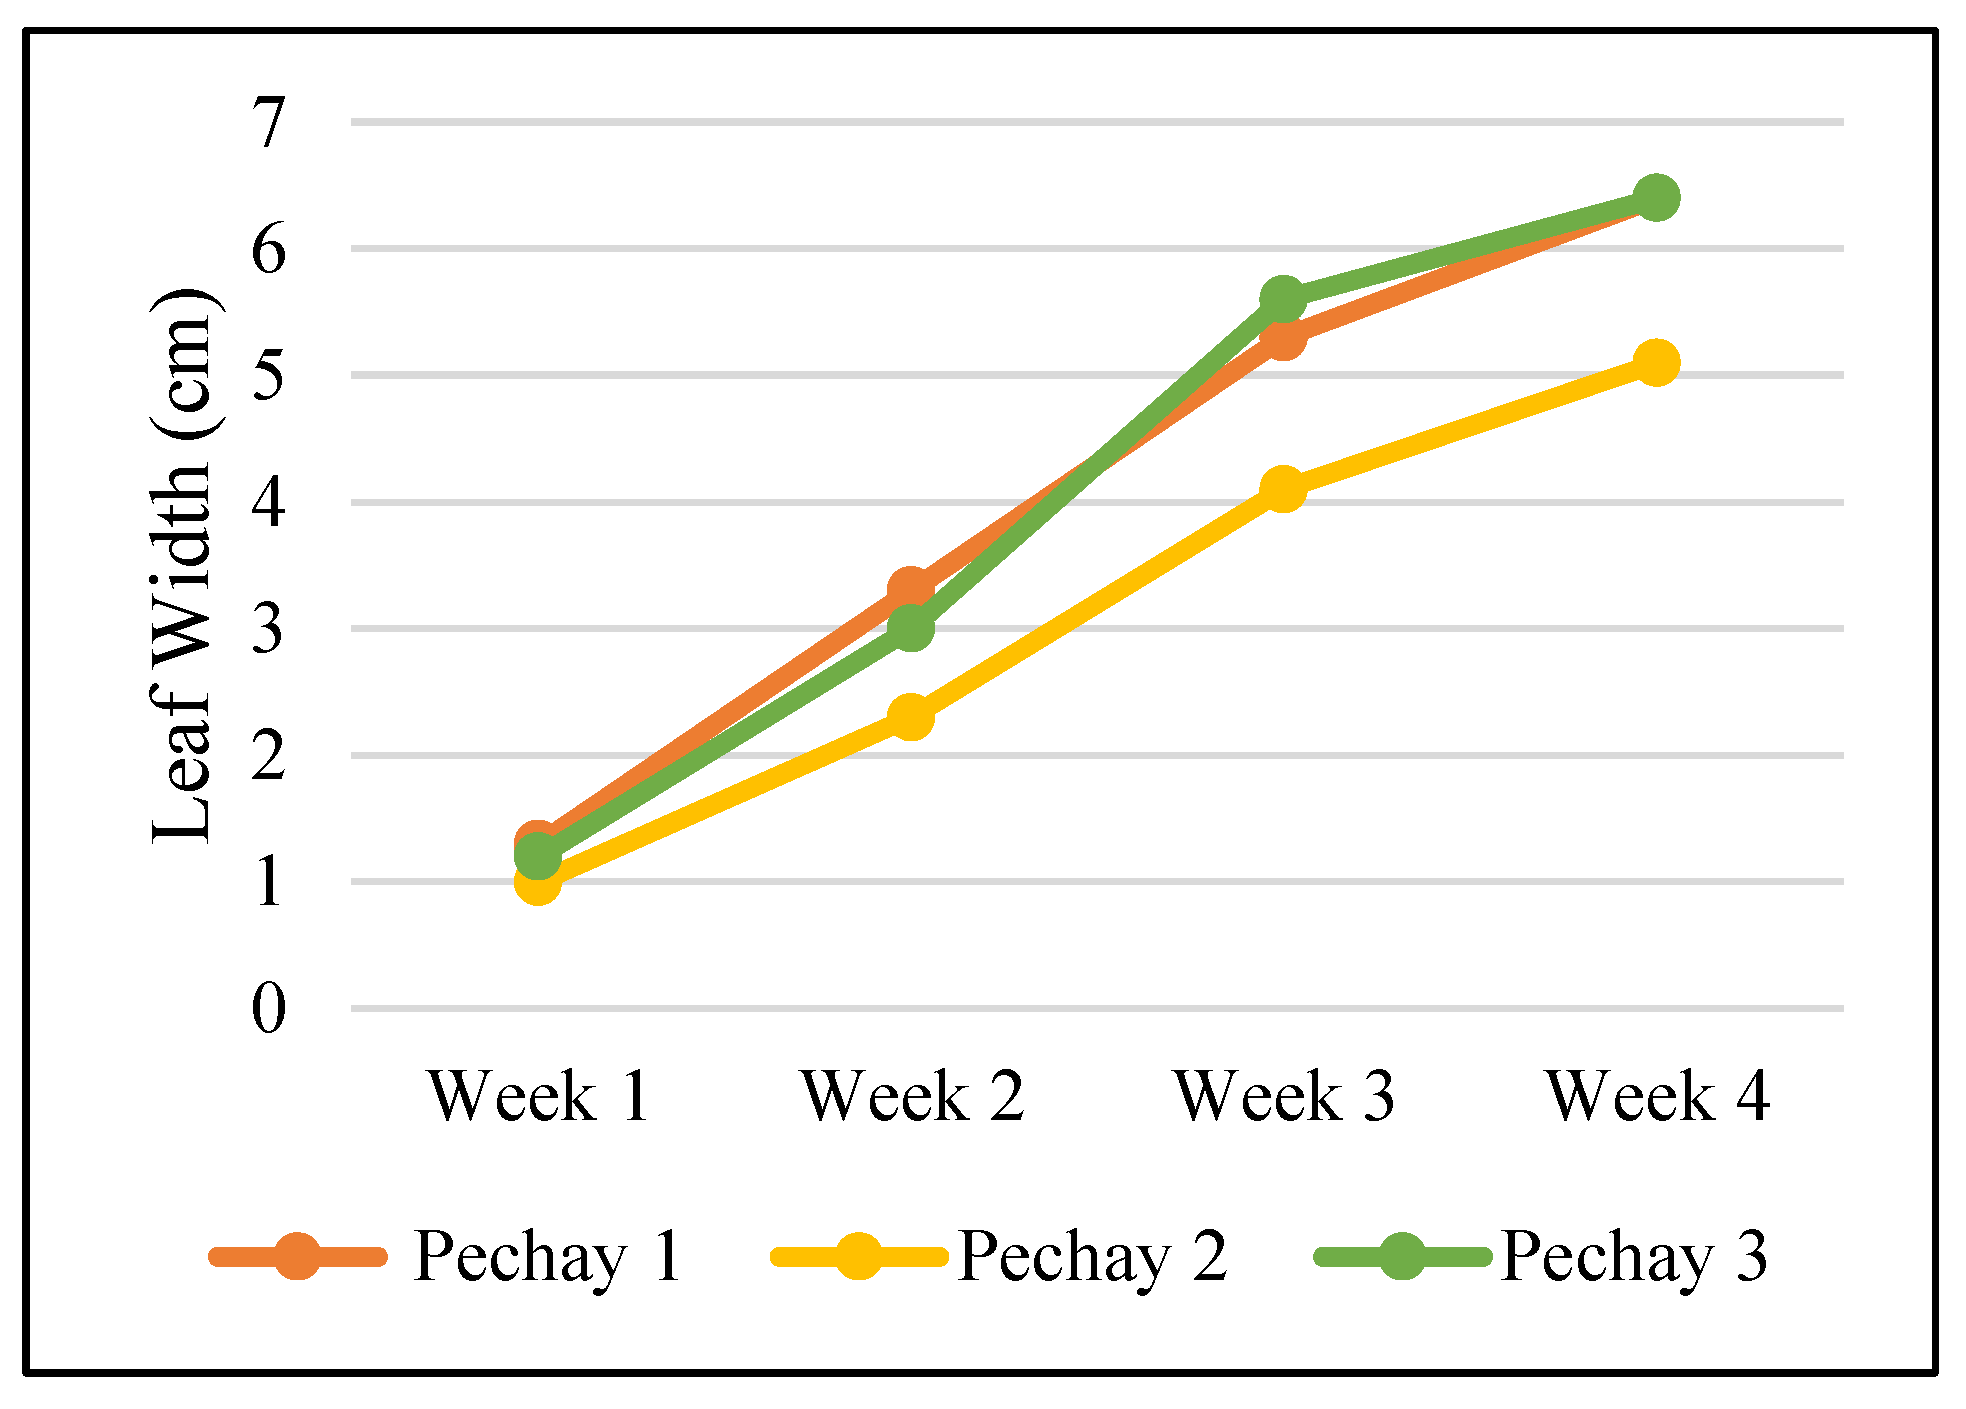
The plant growth of pechay plants within the greenhouse was measured based on their leaf width and height [5] over a period of four week (forty days) [6]. The data are as follows: the leaf width of pechay plants one and three showed similar growth by week three. However, plant two was 1.5 cm thinner than plant one, showing a significantly slower growth (Figure 11).

Figure 11.
Pechay plants’ leaf width.
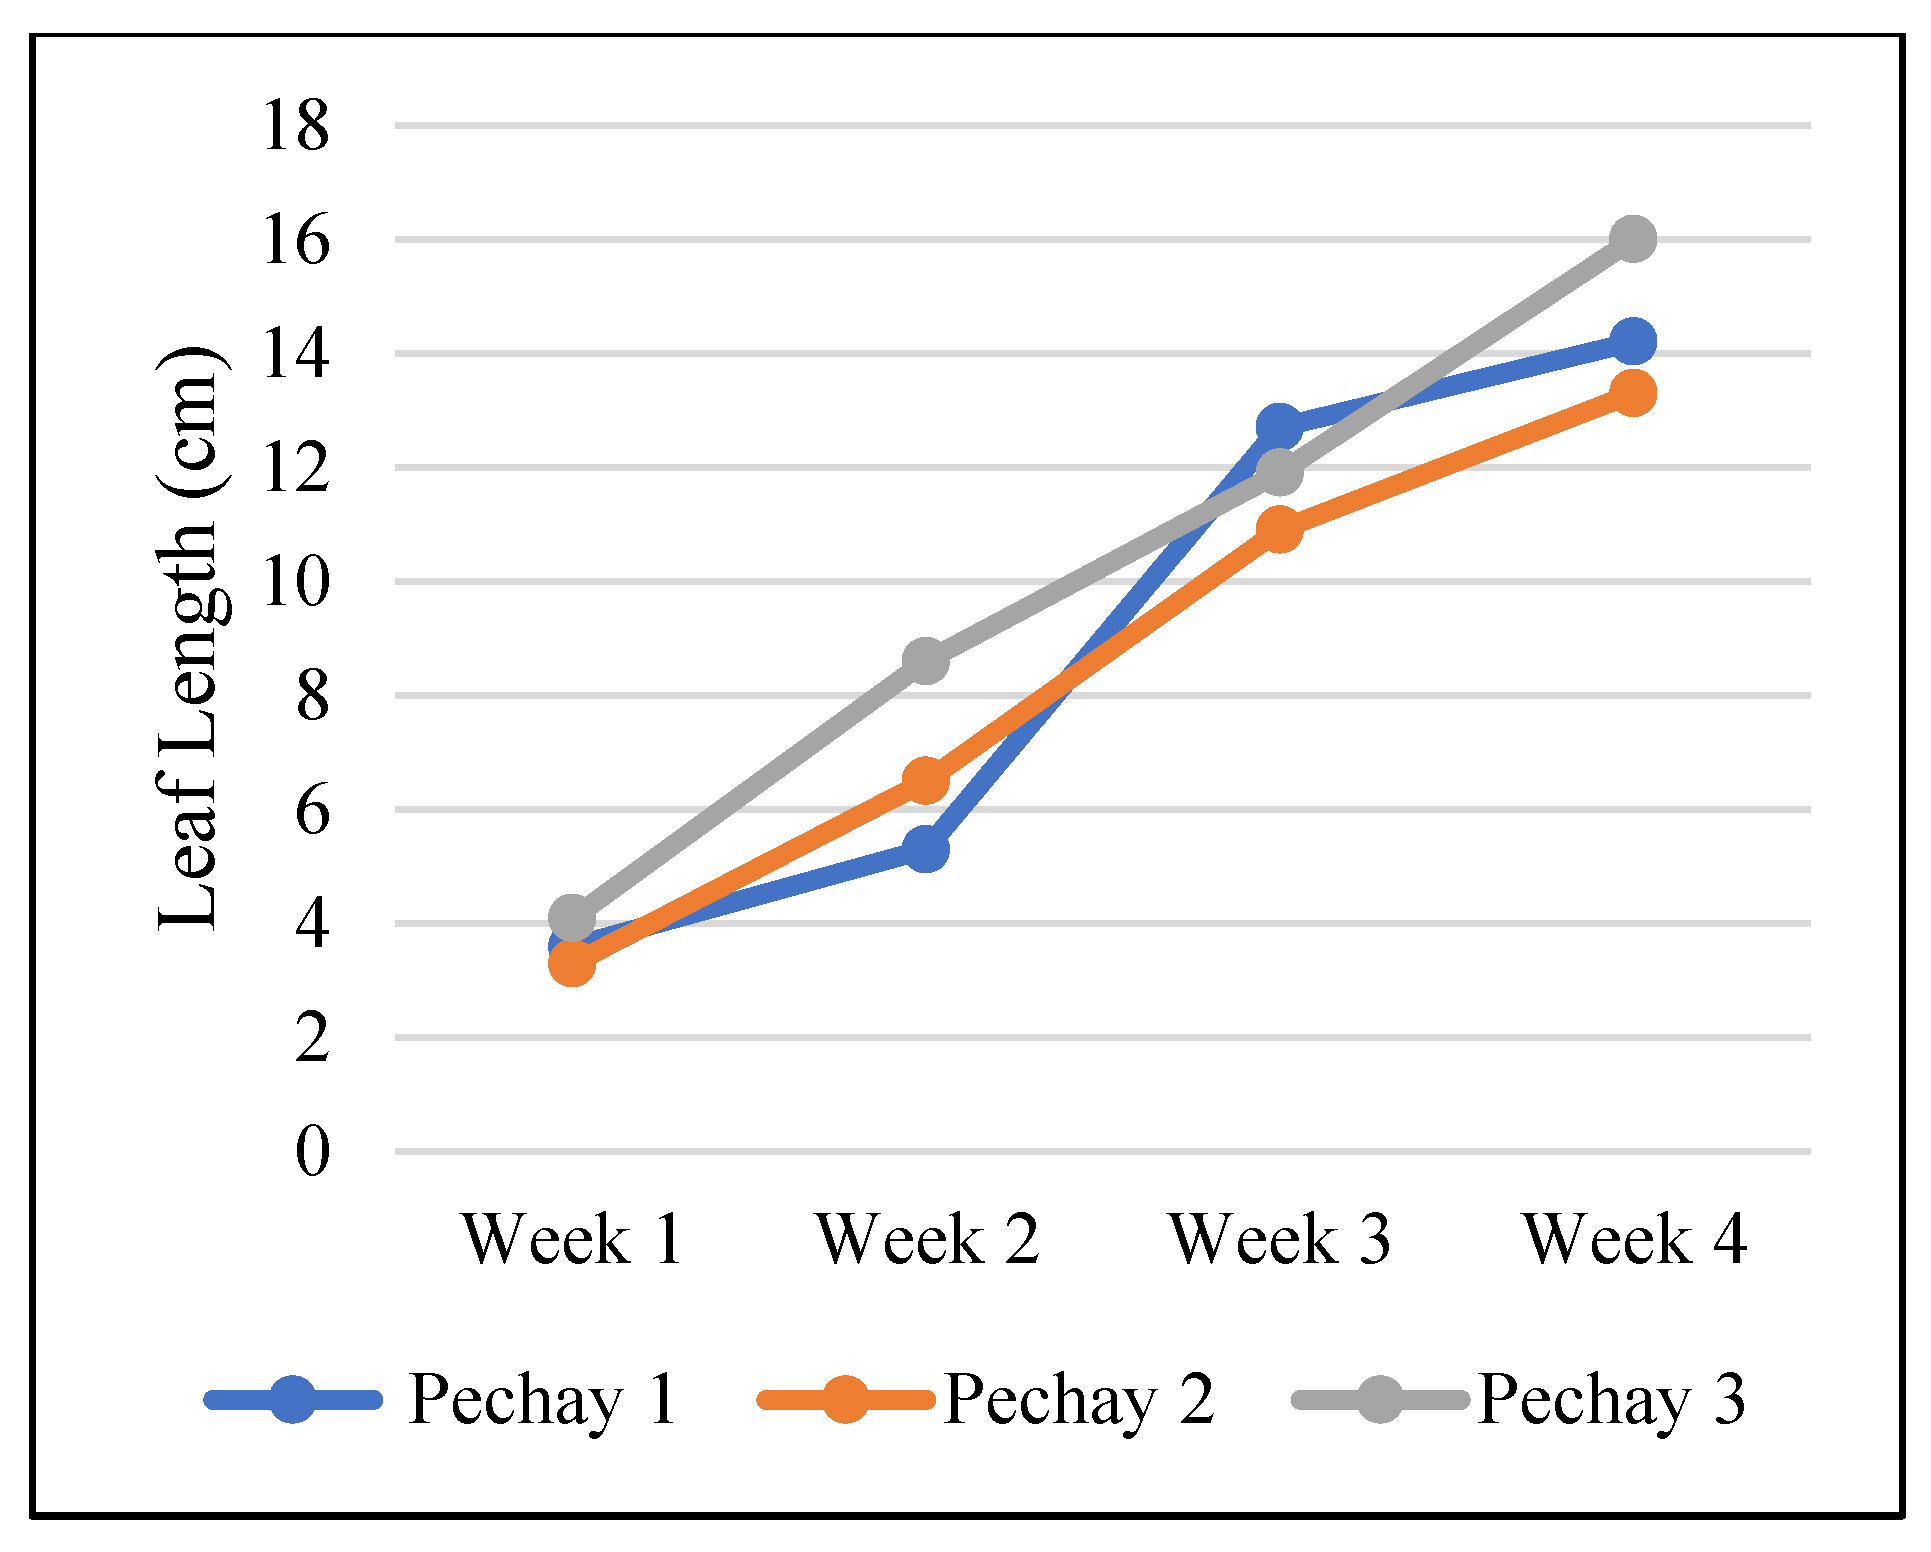
Figure 12 displays leaf length growth for pechay plants from weeks one to four, showing a consistent trend. Plant one consistently outpaced others, while plants two and three showed gradual growth in weeks two and three, followed by a sharp acceleration in week four.
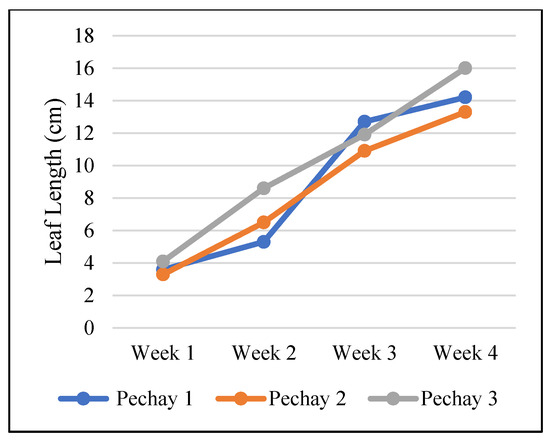
Figure 12.
Pechay plants’ leaf length.
4. Conclusions and Recommendations
The developed automated greenhouse system is operated in manual and automatic modes. It is used to monitor light intensity, temperature, humidity, and soil moisture. It is completely self-sustaining, being connected to an AC power grid, a solar panel, and a battery. The IoT application enables the remote monitoring of parameters. The system accurately monitors the greenhouse environment and maintains the thresholds set by the user. Based on the gathered plant growth data, the system maintains plant life within the greenhouse. Further improvement is necessary to obtain the status of the water supply and predict extreme weather conditions.
Author Contributions
Conceptualization, M.V.R.T., M.L.Q.G. and M.M.S.; methodology, M.V.R.T., M.L.Q.G. and M.M.S.; software, M.V.R.T. and M.L.Q.G.; validation, M.V.R.T., M.L.Q.G. and M.M.S.; formal analysis, M.V.R.T., M.L.Q.G. and M.M.S.; investigation, M.V.R.T., M.L.Q.G. and M.M.S.; resources, M.V.R.T. and M.L.Q.G.; data curation, M.V.R.T. and M.L.Q.G.; writing—original draft preparation, M.V.R.T., M.L.Q.G. and M.M.S.; writing—review and editing, M.V.R.T., M.L.Q.G. and M.M.S.; visualization, M.V.R.T., M.L.Q.G. and M.M.S.; supervision, M.M.S.; project administration, M.M.S.; funding acquisition, M.V.R.T. and M.L.Q.G. All authors have read and agreed to the published version of the manuscript.
Funding
This research received no external funding.
Data Availability Statement
The data that support the findings of this study are included within the article.
Acknowledgments
We extend our heartfelt gratitude to all those who have provided support during the completion of this thesis. Your guidance, encouragement, and assistance have been immensely valuable, and we wholeheartedly appreciate your contributions to our research journey. We extend our deepest gratitude to our thesis adviser, Marianne M. Sejera, for their unwavering support, insightful guidance, and constant encouragement, which were instrumental in completing this thesis. Their expertise and dedication greatly enriched our research experience. We are also profoundly grateful to the employees of the Bureau of Plant Industry for their invaluable assistance with the testing site of our prototype. Your cooperation and support were crucial to the success of our project. We express our profound gratitude to our families for their support. Their confidence in us has made us push through this hard endeavor. The sacrifices and encouragement they have given us have been instrumental in making this journey achievable. Lastly, we express our deepest gratitude to God for granting the insight and determination we needed to finalize our thesis. His insight was made a steadfast source of fortification and enthusiasm during this arduous expedition.
Conflicts of Interest
The authors declare no conflict of interest.
References
- Lopez, N.F.G. Intelligent Water Control System for Agriculture Monitoring with Mobile Application. Liceo J. High. Educ. Res. 2022, 18, 65–66. [Google Scholar]
- Iberdrola. Which Countries Are Most Threatened by and Vulnerable to Climate Change? Iberdrola, 22 April 2021; [Online]. Available online: https://www.iberdrola.com/sustainability/top-countries-most-affected-by-climate-change (accessed on 13 May 2024).
- Danita, M.; Mathew, B.; Shereen, N.; Sharon, N.; Paul, J.J. IoT Based Automated Greenhouse Monitoring System. In Proceedings of the 2018 Second International Conference on Intelligent Computing and Control Systems (ICICCS), Madurai, India, 14–15 June 2018; pp. 1933–1937. [Google Scholar] [CrossRef]
- Lagon, J.R.M.; Abad, R.G.; Bayogan, E.R.V.; Silvosa-Millado, C.S.C. Growth and Yield of Screenhouse-grown potted Pechay (Brassica rapa L. ssp. chinensis cv. Black Behi) in selected Davao-produced Composts. Mindanao J. Sci. Technol. 2022, 20. [Google Scholar] [CrossRef]
- Schrader, J.; Shi, P.; Royer, D.L.; Peppe, D.J.; Gallagher, R.V.; Li, Y.; Wang, R.; Wright, I.J. Leaf size estimation based on leaf length, width and shape. Ann. Bot. 2021, 128, 395–406. [Google Scholar] [CrossRef] [PubMed]
- Jimenez, E.F.; Mariano, J.S.; Ferrer, M.J.; De Leon, V.E.R.E.N.A. Pechay Production Guide. Persepsi Masy. Terhadap Perawatan Ortod. Yang Dilakukan Oleh Pihak Non Prof. 2013, 53, 1689–1699. [Google Scholar]


Disclaimer/Publisher’s Note: The statements, opinions and data contained in all publications are solely those of the individual author(s) and contributor(s) and not of MDPI and/or the editor(s). MDPI and/or the editor(s) disclaim responsibility for any injury to people or property resulting from any ideas, methods, instructions or products referred to in the content. |
© 2025 by the authors. Licensee MDPI, Basel, Switzerland. This article is an open access article distributed under the terms and conditions of the Creative Commons Attribution (CC BY) license (https://creativecommons.org/licenses/by/4.0/).