
Classification of Non-Frozen and Frozen–Thawed Pork with Adaptive Support Vector Machine and Electronic Nose †


Abstract
1. Introduction
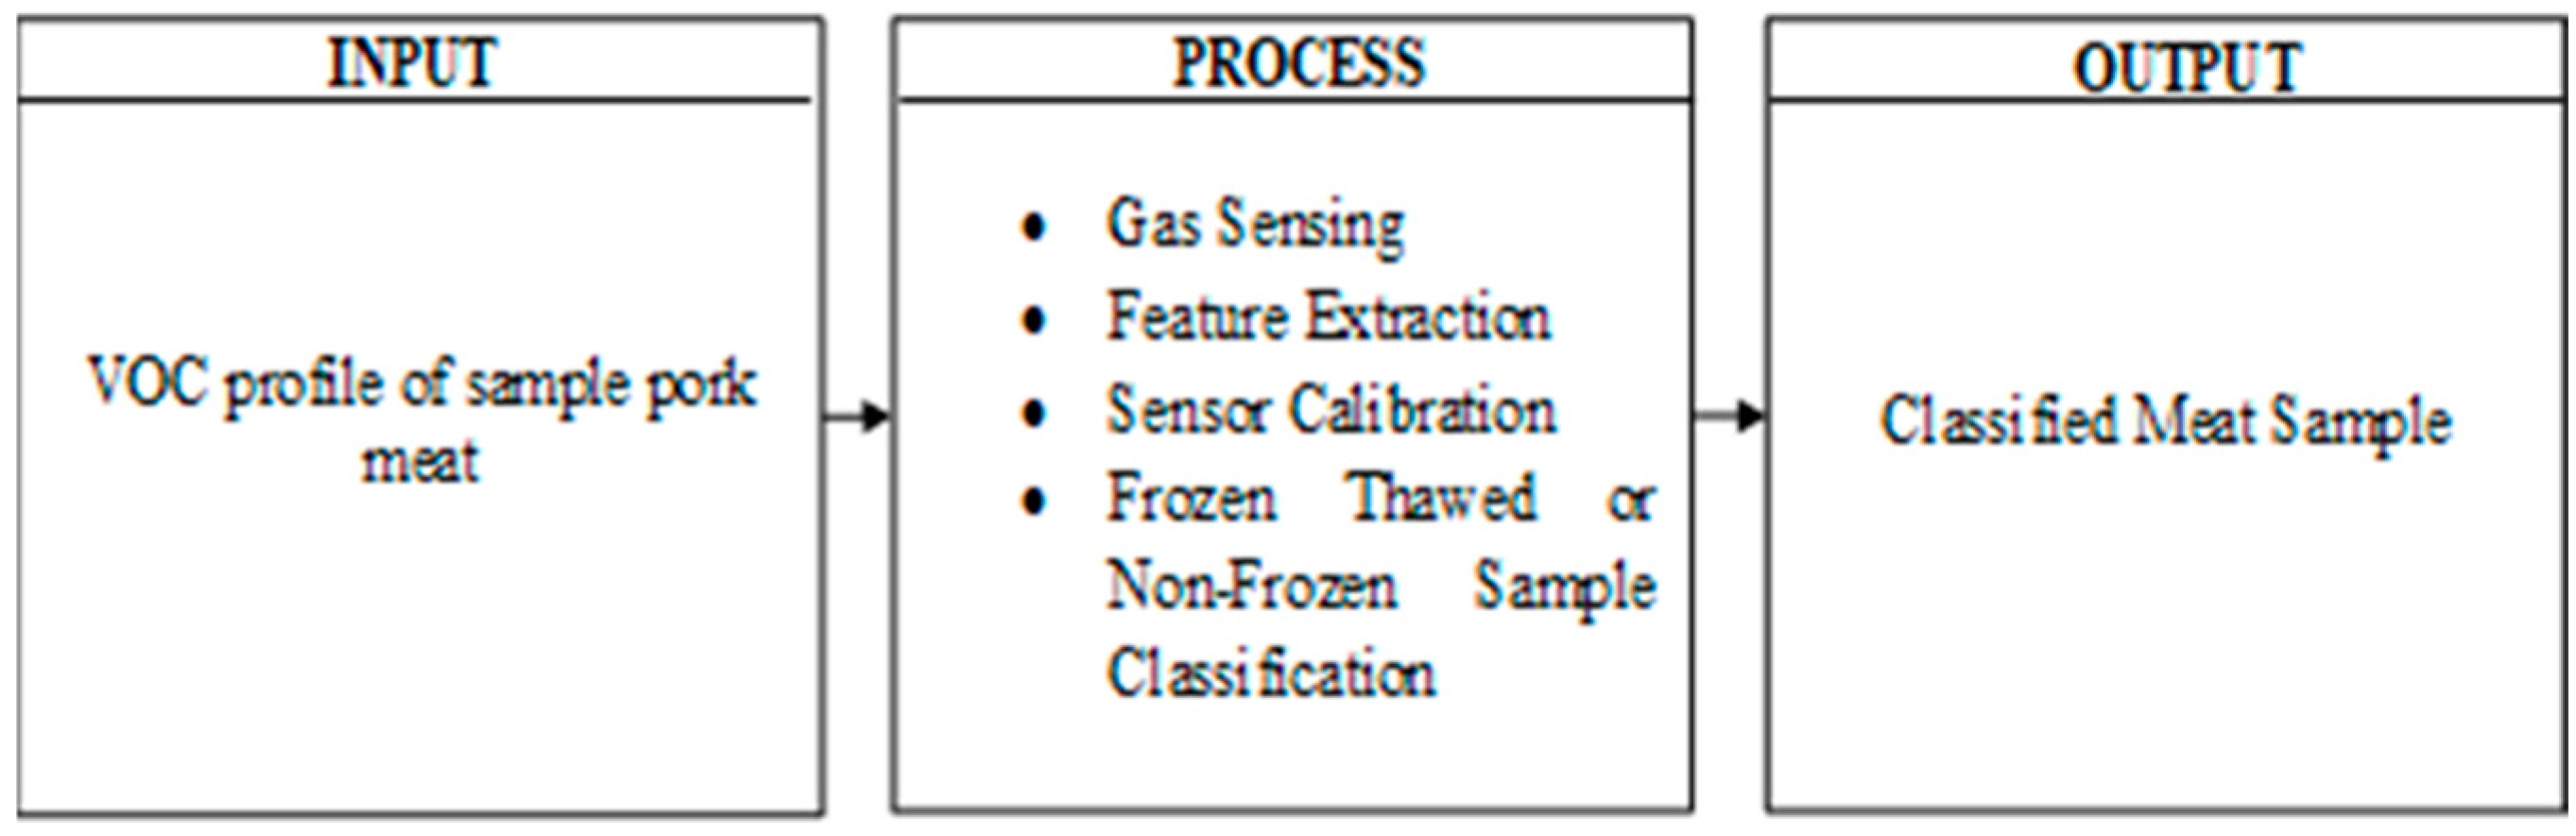
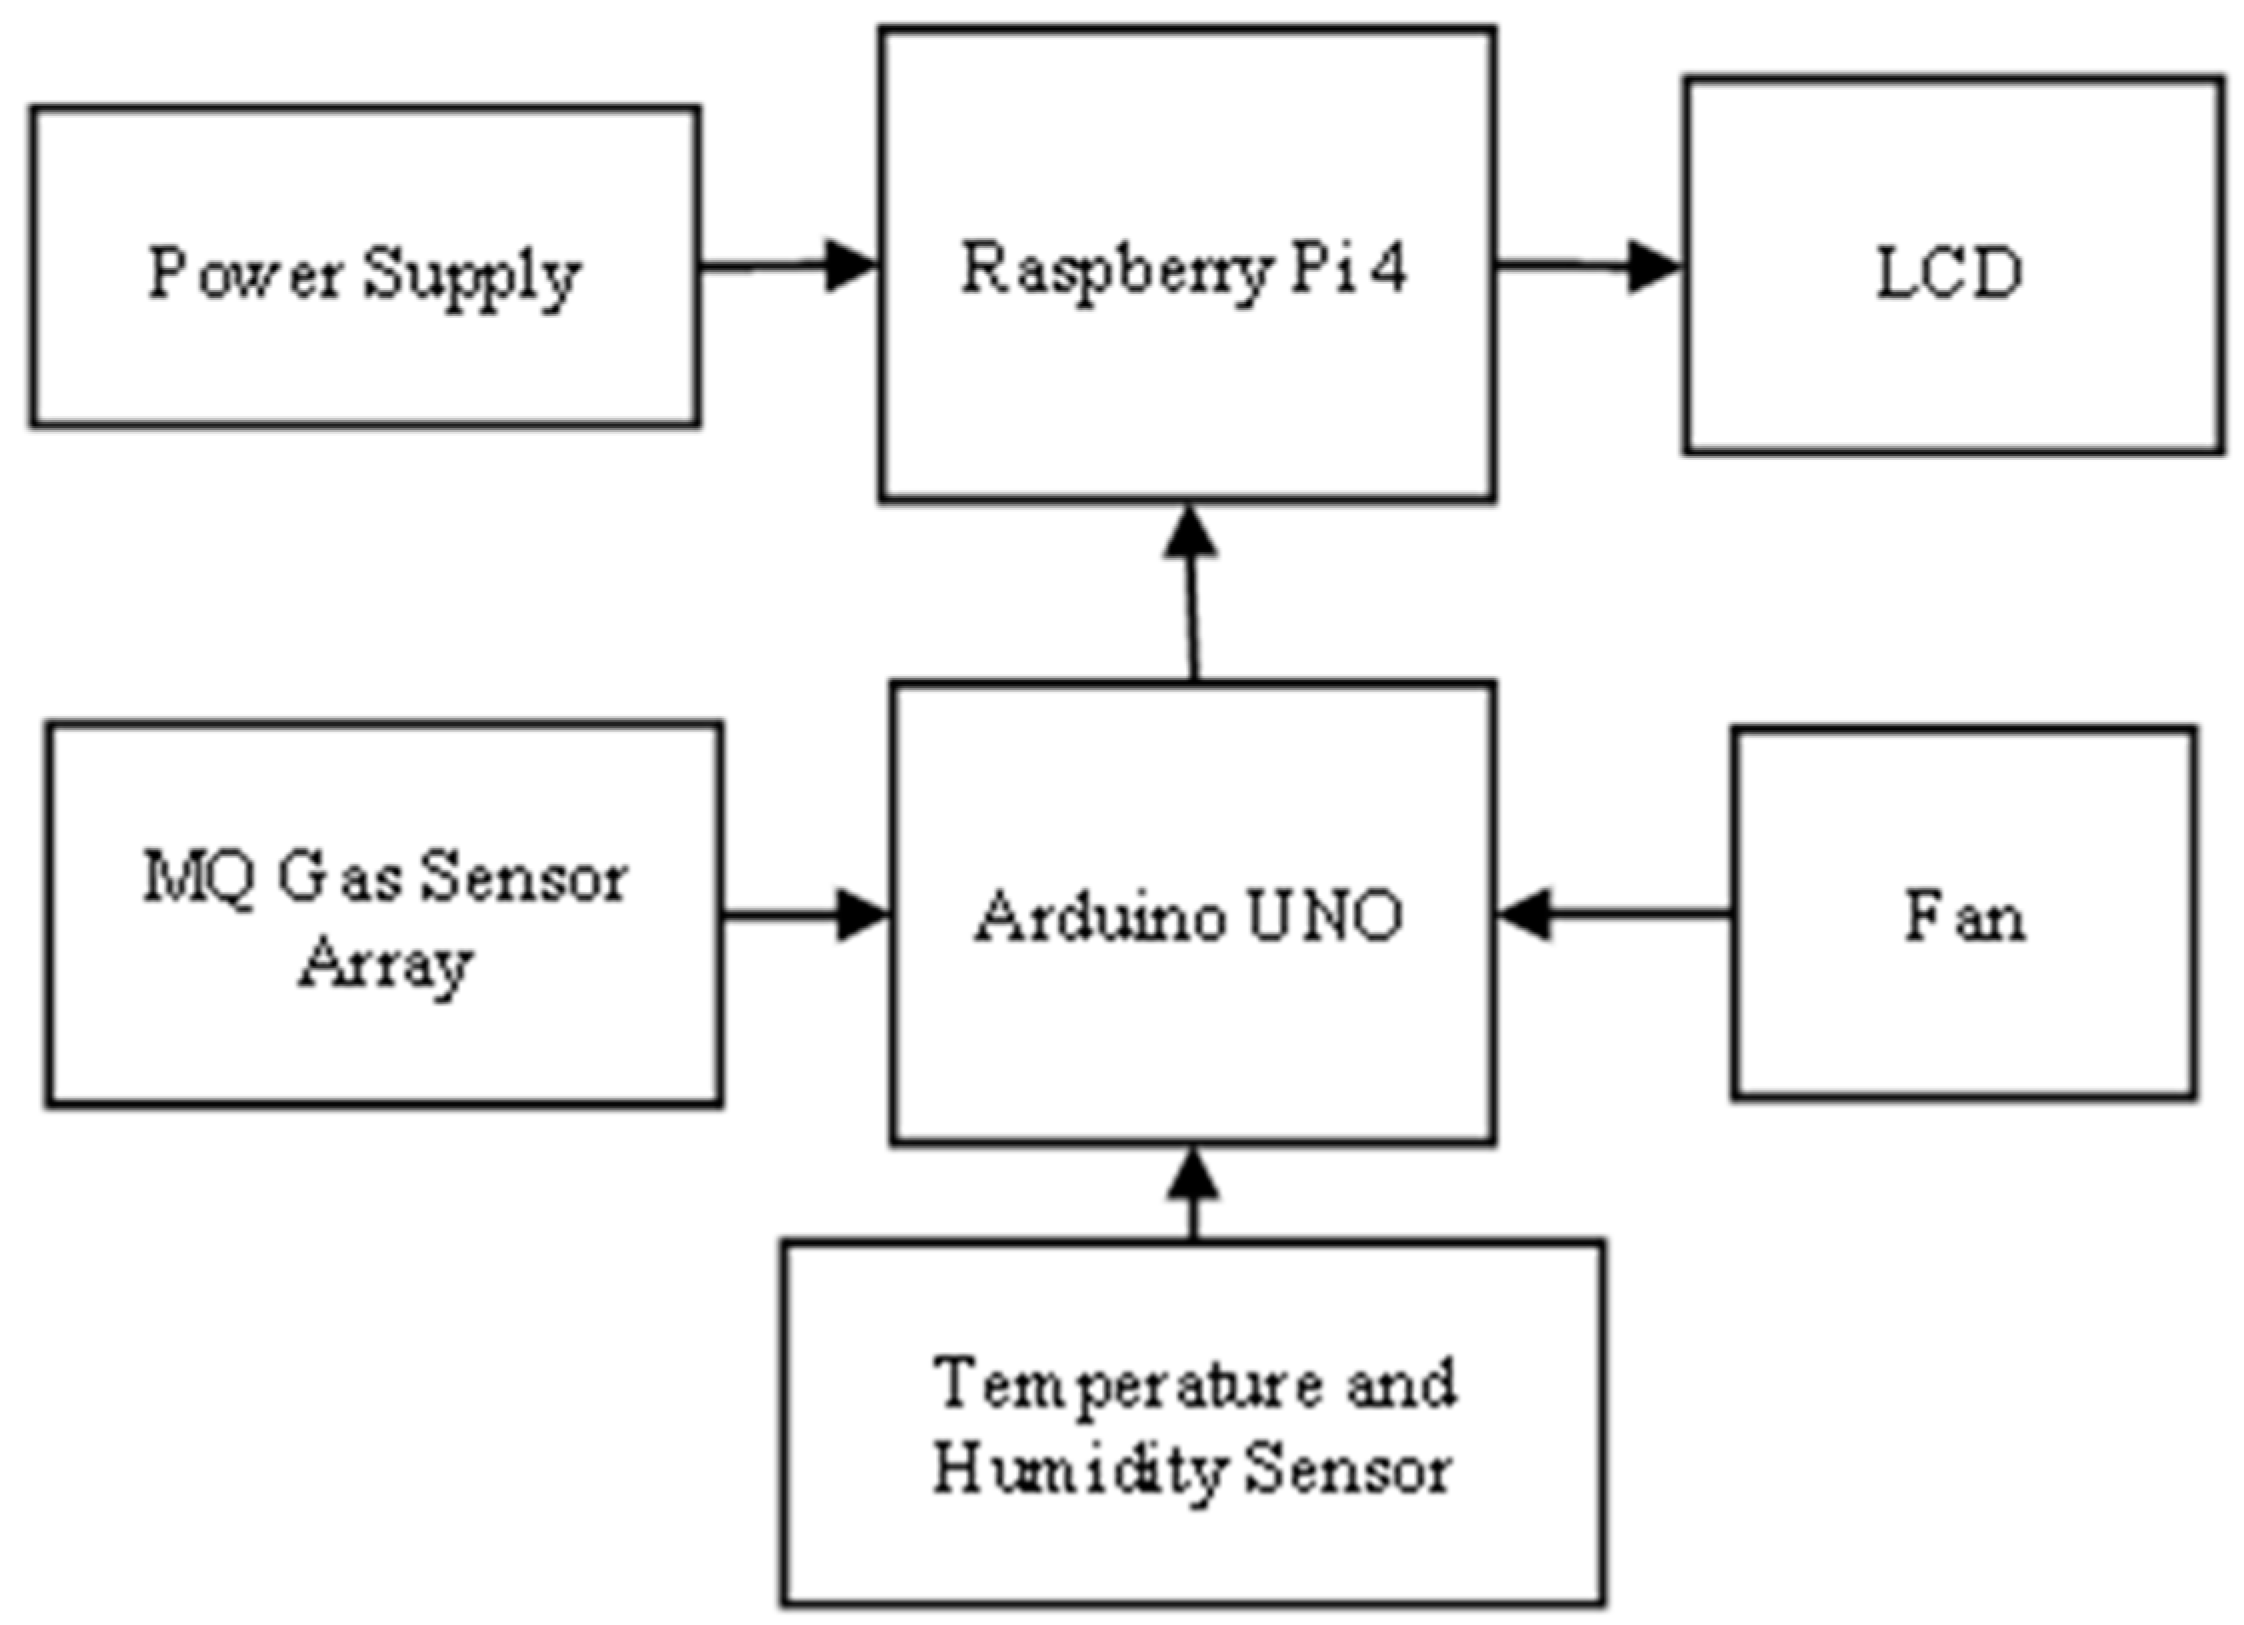
2. Method
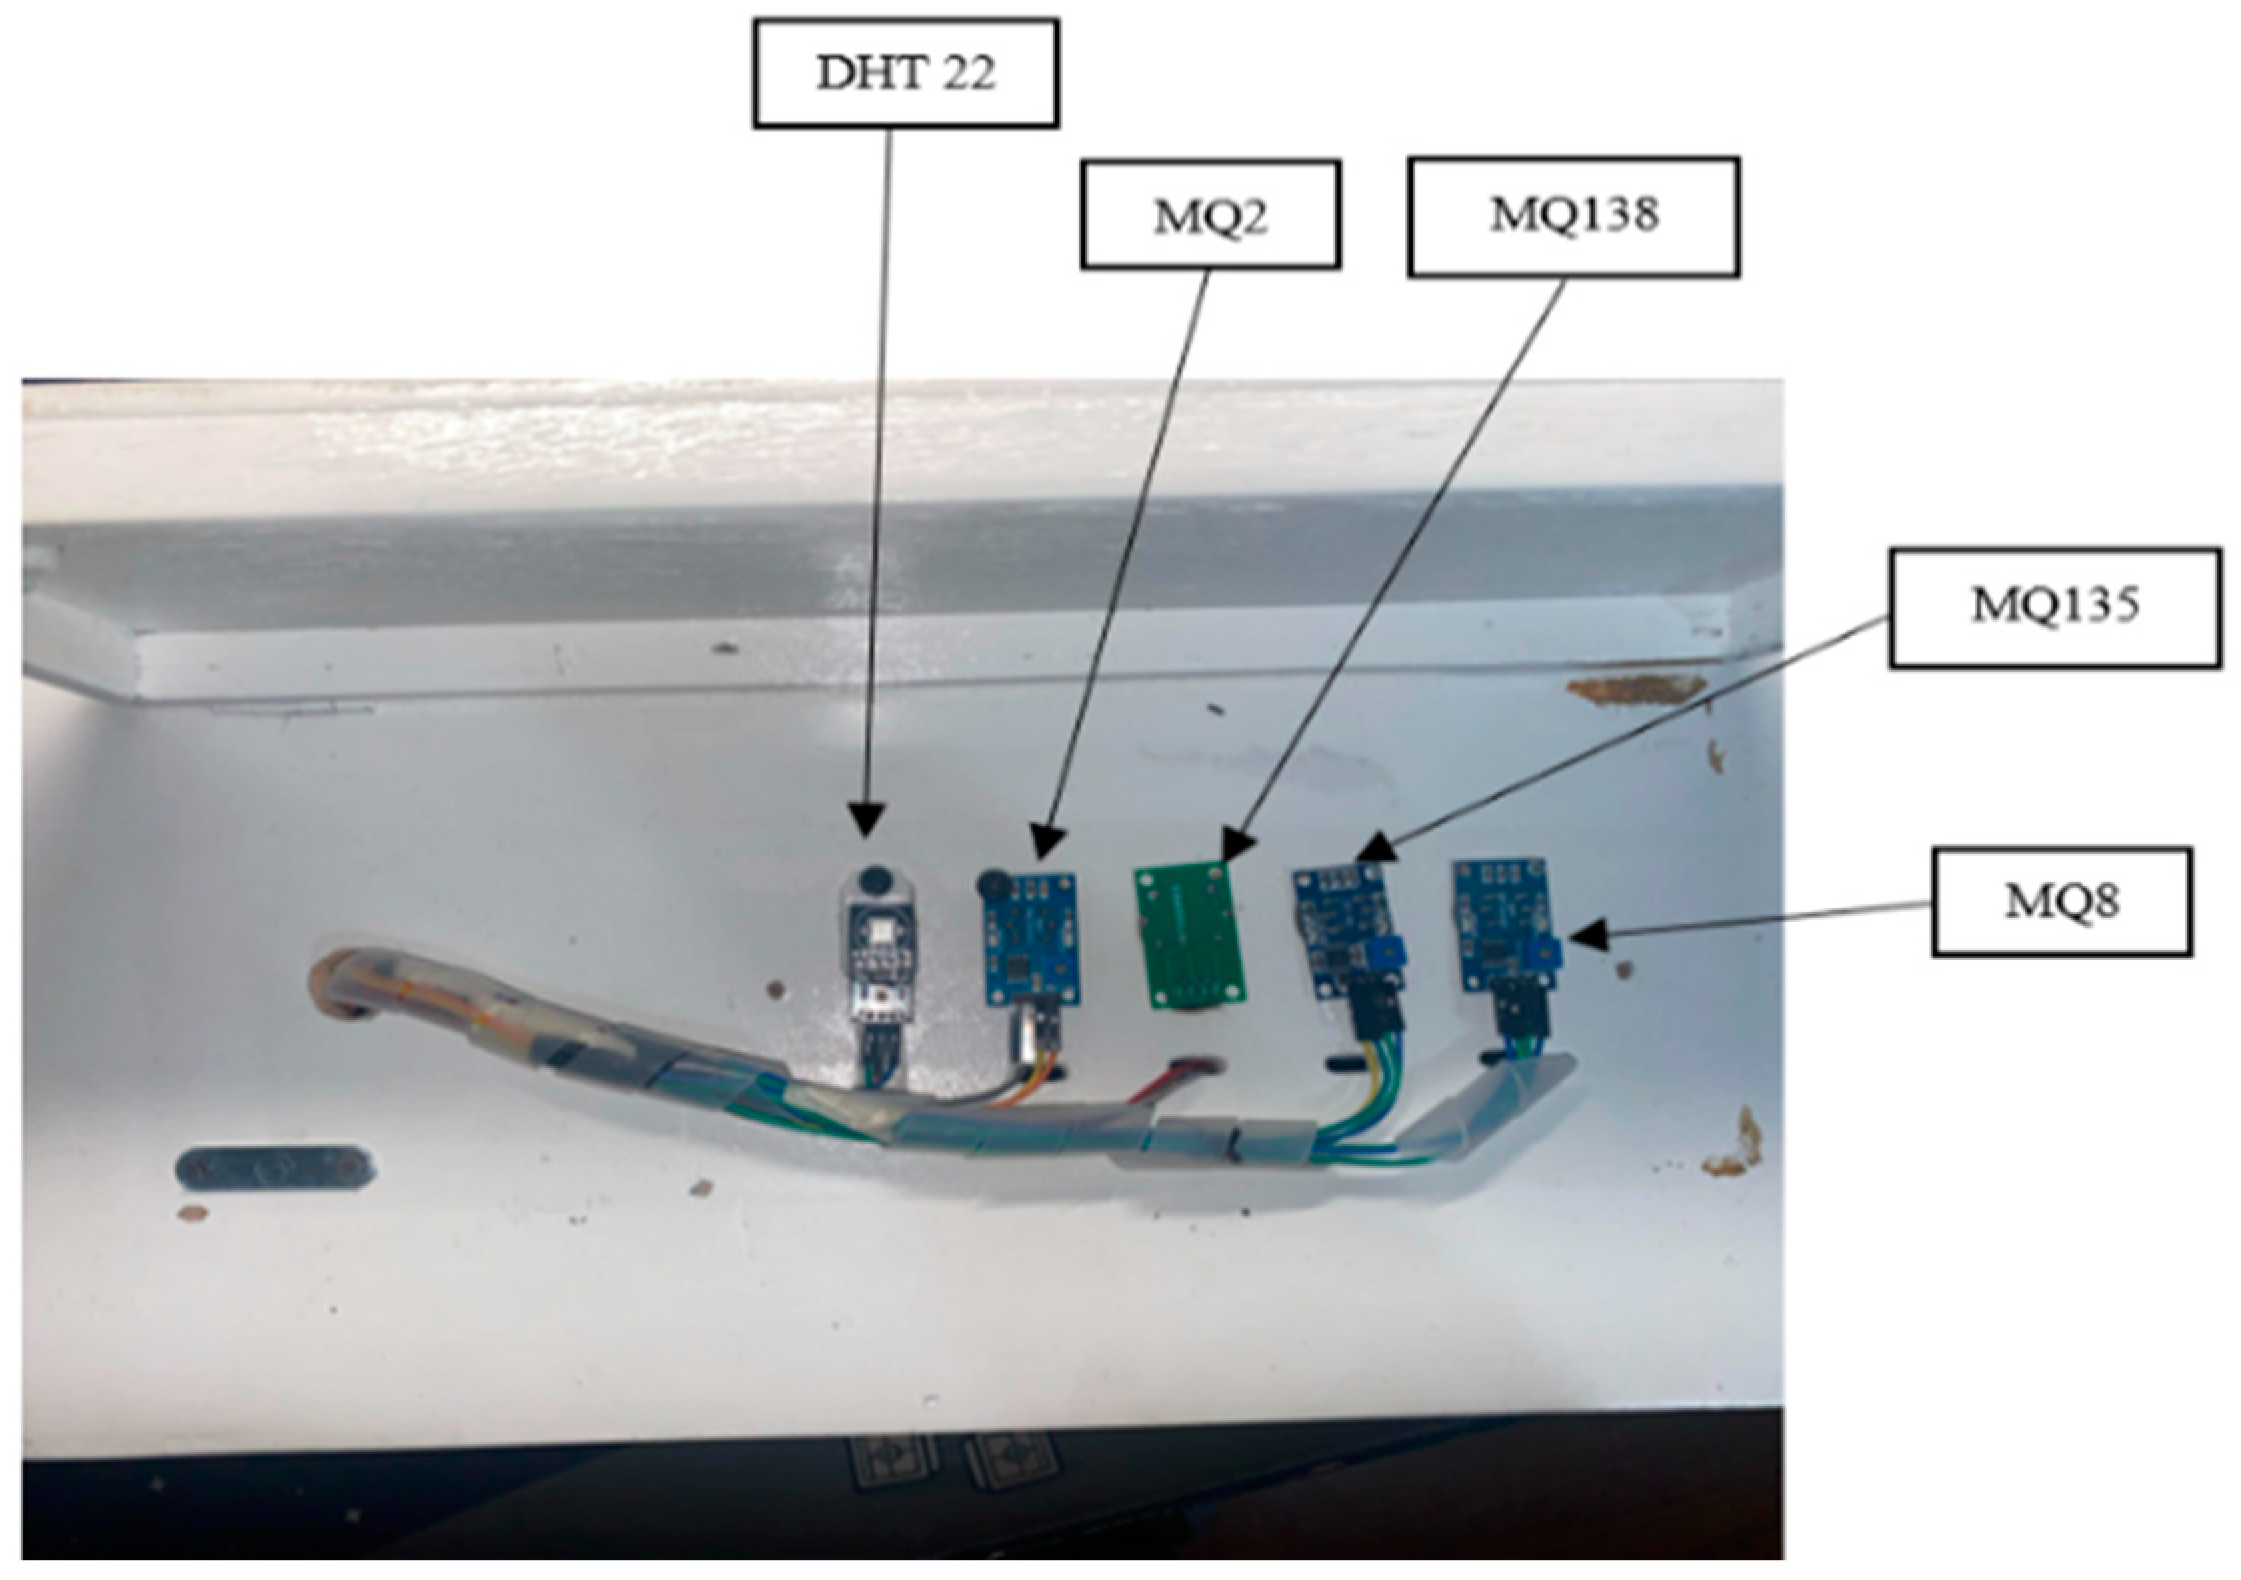
2.1. Hardware
2.2. Software
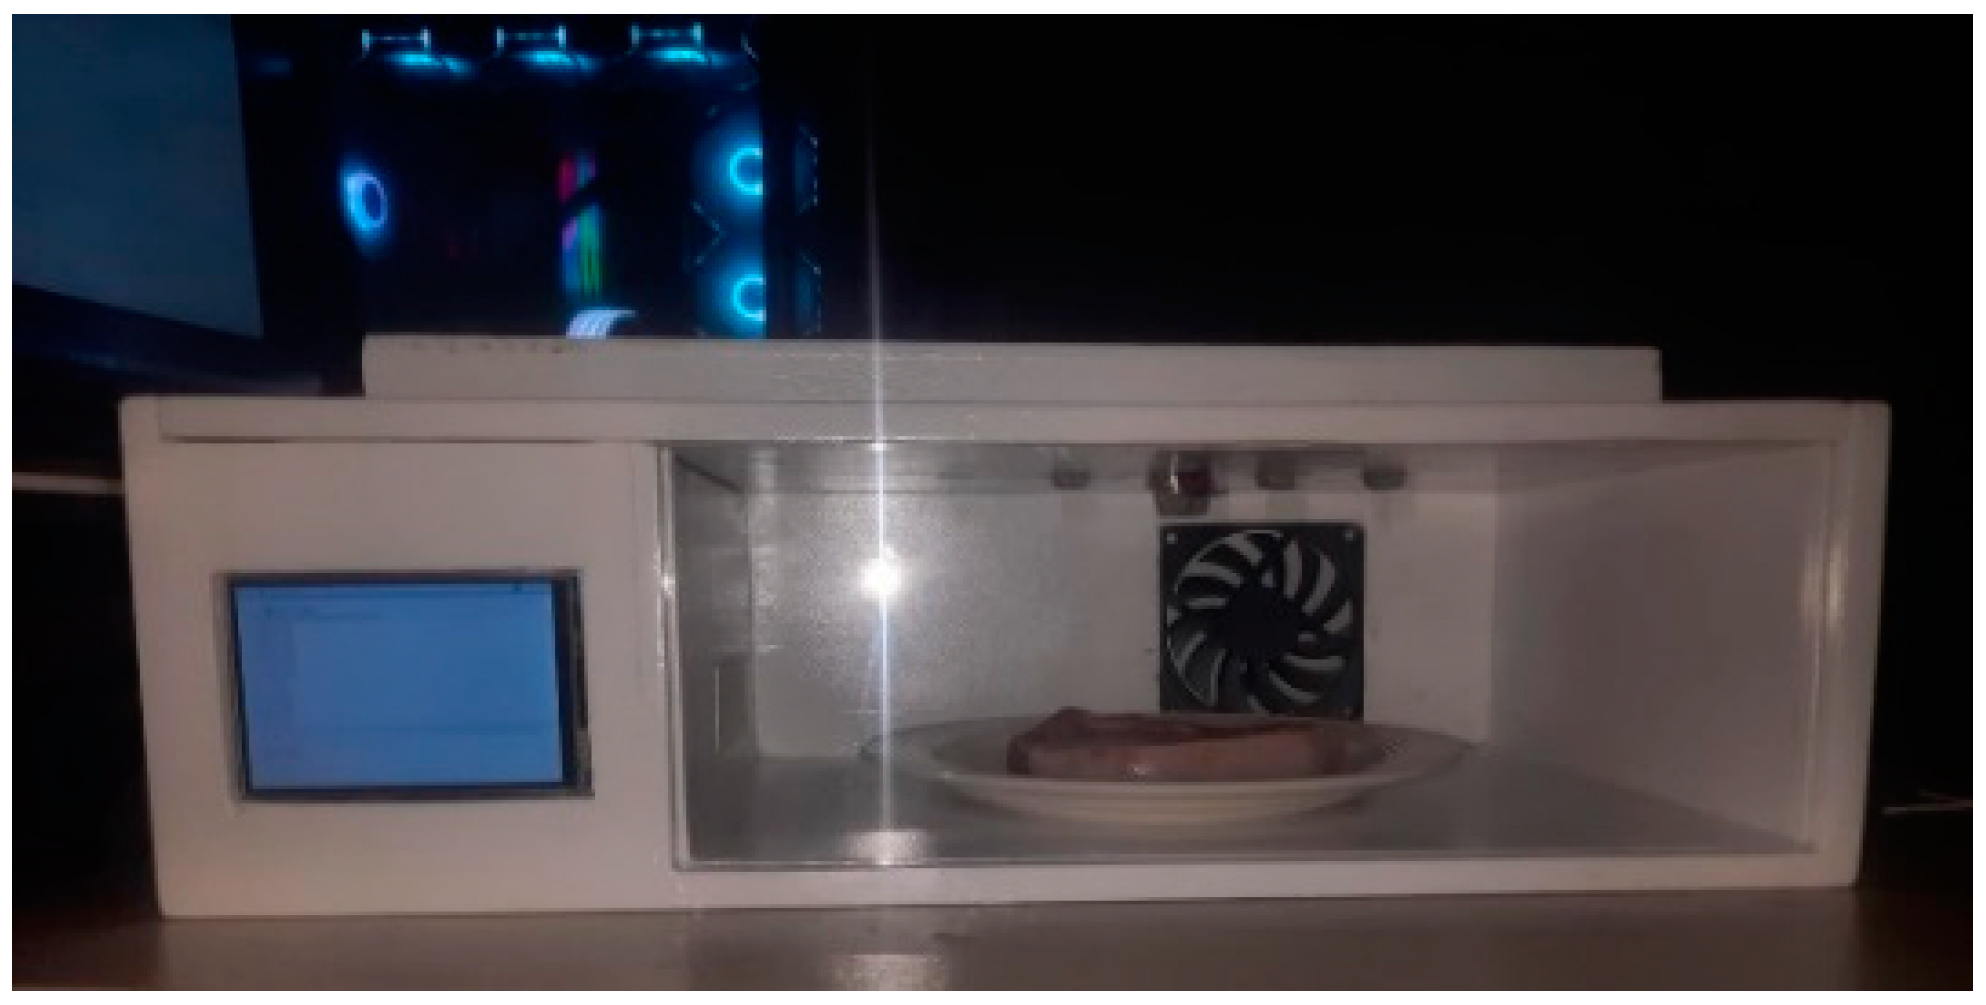
2.3. Experimental Setup
3. Results and Discussion
3.1. Data Acquisition
3.2. Statistical Treatment
4. Conclusions and Recommendations
Author Contributions
Funding
Institutional Review Board Statement
Informed Consent Statement
Data Availability Statement
Conflicts of Interest
References
- Scallan, E.; Hoekstra, R.M.; Angulo, F.J.; Tauxe, R.V.; Widdowson, M.A.; Roy, S.L.; Jones, J.L.; Griffin, P.M. Foodborne illness acquired in the United States-Major pathogens. Emerg. Infect. Dis. 2011, 17, 7–15. [Google Scholar] [CrossRef] [PubMed]
- Bonah, E.; Huang, X.; Hongying, Y.; Aheto, J.H.; Yi, R.; Yu, S.; Tu, H. Detection of Salmonella Typhimurium contamination levels in fresh pork samples using E-nose smellprints in tandem with support vector machine regression and metaheuristic optimization algorithms. J. Food Sci. Technol. 2021, 58, 3861–3870. [Google Scholar] [CrossRef] [PubMed]
- Wang, T.; Wu, Y.; Zhang, Y.; Lv, W.; Chen, X.; Zeng, M.; Yang, J.; Su, Y.; Hu, N.; Yang, Z. Portable E-nose system with elastic architecture and fault tolerance based on edge computing, ensemble learning, and sensor swarm. Sens. Actuators B Chem. 2023, 375, 132925. [Google Scholar] [CrossRef]
- Rivai, M.; Budiman, F.; Purwanto, D.; Simamora, J. Meat freshness identification system using gas sensor array and color sensor in conjunction with neural network pattern recognition. J. Theor. Appl. Inf. Technol. 2018, 96, 3861–3872. [Google Scholar]
- Mirzaee-Ghaleh, E.; Taheri-Garavand, A.; Ayari, F.; Lozano, J. Identification of Fresh-Chilled and Frozen-Thawed Chicken Meat and Estimation of their Shelf Life Using an E-Nose Machine Coupled Fuzzy KNN. Food Anal. Methods 2020, 13, 678–689. [Google Scholar] [CrossRef]
- Jońca, J.; Pawnuk, M.; Arsen, A.; Sówka, I. E-noses and Their Applications for Sensory and Analytical Measurements in the Waste Management Plants—A Review. Sensors 2022, 22, 1510. [Google Scholar] [CrossRef] [PubMed]
- Anticuando, M.K.D.; Directo, C.K.R.; Padilla, D.A. E-nose and Deep Learning Approach in Identifying Ripe Lycopersicum esculentum L. TomatoFruit. In Proceedings of the 2022 13th International Conference on Computing Communication and Networking Technologies (ICCCNT), Kharagpur, India, 3–5 October 2022. [Google Scholar] [CrossRef]
- Yumang, A.N.; Lazaro, J.B.; Leon, C.D.D.; Corpuz, M.A. Application of E-nose for Diagnosing Azotemia from Urinalysis Using Principal Component Analysis. In Proceedings of the 2020 10th International Conference on Biomedical Engineering and Technology, Tokyo, Japan, 15–18 September 2020; pp. 40–45. [Google Scholar] [CrossRef]
- Macatangay, E.C.; Alfonso, C.; Cruz, C.D.; Villaverde, J.F. Determination of Tomato Fruit Stages Using Principal Component Analysis and Fuzzy Logic Algorithm. In Proceedings of the 2022 IEEE International Conference on Artificial Intelligence in Engineering and Technology (IICAIET), Kota Kinabalu, Malaysia, 13–15 September 2022. [Google Scholar]
- Tuazon, G.L.H.; Duran, H.M.; Villaverde, J.F. Portable Sigatoka Spot Disease Identifier on Banana Leaves Using Support Vector Machine. In Proceedings of the 2021 IEEE 13th International Conference on Humanoid, Nanotechnology, Information Technology, Communication and Control, Environment, and Management (HNICEM), Manila, Philippines, 28–30 November 2021. [Google Scholar]
- Soriano, C.B.; Ferrer, D.K.; Padilla, D.A.; Villaverde, J.F. Classification of Citrus Sinensis Peel for Production of Biopolymers Using Probability Distribution Function. In Proceedings of the 2021 IEEE 7th International Conference on Control Science and Systems Engineering (ICCSSE), Qingdao, China, 30 July–1 August 2021. [Google Scholar]
- Caya, M.V.C.; Maramba, R.G.; Mendoza, J.S.D.; Suman, P.S. Characterization and Classification of Coffee Bean Types using Support Vector Machine. In Proceedings of the 2020 IEEE 12th International Conference on Humanoid, Nanotechnology, Information Technology, Communication and Control, Environment, and Management (HNICEM), Manila, Philippines, 3–7 December 2020. [Google Scholar] [CrossRef]
- Caya, M.V.C.; Cruz, F.R.G.; Blas, P.J.R.; Cagalingan, M.M.; Malbas, R.G.L.; Chung, W.Y. Determining spoilage level against time and temperature of tomato-based Filipino cuisines using E-nose. In Proceedings of the 2017 IEEE 9th International Conference on Humanoid, Nanotechnology, Information Technology, Communication and Control, Environment and Management (HNICEM), Manila, Philippines, 1–3 December 2017; pp. 1–5. [Google Scholar] [CrossRef]
- Caya, M.V.C.; Cruz, F.R.G.; Fernando, C.M.N.; Lafuente, R.M.M.; Malonzo, M.B.; Chung, W.Y. Monitoring and Detection of Fruits and Vegetables Spoilage in the Refrigerator using E-nose Based on Principal Component Analysis. In Proceedings of the 2019 IEEE 11th International Conference on Humanoid, Nanotechnology, Information Technology, Communication and Control, Environment, and Management (HNICEM), Laoag, Philippines, 29 November–1 December 2019; pp. 1–6. [Google Scholar] [CrossRef]
- Park, S.; Hong, S.-J.; Kim, S.; Ryu, J.; Roh, S.; Kim, G. Classification of Fresh and Frozen-Thawed Beef Using a Hyperspectral Imaging Sensor and Machine Learning. Agriculture 2023, 13, 918. [Google Scholar] [CrossRef]
- Caya, M.V.; Romero, D.K.R.; Castro, P.A. E-nose Based Classification of Drying Method Using Local Tea Leaves Gas Signature. In Proceedings of the 2021 IEEE 13th International Conference on Humanoid, Nanotechnology, Information Technology, Communication and Control, Environment, and Management (HNICEM), Manila, Philippines, 28–30 November 2021. [Google Scholar]
- Hortinela, C.C.; Balbin, J.R.; Fausto, J.C.; Espanillo, J.E.C.; Padilla, J.K.P. Detection of Staleness in Raw Chicken Meat Due to Salmonella spp. And Escherichia Coli Bacteria Using Metal Oxide Gas Sensor with Support Vector Machine. In Proceedings of the 2020 IEEE 12th International Conference on Humanoid, Nanotechnology, Information Technology, Communication and Control, Environment, and Management (HNICEM), Manila, Philippines, 3–7 December 2020. [Google Scholar] [CrossRef]


| Class | MQ-138 | MQ-135 | MQ-8 | MQ-2 |
|---|---|---|---|---|
| Frozen–thawed | 120 | 128 | 75 | 137 |
| Non-frozen | 8 | 114 | 72 | 136 |
Disclaimer/Publisher’s Note: The statements, opinions and data contained in all publications are solely those of the individual author(s) and contributor(s) and not of MDPI and/or the editor(s). MDPI and/or the editor(s) disclaim responsibility for any injury to people or property resulting from any ideas, methods, instructions or products referred to in the content. |
© 2025 by the authors. Licensee MDPI, Basel, Switzerland. This article is an open access article distributed under the terms and conditions of the Creative Commons Attribution (CC BY) license (https://creativecommons.org/licenses/by/4.0/).
Share and Cite
Artista, P.C.E.; Mendoza, A.M.; Padilla, D.A. Classification of Non-Frozen and Frozen–Thawed Pork with Adaptive Support Vector Machine and Electronic Nose. Eng. Proc. 2025, 92, 56. https://doi.org/10.3390/engproc2025092056
Artista PCE, Mendoza AM, Padilla DA. Classification of Non-Frozen and Frozen–Thawed Pork with Adaptive Support Vector Machine and Electronic Nose. Engineering Proceedings. 2025; 92(1):56. https://doi.org/10.3390/engproc2025092056
Chicago/Turabian StyleArtista, Paul Christian E., Abraham M. Mendoza, and Dionis A. Padilla. 2025. "Classification of Non-Frozen and Frozen–Thawed Pork with Adaptive Support Vector Machine and Electronic Nose" Engineering Proceedings 92, no. 1: 56. https://doi.org/10.3390/engproc2025092056
APA StyleArtista, P. C. E., Mendoza, A. M., & Padilla, D. A. (2025). Classification of Non-Frozen and Frozen–Thawed Pork with Adaptive Support Vector Machine and Electronic Nose. Engineering Proceedings, 92(1), 56. https://doi.org/10.3390/engproc2025092056