Abstract
Machine learning (ML) robustness for voice disorder detection was evaluated using reverberation-augmented recordings. Common vocal health assessment voice features from steady vowel samples (135 pathological, 49 controls) were used to train/test six ML classifiers. Detection performance was evaluated under low-reverb and simulated medium (med = 0.48 s) and high-reverb times (high = 1.82 s). All models’ performance declined with longer reverberation. Support Vector Machine exhibited slight robustness but faced performance challenges. Random Forest and Gradient Boosting, though strong under low reverb, lacked generalizability in med/high reverb. Training/testing ML on augmented data is essential to enhance their reliability in real-world voice assessments.
1. Introduction
Using voice and speech signals as a potential key marker of vocal health, machine learning (ML) has emerged as a powerful tool in automating voice quality quantification, voice assessment, and screening for voice disorders [1,2,3]. These capabilities hold great potential for monitoring treatment progress, tracking patient follow-ups, and improving accessibility to voice care [4,5].
Previous studies have demonstrated the high efficacy of ML models in classifying and identifying those with vocal abnormalities, dysfunctions, and voice disorders, which conditions are often linked to broader health conditions [6,7,8,9]. However, most of this research has relied on voice samples collected under highly controlled recording conditions, such as in soundproof rooms with minimal noise and reverberation [10,11,12]. These conditions do not reflect real-world clinical settings, which often involve varying levels of noise and reverberation [13,14,15]. As a result, ML’s generalizability is significantly restricted due to limited understanding of room condition effects. By addressing factors such as room reverberation effects, using larger dataset [16,17], incorporating diverse voice samples [7,18], applying model optimization techniques [19,20], and leveraging other advancements [21,22], ML’s reliability in clinical practice can be significantly enhanced [1,2,4].
This study addresses one part of this gap by evaluating the accuracy of ML models for voice disorder detection, where the samples were augmented to represent extreme, common, and low reverberation levels. By testing these models on samples from such diverse conditions, the study identifies robust models and strategies to take a step towards enhancing their generalizability—in other words, their real-world performance and clinical utility.
2. Materials and Methods
2.1. Voice Samples Under Simulated Room Acoustics
Voice audio samples from 49 vocally normal individuals and 135 patients with clinically diagnosed voice disorders were used. Each sample consisted of a sustained vowel /a:/ produced at habitual pitch and loudness, which was later trimmed to 3 s of vowel to capture a steady portion, excluding the onset and offset. Using steady portions of sustained vowels is common in voice assessment [23,24]. These audio samples were collected in an acoustically controlled room with low noise and reverberation and were recorded using a high-quality head-mounted microphone. The recordings were sampled at 44.1 kHz with 16-bit resolution. This setup served as the baseline for the study. The original dataset included 184 low-reverb 3 s trimmed audio samples. A training subset (80%) was created by randomly selecting low-reverb samples (training recordings) using a stratified technique for equal representation of both healthy speakers and patients.
The remaining 20% of the low-reverb recordings were retained as a testing subset for evaluating the ML models. From the low-reverb testing subset, two additional variants were created to simulate a recording from a more common reverberation scenario (e.g., standard clinic room) and a more extreme reverberation scenario (e.g., a large church). Common reverberation situations are between 0.35 and 0.6 s. In this case, the simulated common reverberation scenario, hereafter referred to as med reverb, was a T20 of 0.48 s. Extreme reverb times are longer than 1.2 s. In this case, the simulated extreme reverberation scenario, hereafter referred to as high reverb, was a T20 of 1.82 s. T20 is the time taken for the sound level to drop by 20 dB (from 5 to 25 dB), extrapolated to estimate reverb time for a 60 dB decay. T20 was computed from a simulated impulse response, as described in [25]. The reverberation effects for med reverb and high reverb were simulated using the Reverb effect in Audacity (version 2.4.1), an audio-editing software [25,26]. Audacity’s Reverb effect offers several preset room simulations. Audacity’s presets—Small Room Dark and Church Hall—were used to simulate the med and high reverb, respectively. These predefined settings were applied without modification to ensure reproducibility in future research. Therefore, three testing subsets were created with identical audio content but differing audio quality—including the original low-reverb samples with added reverb effects (37 samples × 3 = 111 test samples).
2.2. Machine Learning for Voice Disorder Screening
Twenty acoustic voice parameters were extracted from all audio recordings. These voice parameters were chosen as they are both common in the literature and represent various temporal, spectral, and cepstral features of the acoustic voice signal. These measures were computed using PRAAT version 6.0.13, a freely available software for voice/speech analysis [27]. The acoustic metrics generated from the low-reverb training samples (147 samples) formed a training set for training ML models. These models, implemented using the default Scikit-learn library in Python [28], were designed as binary classifiers to distinguish healthy and pathological samples. The models included Random Forest (RF) with 100 estimators, Gradient Boosting (GB) with 100 estimators, Support Vector Machine (SVM) with a radial basis function (RBF) kernel and balanced class weights, Extra Trees (ETs) with 100 estimators, AdaBoost (AB) with 50 estimators, and k-Nearest Neighbors (k-NN) with 5 neighbors. The default values for the remaining hyperparameters were used for each model [28].
Three different sets of features were extracted, corresponding to the three reverberation testing subsets: low, med, and high reverb. The ML testing features were used to evaluate classification performance. Each model was evaluated on each testing subset to assess its robustness against the three different reverb levels. The classifiers were evaluated by receiver operating characteristic (ROC) curves, Area Under the Curve (AUC), accuracy, and F-score to compare ML performance before and after adding reverberation.
3. Results
The results compare the ML models’ performance across three reverberation testing sample sets, testing the models’ sensitivity to simulated recording conditions. Figure 1 illustrates ROC curves for ML classifiers evaluated on three testing datasets (low, med, and high reverb). Sensitivity is plotted against the following metrics: Specificity under low reverb. (a) ROC curves for training (dashed) and testing sets are displayed, with selected testing set operating points shown. Most models demonstrate high sensitivity and specificity, with steeper ROC curves approaching the upper-left corner. Operating points vary, with some closer to the upper left, indicating better sensitivity–specificity trade-offs. Models like SVM and k-NN align more closely with the training curves. In high-reverb conditions (c), the performance of all the classifiers declines moderately, reflected in flatter ROC curves compared to the low-reverberation condition. SVM shows slightly better sensitivity and specificity compared to the other models, while RF exhibited a noticeable drop in performance. Under med reverb (b), the performance of all models further diminishes, with ROC curves approaching the diagonal—indicating operating points close to random and minimal discriminatory ability.
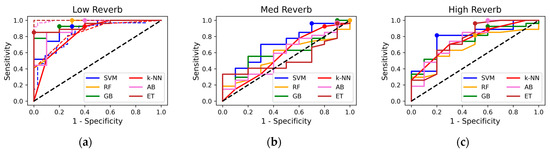
Figure 1.
Receiver operating characteristic curves for machine learning models: (a) Low-reverb test set (dashed = training set, dots = operating points), (b) med-reverb test set, (c) high-reverb test set.
The performance metrics—accuracy, F-score, and AUC—of the classifiers are plotted in Figure 2 across the three testing datasets. Overall, all models perform well (≥84 in all metrics) under low reverb but decline with med and high reverb. Under high reverb, SVM exhibits the highest scores with a smaller decline across all metrics, though its margin over other models is minimal. The figure, in contrast, shows that RF and GB achieved the highest scores across all metrics in the low-reverb condition, though these scores dropped noticeably, ranking among the lowest under the high reverb levels. The rest of the models also exhibited a clear decline in their accuracies, with med reverb yielding the weakest performance for all models.
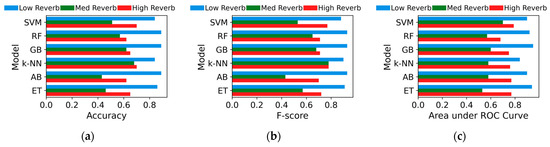
Figure 2.
(a) Accuracy, (b) F-score, (c) area under receiver operating characteristic (ROC) curves for machine learning models on low-, med-, and high-reverb test sets.
4. Discussion
This paper presents a comparative evaluation of various ML models for classifying voice samples as nonpathological or pathological. While previous studies have explored the potential of ML in classifying pathological and healthy voices from audio recordings, with promising results [1,2,4], this work tests the robustness of audio-based ML models for real-world situations by introducing room reverberation confounders. By augmenting the testing dataset with two simulated reverberation levels (med reverb and high reverb), creating more challenging versions of the recordings, this study takes a step forward in furthering the ML mode’s generalizability by identifying their robustness/sensitivity to common environments. The results highlight the varying robustness of ML models under simulated reverb levels. Interestingly, high reverb had less impact on performance compared to med reverb. Some acoustic features, like cepstral peak prominence, are more robust to reverberation, while time-domain metrics like shimmer and jitter are sensitive even to mild reverb [25,29,30]. This varying sensitivity of ML input features may explain the differences in performance. In med reverb, distortions might disrupt both sensitive and robust features, causing inconsistencies. High reverb may suppress sensitive features, making robust ones dominant and leading to more stable ML decisions. But these effects may be coincidental. Future research should explore how reverberation levels affect individual features’ robustness and their impact on ML performance.
SVM showed a smaller drop under high reverb but a large decline under med reverb. At the chosen boundary, training specificity/sensitivity (0.82/0.63) differed from testing (0.88/0.85), suggesting a mismatch between training and test decision statistics. This discrepancy may be due to suboptimal class boundaries or small sample size effects, explaining its lower-than-expected accuracy in low-reverb conditions (0.84) despite a high AUC (0.9). RF and GB revealed the best performance on the low-reverb recordings, but their accuracy dropped significantly with augmented recordings, revealing high sensitivity to environmental variability and limited generalizability. Enhancing feature selection, incorporating additional features, and optimizing hyperparameters may improve overall model robustness, but further investigation is needed [4]. These findings underscore the importance of evaluating models under challenging testing conditions, as high accuracy on clean datasets alone can be misleading. Real-world robustness requires testing with varied techniques and data collection environments to ensure reliable performance. Opportunities to further test the generalizability of ML models could be expanded from steady voice production to running speech, as well as a larger and more clinically diverse dataset.
5. Conclusions
Various ML models were evaluated for voice disorder classification from test samples with varying levels of simulated reverberation, replicating more realistic acoustic situations. All models showed a notable performance drop under reverberation. While SVM declined slightly less under high reverb, it still struggled with med reverb. RF and GB, despite strong low-reverb performance, showed reduced generalizability with augmented recordings under med and high reverb levels. These findings highlight the necessity of training and evaluating models on datasets that reflect real-world acoustic environments for reliable/practical support of voice quality and vocal health assessment.
Author Contributions
Conceptualization, A.M.Y. and E.J.H.; methodology, A.M.Y.; software, A.M.Y.; validation, E.J.H.; formal analysis, A.M.Y.; investigation, A.M.Y. and E.J.H.; resources, E.J.H.; data curation, A.M.Y. and E.J.H.; writing—original draft preparation, A.M.Y. and E.J.H.; writing—review and editing, E.J.H.; supervision, E.J.H.; project administration, E.J.H.; funding acquisition, E.J.H. All authors have read and agreed to the published version of the manuscript.
Funding
This research was funded by National Institute of Deafness and Other Communication Disorders of the National Institutes of Health, grant number R01DC012315.
Institutional Review Board Statement
Not applicable.
Informed Consent Statement
Not applicable.
Data Availability Statement
The data presented in this study are available on request from the corresponding author. The data are not publicly available due to ethical restrictions.
Acknowledgments
We also sincerely thank researchers around the world for their contributions to the fields of machine learning and vocal health.
Conflicts of Interest
The authors declare no conflicts of interest. The funders had no role in the design of the study; in the collection, analyses, or interpretation of data; in the writing of the manuscript; or in the decision to publish the results.
References
- Hegde, S.; Shetty, S.; Rai, S.; Dodderi, T. A Survey on Machine Learning Approaches for Automatic Detection of Voice Disorders. J. Voice 2019, 33, 947.e11–947.e33. [Google Scholar] [CrossRef] [PubMed]
- Idrisoglu, A.; Dallora, A.L.; Anderberg, P.; Berglund, J.S. Applied Machine Learning Techniques to Diagnose Voice-Affecting Conditions and Disorders: Systematic Literature Review. J. Med. Internet Res. 2023, 25, e46105. [Google Scholar] [CrossRef]
- Yousef, A.M. Laryngeal Mechanisms and Vocal Folds Function in Adductor Laryngeal Dystonia During Connected Speech. Ph.D. Dissertation, Michigan State University, East Lansing, MI, USA, 2023. [Google Scholar]
- Al-Hussain, G.; Shuweihdi, F.; Alali, H.; Househ, M.; Abd-Alrazaq, A. The Effectiveness of Supervised Machine Learning in Screening and Diagnosing Voice Disorders: Systematic Review and Meta-Analysis. J. Med. Internet Res. 2022, 24, e38472. [Google Scholar] [CrossRef]
- Yousef, A.M.; Deliyski, D.D.; Zacharias, S.R.; Naghibolhosseini, M. Detection of Vocal Fold Image Obstructions in High-Speed Videoendoscopy during Connected Speech in Adductor Spasmodic Dysphonia: A Convolutional Neural Networks Approach. J. Voice 2024, 38, 951–962. [Google Scholar] [CrossRef] [PubMed]
- Saidi, P.; Almasganj, F. Voice Disorder Signal Classification Using M-Band Wavelets and Support Vector Machine. Circuits Syst. Signal Process. 2015, 34, 2727–2738. [Google Scholar] [CrossRef]
- Sharma, R.K.; Gupta, A.K. Processing and Analysis of Human Voice for Assessment of Parkinson Disease. J. Med. Imaging Health Inform. 2016, 6, 63–70. [Google Scholar]
- Yousef, A.M.; Deliyski, D.D.; Zacharias, S.R.; Naghibolhosseini, M. Deep-Learning-Based Representation of Vocal Fold Dynamics in Adductor Spasmodic Dysphonia during Connected Speech in High-Speed Videoendoscopy. J. Voice 2025, 39, 570.e1–570.e15. [Google Scholar] [CrossRef]
- Yousef, A.M.; Deliyski, D.D.; Zayernouri, M.; Zacharias, S.R.; Naghibolhosseini, M. Deep Learning-Based Analysis of Glottal Attack and Offset Times in Adductor Laryngeal Dystonia. J. Voice 2023. epub ahead of print. [Google Scholar] [CrossRef]
- Leite, D.R.A.; de Moraes, R.M.; Lopes, L.W. Different Performances of Machine Learning Models to Classify Dysphonic and Non-Dysphonic Voices. J. Voice 2022, in press. [Google Scholar] [CrossRef]
- Rehman, M.U.; Shafique, A.; Jamal, S.S.; Gheraibia, Y.; Usman, A.B. Voice Disorder Detection Using Machine Learning Algorithms: An Application in Speech and Language Pathology. Eng. Appl. Artif. Intell. 2024, 133, 108047. [Google Scholar] [CrossRef]
- Chen, C.-C.; Hsu, W.-C.; Lin, T.-H.; Chen, K.-D.; Tsou, Y.-A.; Liu, Y.-W. Classification of Vocal Cord Disorders: Comparison Across Voice Datasets, Speech Tasks, and Machine Learning Methods. In Proceedings of the 2023 Asia Pacific Signal and Information Processing Association Annual Summit and Conference (APSIPA ASC), Taipei, Taiwan, 31 October–3 November 2023; IEEE: Piscataway, NJ, USA, 2023; pp. 1868–1873. [Google Scholar]
- Deliyski, D.D.; Evans, M.K.; Shaw, H.S. Influence of Data Acquisition Environment on Accuracy of Acoustic Voice Quality Measurements. J. Voice 2005, 19, 176–186. [Google Scholar] [CrossRef] [PubMed]
- Mealings, K.; Maggs, L.; Buchholz, J.M. The Effects of Classroom Acoustic Conditions on Teachers’ Health and Well-Being: A Scoping Review. J. Speech Lang. Hear. Res. 2024, 67, 346–367. [Google Scholar] [CrossRef]
- Marsano-Cornejo, M.-J.; Roco-Videla, Á. Variation of the Acoustic Parameters: F0, Jitter, Shimmer and Alpha Ratio in Relation with Different Background Noise Levels. Acta Otorrinolaringol. Engl. Ed. 2023, 74, 219–225. [Google Scholar] [CrossRef]
- Al-Nasheri, A.; Muhammad, G.; Alsulaiman, M.; Ali, Z. Investigation of Voice Pathology Detection and Classification on Different Frequency Regions Using Correlation Functions. J. Voice 2017, 31, 3–15. [Google Scholar] [CrossRef]
- Muhammad, G.; Alsulaiman, M.; Ali, Z.; Mesallam, T.A.; Farahat, M.; Malki, K.H.; Al-Nasheri, A.; Bencherif, M.A. Voice Pathology Detection Using Interlaced Derivative Pattern on Glottal Source Excitation. Biomed. Signal Process. Control 2017, 31, 156–164. [Google Scholar] [CrossRef]
- Rani, K.U.; Holi, M.S. GMM Classifier for Identification of Neurological Disordered Voices Using MFCC Features. IOSR J. VLSI Signal Process. 2015, 4, 44–51. [Google Scholar]
- Uloza, V.; Verikas, A.; Bacauskiene, M.; Gelzinis, A.; Pribuisiene, R.; Kaseta, M.; Saferis, V. Categorizing Normal and Pathological Voices: Automated and Perceptual Categorization. J. Voice 2011, 25, 700–708. [Google Scholar] [CrossRef] [PubMed]
- Yousef, A.M.; Deliyski, D.D.; Zacharias, S.R.; de Alarcon, A.; Orlikoff, R.F.; Naghibolhosseini, M. A Hybrid Machine-Learning-Based Method for Analytic Representation of the Vocal Fold Edges during Connected Speech. Appl. Sci. 2021, 11, 1179. [Google Scholar] [CrossRef]
- Agarwal, A.; Chandrayan, S.; Sahu, S.S. Prediction of Parkinson’s Disease Using Speech Signal with Extreme Learning Machine. In Proceedings of the 2016 international conference on electrical, electronics, and optimization techniques (ICEEOT), Chennai, India, 3–5 March 2016; IEEE: Piscataway, NJ, USA, 2016; pp. 3776–3779. [Google Scholar]
- Teixeira, J.P.; Fernandes, P.O.; Alves, N. Vocal Acoustic Analysis–Classification of Dysphonic Voices with Artificial Neural Networks. Procedia Comput. Sci. 2017, 121, 19–26. [Google Scholar] [CrossRef]
- Maryn, Y.; Roy, N. Sustained Vowels and Continuous Speech in the Auditory-Perceptual Evaluation of Dysphonia Severity. J. Soc. Bras. Fonoaudiol. 2012, 24, 107–112. [Google Scholar] [CrossRef]
- Castillo-Allendes, A.; Codino, J.; Cantor-Cutiva, L.C.; Nudelman, C.J.; Rubin, A.D.; Barsties V Latoszek, B.; Hunter, E.J. Clinical Utility and Validation of the Acoustic Voice Quality and Acoustic Breathiness Indexes for Voice Disorder Assessment in English Speakers. J. Clin. Med. 2023, 12, 7679. [Google Scholar] [CrossRef] [PubMed]
- Yousef, A.M.; Hunter, E.J. Sensitivity of Acoustic Voice Quality Measures in Simulated Reverberation Conditions. Bioengineering 2024, 11, 1253. [Google Scholar] [CrossRef] [PubMed]
- Yousef, A.M.; Hunter, E.J. Male-Female Specific Changes in Voice Parameters under Varying Room Acoustics. Proc. Meet. Acoust. 2024, 55, 060001. [Google Scholar] [PubMed]
- Boersma, P. Praat, a System for Doing Phonetics by Computer. Glot Int. 2001, 5, 341–345. [Google Scholar]
- Pedregosa, F.; Varoquaux, G.; Gramfort, A.; Michel, V.; Thirion, B.; Grisel, O.; Blondel, M.; Prettenhofer, P.; Weiss, R.; Dubourg, V. Scikit-Learn: Machine Learning in Python. J. Mach. Learn. Res. 2011, 12, 2825–2830. [Google Scholar]
- Yousef, A.M.; Hunter, E.J. How Do Room Acoustics Impact Machine Learning Accuracy in Voice Disorder Detection? In Proceedings of the 1st International Online Conference on Bioengineering Session Biosignal Processing, Online, 16–18 October 2024; MDPI: Basel, Switzerland, 2024. [Google Scholar]
- Yousef, A.M.; Hunter, E.J. Effect of Data Collection and Environment on Machine Learning Performance in Screening Dysphonia. In Proceedings of the the 1st International Online Conference on Bioengineering, Session Biosignal Processing, Online, 16–18 October 2024; MDPI: Basel, Switzerland, 2024. [Google Scholar]


Disclaimer/Publisher’s Note: The statements, opinions and data contained in all publications are solely those of the individual author(s) and contributor(s) and not of MDPI and/or the editor(s). MDPI and/or the editor(s) disclaim responsibility for any injury to people or property resulting from any ideas, methods, instructions or products referred to in the content. |
© 2025 by the authors. Licensee MDPI, Basel, Switzerland. This article is an open access article distributed under the terms and conditions of the Creative Commons Attribution (CC BY) license (https://creativecommons.org/licenses/by/4.0/).