You are currently viewing a new version of our website. To view the old version click .
Engineering Proceedings
  • Proceeding Paper
  • Open Access

30 April 2025

Cotton T-Shirt Size Estimation Using Convolutional Neural Network †

,
and
School of Electrical, Electronics, and Computer Engineering, Mapúa University, Manila 1002, Philippines
*
Author to whom correspondence should be addressed.
Presented at the 2024 IEEE 6th Eurasia Conference on IoT, Communication and Engineering, Yunlin, Taiwan, 15–17 November 2024.
This article belongs to the Proceedings 2024 IEEE 6th Eurasia Conference on IoT, Communication and Engineering

Abstract

Online shopping has become popular due to its convenience and potential cost savings. However, clothing size cannot be accurately estimated, particularly when buying shirts. Many shoppers provide size choices but with inaccurate fits. To assist users in selecting the correct size when purchasing t-shirts online, we estimated shirt size using calculated upper body dimensions. Computer vision algorithms, including YOLO, PoseNet, body contour detection, and a trained convolutional neural network (CNN) model were employed to estimate shirt sizes from 2D images. The model was tested using images of 30 participants taken at a distance of 180–185 cm away from a Raspberry Pi camera. The estimation accuracy was 70%. Inaccurate predictions were attributed to the precision of body measurements from computer vision and image quality, which needs to be solved in further studies.

1. Introduction

Online shopping has become the new normal when buying items. It is convenient and cheaper due to coupons and promotions that entice people to buy online rather than at shops. Online shoppers are mainly teens and young adults as they are more engaged online []. Studies on online shopping highlighted impulsive buying behavior, particularly on live shopping platforms, which are often associated with clothing purchases []. Issues such as incorrect sizing frequently lead to product returns, resulting in additional shipping costs []. In response, researchers have explored the use of computer vision and machine learning to estimate body measurements for accurate sizing.
In previous studies, body measurement techniques were explored and implemented using computer vision. In estimating body measurements using 2D photos taken by smartphones, a system achieved 81.47% accuracy for linear measurements and 72.18% for circular measurements by utilizing the data from the Max Planck Institute for Informatics (MPII) and common objects in context (COCO) []. The Haar Cascade classifier and support vector machines (SVMs) were used to estimate body measurements, with the upper body achieving 31.20% accuracy, the lower body 51.00%, and the full body showing a lower accuracy of 28.60% []. Other techniques include image processing with a laser pointer to measure object dimensions [] and OpenCV for real-time object detection []. Three-dimensional models and the skinned multi-person linear model (SMPL) are used in predicting sizes from full-frontal and side images for clothing measurements []. Other machine-learning approaches are applied to size recommendation systems using RGB images []. These technologies are applied in medical applications. For example, Euclidean distance measurements are used to detect Valgus and Varus diseases []. Additionally, contour detection is applied to detect the edges and shapes of human body images, which are crucial for body measurement estimation [,]. A 95% accuracy was obtained in measuring body dimensions using this method []. Convolutional neural networks (CNNs) are widely used in various applications, including identifying medicinal mushrooms [], classifying white blood cells [], and diagnosing plant diseases [,]. CNNs and YOLO algorithms are sometimes combined to detect Otitis Media infections [] and differentiate between skin conditions []. To detect intestinal parasites in dogs, CNNs and the AlexNet model were used and the detection accuracy was 96% []. Confusion matrices were calculated to calculate the accuracy of machine learning models. An SVM model classified coffee bean types with 70% accuracy [] and identified yellow spot disease in sugarcane leaves with 86.67% accuracy [,]. A CNN-based system for detecting nutrient deficiencies in onion leaves showed an accuracy of 83% [].
Even with the popularity of shopping online nowadays for clothes, inevitably, the clothes cannot be tried on online. Sizing charts are provided, but the data might not be accurate. Therefore, an upper body measurement estimation method must be developed to choose the correct size.
We developed such a system using machine learning to estimate a person’s t-shirt size from upper body measurements. We used a Raspberry Pi camera to capture a 2D body image. By implementing pose detection, contour detection, and CNN algorithms, the size was classified. The accuracy of the developed system was calculated using a confusion matrix.

2. Methodology

In this study, we measured the body’s upper half of males for classification. The lower half of the body was not included in the input of the system. A total of 30 males participated in the measurement. A total of 80% of the data were used for training, while 20% were used for validation and testing. For the t-shirt measurement, the chest width and shoulder width were used. The sizing chart in Table 1 was used in the system as it is used in online stores.
Table 1. Regular fit sizing chart.
The system included the following T-shirt sizes: small (S), medium (M), large (L), extra-large (XL), and double extra-large (2XL). Other shirt types and sizes were considered. The size was used for regular-fit cotton T-shirts. The system required 2D front images taken at a distance of 180–185 cm from the camera. The camera was connected to a Raspberry Pi. CNN was used to classify the specified sizes, and a confusion matrix was used to determine the system’s accuracy.
Figure 1 shows the process of the system. A Raspberry Pi 4 camera module was used to capture 2D body images as input for t-shirt size estimation. After capturing the image, YOLO detection, pose estimation, and contour detection were applied. YOLO detected the person to eliminate background noise, while pose estimation identified body landmarks on the chest for chest width measurement. Upper body contour detection was used to calculate the shoulder width. The system estimated body measurements based on the distances between chest and shoulder, which were fed into a CNN trained on labeled t-shirt sizes. CNN classified the subject’s body type and output the estimated cotton t-shirt size, which was displayed on an LCD. Moreover, VMCs provide a step-up output voltage at lower duty ratios, offering an additional advantage [].
Figure 1. Conceptual framework.

2.1. Hardware

Figure 2 illustrates the hardware block diagram of the system. The hardware components included a camera for capturing 2D images and Raspberry Pi 4 as a microcontroller. The power supply and HDMI connections were used.
Figure 2. Hardware block diagram of system.

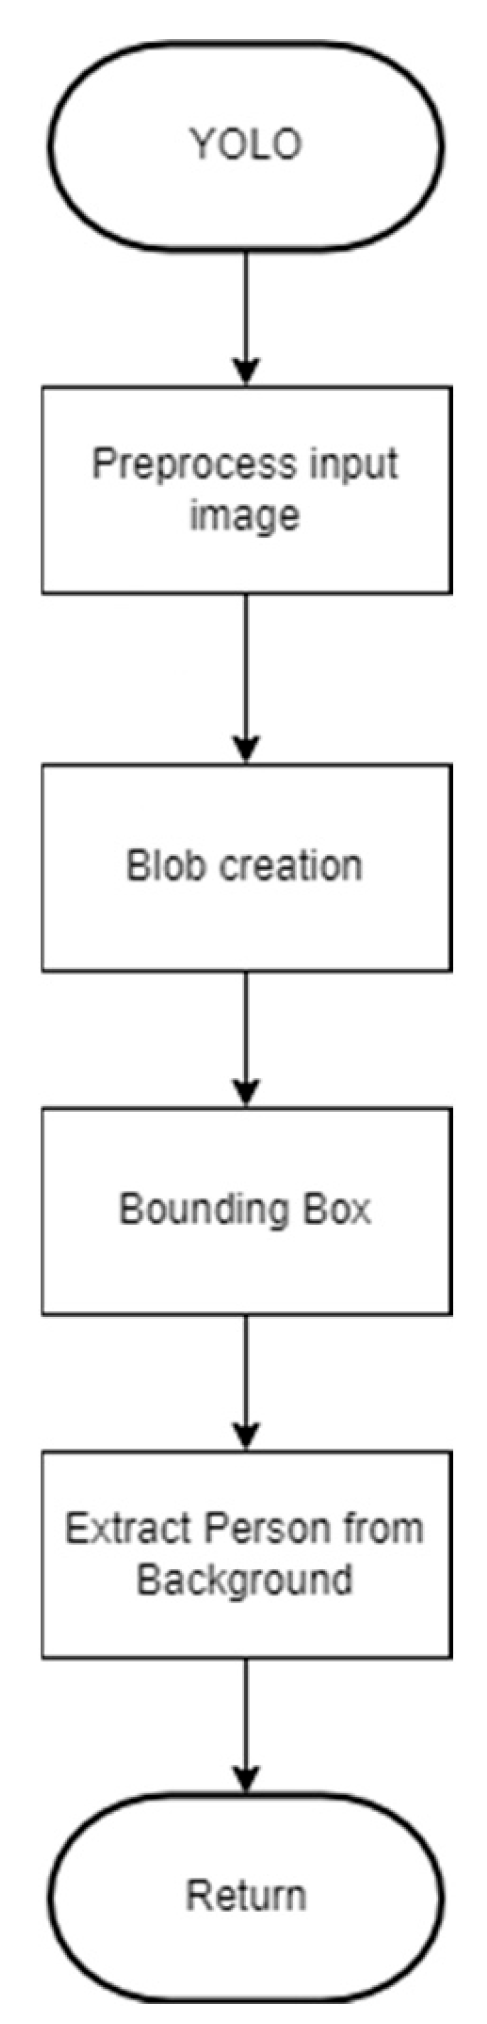
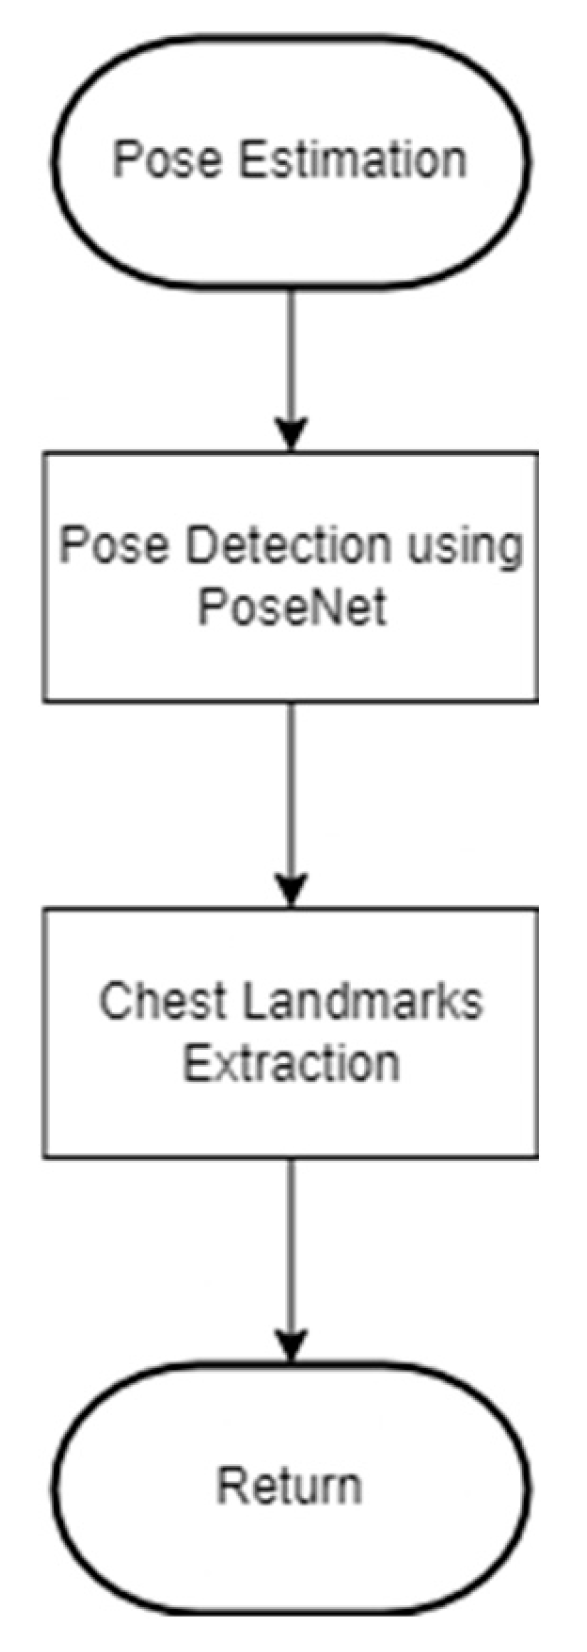
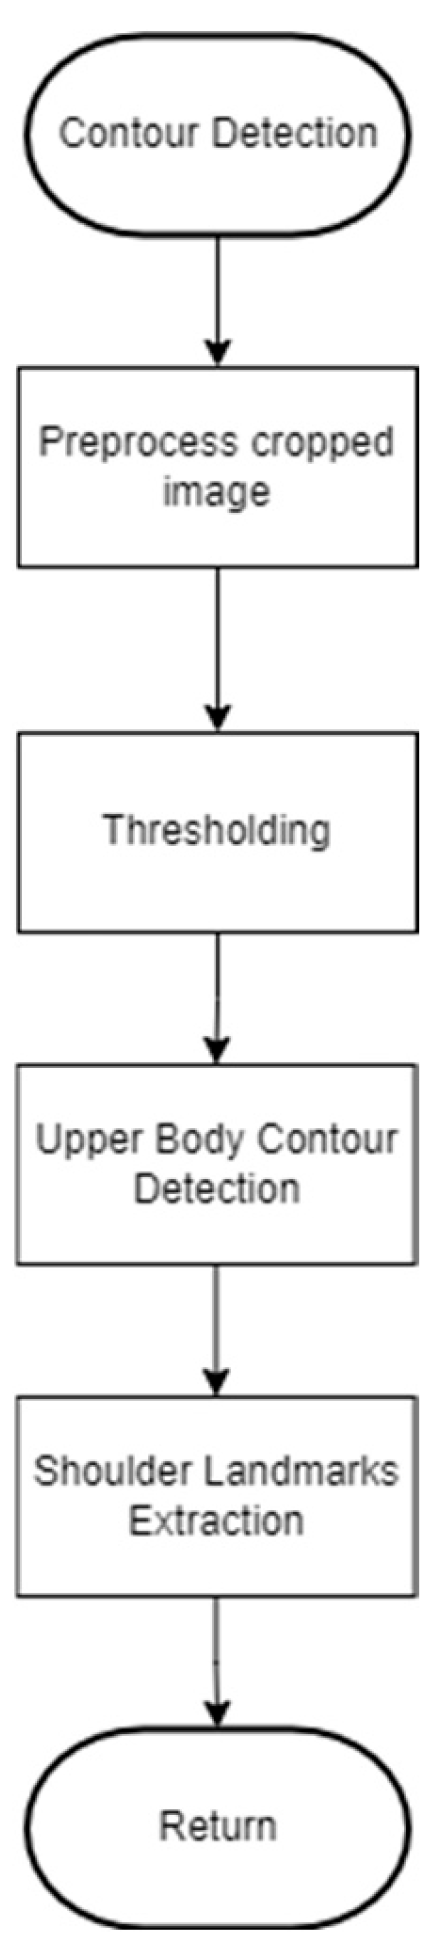
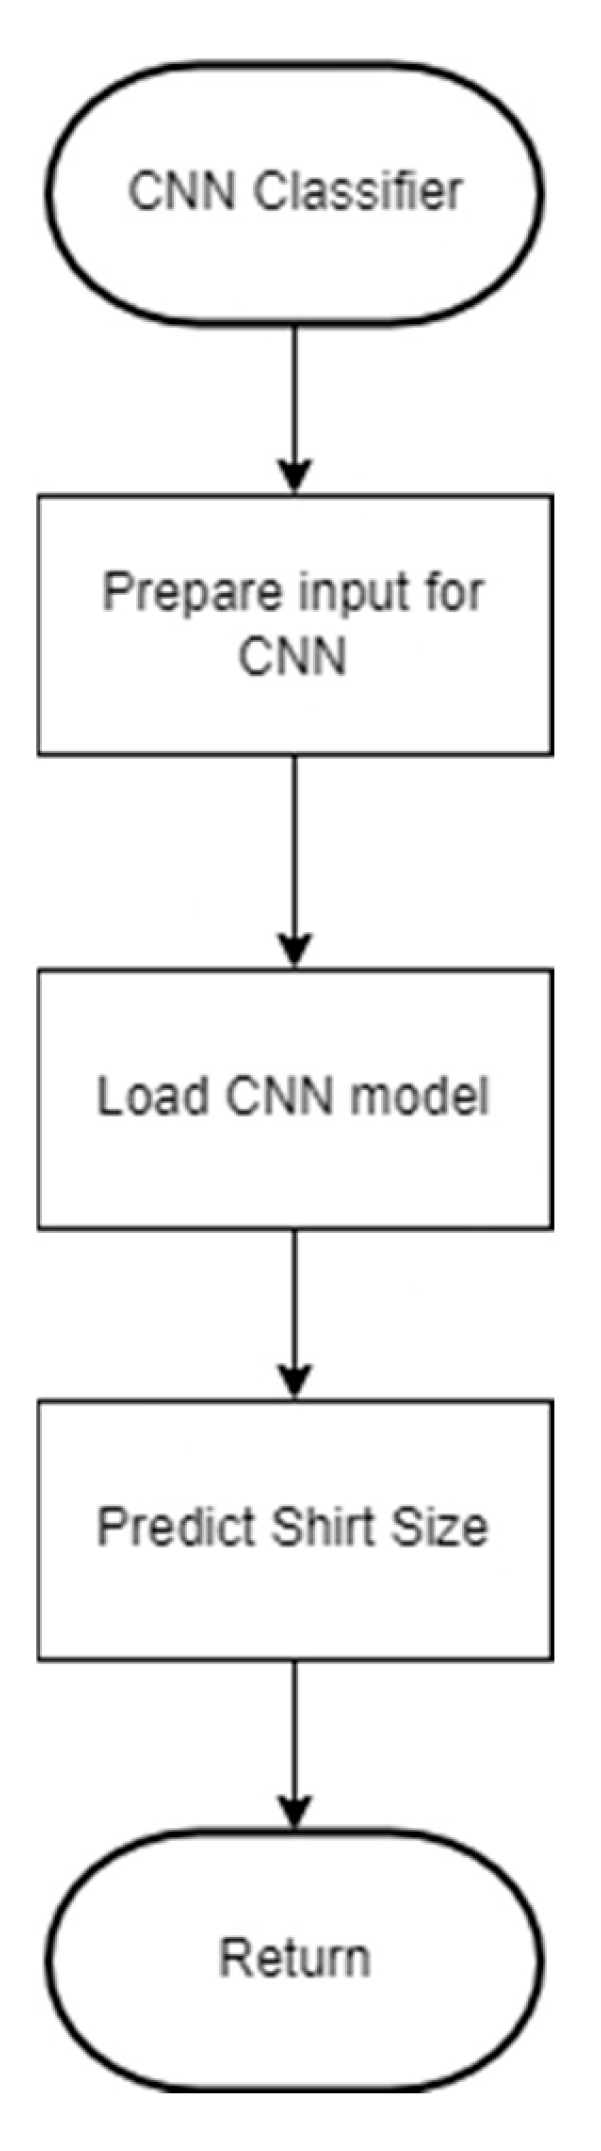
2.2. Software Development

Figure 3 depicts the software process of the system. The process began with capturing a 2D image of the upper body, which served as the system’s input. YOLO V3 was then used for person detection to isolate the area of interest. PoseNet performed pose estimation to identify key body landmarks, focusing on the shoulder. The coordinates of the left and right shoulders were extracted and utilized as “chest landmarks” for calculating the chest width in pixels. Next, the upper body contour was detected to identify the edges of the subject for the precise placement of shoulder landmarks and calculation of the shoulder width. These algorithms were implemented using open-source computer vision (OpenCV v.4.8.1). The distance was measured to determine the shoulder and chest widths by calculating the Euclidean distances between specific points on the upper body in pixels. These pixel measurements were converted to inches using a pixel-to-inch ratio obtained from a reference image such as a chessboard. The CNN model processed the calculated shoulder and chest widths to predict the shirt size (e.g., small, medium, large). The predicted size was displayed on an LCD for the user.
Figure 3. System flowchart.
Figure 4 shows the flowchart for the YOLO detection. The YOLO detection process started with preprocessing the input image by resizing it to a resolution of 1080 × 720 to ensure a uniform input size. Subsequently, the image was converted into a format for the neural network through blob creation, which scaled, normalized, and rearranged the pixel data into a 4D array. YOLO applied bounding box detection to locate the individual within the image. The detected person was cropped from the background by cropping based on the bounding box coordinates. The cropped image of the individual was used for further processing.
Figure 4. YOLO flowchart.
The pose estimation process started with PoseNet which analyzed the image of the detected person and identified key body landmarks as shown in Figure 5. Following the detection of these pose landmarks, chest landmark extraction was performed. In this stage, the coordinates for the left and right chest were pinpointed. Given that the shoulder landmarks identified by PoseNet were closer to the chest, they were referred to as “chest landmarks”. These landmarks were essential for calculating the chest width and once extracted, they were used for subsequent processing or analysis.
Figure 5. Pose estimation process.
The contour detection started with preprocessing the cropped image obtained from YOLO to improve its quality. This converted the image to grayscale and applied Gaussian blur to minimize noise. Then, thresholding was used to create a binary image for contour detection. The algorithm subsequently identified the upper body contours within this binary image. After detecting the contours, the shoulder landmarks were extracted from the largest contour to ensure precise measurements. Finally, the detected shoulder landmarks were returned for further analysis or application (Figure 6).
Figure 6. Contour detection.
The distance measurement process started by extracting the x and y coordinates of key landmarks, such as the shoulders and chest. These coordinates were obtained through pose estimation and contour detection. Then, the distance between these coordinates was calculated. Since the result was in pixels, it was converted to inches before returning the value for further processing. The Euclidean distance, representing the number of pixels between the landmarks, was computed using (1) (Figure 7).
N u m b e r   o f   P i x e l s   =   x 2 x 1 2 + y 2 y 1 2
where x 1 and y 1 represent the coordinates of the left point, while x 2 and y 2 represent the coordinates of the right poin.
Figure 7. Distance measurement.
The pixel was converted to inches using a reference image featuring a chessboard. The ‘findChessboardCorners’ function from OpenCV was employed to determine the pixel-to-inch ratio. Once this ratio was obtained, pixels were converted to inches using (2).
M e a s u r e m e n t   i n   i n c h e s   =   N u m b e r   o f   P i x e l s P i x e l t o i n c h   r a t i o    
CNN prepared the input data by collecting the computed shoulder and chest widths. The pre-trained CNN model loaded and processed the data to predict the shirt size based on the provided chest and shoulder measurements as shown in Figure 8.
Figure 8. Process of CNN classifier.

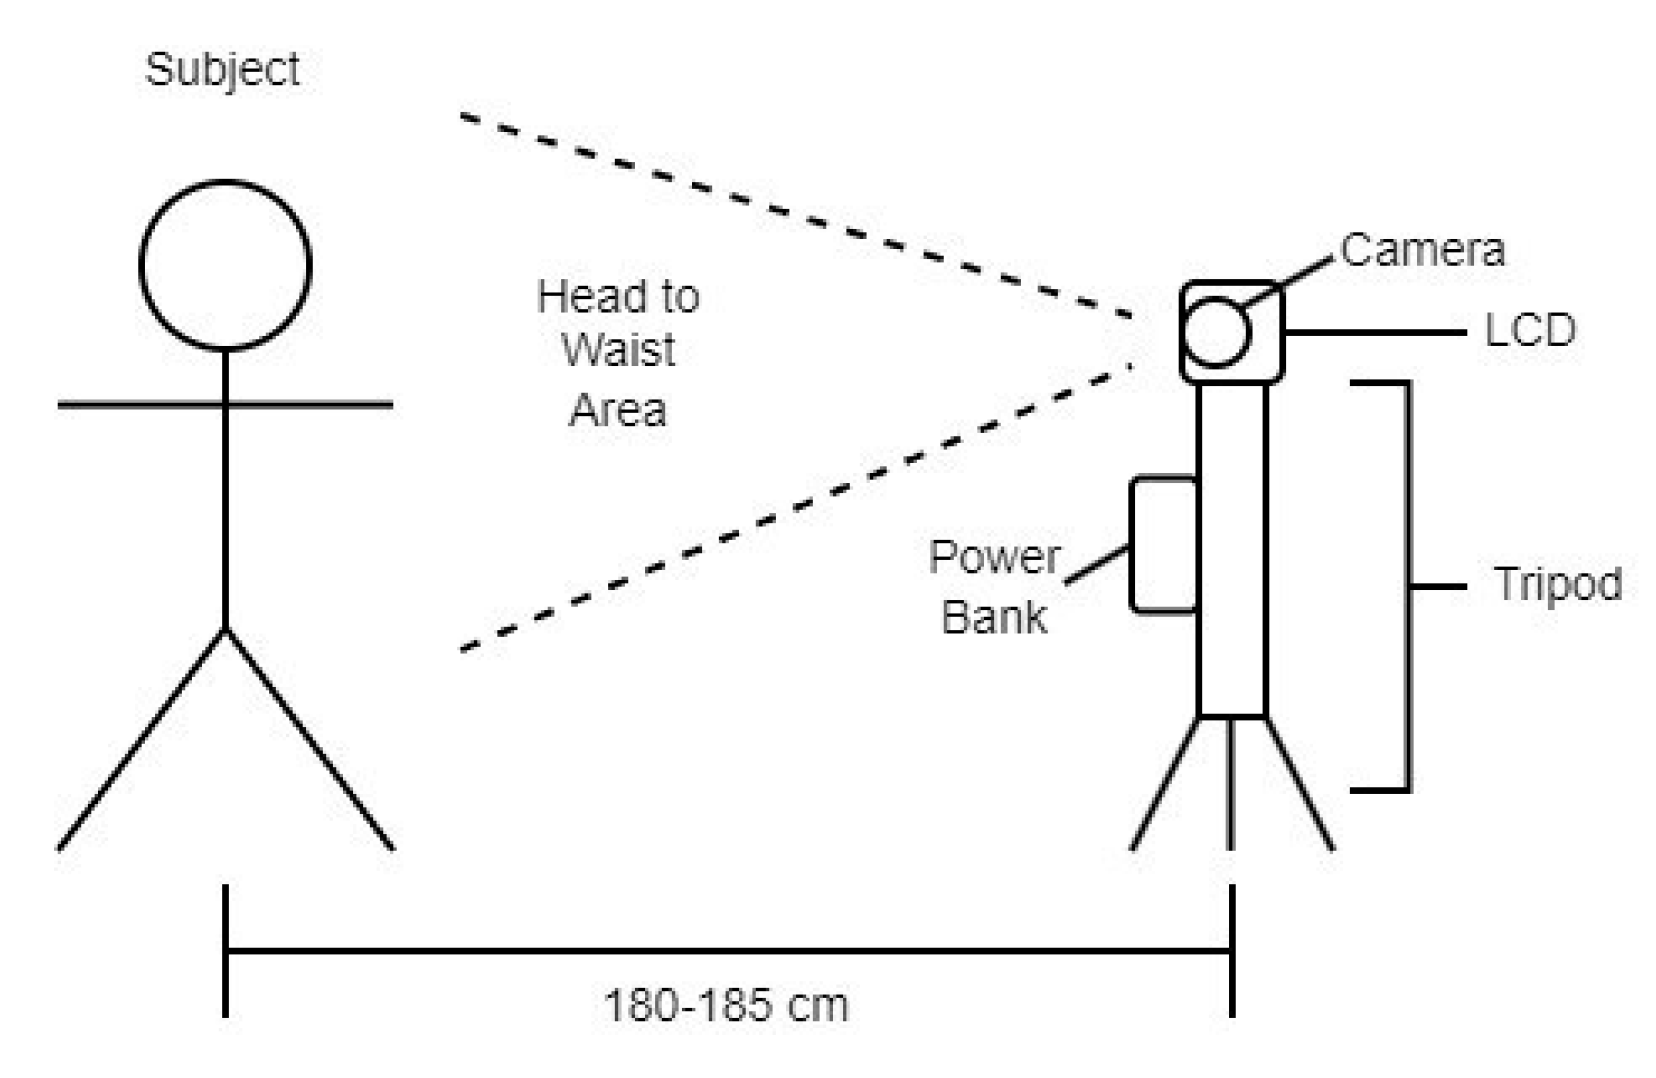
2.3. Experimental Setup

The camera and system were mounted on a tripod and positioned at a distance of 180 to 185 cm from the subject (Figure 9).
Figure 9. Experimental setup.
The camera captured the area from the subject’s head to the waist to provide the necessary input for the system. To use the system, the user stood in front of the camera and waited for a few seconds while the system captured and processed the image. Then, the user clicked the “predict size” button on the LCD, the predicted shirt size was displayed.

2.4. Data Gathering

Figure 10 shows the sample of a predicted shirt size in a GUI after the application of different computer vision techniques and a trained CNN model.
Figure 10. Predicted shirt size.

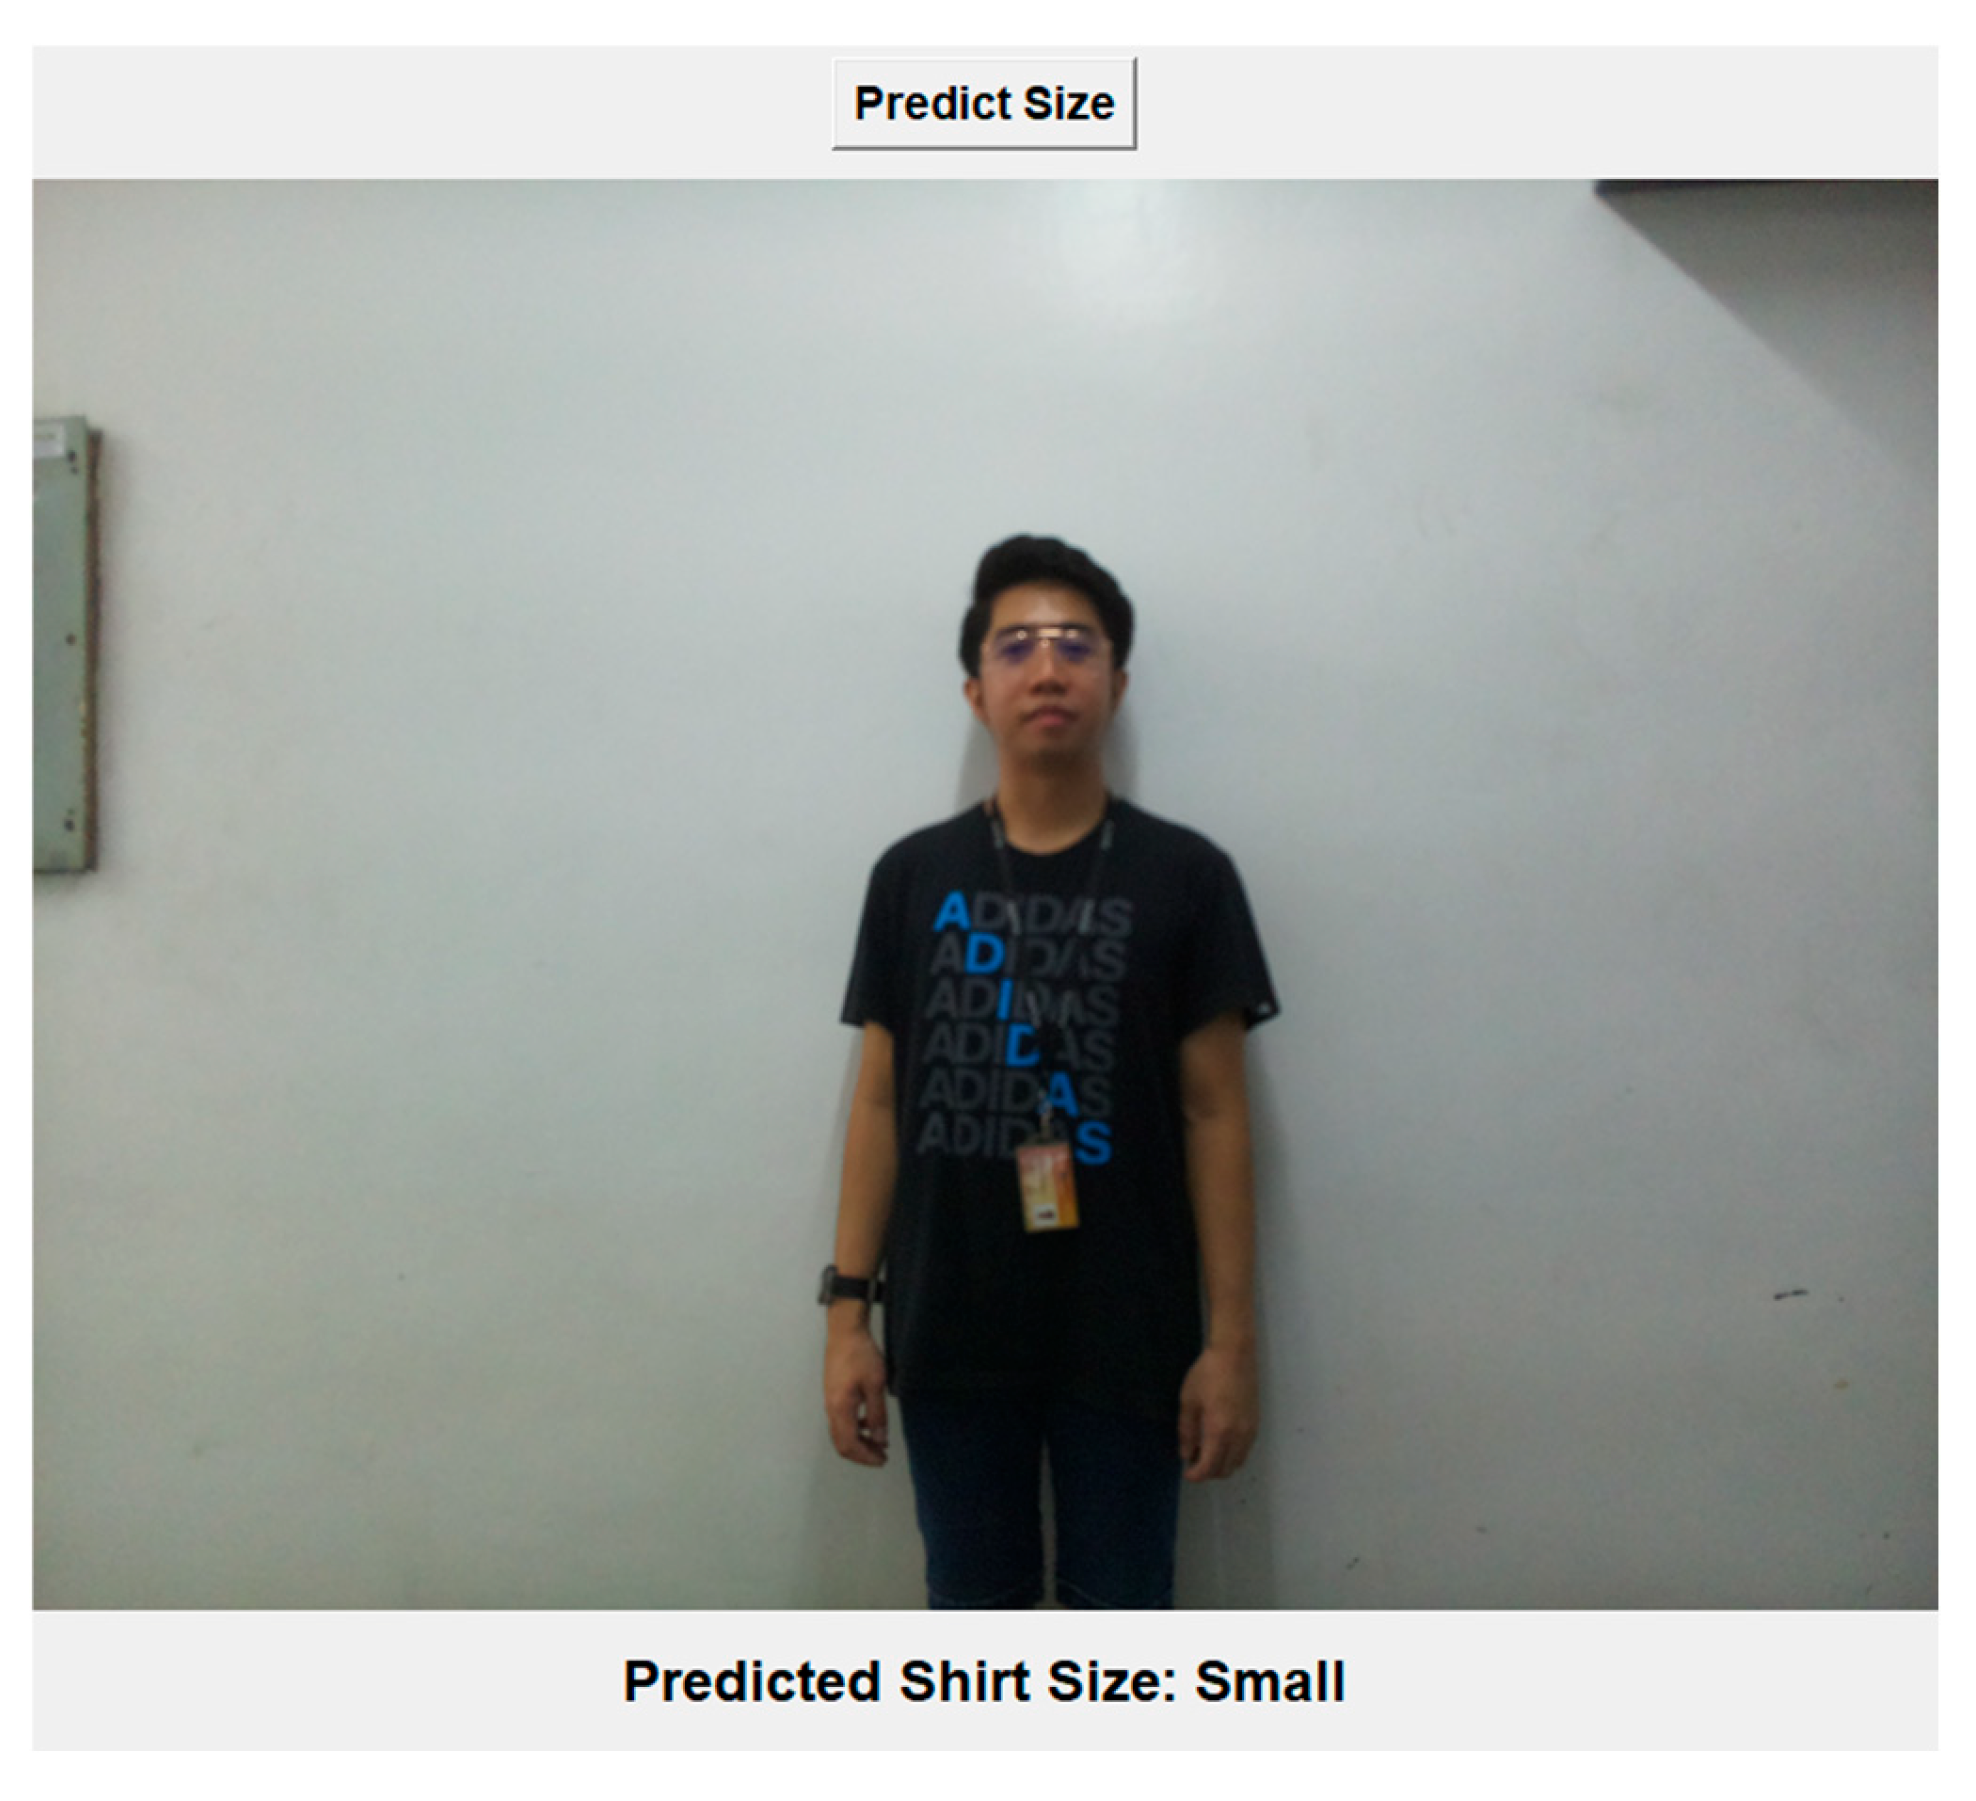
3. Results and Discussions

A c c u r a c y = T r u e P o s i t i v e T o t a l S a m p l e s 100
A c c u r a c y = 4 + 5 + 4 + 3 + 5 30 100 = 70 %
After acquiring 30 new images for CNN model testing, the accuracy and precision of the model were calculated by matching the model’s predictions with the actual shirt sizes for each image. Of the 30 images tested, the model accurately predicted the shirt size for 21 images, resulting in a 70% accuracy rate as tabulated in Table 2.
Table 2. Confusion matrix.

4. Conclusion and Recommendation

Using CNN, we predicted shirt sizes from 2D images successfully. The system integrated YOLO for person detection, PoseNet for pose estimation and chest landmark identification, and contour detection for shoulder measurement, allowing for accurate extraction of chest and shoulder widths from images captured using the Raspberry Pi camera module 2. Due to the limited size of the dataset used to train the CNN, data augmentation was applied to increase the number of samples to balance the shirt size categories. When tested on new data, the model achieved an accuracy of 70% which was calculated using a confusion matrix. Factors influencing the model’s accuracy included the precision of shoulder and chest measurements obtained using computer vision techniques and the quality and consistency of the images. Variations in these factors impacted the model’s performance and prediction accuracy.
It is necessary to increase the dataset size and diversity to improve the CNN model’s robustness and generalizability. A dataset with more data enables the model to more learn accurate features, leading to better performance. Incorporating features of body types (ectomorph, mesomorph, endomorph), waist measurements, or height enhances the accuracy of predictions. The distance for image capture must be diversified as long as the upper body is visible. Optimizing different CNN architectures and hyperparameters is also recommended to identify the best model for shirt size prediction. Implementing transfer learning with pre-trained models is required to enhance performance by utilizing existing knowledge.

Author Contributions

Conceptualization, J.K.D.A., C.J.G.C. and J.F.V.; methodology, C.J.G.C.; software, C.J.G.C.; validation, J.K.D.A., C.J.G.C. and J.F.V.; investigation, J.K.D.A.; resources, J.K.D.A.; data curation, J.K.D.A.; writing—original draft preparation, J.K.D.A.; writing—review and editing, C.J.G.C.; visualization, C.J.G.C.; supervision, J.F.V.; project administration, J.F.V. All authors have read and agreed to the published version of the manuscript.

Funding

This research received no external funding.

Institutional Review Board Statement

Not applicable.

Data Availability Statement

The data are contained within the article.

Conflicts of Interest

The authors declare no conflict of interest.

References

  1. Mohamad, S.R.; Zainuddin, S.A.; Hashim, N.A.A.N.; Abdullah, T.; Anuar, N.I.M.; Deraman, S.N.S.; Azmi, N.F.; Razali, N.A.M.; Zain, E.N.M. Validating the measuring instrument for the determinants of social commerce shopping intention among teenagers. Eur. J. Mol. Clin. Med. 2020, 7, 1877–1881. [Google Scholar]
  2. Li, Y.; Shu, H. Research on Online Interaction and Consumer Impulsive Buying Behavior in Live Shopping Platform Based on the Structural Equation Model. In Proceedings of the 2021 International Conference on Management Science and Software Engineering (ICMSSE), Chengdu, China, 9–11 July 2021; pp. 72–76. [Google Scholar]
  3. Berthene, A. Sizing Issue Is a Top Reason Shoppers Return Online Orders. Available online: https://www.digitalcommerce360.com/2019/09/12/sizing-issue-is-a-top-reason-shoppers-return-online-orders/ (accessed on 12 September 2019).
  4. Dewan, D.; Chapain, B.; Jaiswal, M.; Kumar, S. Estimate human body measurement from 2D image using computer vision. J. Emerg. Technol. Innov. Res. 2022, 9, 438–445. [Google Scholar]
  5. Ashmawi, S.; Alharbi, M.; Almaghrabi, A.; Alhothali, A. Fitme: Body Measurement Estimations Using Machine Learning Method. Procedia Comput. Sci. 2019, 163, 209–217. [Google Scholar] [CrossRef]
  6. Jawad, H.M.; Husain, T.A. Measuring Object Dimensions and Its Distances Based on Image Processing Technique by Analysis the Image Using Sony Camera. Eurasian J. Sci. Eng. 2017, 3, 100–110. [Google Scholar] [CrossRef]
  7. Othman, N.A.; Salur, M.U.; Karakose, M.; Aydin, I. An Embedded Real-Time Object Detection and Measurement of its Size. In Proceedings of the 2018 International Conference on Artificial Intelligence and Data Processing (IDAP), Malatya, Turkey, 28–30 September 2018; pp. 1–4. [Google Scholar]
  8. Thota, K.S.P.; Suh, S.; Zhou, B.; Lukowicz, P. Estimation of 3d Body Shape And Clothing Measurements From Frontal-And Side-View Images. In Proceedings of the 2022 IEEE International Conference on Image Processing (ICIP), Bordeaux, France, 16–19 October 2022; pp. 2631–2635. [Google Scholar]
  9. Aly, S.; Abdallah, A.; Sherif, S.; Atef, A.; Adel, R.; Hatem, M. Toward Smart Internet of Things (IoT) for Apparel Retail Industry: Automatic Customer’s Body Measurements and Size Recommendation System using Computer Vision Techniques. In Proceedings of the 2021 Second International Conference on Intelligent Data Science Technologies and Applications (IDSTA), Tartu, Estonia, 15–17 November 2021; pp. 99–104. [Google Scholar]
  10. Nijjar, R.K.; Tan, J.R.G.; Linsangan, N.B.; Adtoon, J.J. Valgus and Varus Disease Detection using Image Processing. In Proceedings of the 2020 IEEE 12th International Conference on Humanoid, Nanotechnology, Information Technology, Communication and Control, Environment, and Management (HNICEM), Manila, Philippines, 3–7 December 2020; pp. 1–6. [Google Scholar]
  11. Gong, X.-Y.; Su, H.; Xu, D.; Zhang, Z.-T.; Shen, F.; Yang, H.-B. An Overview of Contour Detection Approaches. Int. J. Autom. Comput. 2018, 15, 656–672. [Google Scholar] [CrossRef]
  12. Yang, D.; Peng, B.; Al-Huda, Z.; Malik, A.; Zhai, D. An overview of edge and object contour detection. Neurocomputing 2022, 488, 470–493. [Google Scholar] [CrossRef]
  13. Singh, D.; Panthri, S.; Venkateshwari, P. Human Body Parts Measurement using Human Pose Estimation. In Proceedings of the 2022 9th International Conference on Computing for Sustainable Global Development (INDIACOM), New Delhi, India, 23–25 March 2022; pp. 288–292. [Google Scholar]
  14. Sutayco, M.J.Y.; Caya, M.V.C. Identification of Medicinal Mushrooms using Computer Vision and Convolutional Neural Network. In Proceedings of the 2022 6th International Conference on Electrical, Telecommunication and Computer Engineering (ELTICOM), Medan, Indonesia, 22–23 November 2022; pp. 167–171. [Google Scholar]
  15. Macawile, M.J.; Quinones, V.V.; Ballado, A.; Cruz, J.D.; Caya, M.V. White blood cell classification and counting using convolutional neural network. In Proceedings of the 2018 3rd International Conference on Control and Robotics Engineering (ICCRE), Nagoya, Japan, 20–23 April 2018; pp. 259–263. [Google Scholar]
  16. Buenconsejo, L.T.; Linsangan, N.B. Classification of Healthy and Unhealthy Abaca leaf using a Convolutional Neural Network (CNN). In Proceedings of the 2021 IEEE 13th International Conference on Humanoid, Nanotechnology, Information Technology, Communication and Control, Environment, and Management (HNICEM), Manila, Philippines, 28–30 November 2021; pp. 1–5. [Google Scholar]
  17. Muhali, A.S.; Linsangan, N.B. Classification of Lanzones Tree Leaf Diseases Using Image Processing Technology and a Convolutional Neural Network (CNN). In Proceedings of the 2022 IEEE International Conference on Artificial Intelligence in Engineering and Technology (IICAIET), Kota Kinabalu, Malaysia, 13–15 September 2022; pp. 1–6. [Google Scholar]
  18. Elabbas, A.I.; Khan, K.K.; Hortinela, C.C. Classification of Otitis Media Infections using Image Processing and Convolutional Neural Network. In Proceedings of the 2021 IEEE 13th International Conference on Humanoid, Nanotechnology, Information Technology, Communication and Control, Environment, and Management (HNICEM), Manila, Philippines, 28–30 November 2021; pp. 1–6. [Google Scholar]
  19. Padilla, D.; Yumang, A.; Diaz, A.L.; Inlong, G. Differentiating Atopic Dermatitis and Psoriasis Chronic Plaque Using Convolutional Neural Network MobileNet Architecture. In Proceedings of the 2019 IEEE 11th International Conference on Humanoid, Nanotechnology, Information Technology, Communication and Control, Environment, and Management (HNICEM), Laoag, Philippines, 29 November01 December 2019; pp. 1–6. [Google Scholar]
  20. Fajardo, K.C.; Gonzales, J.S.; Iv, C.C.H. Detection and Identification of Intestinal Parasites on Dogs Using AlexNet CNN Architecture. In Proceedings of the 2022 IEEE International Conference on Artificial Intelligence in Engineering and Technology (IICAIET), Kota Kinabalu, Malaysia, 13–15 September 2022; pp. 1–6. [Google Scholar]
  21. Caya, M.V.C.; Maramba, R.G.; Mendoza, J.S.D.; Suman, P.S. Characterization and Classification of Coffee Bean Types Using Support Vector Machine. In Proceedings of the 2020 IEEE 12th International Conference on Humanoid, Nanotechnology, Information Technology, Communication and Control, Environment, and Management (HNICEM), Manila, Philippines, 3–7 December 2020; pp. 1–6. [Google Scholar]
  22. Magadia, A.P.I.D.; Zamora, R.F.G.L.; Linsangan, N.B.; Angelia, H.L.P. Bimodal Hand Vein Recognition System Using Support Vector Machine. In Proceedings of the 2020 IEEE 12th International Conference on Humanoid, Nanotechnology, Information Technology, Communication and Control, Environment, and Management (HNICEM), Manila, Philippines, 3–7 December 2020; pp. 1–5. [Google Scholar]
  23. Padilla, D.A.; Magwili, G.V.; Marohom, A.L.A.; Co, C.M.G.; Gano, J.C.C.; Tuazon, J.M.U. Portable Yellow Spot Disease Identifier on Sugarcane Leaf via Image Processing Using Support Vector Machine. In Proceedings of the 2019 5th International Conference on Control, Automation and Robotics (ICCAR), Beijing, China, 19–22 April 2019; pp. 901–905. [Google Scholar]
  24. Mateo, K.C.H.; Navarro, L.K.B.; Manlises, C.O. Identification of Macro-Nutrient Deficiency in Onion Leaves (Allium cepa L.) Using Convolutional Neural Network (CNN). In Proceedings of the 2022 5th International Seminar on Research of Information Technology and Intelligent Systems (ISRITI), Yogyakarta, Indonesia, 8–9 December 2022; pp. 419–424. [Google Scholar]
Disclaimer/Publisher’s Note: The statements, opinions and data contained in all publications are solely those of the individual author(s) and contributor(s) and not of MDPI and/or the editor(s). MDPI and/or the editor(s) disclaim responsibility for any injury to people or property resulting from any ideas, methods, instructions or products referred to in the content.

Article Metrics

Citations

Article Access Statistics

Multiple requests from the same IP address are counted as one view.