Abstract
With the development and application of artificial intelligence (AI) technology, autonomous driving systems are gradually being applied on the road. However, people still have requirements for the safety and reliability of unmanned vehicles. Autonomous driving systems in today’s unmanned vehicles also have to respond to information security attacks. If they cannot defend against such attacks, traffic accidents might be caused, leaving passengers exposed to risks. Therefore, we investigated adversarial attacks on the traffic sign recognition of autonomous vehicles in this study. We used You Look Only Once (YOLO) to build a machine learning model for traffic sign recognition and simulated attacks on traffic signs. The simulated attacks included LED light strobes, color-light flash, and Gaussian noise. Regarding LED strobes and color-light flash, translucent images were used to overlay the original traffic sign images to simulate corresponding attack scenarios. In the Gaussian noise attack, Python 3.11.10 was used to add noise to the original image. Different attack methods interfered with the original machine learning model to a certain extent, hindering autonomous vehicles from recognizing traffic signs and detecting them accurately.
1. Introduction
The development and application of artificial intelligence (AI) technology enable autonomous driving systems to be used on the road. However, the safety and reliability of unmanned vehicles still need to be secured. Autonomous driving systems must respond to information security attacks. If not, traffic accidents might occur, which threaten passengers’ lives. Through the investigation of physical and simulated cyberattacks, the vulnerabilities and weaknesses of autonomous driving systems in detecting and recognizing traffic signs can be mitigated [1]. The results also provide a reference for enhancing the security of autonomous driving systems.
In this study, we used You Look Only Once (YOLO) to train a machine learning model to defend against various simulated attacks on traffic signs. In the simulated attacks, the LED strobes, different color-light overlays, and Gaussian noise were used [2,3]. For the LED strobe and color overlay, translucent images were used to overlay the original traffic sign images and simulate the corresponding attack scenarios. For the Gaussian noise attack, Python was used to add noise to the original images. It was found that different attack methods interfered with the original machine learning model, affecting the ability of autonomous driving cars to recognize traffic signs. That is, the recognition system could not detect the presence of a traffic sign, or was lead to a fault result [4].
The idea of the proposed attacks was based on Ref. [1]. We built a machine learning model and designed simulated attacks to interfere with traffic sign recognition [5]. We used overlaid translucent images to simulate a situation in which the lens was affected by LED stroboscopic or colored light. Noise was also added to the images to interfere with the model in identifying objects. The results of the machine learning model for identifying traffic signs under different interferences were analyzed.
2. Methodology
2.1. Dataset
We used the German Traffic Sign Recognition Benchmark (GTSRB) dataset. This dataset contains 43 traffic signs used in Germany [1], as shown in Figure 1.
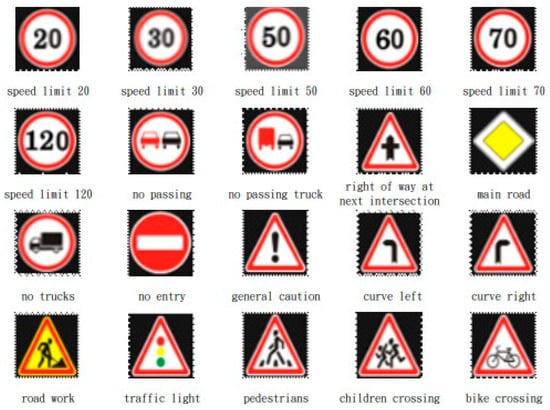
Figure 1.
Examples of traffic signs.
The original number of images in the training set of the GTSRB dataset is 39,544, and the number of test set images is 10,320. The original training set was split into a new training set and a validating set in a ratio of 8:2 [6]. The validating set was used to tune the hyperparameters of the model to train the model and prevent overfitting [7]. The final number of images in the new training set was 31,735, while that in the validating set was 7842.
2.2. Machine Learning
The YOLOv5 machine learning model is an object detection model that uses the one-stage detection method [8]. Built on Pytorch, it instantly provides high-speed, high-precision results and is highly adaptable to various scenarios. YOLOv5 has four main versions: small (s), medium (m), large (l), and extra-large (x), each offering progressively higher accuracy rates. In the experiment, we used YOLOv5 trained with the GTSRB dataset. Figure 2 shows the precision–recall (pr value) curve after training. The p and r values are higher than 0.9. The model was found to be excellent based on the results shown in Figure 3 and Table 1 [9,10].
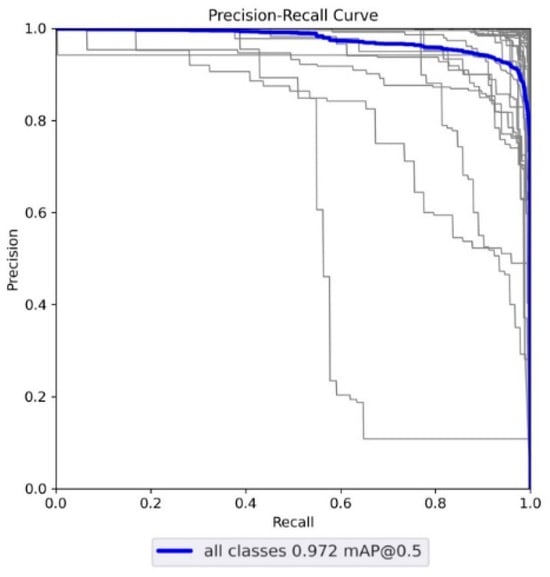
Figure 2.
YOLOv5 pr curve.
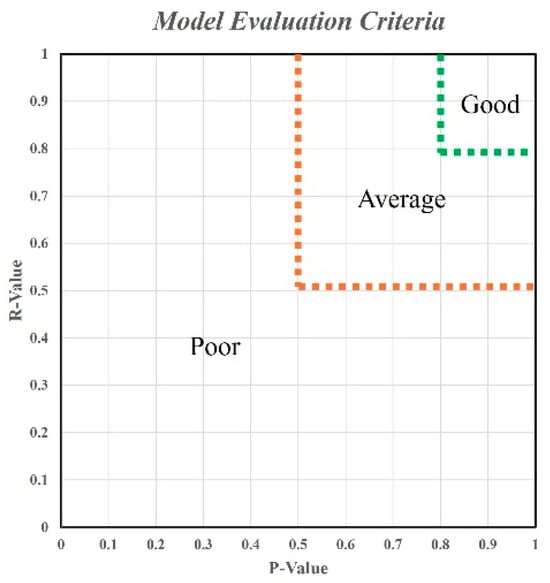
Figure 3.
pr values and model evaluation.

Table 1.
Numerical interval values.
2.3. Evaluation Metric
Precision and recall were selected as the evaluation metrics for the model. r values indicate the accuracy of detecting whether an object belongs to a target category (traffic signs), while p values indicate the accuracy of identifying that an object (the traffic sign) is a certain sign after detecting it.
Figure 3 presents the model evaluation criteria and the relationship between the p and r values. Table 1 presents the impact of numerical interval thresholds on model predictions. The dividing lines in Figure 3 are compared with the numerical interval thresholds in Table 1. The range of the green dotted line presents the superior model’s fitness, while that of the brown dotted line indicates the average fitness. The effectiveness of the indicators in object detection was verified in Ref. [5]. We used the same evaluation indicators to ensure the accuracy and reliability of the experimental results.
3. Results and Discussions
3.1. LED Light Strobe
LED light sources produce stroboscopic effects at a slower shutter speed. A similar coverage is applied to the image to simulate brightness and darkness, which affects the integrity of the image and interferes with model performance. While the digital space was considered as a variable, environmental light sources were not. Figure 4 shows the schematic diagram of stroboscopic interference. The left shows the original image, and the right presents the image after interference.
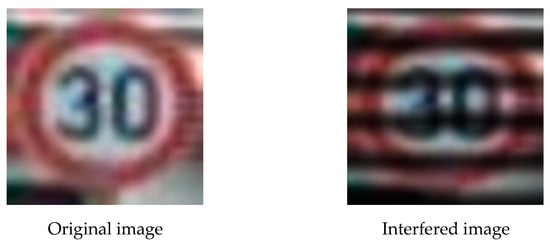
Figure 4.
Stroboscopic interference.
The p and r values of all 43 tested traffic signs were lower than the threshold of 0.8, indicating that this experiment successfully affected the signal recognition of the model. The results for the 43 traffic signs are shown in Table 2.
Table 2.
LED strobe impact.
The p and r values of all 43 tested signs were lower than 0.5. LED strobing significantly worsened the model’s identification ability. Figure 5 shows the scatterplot of the LED strobe impact.
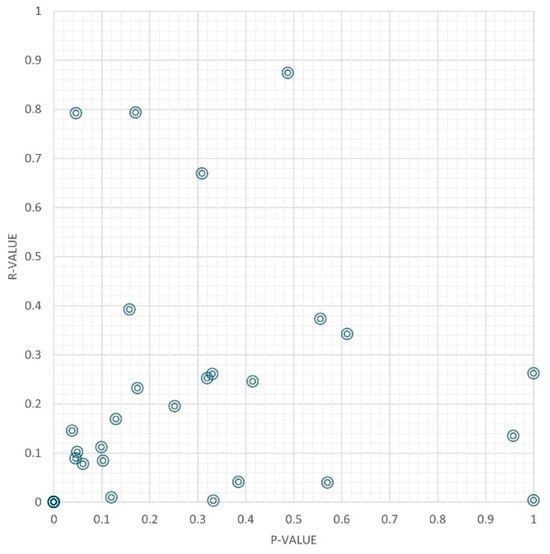
Figure 5.
LED strobe scatterplot.
According to the evaluation standard dividing line, all 43 signs showed similar poor results. Most p and r values were lower than 0.5. This indicates that most objects were not identified as traffic signs, and even if they were identified as traffic signs, specific traffic signs were not recognized. Under ideal circumstances, LED strobes can effectively interfere with the models. However, it is difficult to achieve the ideal situation in an experiment. Therefore, more effective strategies are needed for model design and experiments.
3.2. Color Lighting
We added a translucent mask to the image and simulated the situation of traffic signs in different colors. We overlaid simulated red, yellow, blue, and green and tested the model’s detection ability. Figure 6 shows the image of the yellow overlay.
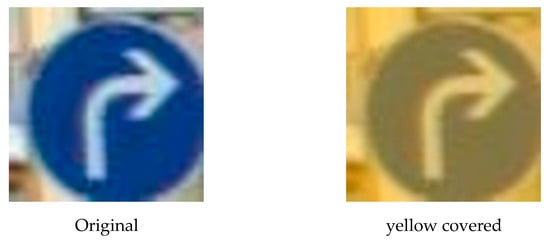
Figure 6.
Yellow coverage.
With various colors, the identification results showed reduced model performance, indicating that successful interference affected the identification by the model (Table 3).
Table 3.
Identification results with color overlay.
Figure 7 showcases the scatterplots of the 43 tested signs, which were overlaid by four colors.
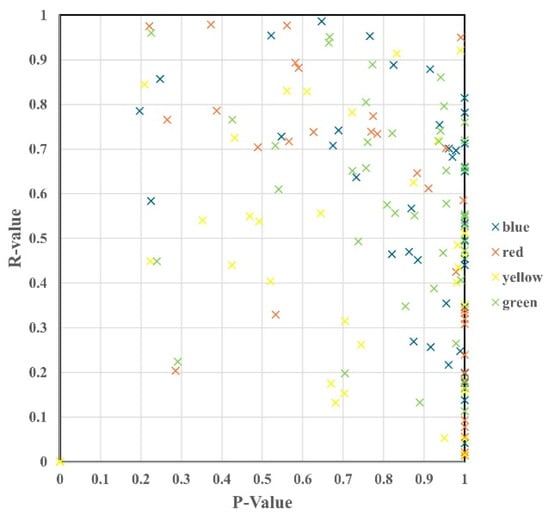
Figure 7.
Scatterplot of four color coverage.
Table 3 shows that color interferences are effective attacks against the models. Half of the signs were not recognized correctly, and the recognition rate of most signs was average or low. The results of the experiment are summarized as follows.
- Signs with r values lower than 0.5 included speed limit 60, speed limit 70, speed limit 80, speed limit 120, no truck overtaking, left bend, uneven road surface, reduced road limit, watch out for snow, watch out for wild animals, and the ban is lifted.
- Signs with p values lower than 0.5 with red overlay included vehicle entry is prohibited, danger, and following the direction.
- Signs with p values lower than 0.5 with yellow overlay included speed limit 20, speed limit 100, right of way, danger, and pay attention to traffic signs.
- Signs with p values lower than 0.5 with blue overlay included only left turns allowed, driving on the right, and following the direction.
- Signs with p values lower than 0.5 with yellow overlay included no right of way.
All color overlays except for blue impacted the identification of the model. With the interference of the blue overlay, signs containing blue-colored texts (such as only turn left, drive on the right, and following the direction) were not recognized.
3.3. Gaussian Noise
We generated different levels of noise in traffic sign images to test whether Gaussian noise interfered with the model. We used seven different variances of Gaussian noise (0.01, 0.03, 0.05, 0.1, 0.13, and 0.15). When the variance is 0.1, there is an 87.15% error rate in the recognition of signs [4]. Therefore, we set 0.1 as the threshold value to observe the impact of Gaussian noise. Figure 8 shows a sign with Gaussian noise.
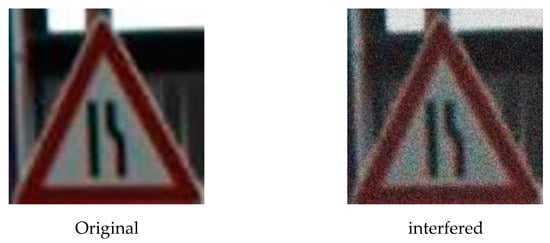
Figure 8.
Gaussian noise example.
We fine-tuned the Gaussian noise with different variances (η) for attacks. The statistics of the number of tested signs in three evaluation categories are shown in Table 4. The number of good recognitions decreased as the variance η increased. When the variance reached 0.05, the model’s recognition became poor, indicating successful interference by the Gaussian noise.
Table 4.
Gaussian noise attack results.
Figure 9 shows the scatterplot with different variances.
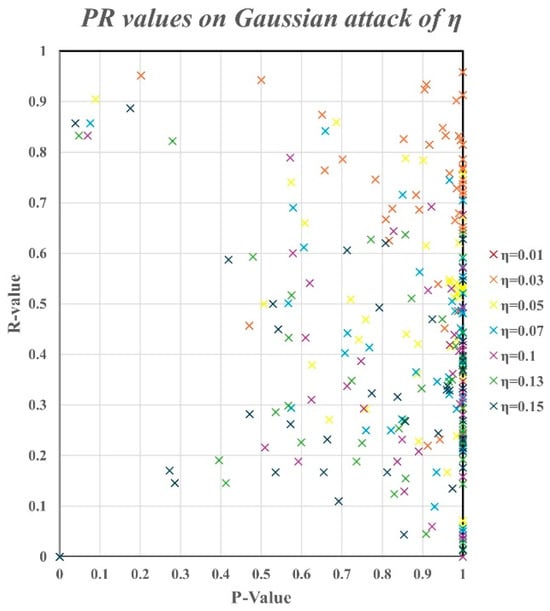
Figure 9.
Scatter diagram with different variances.
Figure 10 shows the impact of various variances on the model’s recognition. The pink bar represents a poor model, the yellow bar represents an average model, and the green bar indicates a good recognition.
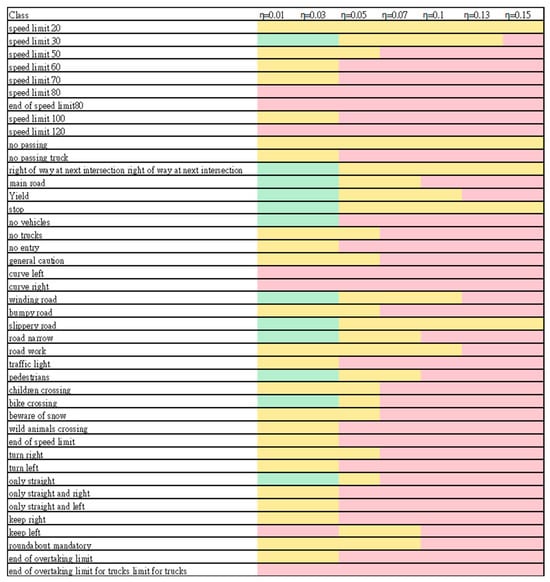
Figure 10.
Influence of variances of Gaussian noise.
As the variance increased, the p (r) value decreased, which means that the model’s performance in identifying traffic signs was affected by Gaussian noise. When the variance reached 0.05, no good recognition was observed. When the variance reached 0.15, most signs were recognized poorly. In most cases, the P values were higher than 0.5. The increase in the variance reduced the model’s ability to accurately identify traffic signs. Even though the model had difficulty identifying traffic signs, once it successfully detected one, high accuracy in determining the sign was maintained. The model performed well in recognizing traffic signs, but its recognition ability needs to be improved with increased variance. As the variance increased, the influence of attacks became greater. With increased variances, the signs were not recognized, except for drive on the left.
p and r values in the range of 0.4–0.6 were maintained even when the variance increased. Therefore, the Gaussian noise attack was effective in the range of 0.4–0.6.
4. Conclusions
Under the interference of the LED stroboscope, the p and r values decreased to below 0.5. Compared with the data distribution of the original model, LED stroboscopic attack was ideal in the digital space. The interference of colors significantly affected the model’s ability. Especially when the blue-and-white-based signs (such as the turn right sign) overlapped with blue, the model could not identify traffic signs. Under the interference of the Gaussian noise, the success rate of the model in identifying traffic signs decreased as the variance increased. Compared with the other two attacks, Gaussian noise showed the worst interference.
Author Contributions
Conceptualization, C.-H.L.; methodology, C.-H.L. and H.-T.C.; software, C.-T.Y., Y.-L.C. and Y.-Y.L.; validation, H.-T.C.; formal analysis, C.-H.L.; investigation, H.-T.C.; resources, C.-T.Y.; data curation, Y.-L.C.; writing—original draft preparation, C.-T.Y., Y.-L.C. and Y.-Y.L.; writing—review and editing, C.-H.L. and H.-T.C.; visualization, C.-T.Y., Y.-L.C. and Y.-Y.L.; supervision, C.-H.L. and H.-T.C.; project administration, C.-H.L.; funding acquisition, C.-H.L. All authors have read and agreed to the published version of the manuscript.
Funding
This research was funded by the National Science and Technology Council, Taiwan grant number NSTC 113-2221-E-029-031.
Institutional Review Board Statement
Not applicable.
Informed Consent Statement
Not applicable.
Data Availability Statement
Data are contained within the article.
Conflicts of Interest
The authors declare no conflict of interest.
References
- Pavlitska, S.; Lambing, N.; Zöllner, J.M. Adversarial Attacks on Traffic Sign Recognition: A Survey. In Proceedings of the 3rd International Conference on Electrical, Computer, Communications and Mechatronics Engineering, Tenerife, Spain, 19–21 July 2023. [Google Scholar]
- Jia, W.; Lu, Z.; Zhang, H.; Liu, Z.; Wang, J.; Qu, G. Fooling the Eyes of Autonomous Vehicles: Robust Physical Adversarial Examples Against Traffic Sign Recognition Systems. In Proceedings of the Annual Network and Distributed System Security Symposium, San Diego, CA, USA, 24–28 April 2022. [Google Scholar]
- Shen, Y.; Cheng, Y.; Lin, Y.; Long, S.; Jiang, C.; Li, D.; Dai, S.; Jiang, Y.; Fang, J.; Jiang, Z.L.; et al. MLIA: Modulated LED Illumination-based Adversarial Attack on Traffic Sign Recognition System for Autonomous Vehicle. In Proceedings of the IEEE International Conference on Trust, Security and Privacy in Computing and Communications, Wuhan, China, 9–11 December 2022. [Google Scholar]
- Goodfellow, I.J.; Shlens, J.; Szegedy, C. Explaining and Harnessing Adversarial Examples. In Proceedings of the International Conference on Learning Representations, San Diego, CA, USA, 7–9 May 2015. [Google Scholar]
- Song, W.; Suandi, S.A. Sign-YOLO: A Novel Lightweight Detection Model for Chinese Traffic Sign. IEEE Access 2023, 11, 113941–113951. [Google Scholar] [CrossRef]
- Gholamy, A.; Kreinovich, V.; Kosheleva, O. Why 70/30 or 80/20 Relation Between Training and Testing Sets: A Pedagogical Explanation. Int. J. Intell. Technol. Appl. Stat. 2018, 11, 105–111. [Google Scholar]
- Xu, Y. On Splitting Training and Validation Set: A Comparative Study of Cross-Validation, Bootstrap and Systematic Sampling for Estimating the Generalization Performance of Supervised Learning. J. Anal. Test. 2018, 2, 249–262. [Google Scholar] [CrossRef] [PubMed]
- Khan, S.W.; Hafeez, Q.; Khalid, M.I.; Alroobaea, R.; Hussain, S.; Iqbal, J.; Almotiri, J.; Ullah, S.S. Anomaly Detection in Traffic Surveillance Videos Using Deep Learning. Sensors 2022, 22, 6563. [Google Scholar] [CrossRef] [PubMed]
- Redmon, J.; Divvala, S.; Girshick, R.; Farhadi, A. You Only Look Once: Unified, Real-Time Object Detection. In Proceedings of the IEEE Conference on Computer Vision and Pattern Recognition, Las Vegas, NV, USA, 27–30 June 2016; pp. 779–788. [Google Scholar]
- Pangakis, N.; Wolken, S.; Fasching, N. Automated Annotation with Generative AI Requires Validation. arXiv 2023, arXiv:2306.00176. [Google Scholar]
Disclaimer/Publisher’s Note: The statements, opinions and data contained in all publications are solely those of the individual author(s) and contributor(s) and not of MDPI and/or the editor(s). MDPI and/or the editor(s) disclaim responsibility for any injury to people or property resulting from any ideas, methods, instructions or products referred to in the content. |
© 2025 by the authors. Licensee MDPI, Basel, Switzerland. This article is an open access article distributed under the terms and conditions of the Creative Commons Attribution (CC BY) license (https://creativecommons.org/licenses/by/4.0/).