Abstract
Check dams play a pivotal role in soil and water conservation engineering as they mitigate debris flow and decelerate the slope of the river channel by intercepting sediments, thereby preventing disasters. However, as ecological conservation and landscape integration have become significant, functions, safety, harmony, and aesthetics with the surroundings must be considered in the design of check dams. In this study, a questionnaire survey was conducted based on scenic beauty estimation (SBE) and image segmentation using artificial intelligence to evaluate the landscape quality of soil and water conservation projects. Data were collected from the photos which were segmented into vegetation, structure, sky, land, and water. The proportion of each segment was calculated to explore the relationship with the scenic beauty of the landscapes. Regions with prevalent vegetation and water received favorable evaluations, whereas areas with a higher proportion of land were less preferred. Even when vegetation was present in high quantities, an unorganized arrangement was less desirable. Identified key factors influencing the scenic beauty of the landscape can be considered in the design of soil and water conservation engineering projects.
1. Introduction
In Taiwan, heavy rainfall from typhoons and monsoons, combined with steep river topography and earthquake-induced fault uplift, rapidly alters geomorphology and accelerates river flows. These conditions frequently trigger debris flows and landslides, introducing large amounts of sediment into river channels and posing significant risks to downstream areas [1]. To mitigate these hazards, check dams and similar structures are essential for stabilizing stream beds, regulating sediment production, and reducing the scouring energy of water flow.
The primary objective of check dams is to prevent and control sediment hazards and ensure structural safety. These structures are usually constructed using concrete or steel materials. In addition to the safety of the construction method, there has been a growing emphasis on integrating engineering facilities into the landscape and ecological environment [2] to enhance the aesthetic and ecological appeal and balance between functionality and environmental friendliness [3].
Although technical regulations and manuals for soil and water conservation have been established in Taiwan, research on the coordination between aesthetic evaluation and the natural environment of soil and water conservation structures is limited. At present, standards for the aesthetic evaluation of engineering structures are required.
The method of landscape assessment was proposed by Zube et al. [4]. They conducted an empirical analysis based on the landscape perception theory. It includes four estimation paradigms: the expert paradigm, the psychophysical paradigm, the cognitive paradigm, and the experiential paradigm. In natural landscapes, the visual preference for the landscape is ignored more often than other artificial structures as sediment-related disasters need to be prevented. In the proposed theory [5], the natural landscape is usually more beautiful than artificial structures.
The exposed substrate of the stream bed increases landscape complexity and diminishes scenic beauty [6,7]. Therefore, the sediment of the river bed deposited by unstable water flow must be cleaned regularly, and the check dam must be constructed to improve the overall scenic beauty [8,9]. In this study, an online questionnaire survey and scenic beauty estimation (SBE) were used to improve the scenic beauty of the landscape. Using semantic segmentation technology and manual classification, elements in the images of the landscape were classified into vegetation, structures, sky, land, and water, and their proportions were calculated. The respondents’ evaluations were analyzed for various landscape elements to establish the standard to provide a reference for the design.
2. Materials and Methods
2.1. Questionnaire Survey
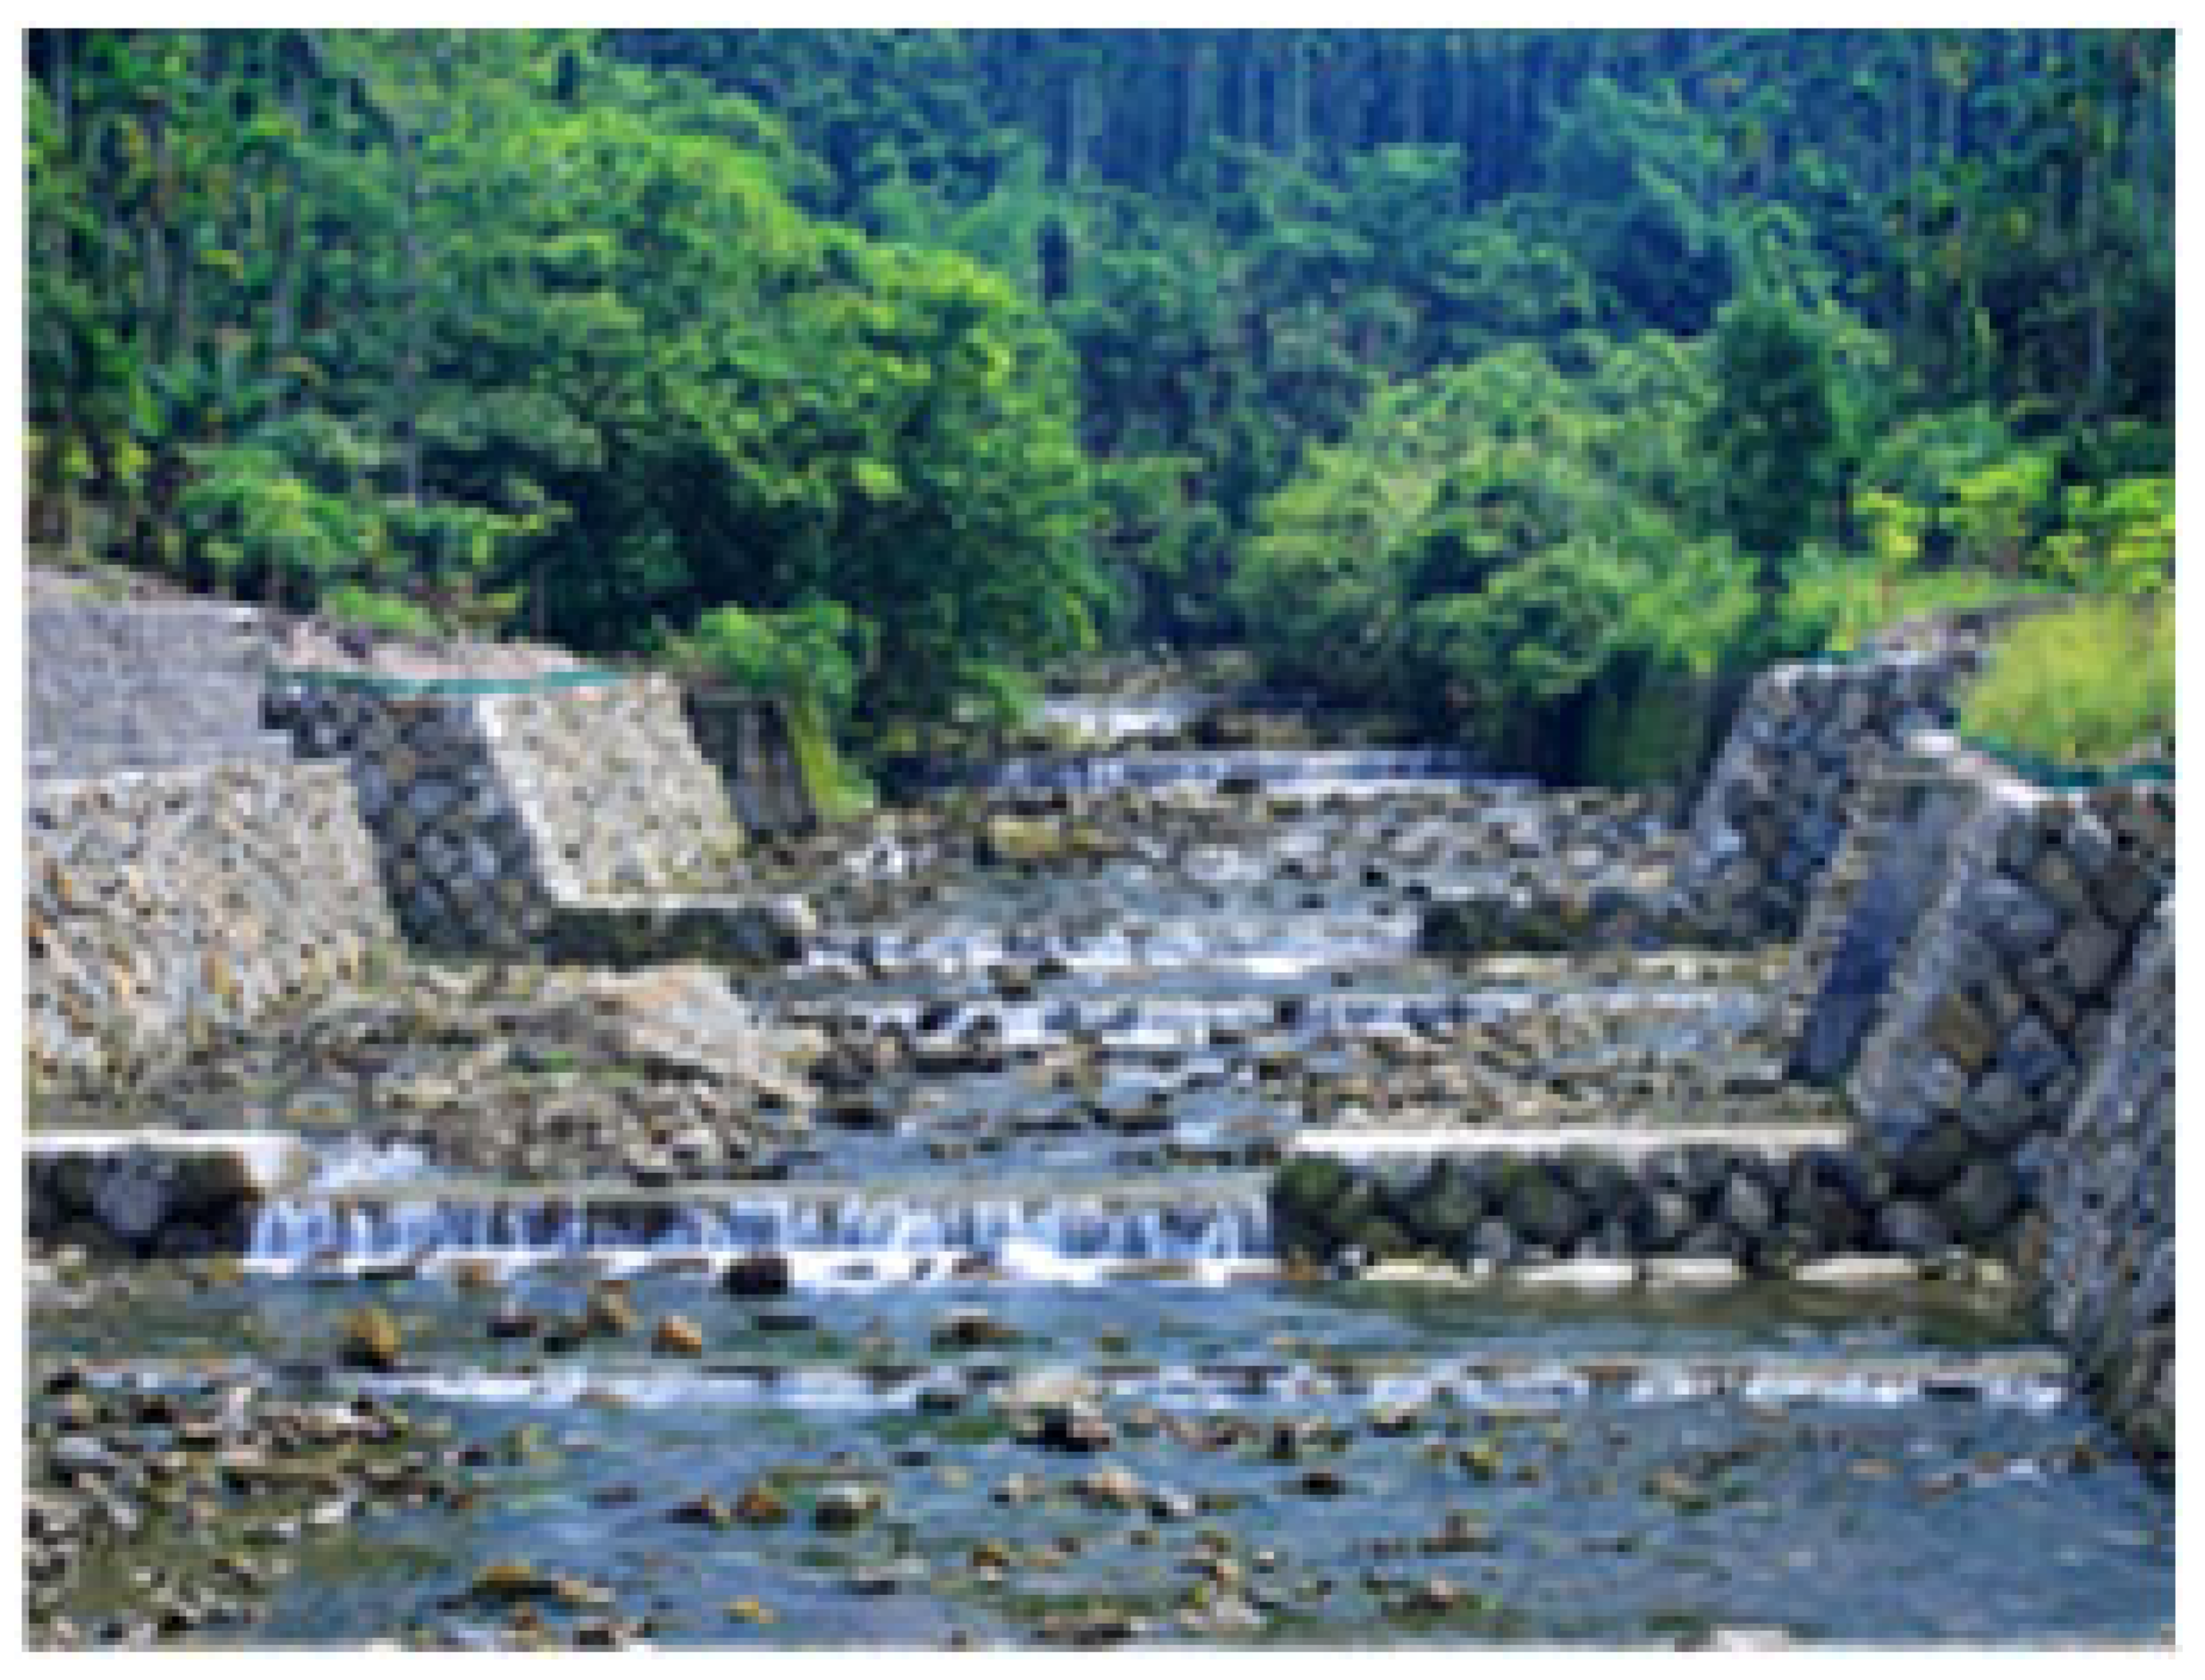
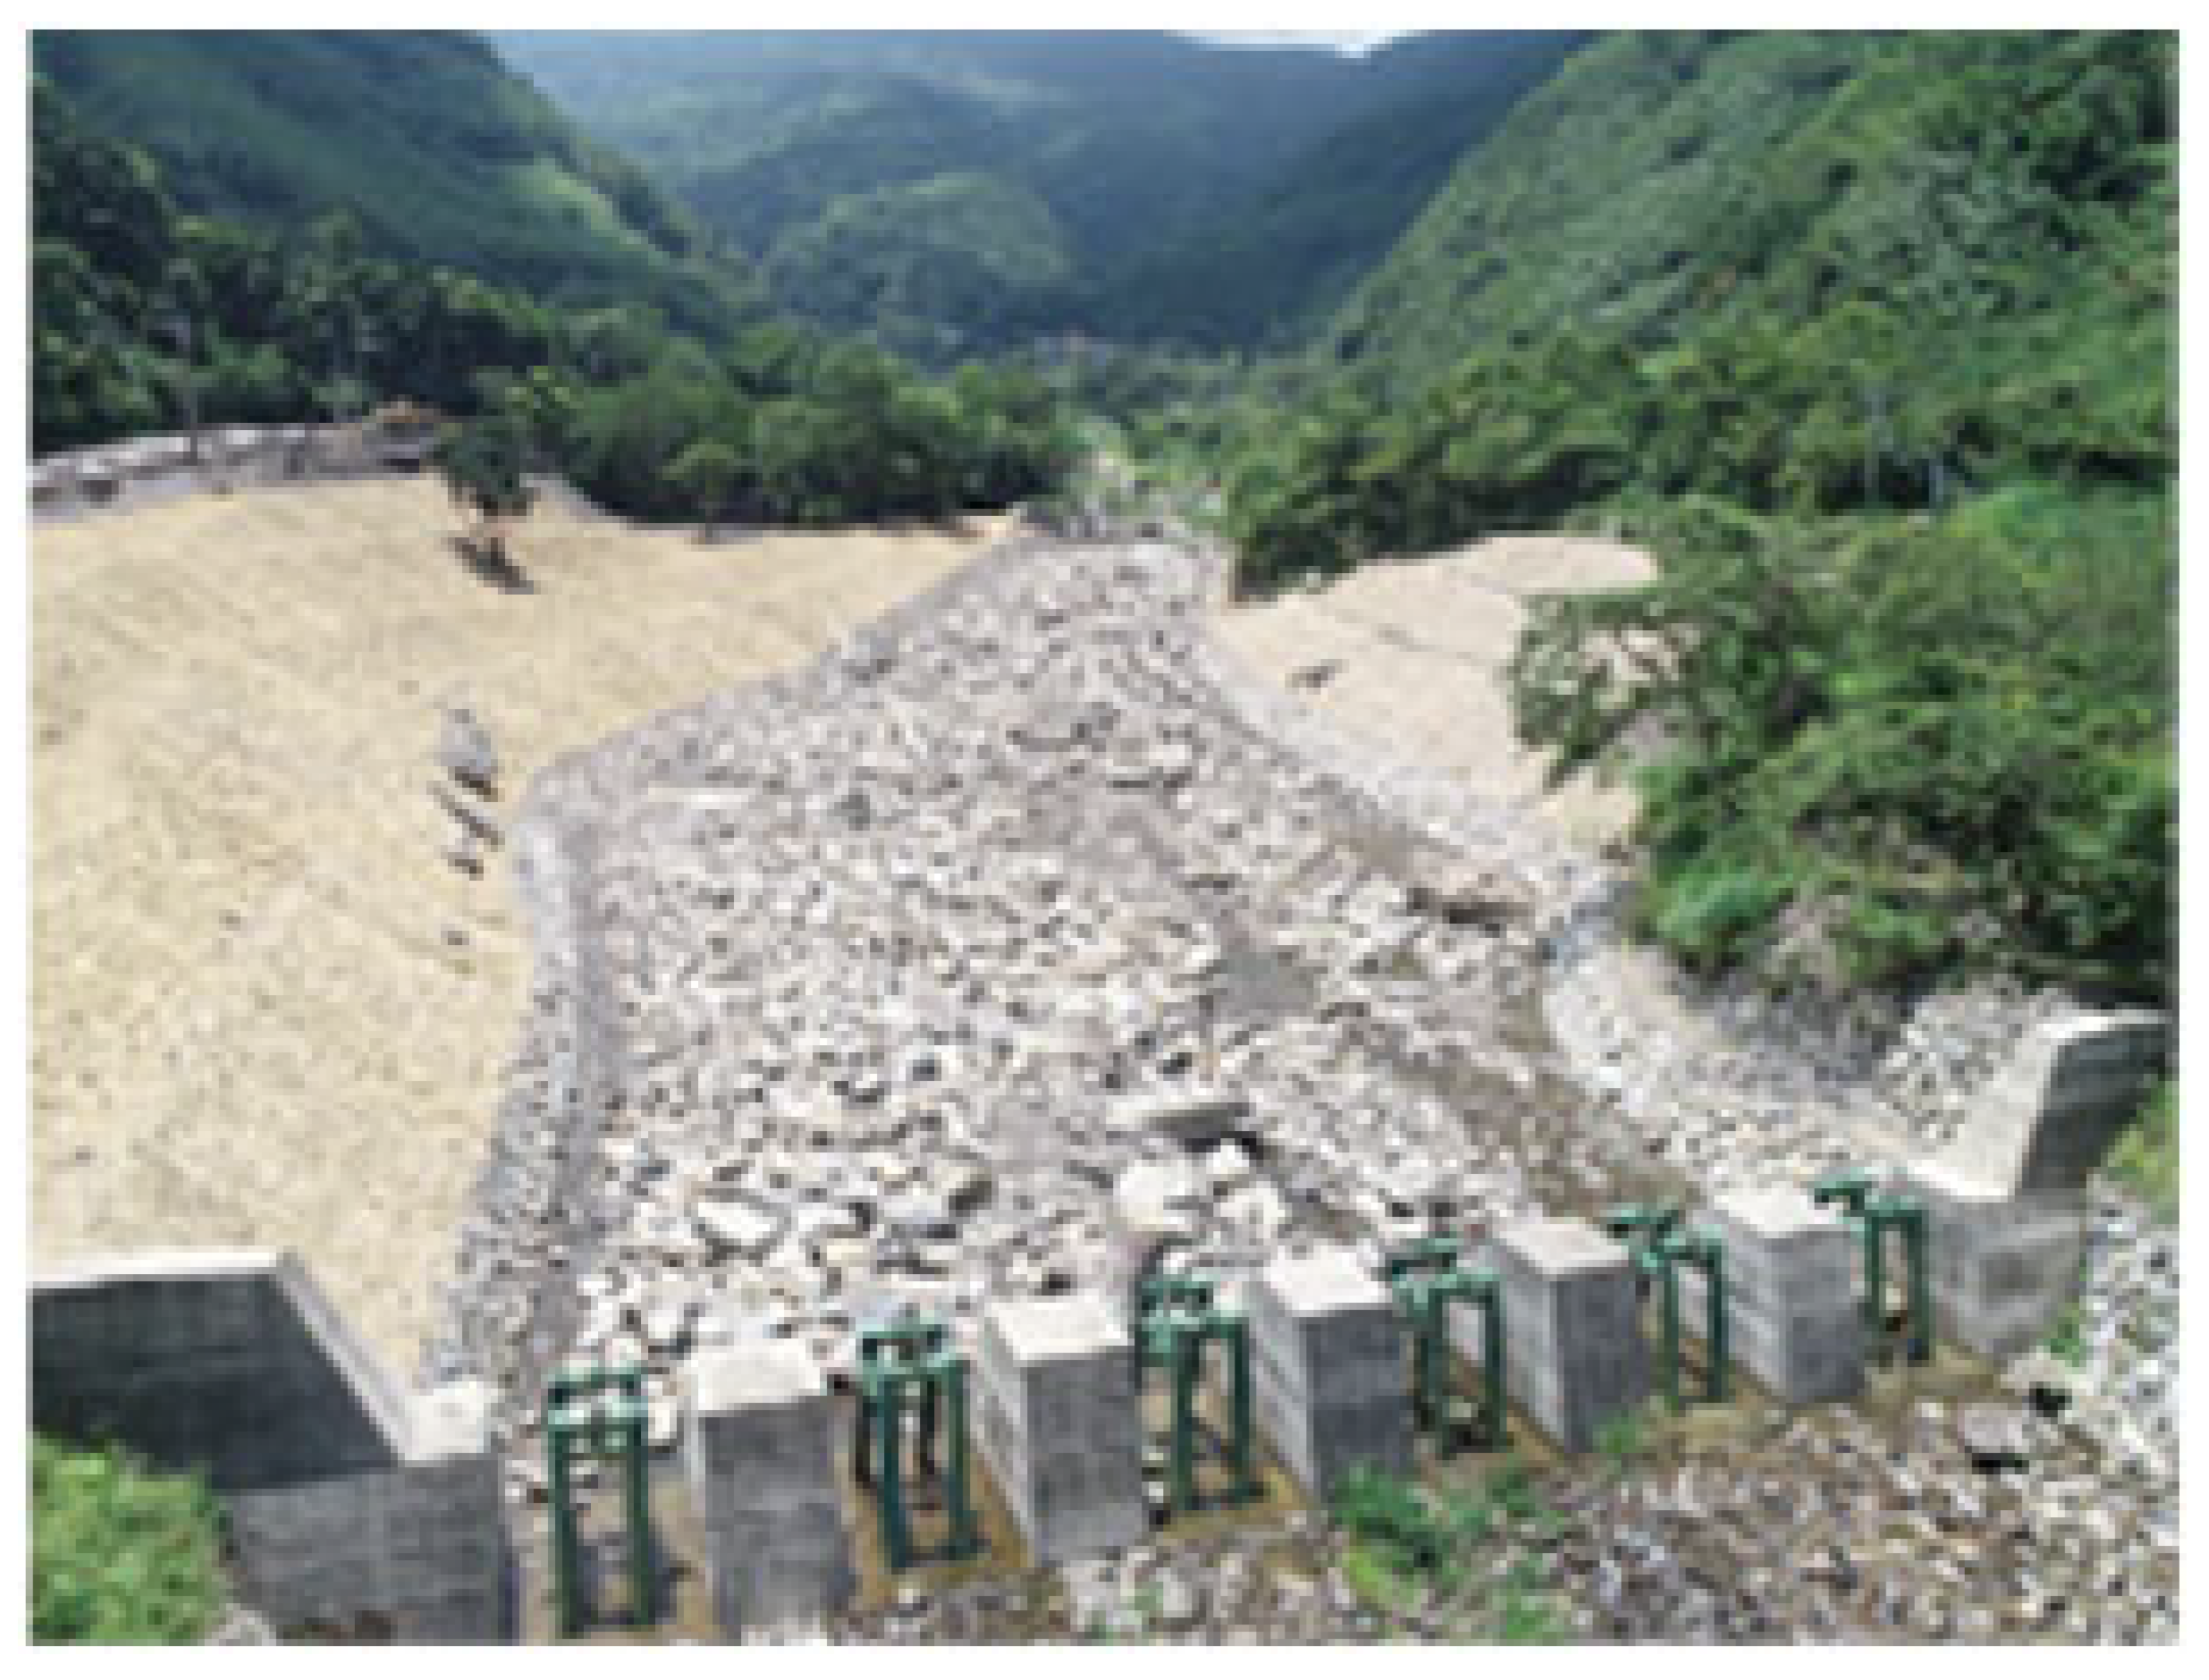
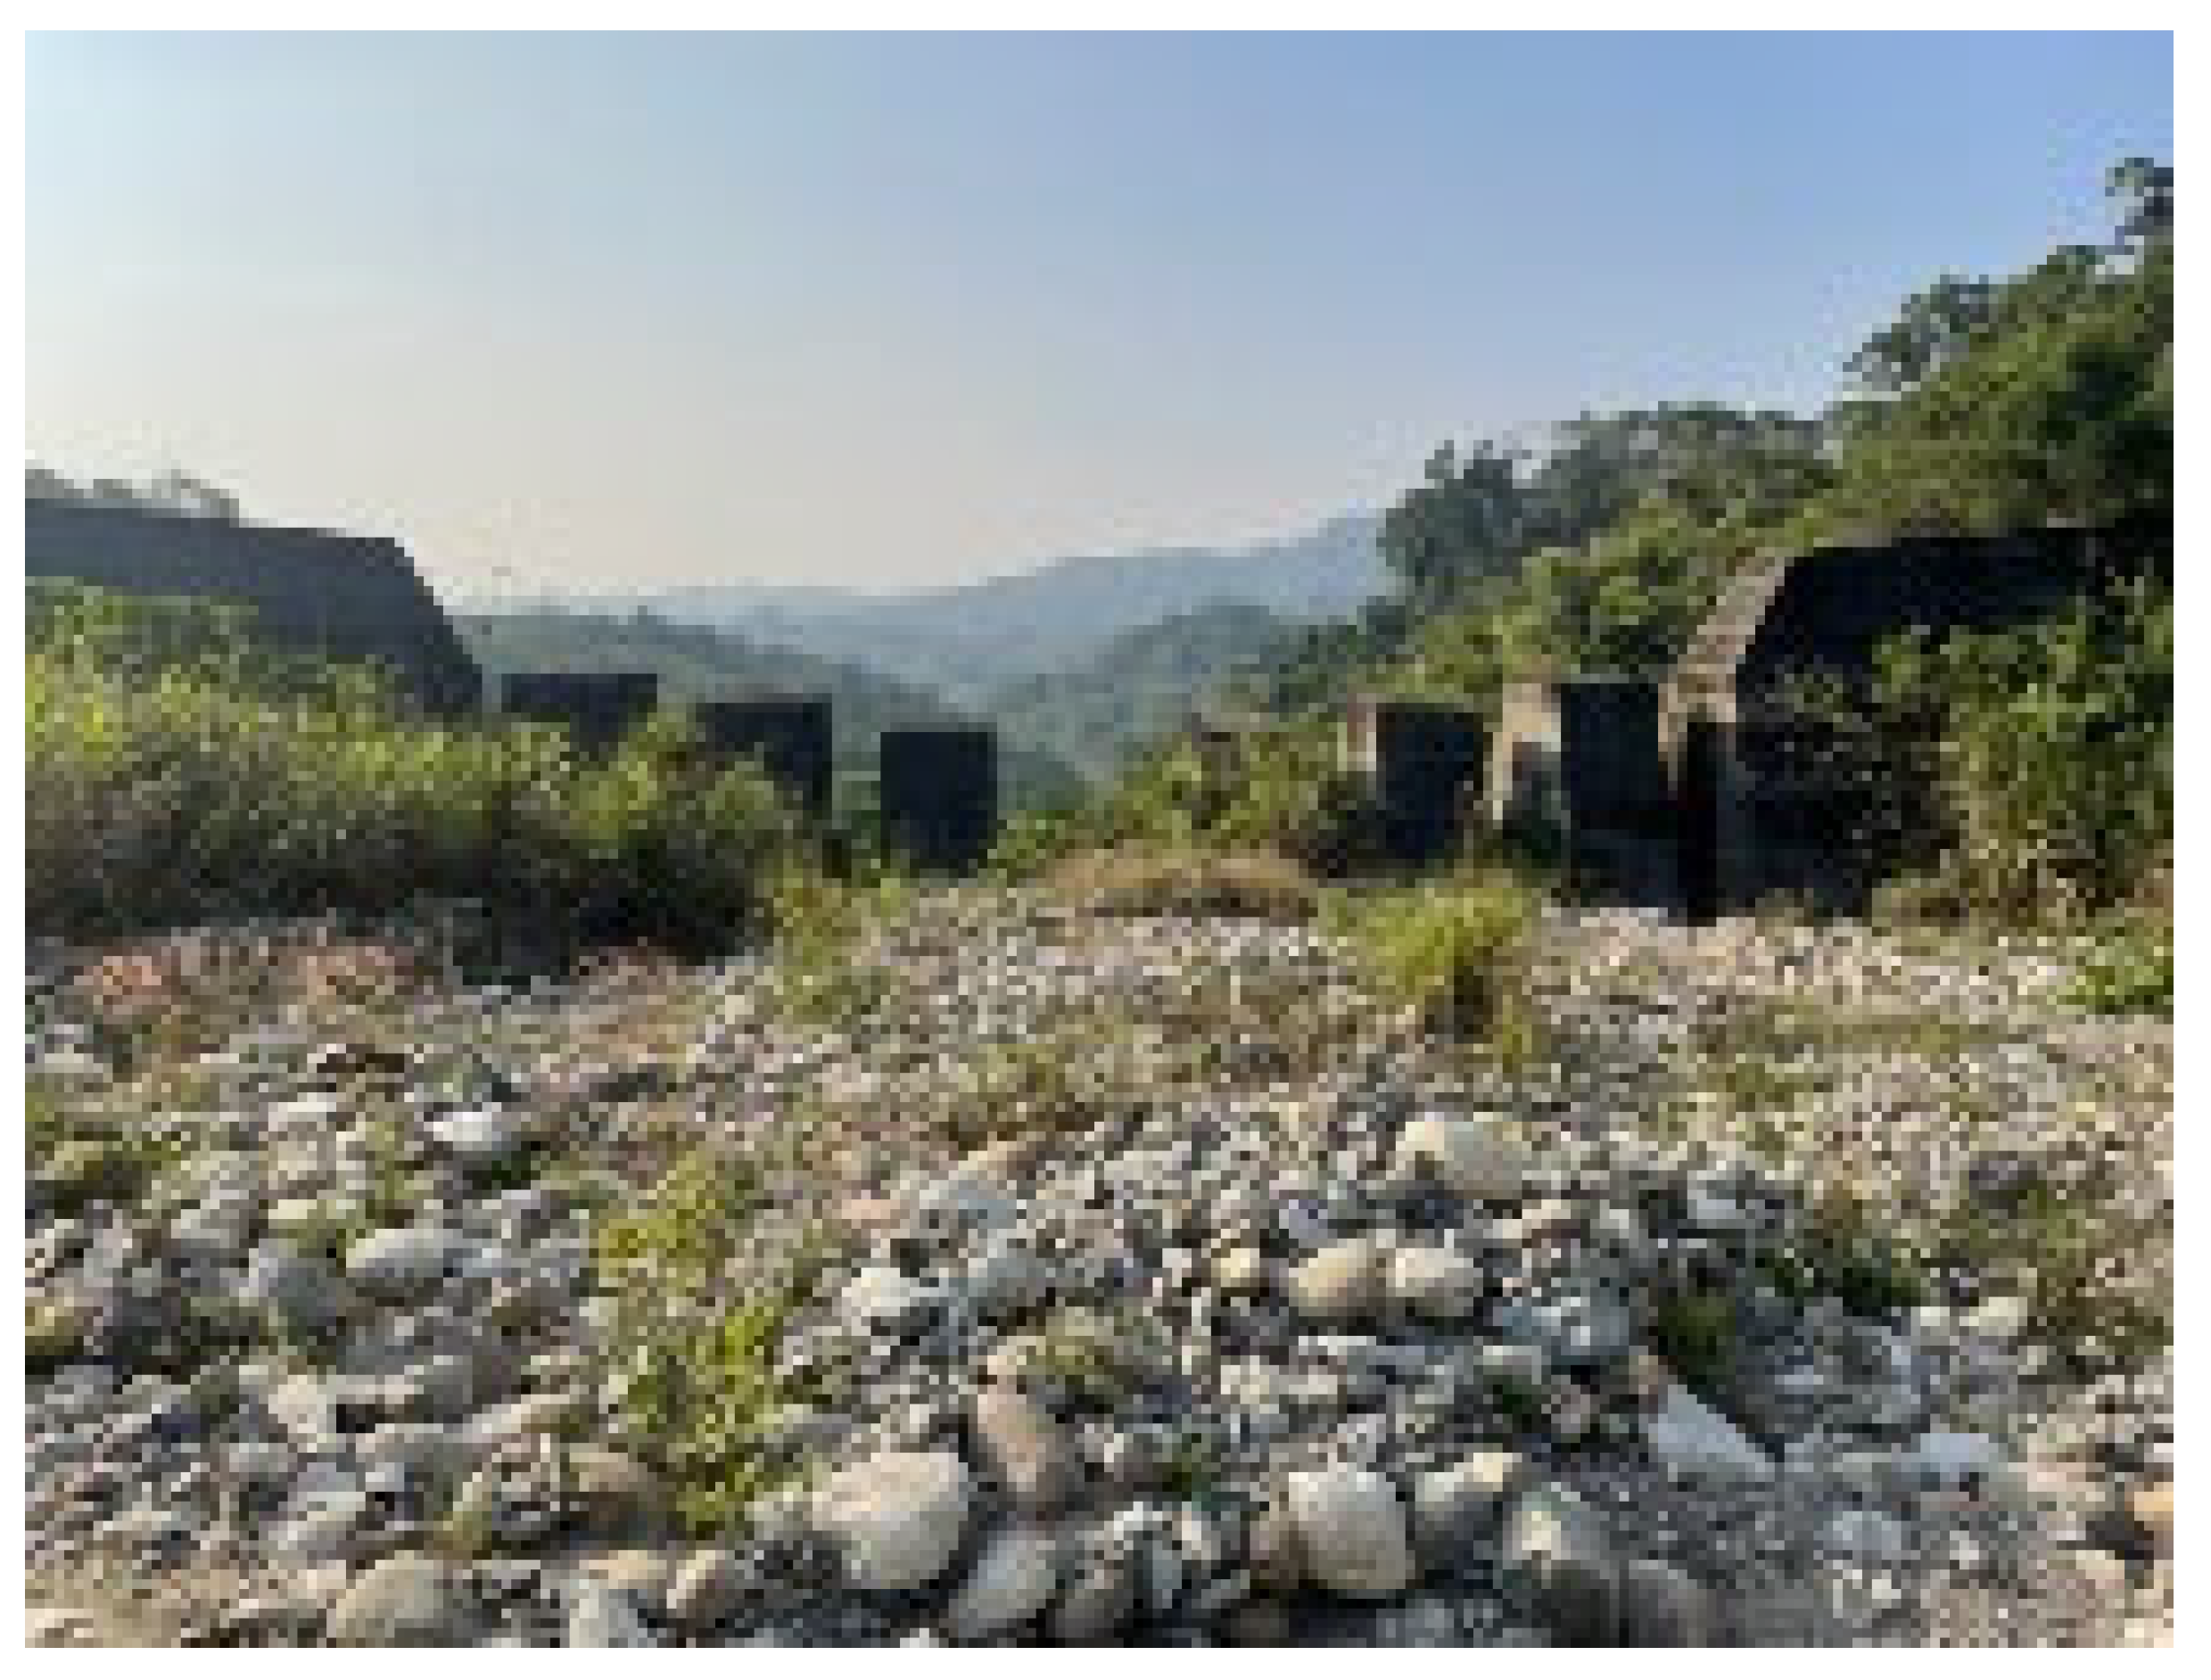
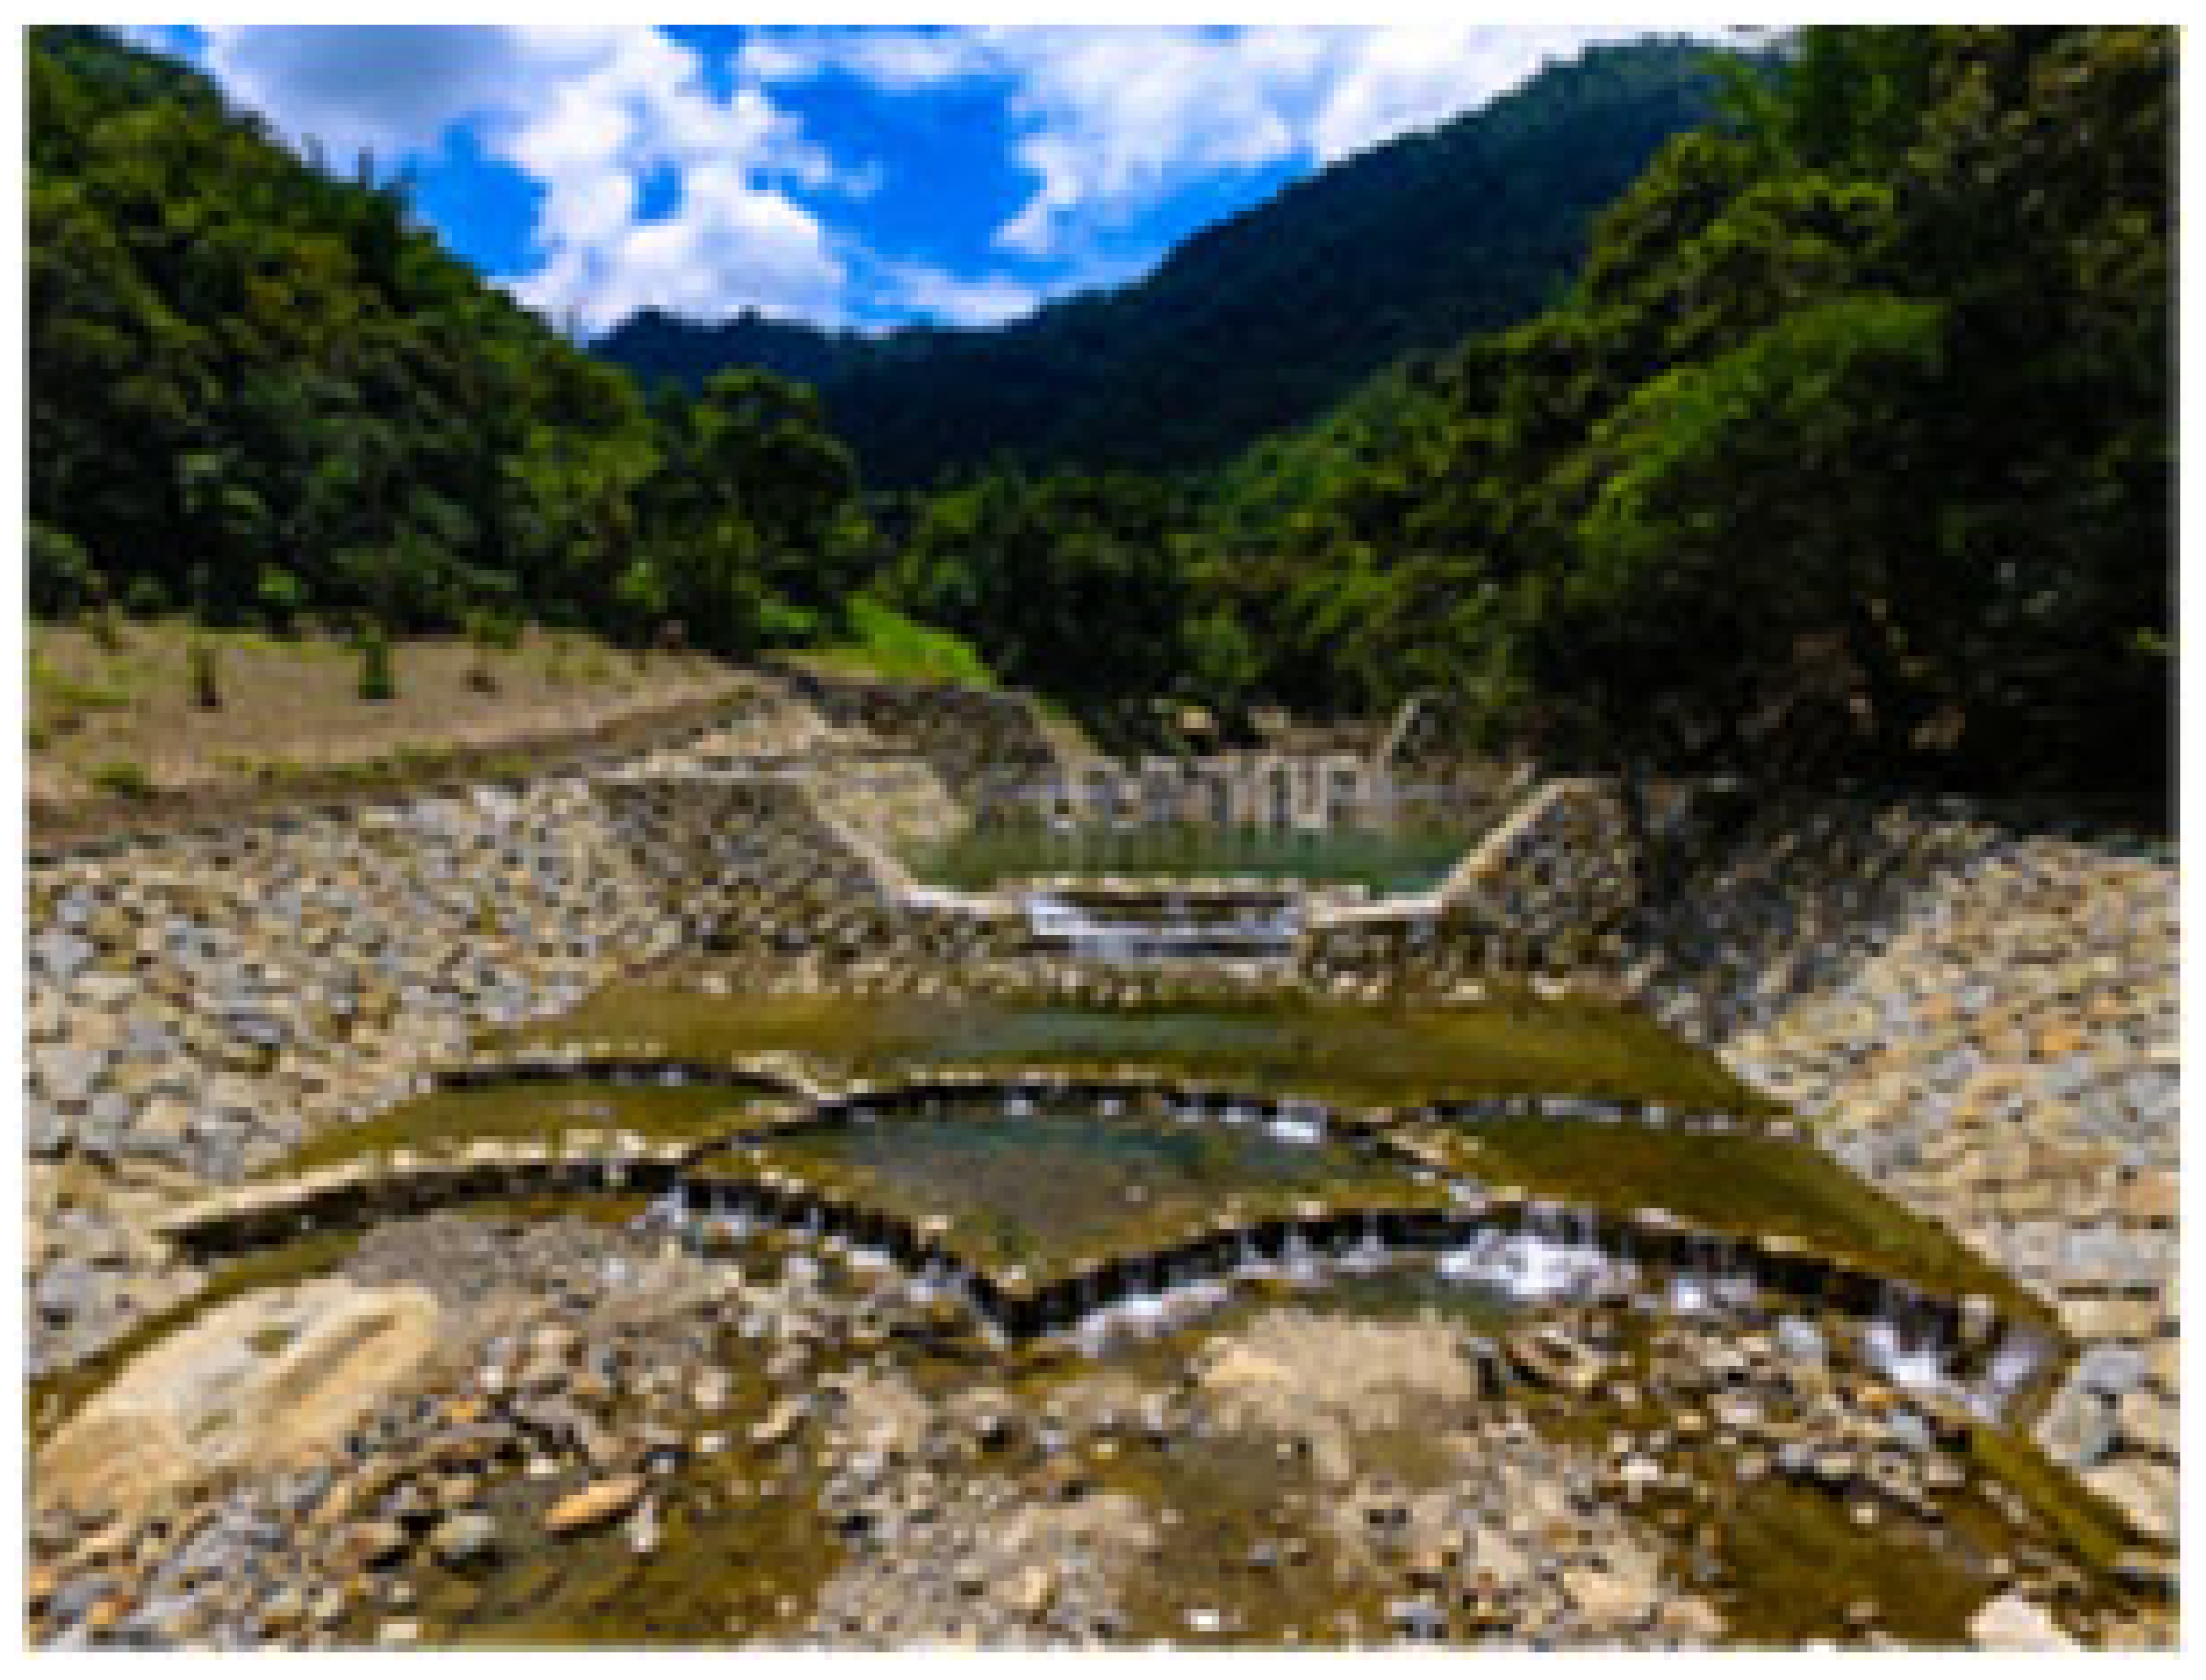
To explore the aesthetic characteristics of constructions for soil and water conservation, check dams and other soil and water conservation facilities were taken as the control group for the analysis of the landscape characteristics. For reliability and representativeness, a questionnaire was created and distributed online to collect the evaluation data of the respondents for different facilities. Their perceptions and preferences for the soil and water conservation facilities were then summarized. Six representative photos of the facilities were selected. The facilities were recognized widely for their designs or performance. The photos of old facilities were used for the comparison of the respondents’ evaluations with the selected facilities.
The questionnaire includes items to evaluate the elements, characteristics, emotional responses, and preferences of the facilities.
- Elements: The elements of the landscape were classified as natural and artificial elements. Natural elements such as vegetation, sky, and water enhance the ecological health and beauty of the landscape. Conversely, artificial elements such as concrete structures, soil and water conservation facilities, and other functional structures detract from its aesthetics.
- Characteristics: The respondent’s intuitive visual impression of the facility for colors, shapes, lines, and arrangements was classified by colors and tones. Cool-toned colors (e.g., blue, and green) are associated with natural landscapes, such as the sky, rivers, and vegetation, and offer a calm and cool perception. Warm-toned colors (e.g., red, orange, and yellow) are common in soil and building materials and convey warmth and vitality. These visual differences impact the aesthetic judgment of the respondent.
- Emotional responses: The emotional reactions or feelings of the respondents were assessed after looking at the photos. The emotional reactions were positive (e.g., cleanliness, pleasure, or comfort) or negative (e.g., disorder, boredom, or depression) and were evaluated for visual experience.
Preferences: Preferences for the scenic facilities were selected with a score of one to five, with a higher score indicating a higher preference for the facility. These scores are converted into SBE values and used to compare the aesthetic differences between old and new facilities.
2.2. SBE
SBE was developed by the National Park Service of America. It is widely used for the aesthetic estimation of natural and man-made landscapes. SBE has been adjusted according to different research requirements and scenarios to quantify the aesthetic value of landscapes. “Visitors’ Perception of Naturalness” was adopted by the National Park Service of America to evaluate the aesthetic value of the natural environment in parks. Depending on the respondent’s visual perception of naturalness, the visual appeal, harmony, and naturalness of natural landscapes are evaluated through questionnaire surveys. The SBE method has been gradually improved and adjusted according to different research purposes [10,11,12].
The concept of landscape aesthetics is abstract. Earlier studies mainly adopted qualitative methods. Recently, a quantified SBE method was used to evaluate scenic beauty based on psychophysical experiments. It was derived from the stimulus-response model based on behavior psychology. The signal detection method and the Thurstone scaling model are combined for the method’s improvement. The SBE method is widely used in natural resource management, environmental planning, ecotourism, and leisure activities for the quantitative evaluation of their aesthetic values. The results are used for the effective management and protection of these landscape resources.
2.3. Semantic Segmentation
Semantic segmentation, also known as pixel-level classification, is used to classify images and objects [13,14,15,16]. In semantic segmentation, an image is segmented into multiple areas, each of which corresponds to a specific category. Unlike object detection, semantic segmentation requires outline or boundary recognition and the accurate classification of each pixel in the image. Semantic segmentation, object detection, and image classification are the core technologies of deep learning in image processing.
The architecture of semantic segmentation includes a data set, a backbone network, and a segmentation algorithm. The data set provides samples to the model, the backbone network is responsible for extracting the features in the image, and the segmentation algorithm accurately classifies the image areas. As the basic structure of the deep learning model, the backbone network affects the performance of the whole model. Feature extraction is the main task of the backbone network. In image processing, the convolutional neural network (CNN) is usually used to extract information (e.g., edges, textures, and shapes) from the original image. The common structure of the backbone network includes a residual network (ResNet), visual geometry group (VGG), and MobileNet. After training and optimization, the backbone network enables excellent performance in image processing. Therefore, it is important to select the appropriate backbone network according to the tasks and data features.
The semantic segmentation model in this study was trained and tested with the ADE20K data set (150 categories). Swin-L [17] and DiNAT-L [18] were selected as the backbone network for segmentation. The ADE20K data set [19,20] was used to identify 150 categories of objects in indoor and outdoor scenes. The recognizable categories related to the landscape included natural sceneries (e.g., sky, grassland, ground, hills, fields, oceans, and lakes), natural objects (e.g., shrubs, trees, rocks, rivers, and flowers), urban sceneries (e.g., buildings, bridges, sidewalks, and roads), and urban objects (e.g., vehicles, bicycles, traffic signs, stairs, doors, and windows); 63 categories were selected for landscape elements. Semantic segmentation has wide applications in computer vision, including automatic pilot, image editing, medical image analysis, environmental monitoring, and agriculture. By classifying each pixel in an image accurately, semantic segmentation helps us to understand the image and facilitates the development and applications in related fields.
3. Results and Discussion
3.1. Questionnaire Survey
The questionnaire survey was conducted online in this study, and 159 valid questionnaires were collected. The respondents included 95 male respondents and 64 female respondents. Respondents aged 19–30, 31–40, and 41–50 years dominated, indicating that most participants were young and middle-aged. Most respondents had college and university degrees. The occupations of the respondents were not limited to the construction industry and other related industries, showing diverse occupations. The respondents had diverse social backgrounds which contributed to the comprehensive understanding of the responses.
The preliminary results of the questionnaire survey are shown in Table 1. The preference for artificial structures was significant. The respondents preferred many artificial elements in photos. The natural elements did not affect the respondent’s evaluation of the landscape. The participants’ preferences for the landscape were dependent on the proportion of natural and artificial elements and were affected by visual and emotional factors only. The photos with higher preference and SBE values showed neutral- or cool-toned colors and orderly arrangement. The respondents preferred the landscapes in such tones and appreciated landscapes with orderly arrangement. The combination of color and arrangement was a key factor that affected the aesthetic feeling of the respondents. In particular, the neutral- or cool-toned colors improved the calmness of the landscape and were preferred.

Table 1.
Preliminary analysis of the questionnaire results.
The intensity of positive perceptions was significantly correlated with the degree of preference. Landscapes with positive perceptions, such as tidiness, harmony, or pleasure, were preferred. It was in line with participants’ responses to the landscape. Negative perceptions such as disorder or depression were associated with a lower degree of preferences. The emotional response of the respondents to the landscape was important and affected the aesthetic evaluation of the landscape.
3.2. SBE
In this study, the RMRATE software (GTR-RM-195) [21,22] provided by the United States Department of Agriculture (USDA) was used to conduct SBE. Based on the questionnaire survey results, the RMRATE software was used to calculate the preferences of the photo, and the SBE values were calculated as shown in Table 2. The invited experts also evaluated the aesthetics of check dams.
Table 2.
Scenic beauty estimation results.
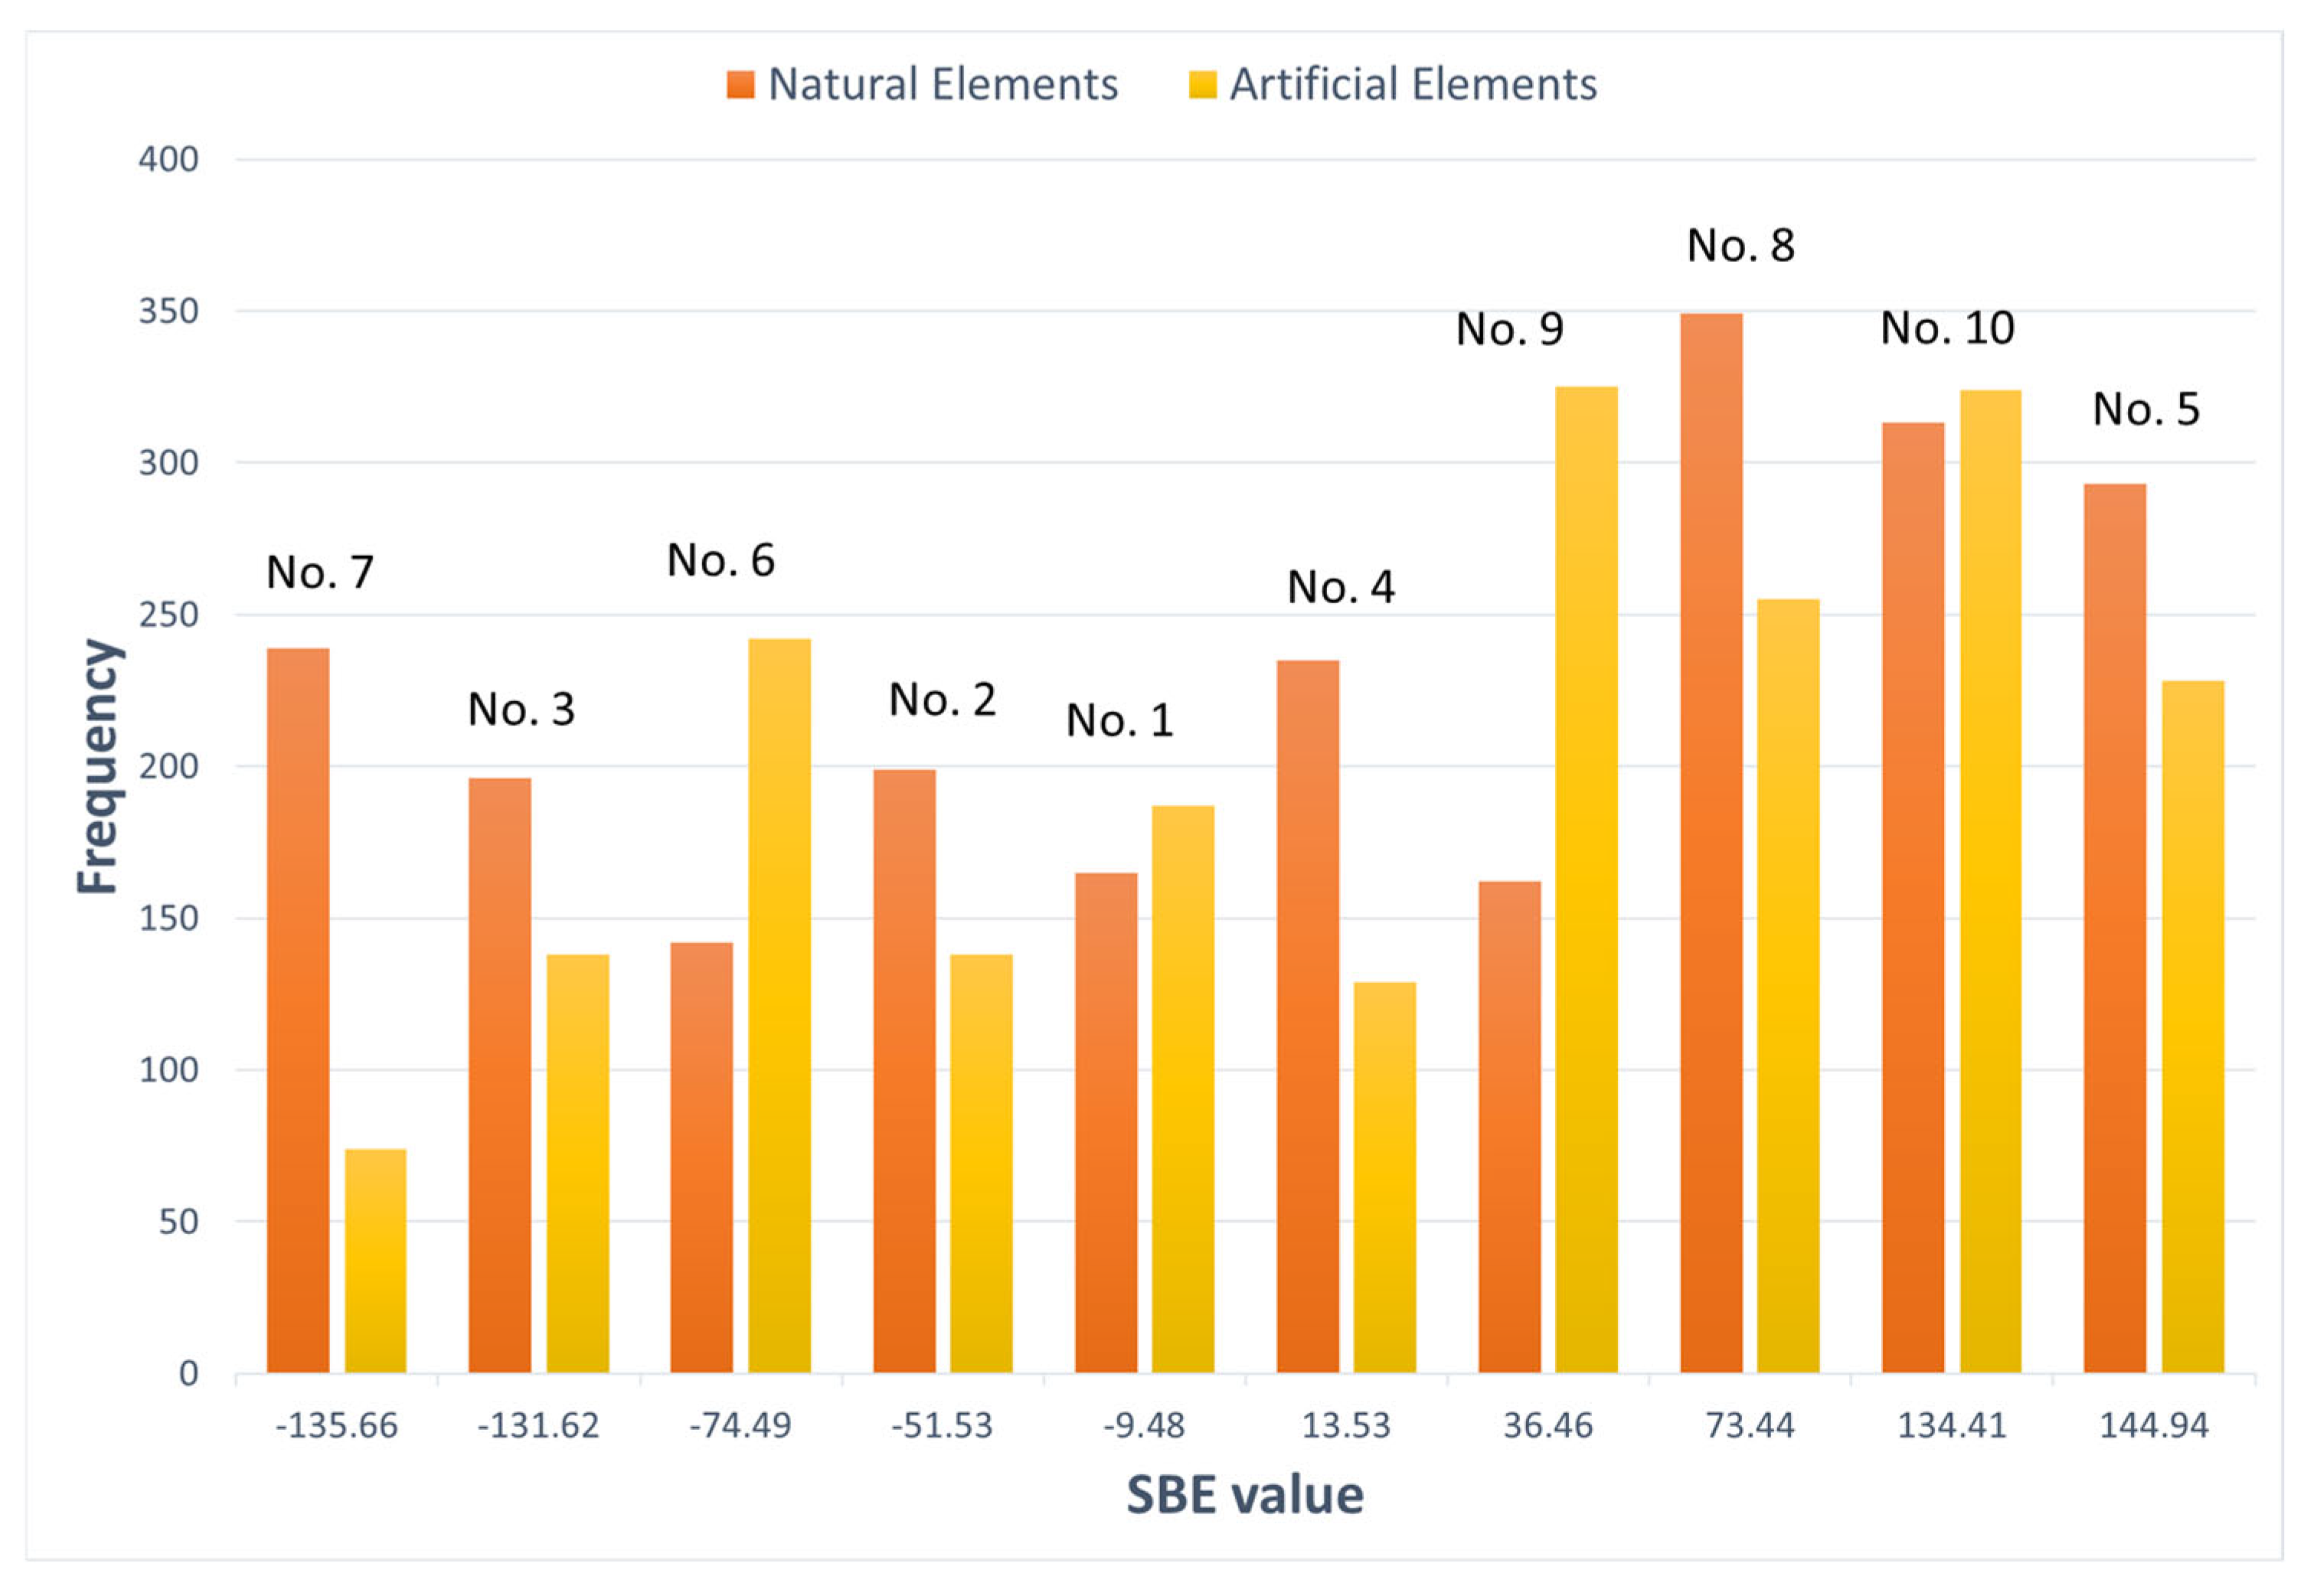
As shown in Figure 1, there was no significant difference in the impact of natural and artificial elements on the SBE value. Six photos showed more natural elements than artificial elements, and four photos presented more artificial elements than natural elements. The number of natural and artificial elements in a photo did not impact the popularity of the landscape. Recently, the design has focused on innovation and local features. As a result, the boundaries between artificial and natural elements become blurry. Without subsequent maintenance, the appearance of facilities changes from its original design, causing the loss of the initial design features. For this reason, there was no significant difference between natural and artificial elements.
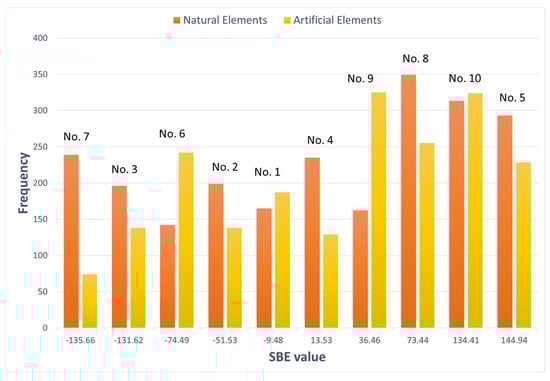
Figure 1.
Relationship between “elements” and SBE values.
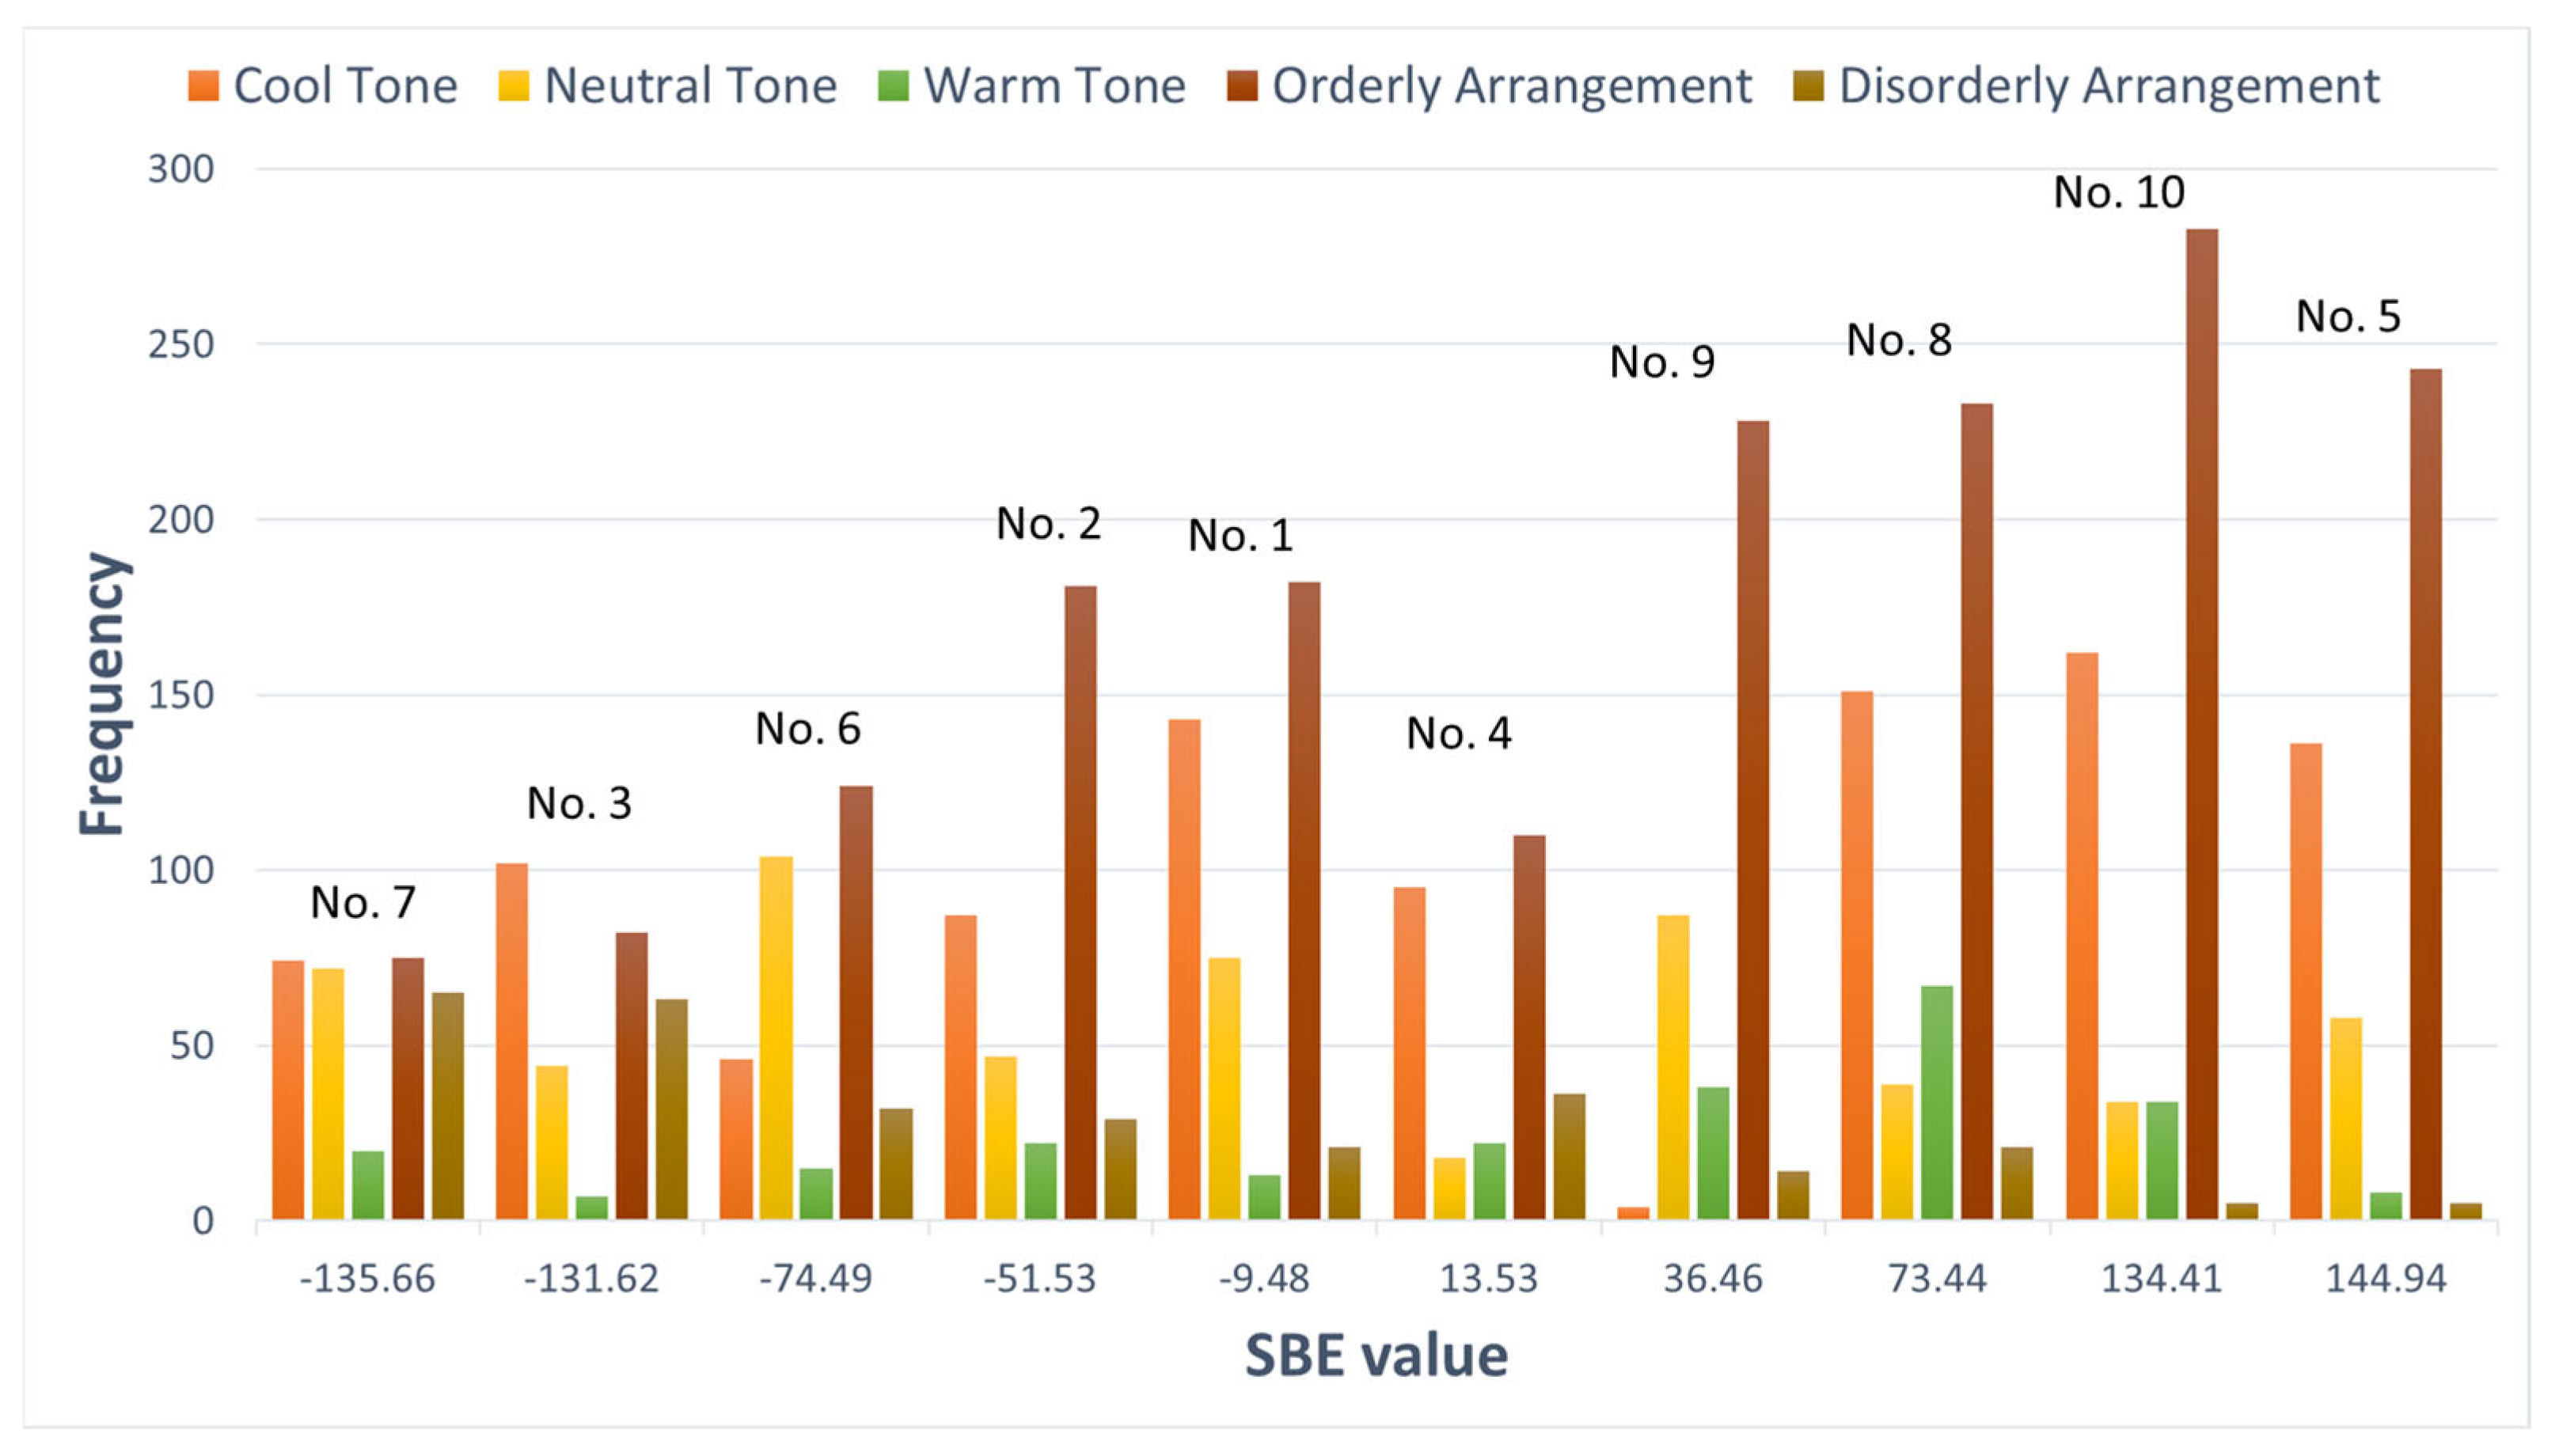
The analysis results of characteristics are shown in Figure 2. Photos with orderly arrangement and more cool-toned colors showed higher SBE values. The photos with higher SBE values had a higher proportion of cool-toned colors. However, in several photos with a low proportion of cool-toned colors, the SBE value was high. This indicated that the tone had a limited impact on the SBE value. The photos with disorderly arrangements had lower SBE values. There was a positive correlation between the orderly arrangement and the aesthetics.
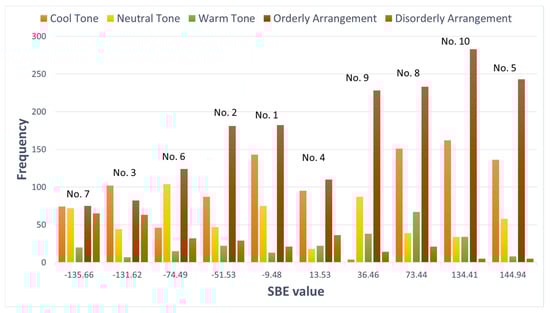
Figure 2.
Relationship between “characteristics” and SBE values.
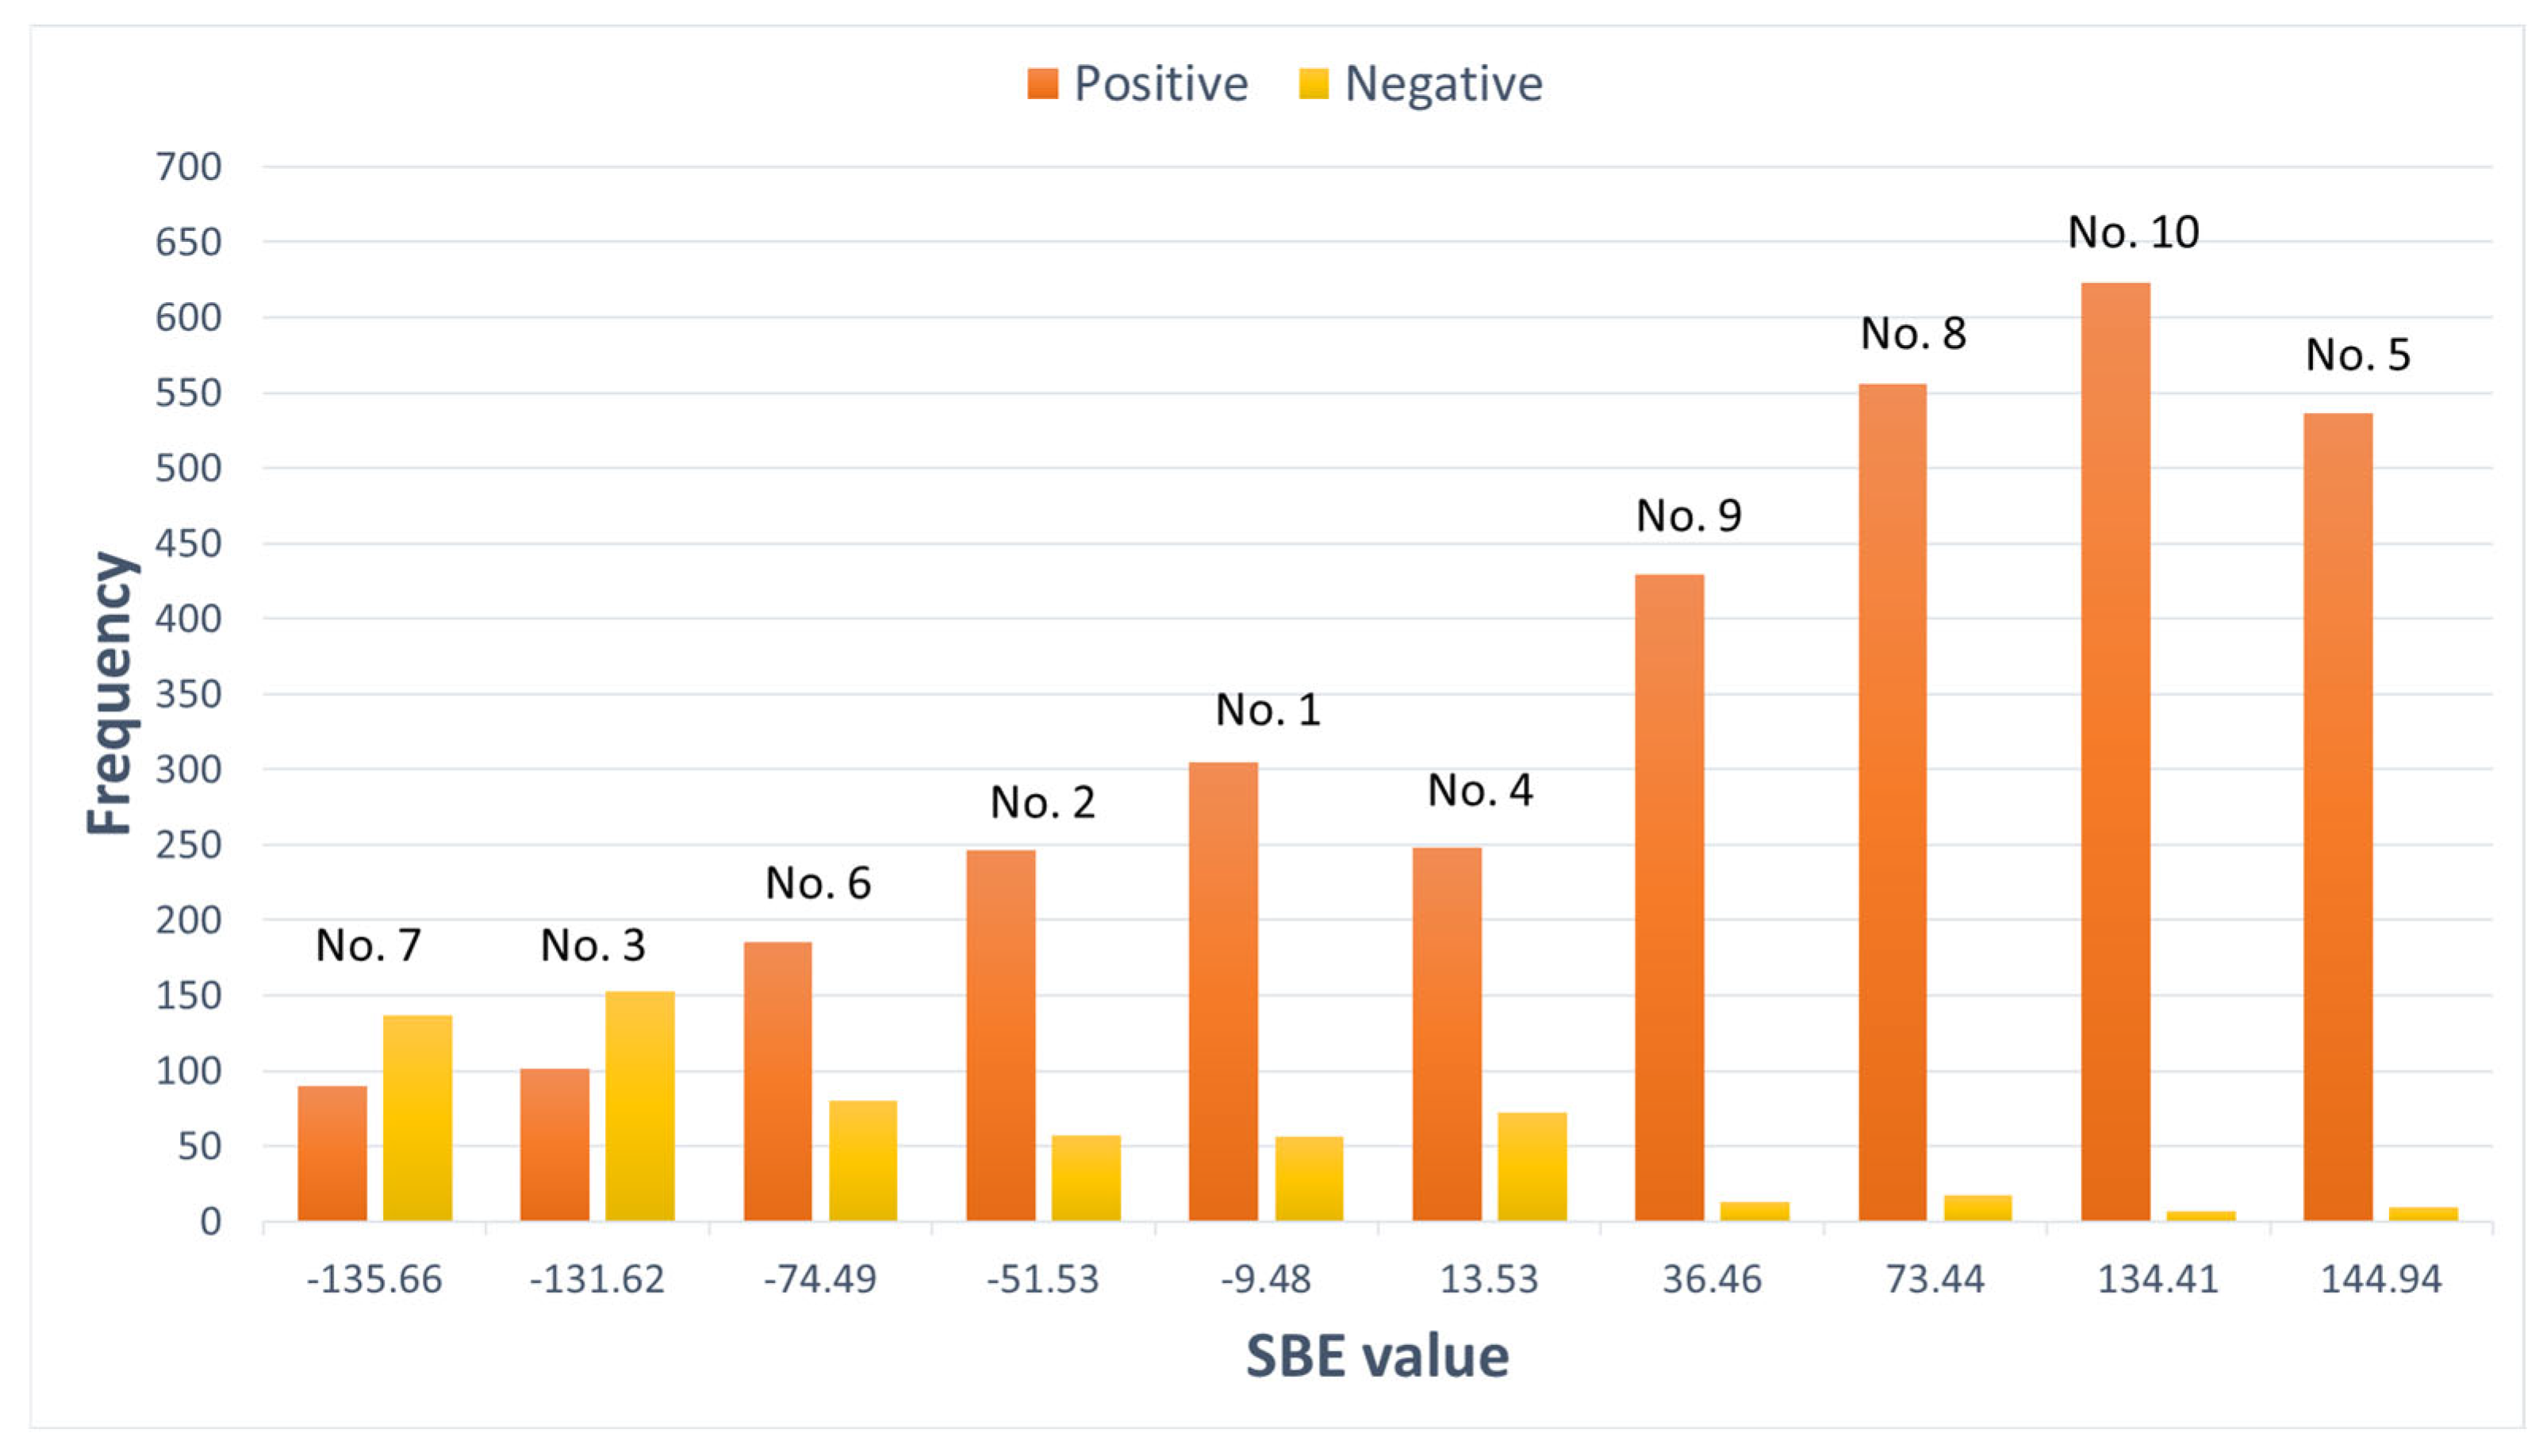
The positive perception increased the SBE value, while the negative perception significantly reduced the SBE value (Figure 3). Positive emotional response is important in the aesthetic estimation of the image.

Figure 3.
Relationship between “perceptions” and SBE values.
3.3. Semantic Segmentation
The photos were classified into “vegetation”, “structure”, “sky”, “land” and “water” using manual classification (original photos), the Swin-L model, and the DiNAT-L model. After the classification, MATLAB (R2024b) was used to convert the categories into the RGB color mode, and the proportion of each category was calculated. The analysis results are presented in Table 3. In the three photos with the highest SBE values, the proportion of vegetation exceeded 30% of all elements. However, the three photos with the lowest SBE values showed a smaller proportion of water while the proportion of the soil surface exceeded 40%. Although the proportion of vegetation was high in several photos, their SBE values were low due to the disorderly arrangement. The Swin-L model and the DiNAT-L model identified vegetation, structures, and land incorrectly. However, the performance of the DiNAT-L model was better than that of the Swin-L model as the DiNAT-L model showed higher accuracy for 80% of all photos.
Table 3.
Calculation of the proportions of photos’ categories with the semantic segmentation method.
4. Conclusions and Suggestions
Using the SBE method and the AI semantic segmentation technology, semantic aesthetic features of check dams were analyzed. The proportion of vegetation and water affected the SBE value. When the proportion of vegetation exceeded 30%, the aesthetic evaluation became high. On the contrary, when the proportion of land exceeded 35% and the proportion of water was less than 10%, the aesthetic evaluation was worse. Although a high proportion of vegetation makes the photo beautiful, disorderly vegetation was not preferred. The DiNAT-L model showed higher accuracy than the Swin-L model in identifying vegetation, structures, and land. When designing a soil and water conservation project, the proportion of vegetation and water must be increased, and vegetation must be arranged orderly to improve the aesthetic attraction of the landscape. In terms of the landscape element classification and scenic beauty estimation of the check dam, the DiNAT-L model performed best. The result of this study provides a basis for future semantic segmentation analysis.
Author Contributions
Conceptualization, S.-H.P. and H.-M.W.; methodology, H.-M.W. and M.-C.L.; software, H.-M.W. and M.-C.L.; validation, H.-M.W., M.-C.L. and S.-H.P.; formal analysis, H.-M.W.; investigation, H.-M.W.; resources, C.-Y.W.; data curation, H.-M.W.; writing—original draft preparation, H.-M.W.; writing—review and editing, S.-H.P.; visualization, H.-M.W.; supervision, C.-Y.W.; project administration, C.-Y.W.; funding acquisition, C.-Y.W. All authors have read and agreed to the published version of the manuscript.
Funding
This research received no external funding.
Institutional Review Board Statement
Institutional Review Board approval was not required for this study.
Informed Consent Statement
Informed consent was obtained from all subjects involved in the study.
Data Availability Statement
Data are available upon reasonable request. Please contact the corresponding author.
Acknowledgments
We would like to express our heartfelt gratitude to all anonymous participants who generously took the time to complete our questionnaire survey.
Conflicts of Interest
The authors declare no conflicts of interest.
References
- Liew, S. Types and Impacts of Debris Flow Failure in Tropical Hilly Terrain and Development Areas and its Practical Rehabilitation Solutions. In Proceedings of the 2nd Geotechnical Society of Singapore (GeoSS) and Malaysian Geotechnical Society (MGS) Conference 2023, Singapore, 30 November–2 December 2023. [Google Scholar]
- Wu, H.-L.; Feng, Z.-y. Ecological engineering methods for soil and water conservation in Taiwan. Ecol. Eng. 2006, 28, 333–344. [Google Scholar] [CrossRef]
- Pearlmutter, D.; Theochari, D.; Nehls, T.; Pinho, P.; Piro, P.; Korolova, A.; Papaefthimiou, S.; Mateo, M.C.G.; Calheiros, C.; Zluwa, I. Enhancing the circular economy with nature-based solutions in the built urban environment: Green building materials, systems and sites. Blue-Green Syst. 2020, 2, 46–72. [Google Scholar] [CrossRef]
- Zube, E.H.; Sell, J.L.; Taylor, J.G. Landscape perception: Research, application and theory. Landsc. Plan. 1982, 9, 1–33. [Google Scholar] [CrossRef]
- Kaplan, R.; Kaplan, S.; Brown, T. Environmental preference: A comparison of four domains of predictors. Environ. Behav. 1989, 21, 509–530. [Google Scholar] [CrossRef]
- Chen, J.-C.; Jiang, J.-G.; Wang, J.-S. The visual preference for riverbed vegetation: A case study in central Taiwan. Ecol. Saf. 2018, 12, 246–254. [Google Scholar]
- Chen, J.-C.; Huang, C.-L.; Chen, S.-C.; Tfwala, S.S. Visual harmony of engineering structures in a mountain stream. Water 2021, 13, 3324. [Google Scholar] [CrossRef]
- Peng, S.-H.; Han, K.-T. Assessment of aesthetic quality on soil and water conservation engineering using the scenic beauty estimation method. Water 2018, 10, 407. [Google Scholar] [CrossRef]
- Peng, S.-H.; Huang, C.-Y.; Chen, S.-C. Visual Language Translation Analysis and Scenic Beauty Estimation of Mountain Stream Facilities. Water 2022, 14, 3605. [Google Scholar] [CrossRef]
- Anderson, L.; Schroeder, H.W. Application of wildland scenic assessment methods to the urban landscape. Landsc. Plan. 1983, 10, 219–237. [Google Scholar] [CrossRef]
- Arthur, L.M.; Daniel, T.C.; Boster, R.S. Scenic assessment: An overview. Landsc. Plan. 1977, 4, 109–129. [Google Scholar] [CrossRef]
- Schroeder, H.W. Environmental perception rating scales: A case for simple methods of analysis. Environ. Behav. 1984, 16, 573–598. [Google Scholar] [CrossRef]
- Liu, X.; Deng, Z.; Yang, Y. Recent progress in semantic image segmentation. Artif. Intell. Rev. 2019, 52, 1089–1106. [Google Scholar] [CrossRef]
- Thoma, M. A survey of semantic segmentation. arXiv 2016, arXiv:1602.06541. [Google Scholar]
- Guo, J.; He, H.; He, T.; Lausen, L.; Li, M.; Lin, H.; Shi, X.; Wang, C.; Xie, J.; Zha, S. GluonCV and GluonNLP: Deep Learning in Computer Vision and Natural Language Processing. J. Mach. Learn. Res. 2020, 21, 845–851. [Google Scholar]
- Zhao, J.; Guo, Q. Intelligent assessment for visual quality of streets: Exploration based on machine learning and large-scale street view data. Sustainability 2022, 14, 8166. [Google Scholar] [CrossRef]
- Liu, Z.; Lin, Y.; Cao, Y.; Hu, H.; Wei, Y.; Zhang, Z.; Lin, S.; Guo, B. Swin transformer: Hierarchical vision transformer using shifted windows. In Proceedings of the IEEE/CVF International Conference on Computer Vision, Montreal, QC, Canada, 10–17 October 2021; pp. 10012–10022. [Google Scholar]
- Hassani, A.; Shi, H. Dilated neighborhood attention transformer. arXiv 2022, arXiv:2209.15001. [Google Scholar]
- Zhou, B.; Zhao, H.; Puig, X.; Xiao, T.; Fidler, S.; Barriuso, A.; Torralba, A. Semantic Understanding of Scenes Through the ADE20K Dataset. Int. J. Comput. Vis. 2019, 127, 302–321. [Google Scholar] [CrossRef]
- Zhou, B.; Zhao, H.; Puig, X.; Fidler, S.; Barriuso, A.; Torralba, A. Scene Parsing through ADE20K Dataset. In Proceedings of the 2017 IEEE Conference on Computer Vision and Pattern Recognition (CVPR), Honolulu, HI, USA, 21–26 July 2017; pp. 5122–5130. [Google Scholar]
- Brown, T.C. Scaling of Ratings: Concepts and Methods; U.S. Department of Agriculture, Forest Service, Rocky Mountain Forest and Range Experiment Station: Fort Collins, CO, USA, 1990. [Google Scholar]
- Daniel, T.C. Measuring the quality of the natural environment: A psychophysical approach. Am. Psychol. 1990, 45, 633. [Google Scholar] [CrossRef]


Disclaimer/Publisher’s Note: The statements, opinions and data contained in all publications are solely those of the individual author(s) and contributor(s) and not of MDPI and/or the editor(s). MDPI and/or the editor(s) disclaim responsibility for any injury to people or property resulting from any ideas, methods, instructions or products referred to in the content. |
© 2025 by the authors. Licensee MDPI, Basel, Switzerland. This article is an open access article distributed under the terms and conditions of the Creative Commons Attribution (CC BY) license (https://creativecommons.org/licenses/by/4.0/).