Proceeding Paper

The Efficiency of Drone Propellers—A Relevant Step Towards Sustainability †

Department of Aeronautical Engineering, Estonian Aviation Academy, Lennu 40, Reola, 61707 Kambja Parish, Tartu County, Estonia
*
Author to whom correspondence should be addressed.
Presented at the 14th EASN International Conference on “Innovation in Aviation & Space towards sustainability today & tomorrow”, Thessaloniki, Greece, 8–11 October 2024.
Eng. Proc. 2025, 90(1), 89; https://doi.org/10.3390/engproc2025090089
Published: 31 March 2025

Abstract

The static efficiency of a propeller cannot be determined in the same way as for propellers operating in the presence of freestream airflow. As various kinds of multirotor drones and small UAVs operate in hovering or nearly hovering modes, it is necessary to develop methods for determining and measuring the static aerodynamic efficiency of small-scale propellers. Propellers with a Reynolds number near the 0.75 R, where the blade section is less than 500,000, are considered to be at a critical value, i.e., the estimated border between two flow modes—laminar and turbulent. The efficiency of small-scale propellers may be hard to predict through modeling, making direct empirical measurements invaluable in this situation.

1. Introduction

The worldwide use of small-scale UAVs has increased interest in the efficiency of small-scale propellers that are used to power these devices. Several papers have been published on the subject of theoretical and empirical methods to determine the efficiency of low Reynolds number propellers. The main trend among the results is that the efficiency of small-scale propellers depends considerably on the Reynolds number, especially for values around the order of magnitude of 100,000. It has also been observed that the impact of the Reynolds number on propeller efficiency is often hard to predict theoretically [1,2]. Most investigations focus on determining the propulsive efficiency of the propeller, which leads to the use of freestream velocity or advance ratio of the propeller as key parameters for efficiency calculation [3,4]. It is also known that many UAVs are of a multirotor design and spend the majority of their flight time in hovering or near-hovering flight modes. In hovering flight mode, the determination of efficiency via advance ratio is not suitable, as the latter equals zero (or nearly zero). The propeller efficiency, defined as the ratio of thrust to power (or the ratio of corresponding coefficients), cannot serve as a universal characteristic for efficiency calculation. It is known that the best values of this ratio (reaching values up to 2–3 N/W) are achieved by extra-slow-rotating and huge propellers, such as those used in human-powered helicopters. However, propellers of that kind are not suitable for small-scale hovercrafts. The present approach [5] proposes that the efficiency of the propeller be defined as the ratio of induced power to input power in hovering flight. The input power is the product of torque and angular velocity, both of which can be easily measured empirically. The induced power is the product of thrust and mean induced velocity. Since thrust can also be easily measured, the main problem is measuring the induced velocity. This necessitates radial scanning of the propeller slipstream velocity closest to the propeller blade face (as close as possible to the plane of rotation) using calibrated three-dimensional airflow sensors and a corresponding registration system.

2. Approach Methods

The slipstream consists of three airspeed components: axial velocity, radial velocity (due to contraction), and tangential velocity (due to slipstream rotation), as presented in Figure 1.
Among these components, only the axial component determines the volumetric rate. Therefore, this particular component will be used to calculate the induced power. The mean induced velocity will be presented as the ratio of the induced volumetric rate and the area swept by the propeller:
V i ¯ = V v π R 2
where V v is the volumetric rate and R is the propeller radius.
The induced volumetric rate is calculated by integrating the radial distribution of the axial velocity component over the propeller area:
V v = 0 R V a ( r ) × r × d r
where V a ( r ) is the distribution of axial velocity along the radial parameter r.
The efficiency of the propeller is then calculated as follows:
η = T × V i ¯ M × w
where M and w are the measured torque and angular velocity, T is the thrust, and V i ¯ is the mean induced velocity.
Many other parameters can be determined from the measured values of T, M, V i ¯ , and w, such as the helix angle for all blade sections:
β = a r c c o s w × r V t V T
where V t is the tangential velocity at a distance r from the axis, V T is the total airspeed over the blade section, and w is the angular velocity. The total airspeed can be expressed as follows:
V T = w × r V t 2 + V a 2 + V r 2
Knowing the distribution of the blade angle γ along the blade, it will be possible to determine the distribution of the angle of attack α along the blade:
α = γ β
The coefficients of thrust and power are calculated using the well-known formulae for those parameters:
C T = T ρ w 2 D 4 ;   C P = P ρ w 3 D 5

3. Test Object

The test object was a 20.2″ propeller equipped with a set of interchangeable hubs, allowing for different blade angle settings (i.e., varying geometric pitch) to the propeller. The propeller blades were taken from a manufacturer named T-Motor (Baunatal, Germany), model name FA20.2*6.6 sourced from German supplier and it is a static use-oriented propeller. The airfoil at the 0.75R section has an approximate relative thickness of 8% and a relative camber of about 3.5%. This airfoil was considered similar to the NACA 6409 airfoil, and the corresponding data for that particular airfoil were obtained from the Airfoil Database. The propeller was tested across a range of RPM values from 2000 to 5000 (0.75R Reynolds number from 80,000 to 200,000) and 0.75R geometric pitch from 33% of the propeller diameter up to 100% of the propeller diameter. The scanning of the airspeed was performed at a distance of 8 mm from the trailing edge of the propeller blade. The scanning system maintained a constant distance, adjusting for the specific planform of the propeller being monitoring.

4. Results

Figure 2 presents the radial distributions of airspeed components for a 20” static use-oriented propeller operating at 5000 RPM with a geometric pitch of 1/3 of the propeller diameter:
For comparison, Figure 3 shows the same distributions when the blades of the same propeller were set to a coarser pitch, equal to the full propeller diameter:
The radial distribution of the angle of attack for the fine-pitch configuration (geometric pitch equal to 1/3 of the propeller diameter), which corresponds to the highest efficiency of 83%, is presented in Figure 4.
The thrust coefficient, power coefficient and efficiency were determined at different RPM values: 2000, 3000, 4000, and 5000. This range of RPM covers the intercept of Reynolds numbers at the 0.75R blade section from 80,000 to 200,000. As an example, the dependence of these parameters on the Reynolds number is presented in Figure 5.

5. Discussion

As shown in Figure 5, the thrust coefficient increases by approximately 4% while the power coefficient decreases by about 8% as the Reynolds number rises from 80,000 to 200,000. These results align well with the general observations noted in [6]. However, this holds true only for the geometric pitch that corresponds to the maximum value of efficiency (83% of efficiency at D/3 of geometric pitch). Increasing the geometric pitch, one could find different behavior of thrust and power coefficients with the Reynolds number increasing. Since the Reynolds number is not significantly affected by geometric pitch, it could be concluded that, at a constant Reynolds number, the static efficiency of a propeller is primarily influenced by its geometric pitch, and that dependence is much stronger than the dependence on the Reynolds number between 80,000 and 200,000. Additionally, Figure 5 suggests that although the thrust coefficient increases and the power coefficient decreases, the efficiency does not change within the measurement error limits. It also must be declared that in the case of different propellers investigated, one can find different behaviors of thrust and power coefficients and efficiency with the Reynolds number increasing, making it difficult to establish general tendencies. However, it seems that the static efficiency does not have a strong correlation with the dependence of thrust and power coefficients on the Reynolds number. As seen in Figure 4, the angle of attack for the most effective blade sections ranges between −2 and 0 degrees. The NACA 6409 airfoil, which is quite similar to that of the airfoil for the 0.75R blade section of the propeller investigated, achieves its highest lift-to-drag ratio at about 5 degrees for Re = 200,000. As seen in Figure 4, this is far from the values that are registered in the case of the most efficient geometric pitch. Values of 5 degrees were achieved in the case of the geometric pitch equaling to D, but in this case, the efficiency dropped to 40–41%. In Figure 2 and Figure 3, one can find a correlation between the efficiency and the axial-to-tangential velocity ratio. With fine pitch (83% efficiency), the ratio is approximately 4 near the most effective sections (see Figure 2), but in the case of coarse pitch (41% efficiency) (see Figure 3), this ratio can be nearly 1. This tells us that with the geometric pitch increasing the coefficient of power (this is the same as the coefficient of torque) increases more quickly than the coefficient of thrust, causing the slipstream to whirl at higher angular velocity. Based on the results, several conclusions can be drawn. Firstly, the static efficiency is primarily influenced by propeller planform, airfoil shape, and blade angle of the propeller rather than RPM. This means that the changes in efficiency between Reynolds numbers of 80,000 and 200,000 are small and not comparable with the changes caused by variations in the geometric pitch at the constant Reynolds number. It also can be concluded that the efficiency is not found to be in correlation with the behavior of thrust and power (torque) coefficients with the Reynolds number changing. Secondly, it should be noted that the propeller works at its best efficiency with its main blade parts operate at significantly lower angles of attack (about −1.5 deg.) compared to the angle of attack corresponding to the best lift/drag ratio for the blade airfoil (about 5 deg.).

6. Conclusions

The main conclusions based on the present empirical results can be made as follows:
  • The best static efficiency of a commercial static use-oriented propeller reaches approximately 83% when the geometric pitch is about 1/3 of the propeller diameter.
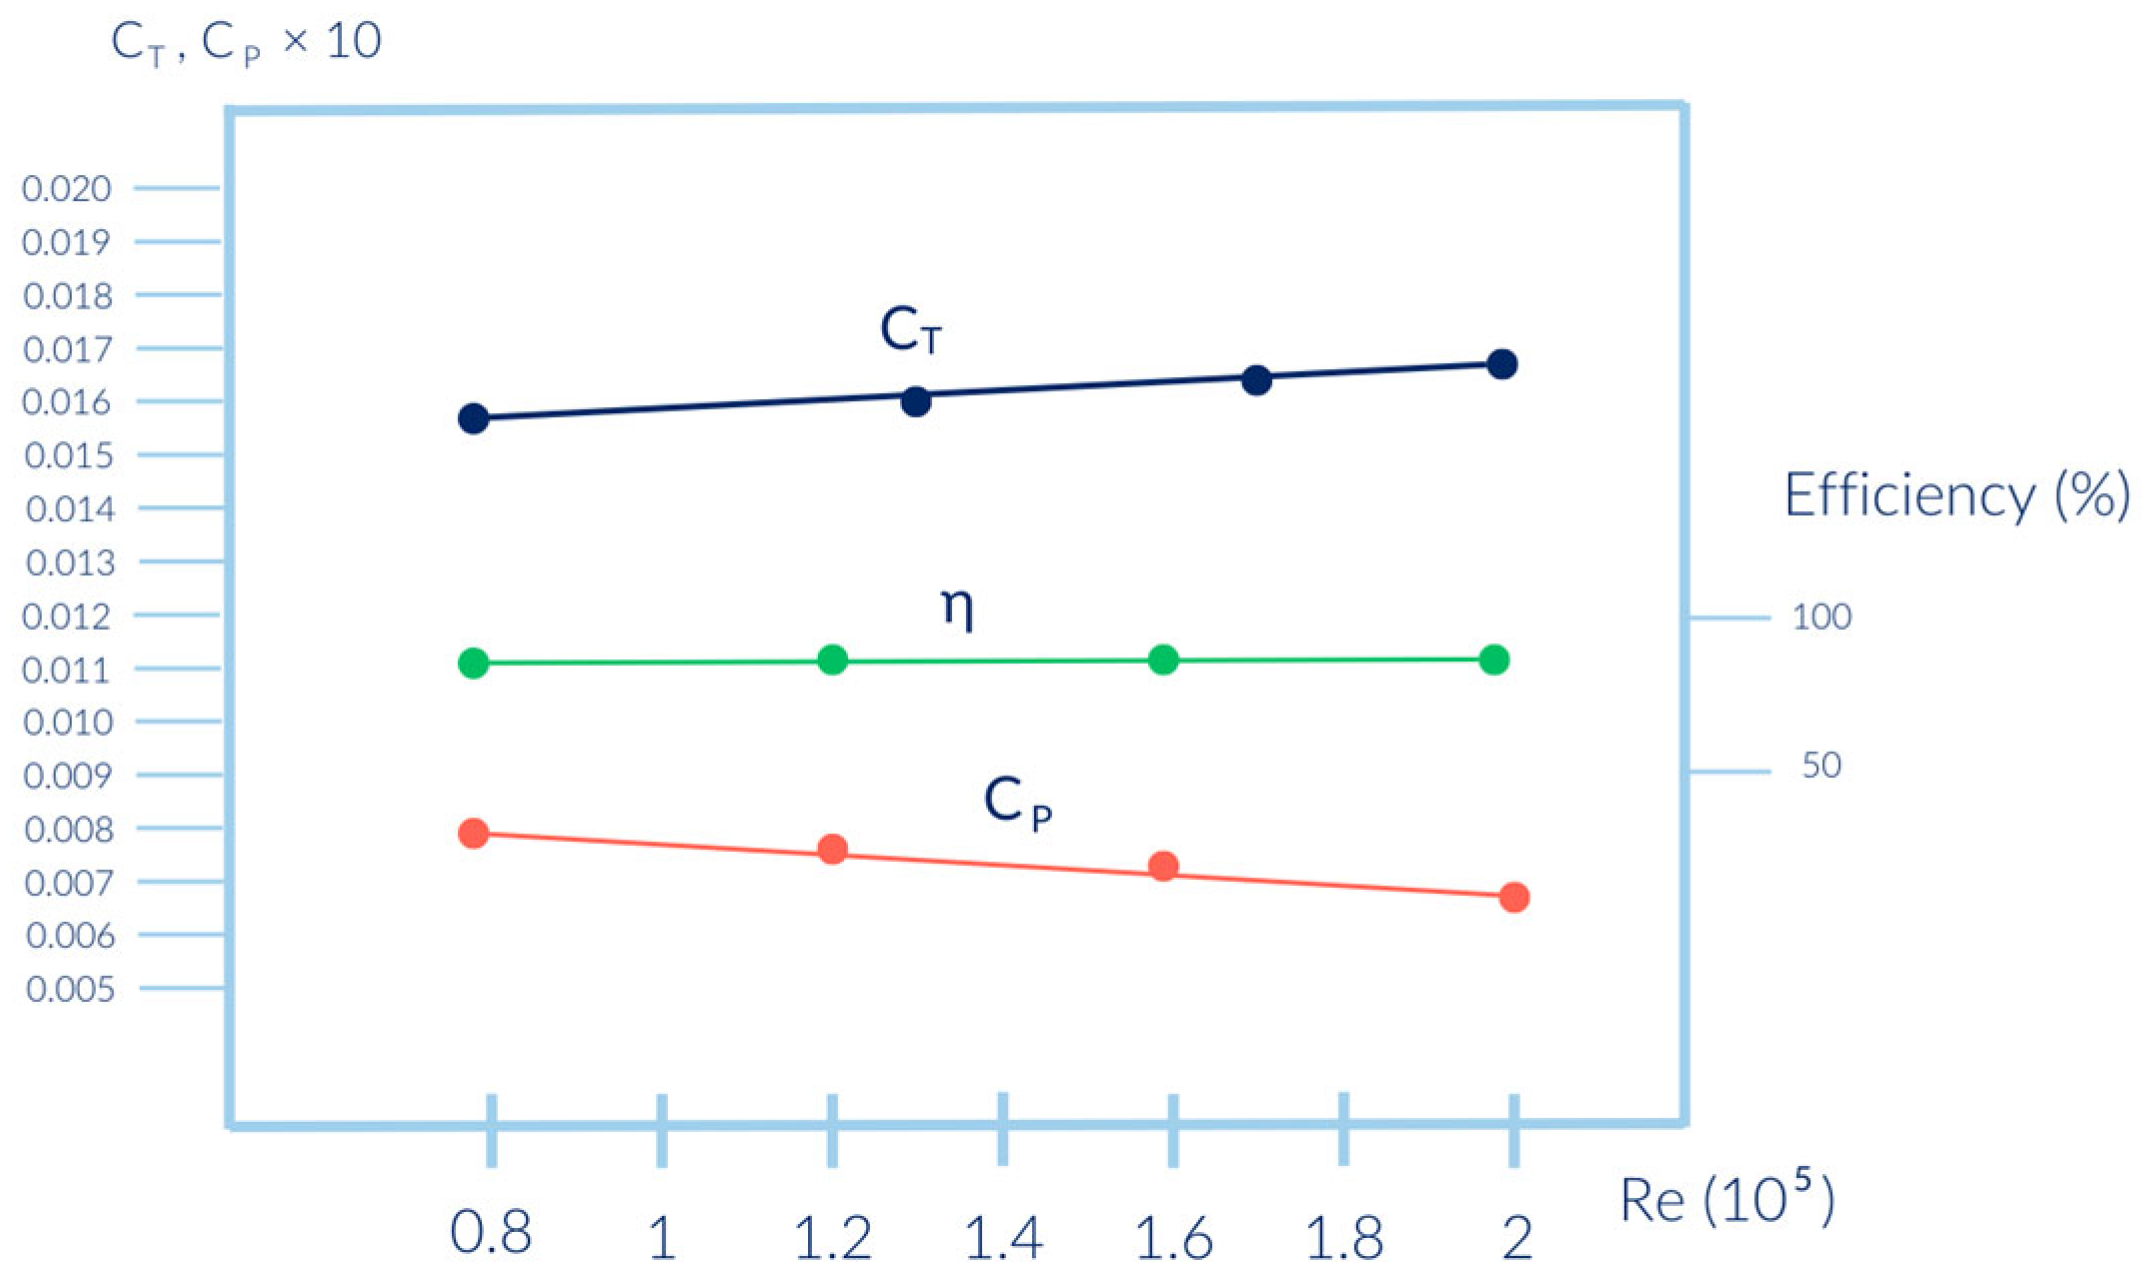
  • The static efficiency at the constant Re number depends strongly on the geometric pitch, and it may drop more than twice with the geometric pitch increasing from D/3 to D.
  • The static efficiency for all tested values of the geometric pitch does not depend considerably on the Reynolds number in the range of 80,000 to 200,000, in spite of clearly detected changes in thrust and power coefficients in that region.
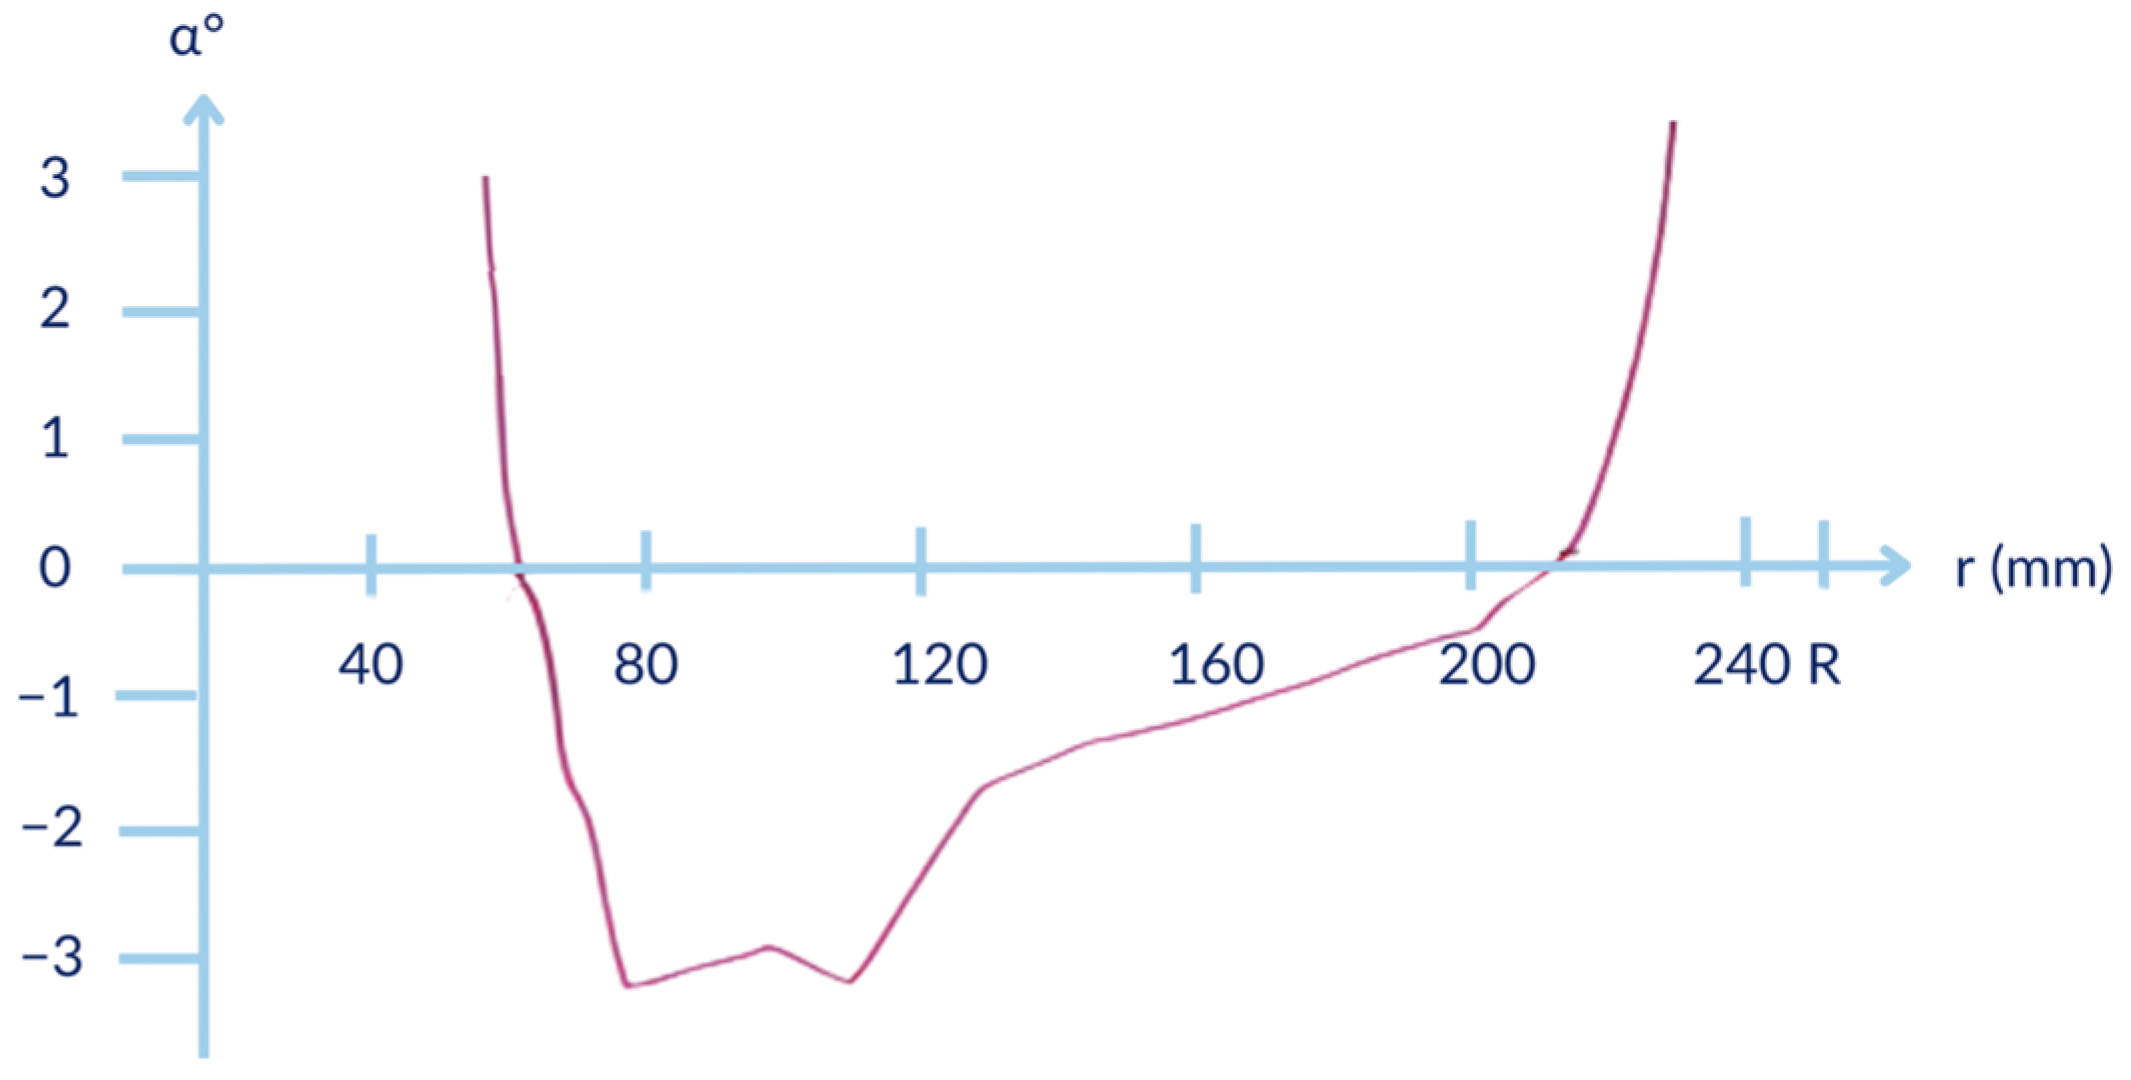
  • The most effective blade sections (around 0.75R) in the case of the most efficient blade settings (geometric pitch 0.33D) work at much lower values of angle of attack than the angle of attack for the best lift/drag ratio for the airfoil of those sections.
In general, to further improve the quality and efficiency of small-scale propellers, additional research is needed to determine which specific parameters and working conditions of the propeller have more or less impact on its performance and efficiency. Future surveys in this particular field should explore various factors influencing propeller efficiency, particularly the effects of inflow and outflow disturbances caused by propeller-driving motors and other construction parts in pull-type and push-type propellers. Addressing these disturbances remains a key challenge for optimizing propeller design and performance.

Author Contributions

Conceptualization and methodology, J.S. and K.-E.U.; software, validation, and experiments, S.H.; writing—original draft preparation, J.S.; writing—review and editing, K.-E.U. and S.H. All authors have read and agreed to the published version of the manuscript.

Funding

This research received no external funding.

Institutional Review Board Statement

Not applicable.

Informed Consent Statement

Not applicable.

Data Availability Statement

The results and experimental data can be provided upon request.

Conflicts of Interest

The authors declare no conflicts of interest. Other parties had no role in the design of this study; in the collection, analysis, or interpretation of the data; in the writing of the manuscript; or in the decision to publish the results.

References

  1. Bass, R.M. Small Scale Wind Tunnel Testing of Model Propellers. In Proceedings of the 24th Aerospace Sciences Meeting, Reno, NV, USA, 6–9 January 1986. [Google Scholar]
  2. Moffitt, B.A.; Bradley, T.H.; Parekh, D.E.; Mavris, D. Validation of Vortex Propeller Theory for UAV Design with Uncertainty Analysis. In Proceedings of the 46th AIAA Aerospace Sciences Meeting and Exhibit, Reno, NV, USA, 7–10 January 2008. [Google Scholar]
  3. Brandt, J.B. Small-Scale Propeller Performance at Low Speeds. Master Thesis, University of Illinois at Urbana Champaign, Urbana, IL, USA, 2005. [Google Scholar]
  4. Merchant, M.P.; Miller, L.S. Propeller Performance Measurement for Low Reynolds Number UAV Applications. In Proceedings of the 44th AIAA Aerospace Sciences Meeting and Exhibit, Reno, NV, USA, 9–12 January 2006. [Google Scholar]
  5. Susi, J.; Unt, K.-E.; Heering, S. Determining the Efficiency of Small-Scale Propellers via Slipstream Monitoring. Drones 2023, 7, 381. [Google Scholar] [CrossRef]
  6. Deters, R.W.; Ananda, G.K.; Selig, M.S. Reynolds Number Effects on the Performance of Small-Scale Propellers. In Proceedings of the 32nd AIAA Applied Aerodynamics Conference, Atlanta, GA, USA, 16–20 June 2014. [Google Scholar]
Figure 1. The three components of a propeller slipstream: V a —axial velocity, V t —tangential velocity, V r —radial velocity.
Engproc 90 00089 g001
Figure 2. Radial distributions of V a , V t and V r for a 20” propeller with a geometric pitch of 1/3 of the diameter at 5000 RPM. Efficiency 83%. Airspeed directed towards the axis is considered negative.
Engproc 90 00089 g002
Figure 3. Radial distributions of V a , V t and V r for the same 20″ propeller with a geometric pitch equal to the propeller diameter at 5000 RPM. Efficiency 41%.
Engproc 90 00089 g003
Figure 4. Radial distribution of the angle of attack for a geometric pitch of D/3 at 5000 RPM.
Engproc 90 00089 g004
Figure 5. Thrust coefficient, power coefficient and efficiency versus the Reynolds number for the 0.75R blade section in the case of D/3 geometric pitch.
Engproc 90 00089 g005
Disclaimer/Publisher’s Note: The statements, opinions and data contained in all publications are solely those of the individual author(s) and contributor(s) and not of MDPI and/or the editor(s). MDPI and/or the editor(s) disclaim responsibility for any injury to people or property resulting from any ideas, methods, instructions or products referred to in the content.

