Abstract
This study presents a virtual demonstration of the electrical environmental control system (eECS) in its relevant environment, showcasing a novel collaborative approach based on extensive model exchange between partners. This methodology enabled an accelerated evaluation of eECS integration into aircraft. Closed-loop simulations were conducted to verify the integration of the eECS within overall aircraft air systems, confirming its performance and stable operation. Furthermore, this work confirms the value of “Risk Driven Development” regarding focusing on critical components and using a combination of testing, modeling, and simulation, allowing Research and Technology partners to reduce development time and increase the maturity of new technologies for use in future aircraft.
1. Introduction
The environmental control system (ECS) is one of the largest non-propulsive energy consumers on an aircraft and deserves special attention due to its architecture having a direct impact on the sizing of electrical energy generation and pneumatic distribution systems. State-of-the-art ECS technology is largely based on bleed air-driven architectures [1]. However, the increasing emphasis on clean aviation introduces new challenges for the industry, necessitating the development of more efficient and innovative systems. Among these innovations, electric systems play a pivotal role in achieving sustainability targets [2,3].
As part of the Research and Technology project “CleanSky2 - ITD Systems”, a virtual demonstrator for Air Systems and Thermal Management was developed to assess the multi-system integration and the associated performance of the newly developed electrical environmental control system within a representative aircraft environment; this utilized a “Risk Driven Development (RDD)” approach, as presented at the EASN conference held in 2022 in Barcelona [3]. The RDD approach focuses on critical components using a combination of testing, modeling, and simulation.
Traditional development methods rely heavily on physical testing, which is both resource-intensive and time-consuming. In contrast, virtual testing offers a promising alternative, enabling early-stage performance evaluation while minimizing reliance on physical prototypes. However, the integration of virtual testing methods into the development process remains underexplored and represents a significant technological advancement.
This study conducted a virtual demonstration integrating the Liebherr eECS dynamic model into an Airbus Air Systems dynamic simulation, its “representative virtual environment”. This required precise and well-tuned models to accurately replicate real system behavior while addressing numerical challenges inherent in integrating different models, a task more complex than dealing with either detailed but partial models or integrated yet simplified models [4].
The construction of this virtual demonstrator involved integrating various sub-models with the objective of meeting necessary validation requirements for system development, which included:
- Verifying the eECS flow and temperature response, along with overall cabin thermal behavior, to meet certification requirements and ensure passenger and crew comfort.
- Assessing the impact of the eECS cabin recovery flow on cabin flow balance and its interaction with the pressure control system.
- Evaluating the effect of power electronic waste heat on cabin heat balance and the cooling capability of the packs.
- Simulating extreme environmental corner cases to validate system performance and behavior.
- Conducting failure case simulations.
2. Materials and Methods
The idea of integrating the sub-system model into the overall system simulation was driven by various factors. Individual sub-models are created in different development and simulation environments, and each is optimized for the specific submodel. For example, controller systems are often developed in the Matlab/Simulink environment, where the necessary libraries and toolboxes are available. Thermal systems, such as the cabin, the cooling pack, or the air distribution system, can be effectively simulated in the Dymola environment using the Modelica modeling language.
Additionally, it is necessary to protect the intellectual property of the project partners. Therefore, certain parameters and equations should not be accessible to all project participants. Black box models can guarantee data security by using the functional mockup interface (FMI) for interface definition. Sub-models that support this interface are called Functional Mockup Units (FMUs) [5]. For this project, sub-models from partners were exported as co-simulation FMUs with agreed input and output signals that can be coupled to enable a dynamic co-simulation.
2.1. Modeling Structure and Interfaces
The main goal was to develop a generic interface concept that allows models from different sources to be simulated together. The approach was to divide the overall model into individual sub-models, each with a main interface. To standardize the connection of these interfaces, three types of connectors were defined:
- Expandable sub-model output connectors (sub-model output bus);
- Physical flow connectors (flow bus);
- Expandable main connector (main bus).
The expandable main bus connector includes all physical flow and sub-model output connectors. Each sub-model uses one expandable output connector for all output variables, with certain key variables specified. The physical flow connector enables flow connections between two sub-models, while the electric power connector links the electrical components of the pack sub-model with the power electronic compartment in the cabin sub-model. All expandable output connectors and physical flow connectors are part of a single main connector, which contains all exchanged variables within the interface. This interface is suitable for evaluating the results, requiring only one connection between the sub-models.
2.2. Physical Model Description
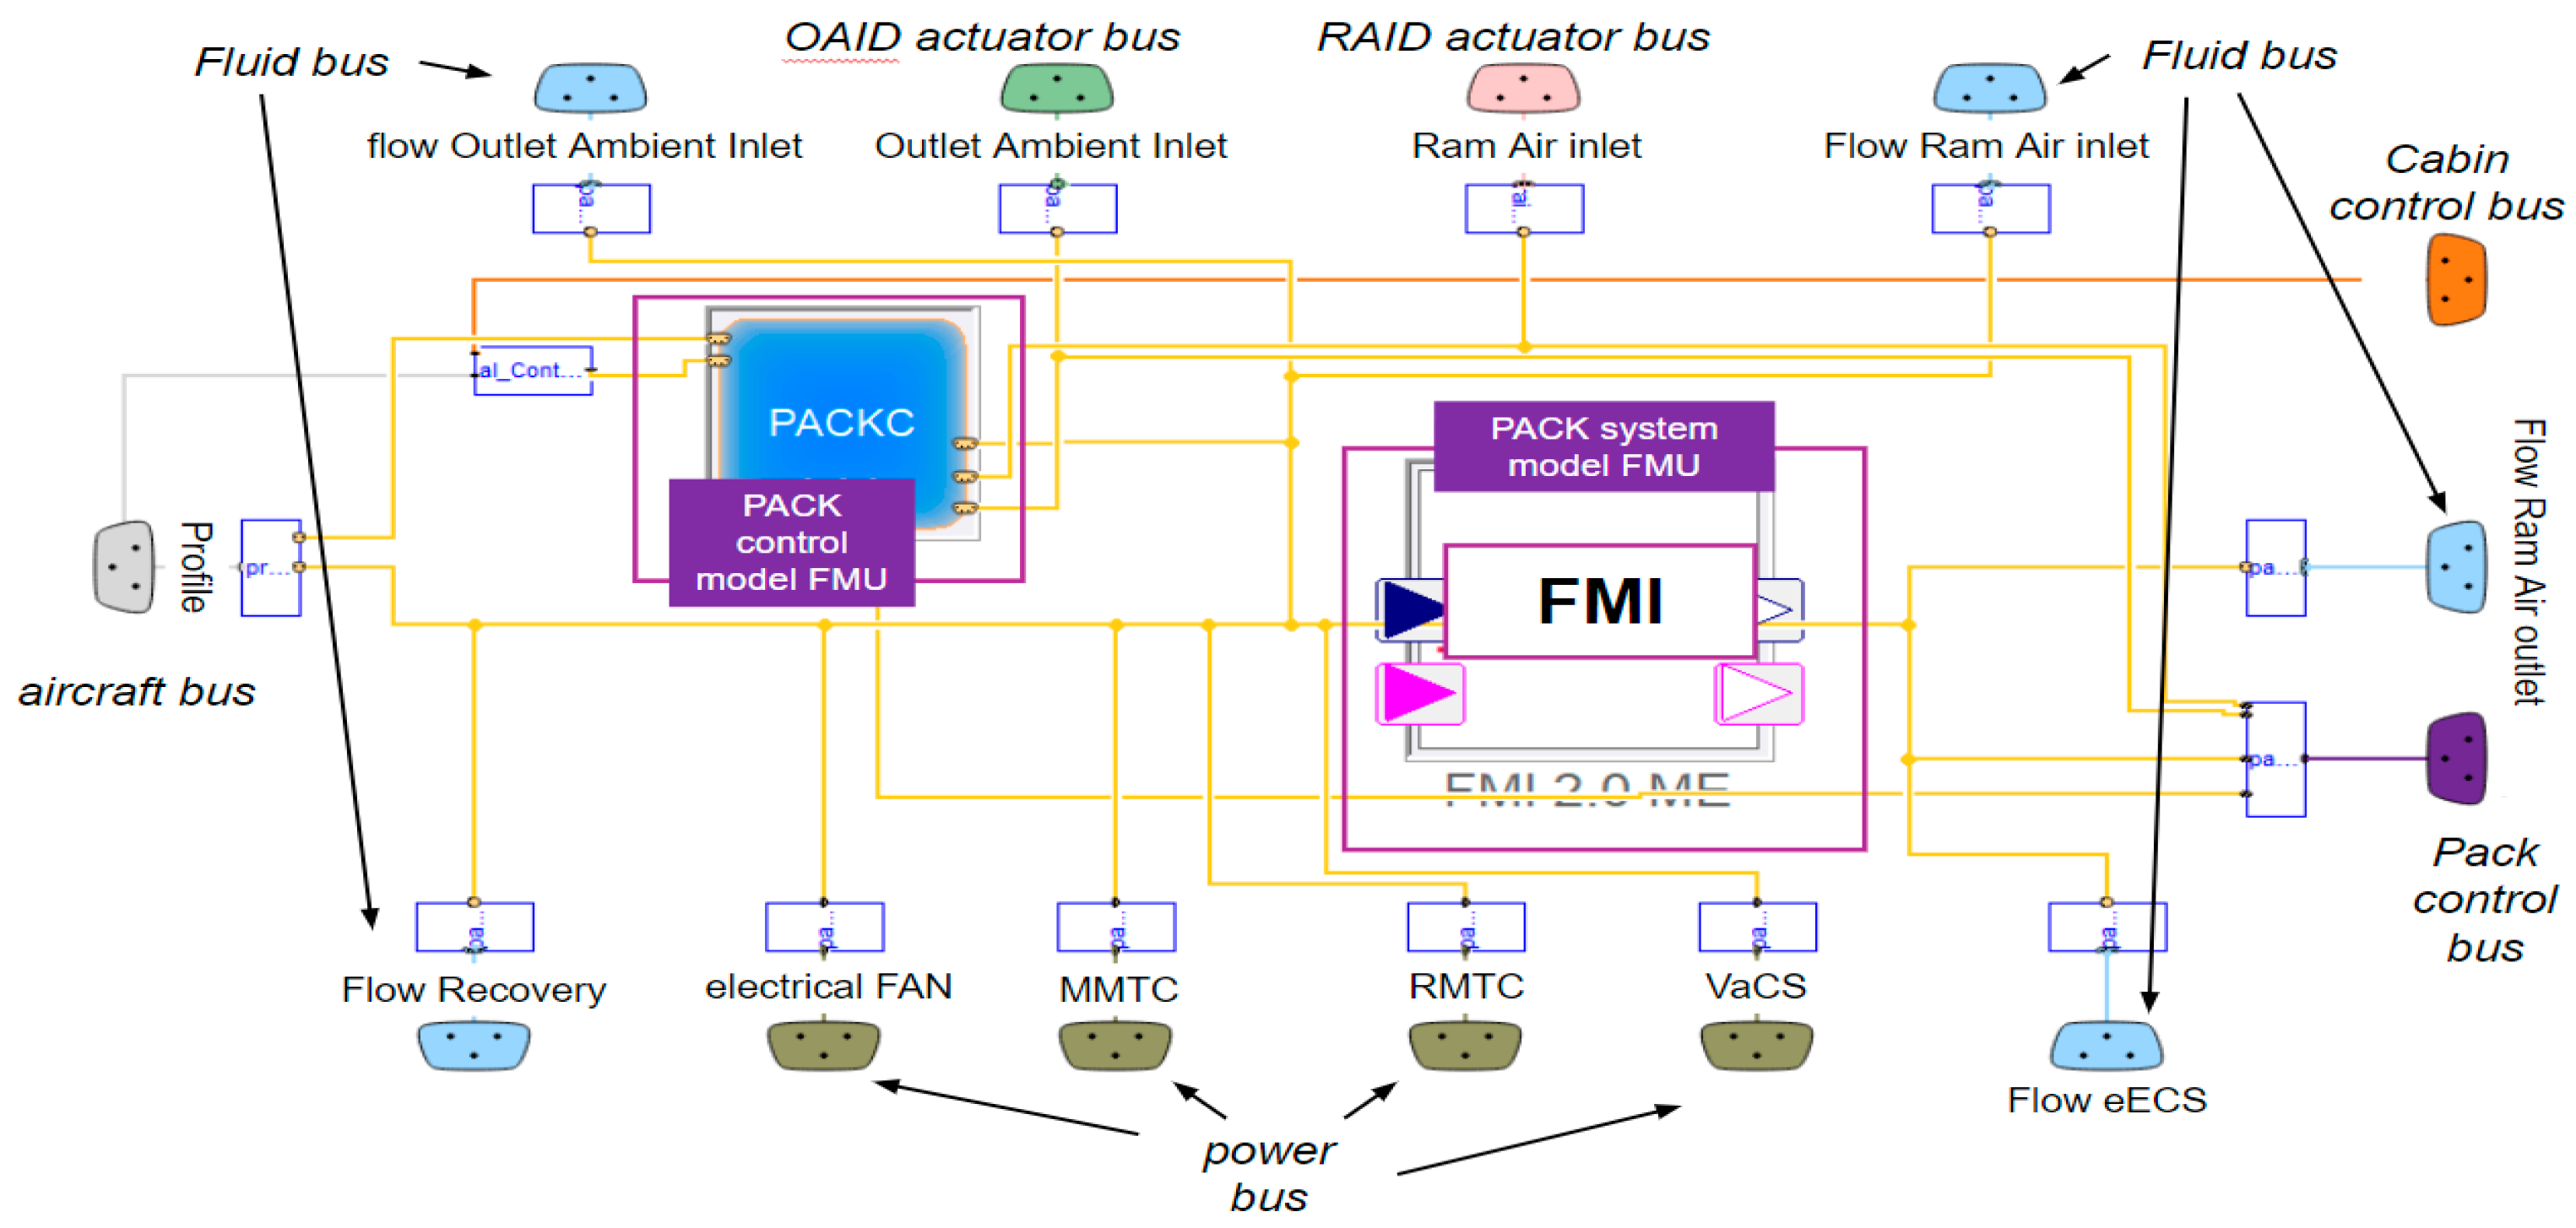
The overall Aircraft Air System model consists of the following sub-models: User Input (selected zone temperature; disabled components), Control (all non-pack controllers, cabin pressure, and zone temperature), Cabin (incl., underfloor zone, air supply, distribution, recirculation, and mixing unit), Pack 1/2 (pack and pack control), OAI 1/2 (outside air inlet), RAI 1/2 (ram air inlet), RAO 1/2 (ram air outlet), and Flight Profile (altitude, Mach, etc.). These sub-models are linked, as shown in Figure 1, to build the overall Aircraft System model structure.
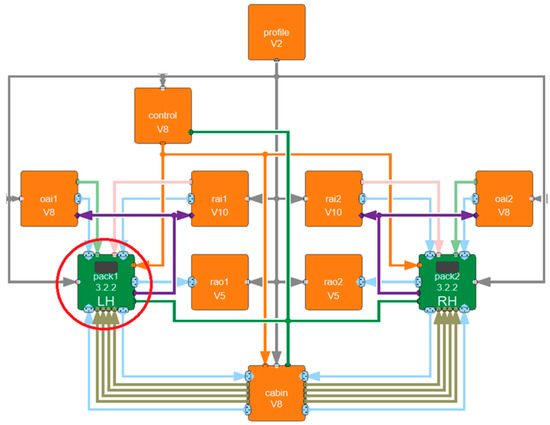
Figure 1.
Overall model and signal flow.
2.2.1. Aircraft Air Systems (Inlets, Ventilation, and Cabin Pressurization)
The Airbus Air Systems model consists of separate sub-model blocks that cover the following parts of the system and share an interface with the eECS module and/or other blocks.
- (a)
- Air intakes and outlets.
- Ram air enters the aircraft fuselage through specifically designed inlets at the belly fairing, serving as a heat sink for the eECS. Outside air enters the fuselage through separate dedicated intakes and is further processed in the eECS to pressurize the cabin and supply fresh air to occupants. Ram air inlets (RAI), ram air outlets (RAO), and outside air intakes (OAI) are modeled as separate blocks using aircraft-specific data and correlations from ESDU 86002 [6]. The ram air intake flap is controlled by the eECS controller and shares a signal interface with that block. Additionally, the physical properties of the airflow through these three inlets and outlets are exchanged with the eECS plant model.
- (b)
- Several model features specifically developed for this case are combined within the “cabin” block, which includes the fully pressurized fuselage as well as unventilated zones, such as the underfloor area.
- Cabin and cockpit heat loads are, in addition to the fuselage pressurization, the main drivers for eECS power consumption. Heat transfer with the surroundings and radiation through the windows vary with the flight phase, along with other heat sources like lights and cabin occupants. The model is based on validated correlations from in-series programs, such as the A320 family.
- The recirculation and ventilation system mixes air from the lower fuselage with fresh air from the eECS in the mixer and supplies it to the cockpit and cabin. Closed-loop airflow modeling, including air humidity, provides necessary feedback to the temperature control system, which is located in a separate module. Fans contribute to electrical power consumption and indirectly add heat loads that need to be considered by the eECS.
- Electrical power consumption from the eECS motors, cables, and power electronics is collected, and waste heat is distributed in the lower fuselage. This waste heat directly impacts the recirculation air temperature and heat transfer with the cabin through the floor. In the early design phase of the system described here, the model uncertainty is high, but it enables the exploration of different scenarios and designs.
2.2.2. eECS Architecture
The main functions of the environmental control system are to ensure sufficient fresh air supply, thermal comfort, and cabin pressure for the crew and passengers. The proposed new architecture combines an electrically driven Air Cycle System (ACS) and a Vapour Cycle System (VaCS), allowing the ECS to benefit from the intrinsic efficiency of both systems, thereby minimizing overall power consumption. The ACS is sized to ensure sufficient pressurization and fresh air flow supply while also covering heating and part of the cooling needs. The VaCS, with a higher coefficient of performance, is primarily used for cooling.
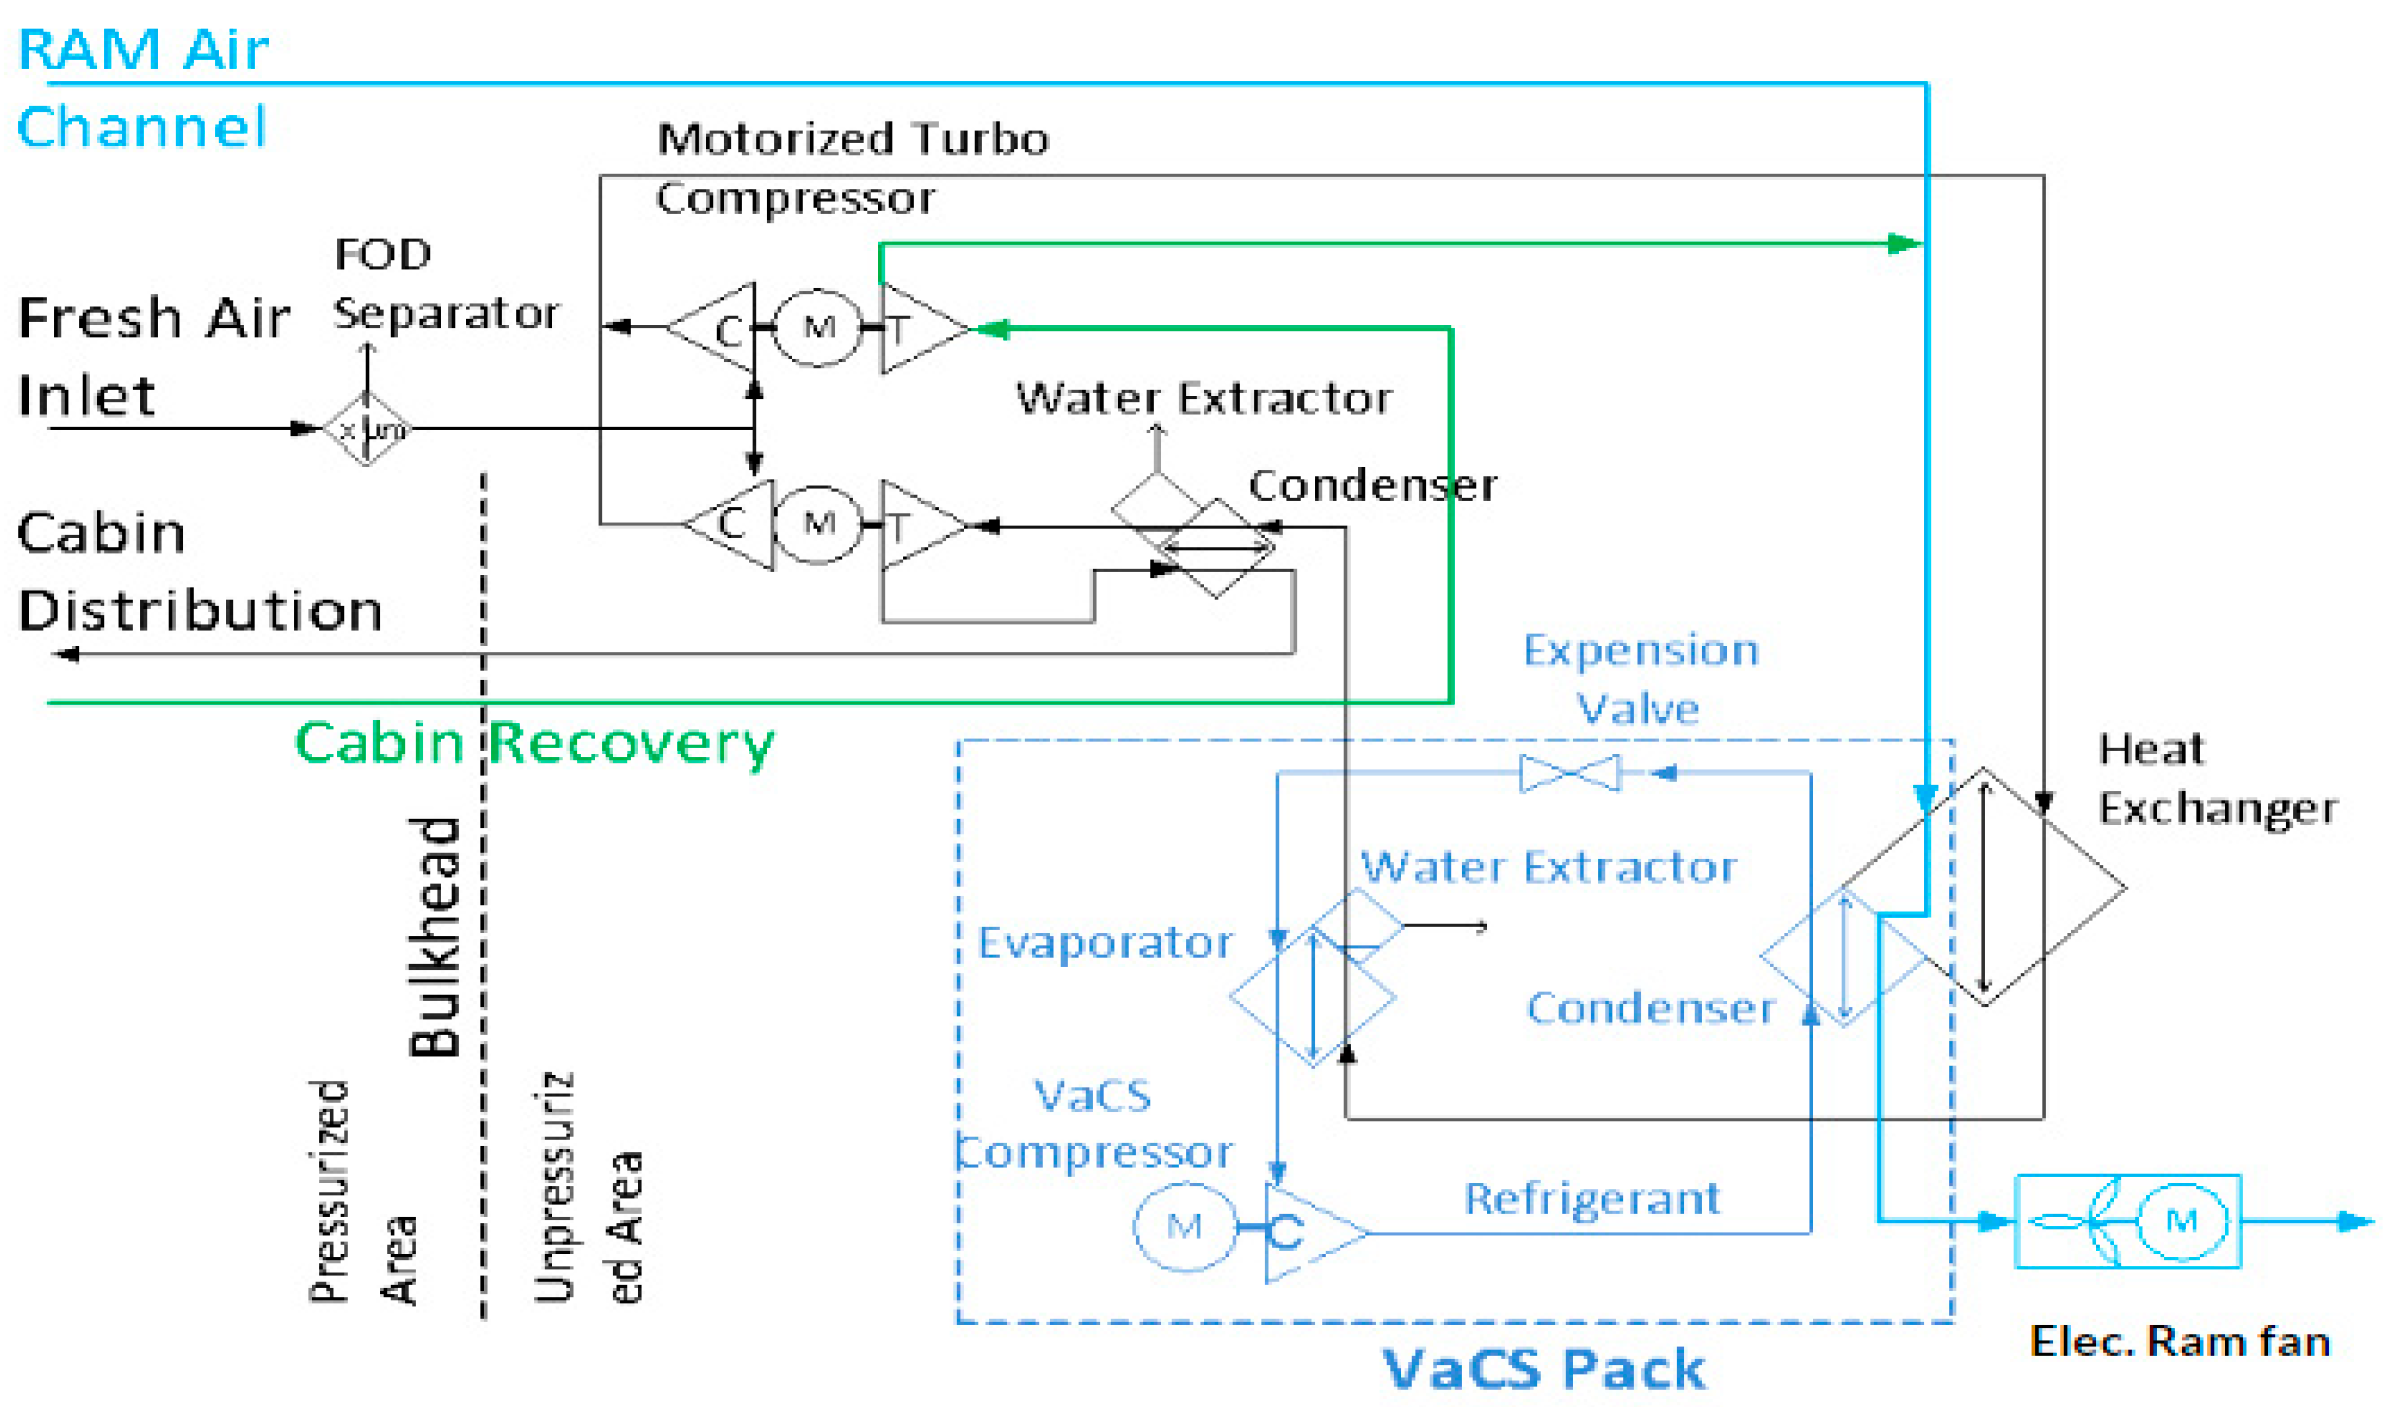
The modeled eECS system includes the following components, which are schematically depicted in Figure 2:
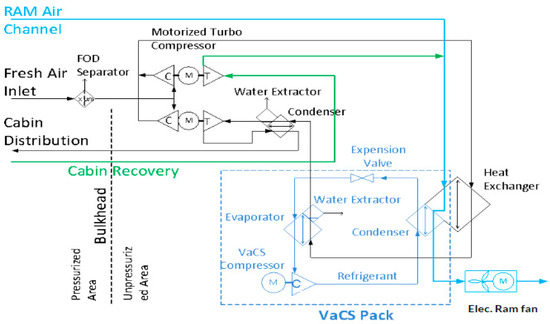
Figure 2.
Architecture schematic of the electrical air conditioning pack (eECS).
- Flush Air Intake to supply ambient air to the compressor associated with a Foreign Object Debris (FOD) separator.
- High power Main Motorized Turbo Compressor (MMTC) and cabin air Recovery Motorized Turbo Compressor (RMTC).
- Centrifugal compressor and evaporator within the VaCS pack.
- Electrical ram air fan to ensure ram air flow on the ground.
The ACS model employs physical modeling of each of its constituent components (turbomachinery, heat exchangers, ducting, and valves) within the Dymola/Modelica environment. It is developed based on thermodynamic and electromechanical equations and subsequently re-tuned and validated using data from prior flight tests, applying proper upscaling factors. This methodology ensures an accurate representation of both steady-state and transient behavior at the component and system levels.
Conversely, the VaCS model is categorized as a surrogate model suitable for scenarios where the physical equations are complex to define or necessitate extensive simulation times. This model is structured as a multidimensional map that correlates outputs to inputs and represents transient behavior through a representative transfer function. The input/output mapping and transfer function parameters are experimentally determined using a dedicated set of test cases on a VaCS test bench. This identification procedure involves dynamically varying the inputs of the VaCS on the test bench, using specific profiles such as step and sinusoidal signals, and recording the corresponding outputs for inlet compressor speed variation and the resulting outlet temperature. Identification methods are described in [7]. Following this, a post-treatment optimization is performed to derive the surrogate model that best fits the input/output mapping.
2.3. Model Integration
The model exchange between partners was supported by common wrapper classes, which contain the agreed-upon interface definition. The complete model can then be used directly as a component in Dymola. Alternatively, an FMU can be loaded into the wrapper with automated signal connections. This allows for a flexible mix of open models and FMUs in the overall system model.
The eECS sub-model (Figure 3) consists of a plant and a control model in separate FMUs, which are instantiated inside the eECS wrapper model and connected to its port interface. To protect the partner IP at the controls interface, the model is exported as an encrypted Dymola model before integration into the overall system.

Figure 3.
Modelica eECS model with system/ control FMU models inside the eECS wrapper model.
2.3.1. Numerical Issues and Solutions
Initially, larger synchronization time steps were planned to increase simulation speed. However, this approach led to pressure and mass flow oscillations. Therefore, a synchronization time step of 1 ms was required, which extended the simulation duration. One potential solution to improve this would be to integrate the control model with its associated plant model into the same simulation environment to avoid this co-simulation interface. Alternatively, the new features of the FMU standard 3.0 [8] could also improve the simulation speed in these cases. In particular, the following features could properly manage the high-dynamic coupling of the controller and the controlled system models:
- Clocks: Introduce clocks for synchronization of variable changes across FMUs;
- Co-Simulation with events: Introduces early return and event mode;
- Intermediate Variable Access: Allows access to intermediate input and output values between communication time points from the FMU to disclose relevant sub-system behavior for analysis or advanced co-simulation master algorithms for enhanced numerical stability.
2.3.2. Visualization
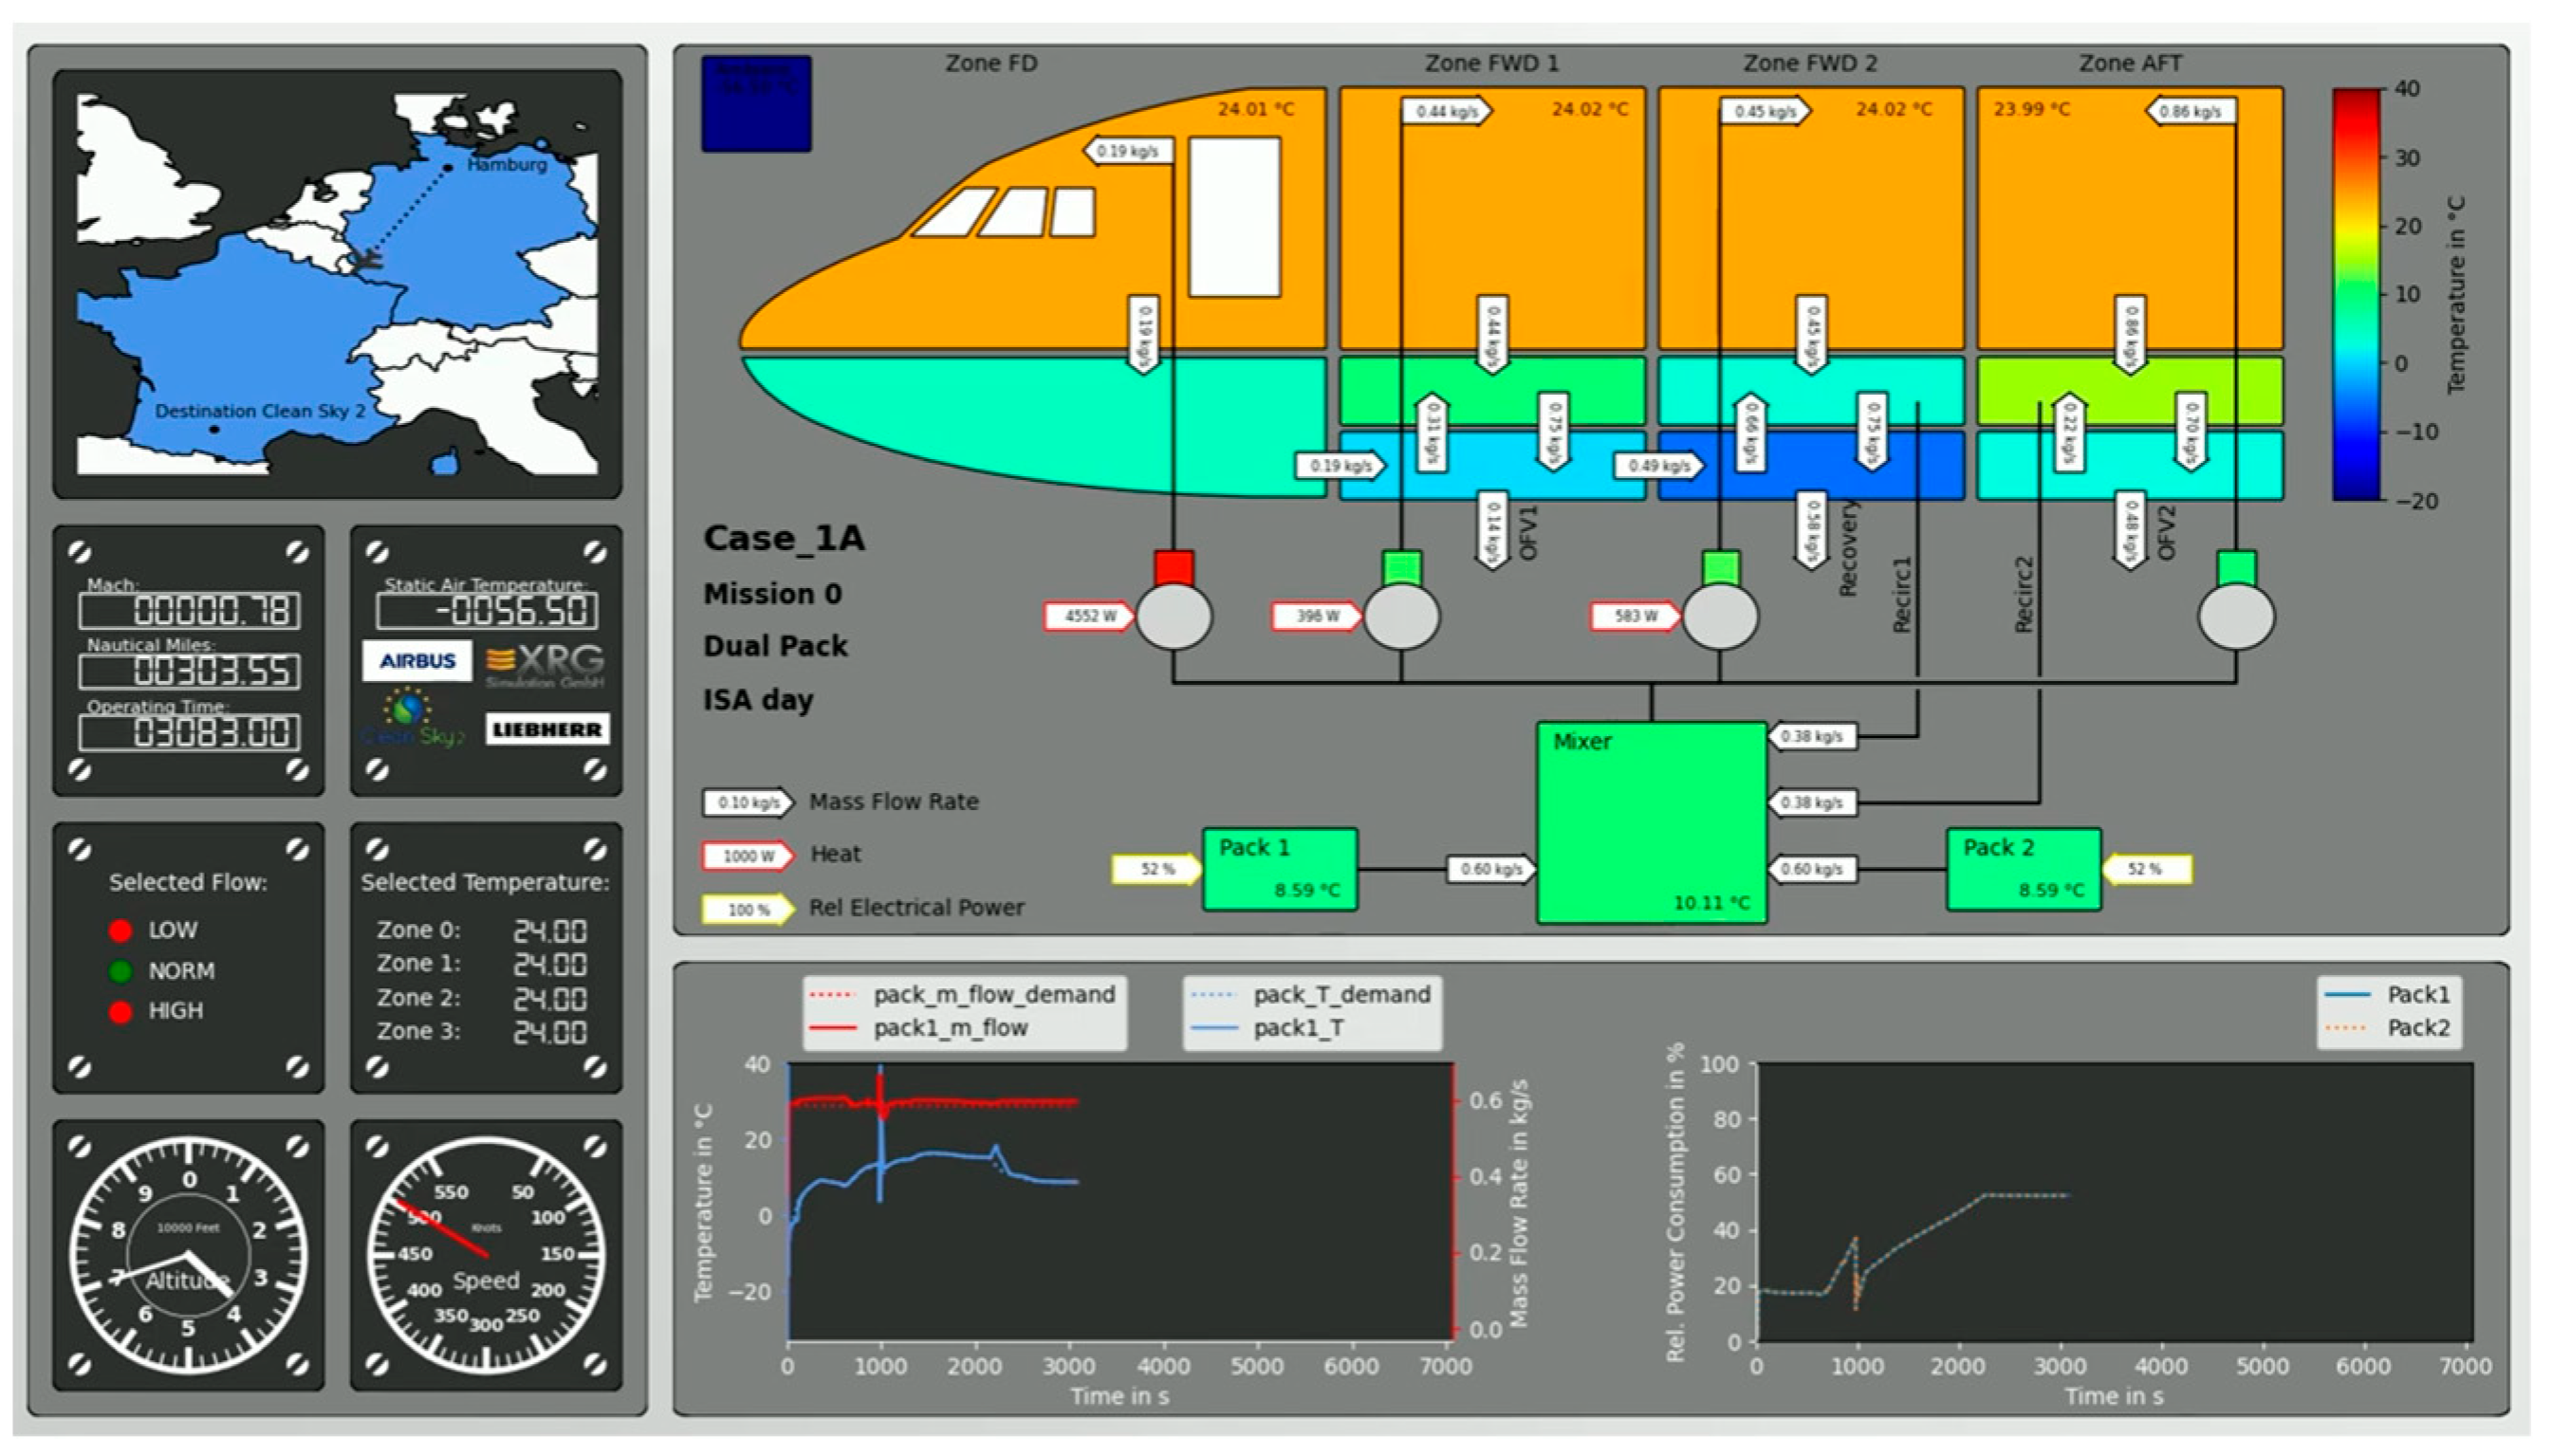
A dedicated user interface was developed to visualize key variables throughout the simulation of each flight mission profile. Simulations were recorded and compiled into video files for future analysis and reference. An example is shown in Figure 4.

Figure 4.
Visualization tool for dynamic analysis.
3. Results
The virtual demonstration was achieved by virtually operating the eECS in its relevant environment throughout 90 flight test cases, confirming its overall performance and stability. Throughout the virtual demonstration test campaign, problem reports were generated to address findings and enhance simulation models and system controls for future eECS maturation steps. A key advantage of virtual simulation is the ability to test conditions across the aircraft′s entire operational and environmental envelope—an outcome not achievable in laboratory or flight test environments.
3.1. Mission Profiles Simulation
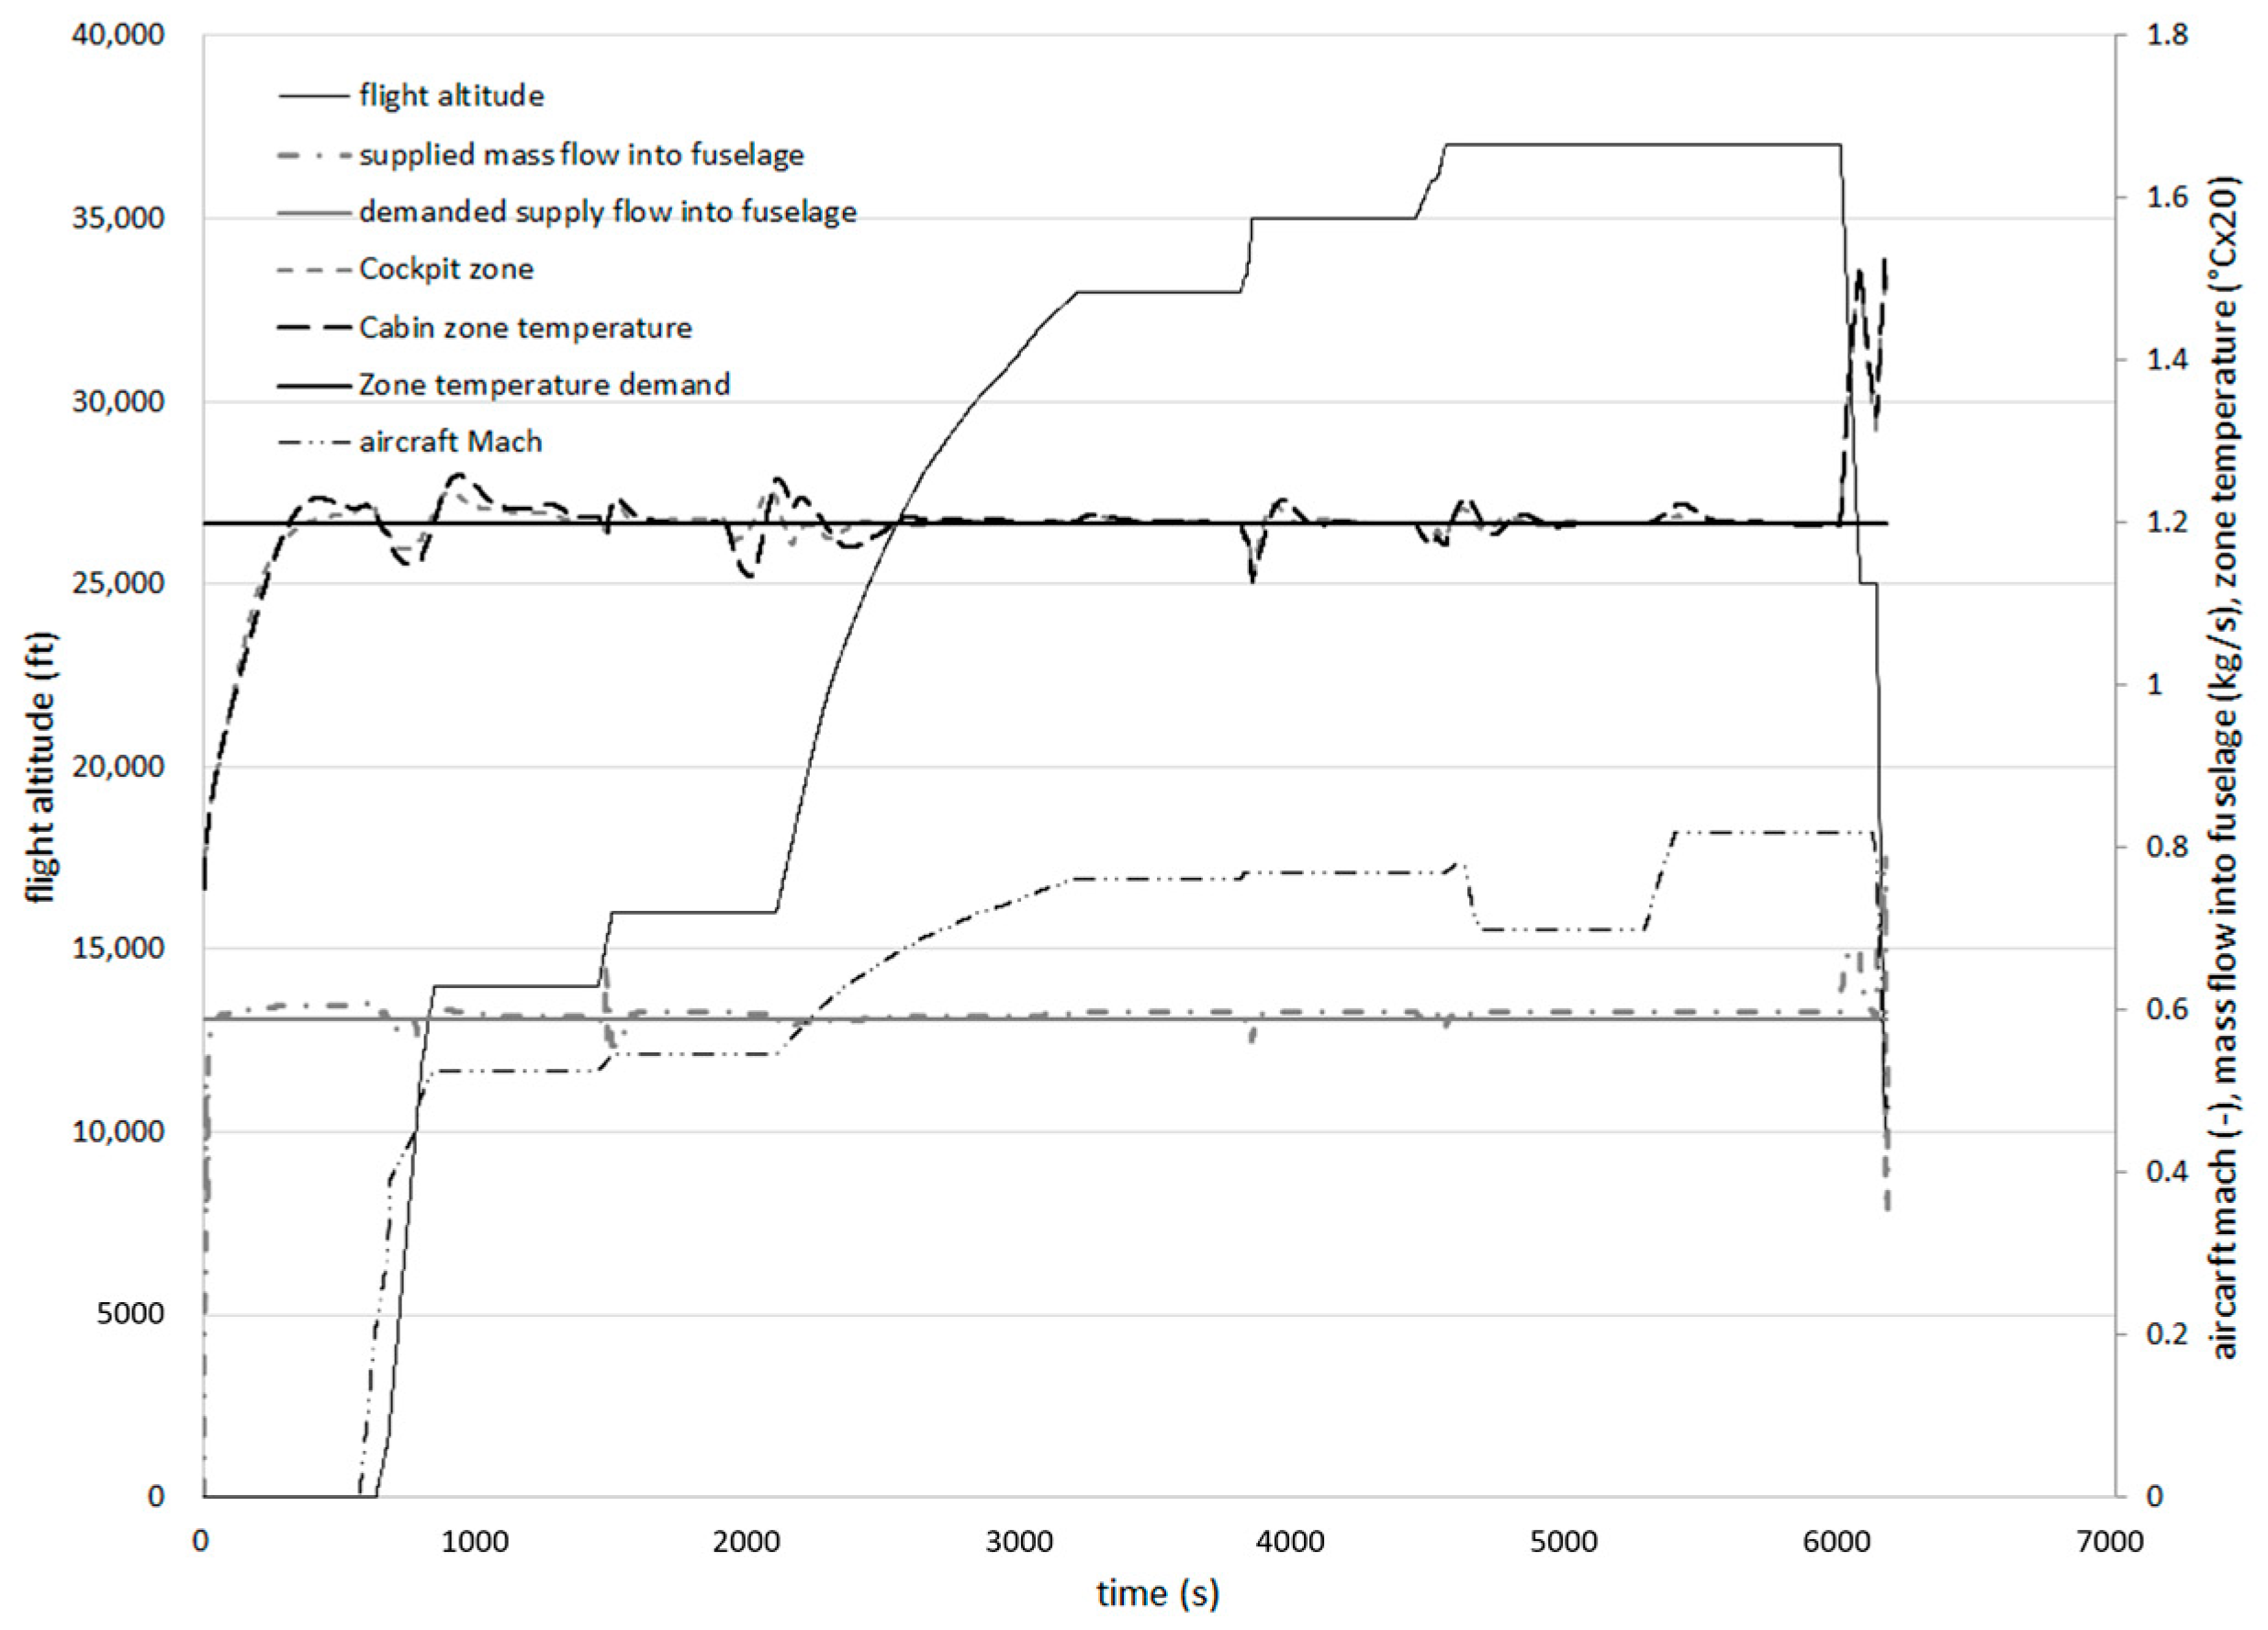
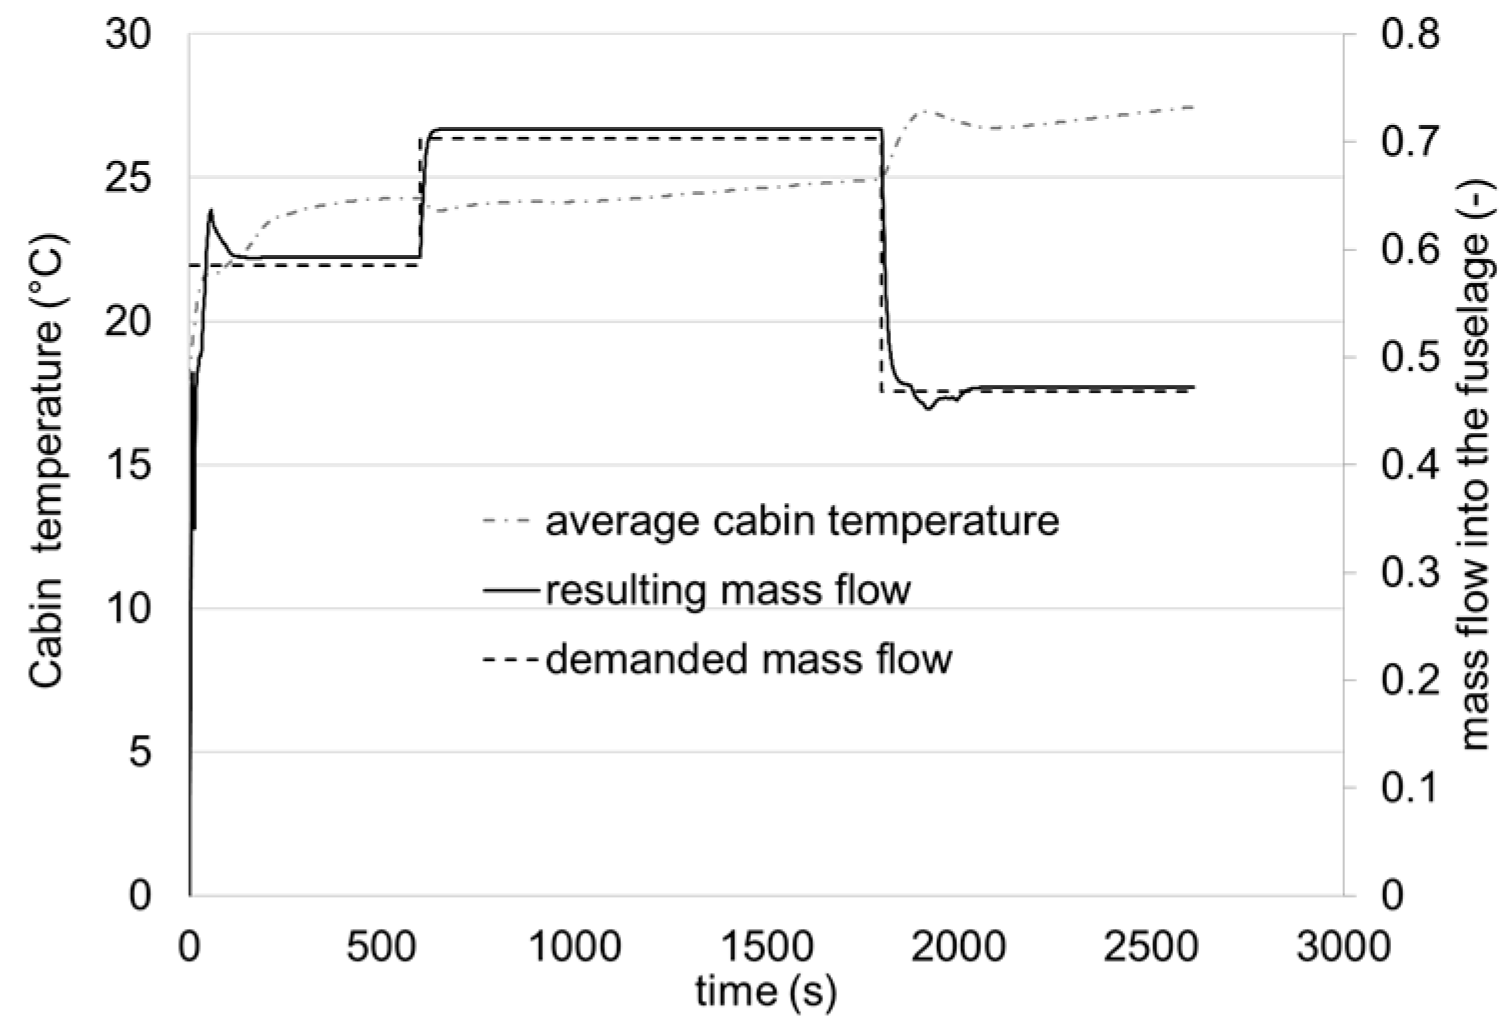
Figure 5 shows a mission profile case and its associated Mach conditions, as well as the pack flow and cabin temperature transient reaction. Figure 5 confirms that the resulting pack flow rate is following its target within the expected accuracy. Furthermore, the activation of the energy recovery module at 15,000 ft, as expected, provides supplementary mechanical power to drive the ambient air compressor with no negative impact on the cabin pressurization.
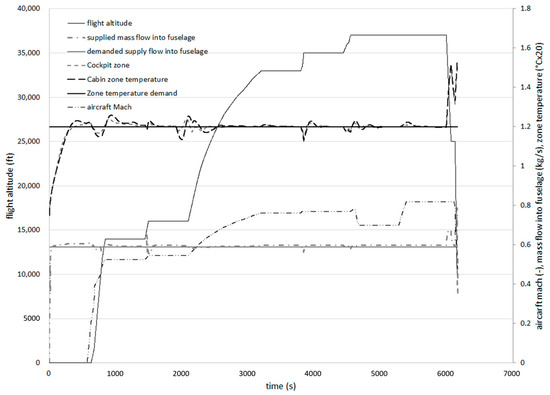
Figure 5.
A/C altitude and Mach profile demanded versus achieved mass flow and achieved cabin zone temperature over time for a given mission profile.
Figure 5 also shows that the resulting cabin temperature is reaching and following the requested target with an appropriate dynamic response. It also captures a numerical issue (stiffness) as observed on the temperature plot towards the end of the simulation. It should be noted that control optimization was not a focus at this stage and will be part of future studies and activities. A key finding is that thermal management of the cabin, in a closed loop with the cooling of electrical equipment in the center fuselage, is controllable, with zone temperatures remaining stable and aligned with the cabin temperature target.
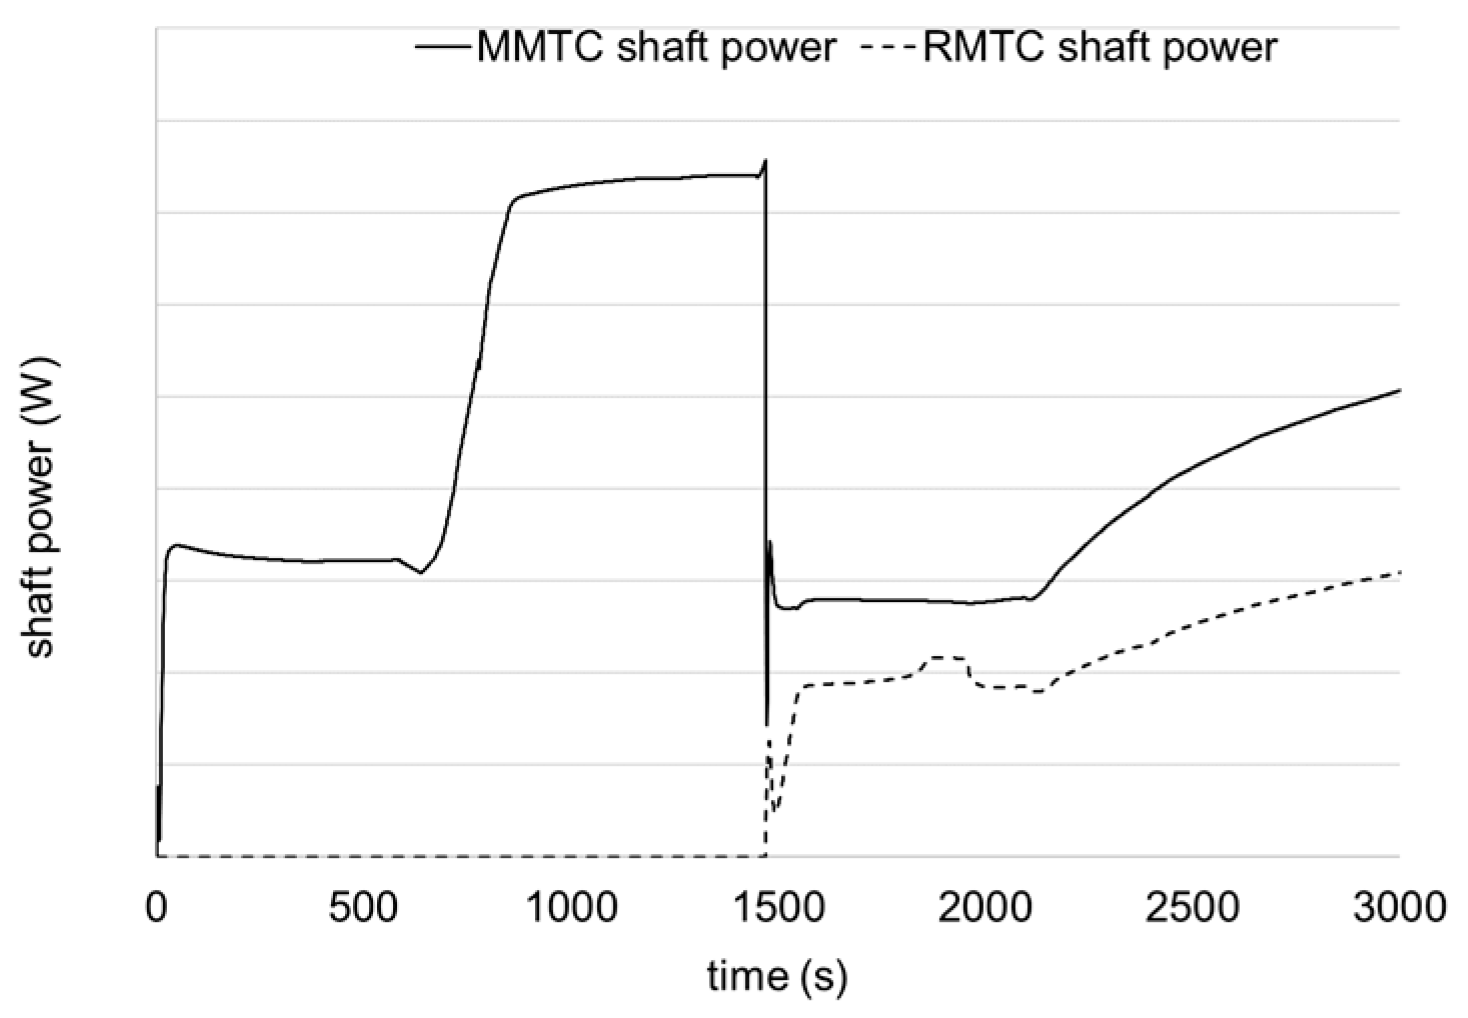
Another aspect of the virtual demonstration is also to evaluate and understand the overall operation of the eECS system during the flight mission. As described previously, the eECS architecture has two motorized turbo compressors, one of which uses exhausted cabin air as energy recovery to reduce the overall electrical power offtake. Its operation is initiated at intermediate flight altitudes, where the expansion of cabin air to the ambient can provide a significant level of mechanical power. The activation of the motorized turbo compressor has been successful, but at the same time, it was identified that the transition induced significant electrical power variations. These strong power variations are undesired for the electrical network and for the air conditioning system itself. Furthermore, the rapid and strongly varying transition also impacts the flow distribution into the fuselage, which may impact comfort criteria. Based on the simulation results, the control of the overall system has been modified such that the initiation of the second machine starts earlier, thereby ensuring a smooth transition while reducing the peak power. Figure 6 depicts the activation phase of both turbomachines during the climb phase. Additionally, an example of the system response to different flow settings during the pull-up phase is shown in Figure 7.

Figure 6.
Dynamic system reaction during turbomachinery transition phase.

Figure 7.
Dynamic system reaction during flow demand changes and pull-up phase.
3.2. Problem Reports
Throughout the virtual demonstration campaign, 193 problem reports have been recorded. These reports are clustered into numerical problems and system control issues. The identified numerical issues, such as stiffness shown in Section 3.1, illustrate challenges related to the simulation tool, while other cases, like the one in Figure 6, highlight learnings linked to the overall control concept. These problem reports will support further optimization and improvements to the models, eECS functions, and control software in subsequent development stages.
4. Discussion
4.1. Virtual Demonstration Input/Benefit for eECS System Technological Readiness
The virtual demonstration was crucial in providing evidence of successful electrical environmental control system Integration at technological readiness. It confirmed that the interaction of the ePack control with overall Air Systems controls is stable while meeting the required steady state and dynamic performance when operated in a representative environment over the flight cycle. This included the transient behavior of the pressure control system and heat loads from the power electronics. Various ground and flight scenarios were successfully tested, including hot and cold day start-up (pull down/up) under both high and low ambient temperatures in extreme environments.
4.2. Lessons Learnt
Simulation of integrated multi-system models with complex calculations is feasible but requires in-depth tool knowledge and high-performance computers to achieve acceptable simulation times. At this stage, the different models should also be developed in a single language to allow an open-tool computation and avoid tool interface losses. The multi-FMU modeling approach must be refined to produce a more effective and practical model.
It is important to keep in mind that problems encountered during the simulations can be numerical in nature or indicate real physical or control issues. With the appropriate analyses and optimization, the virtual demonstration is confirmed to be useful as a design Validation and Verification tool, allowing an early understanding of the required control optimization parameters and a detailed analysis of the system performance at extreme flight operational conditions, which would not be possible in a physical test rig and early maturation of architecture and reduced validation needs during a development phase.
With these benefits, the methodology developed for the virtual demonstration sets a significant step towards model-based engineering, prepares the landscape for future architecture trades, and defines the basis of models applied for the verification at the final development phase at the System Interface test benches.
5. Conclusions
Despite the significant co-simulation challenges, the virtual demonstration is considered a successful use-case of a new way of working based on an extensive model exchange between partners that enabled an accelerated evaluation of the integration of the electrical environmental control system into the aircraft. More generally, it also confirms the value of “Risk Driven Development” in focusing on the critical components and using a combination of testing, modeling, and simulation, allowing partners to reduce development time and increase the maturity of new technologies for use in future aircraft. This approach will be further applied and refined in the frame of Clean Aviation projects.
Author Contributions
Conceptualization, F.S., S.J.Z., S.A.S. and W.H.; methodology, software, investigation, A.M., K.P., B.M. and G.C.; project administration, J.R., R.A.G.; writing, S.J.Z., S.A.S., W.H., A.M., K.P. and B.M. All authors have read and agreed to the published version of the manuscript.
Funding
This research has received funding from the Clean Sky 2 Joint Undertaking under the European Union’s Horizon 2020 research and innovation program under grant agreement N° 945535.
Institutional Review Board Statement
Not applicable.
Informed Consent Statement
Not applicable.
Data Availability Statement
The original contributions presented in this study are included in the article. Further inquiries can be directed to the corresponding author.
Conflicts of Interest
Authors Frederic Sanchez, Walid Hankache, Ricardo Abib Gantus and Anthony Michou are employed by the company Liebherr-Aerospace Toulouse. Authors Jörg Riedel, Sijmen J. Zandstra, Stephan A. Schmidt, Katrin Proelss and Gülberg Celikel are employed by the company Airbus Operations GmbH. Author Boris Michaelsen was employed by the company XRG Simulation GmbH on behalf of Airbus.
References
- Subramanya, S.; Joksimović, A.; Carbonneau, X.; Rebholz, S.; Tong-Yette, F. Review of the Commercial Aircraft Environmental Control Systems: Historical Developments to the Current State of the Art. In Proceedings of the International Conference Proceedings, AIAA SCITECH 2024 Forum, Orlando, FL, USA, 8–12 January 2024. [Google Scholar]
- Schmidt, S.A.; Riedel, J.; Hepcke, F.; Casas, W.; Lavergne, D.; Sanchez, F.; Ricard, G. New Air Systems for More Electric Aircraft. In Proceedings of the MEA2021 Conference, Bordeaux, France, 21 October 2021. [Google Scholar]
- Schmidt, S.A.; Riedel, J.; Hepcke, F.; Casas, W.; Lavergne, D.; Sanchez, F.; Ricard, G.; Bonhora, J. New Air Systems for More Electric Aircraft. In Proceedings of the 12th EASN International Conference, Barcelona, Spain, 18 October 2022. [Google Scholar]
- Fioriti, M.; Di Fede, F. A Design Model for Electric Environmental Control System in Aircraft Conceptual and Preliminary Design. Int. Rev. Aerosp. Eng. 2023, 16, 2. [Google Scholar] [CrossRef]
- Bertsch, C.; Ahle, E.; Schulmeister, U. The Functional Mockup Interface—Seen from an industrial perspective. In Proceedings of the 10th International Modelica Conference, Lund, Sweden, 10–12 March 2014. [Google Scholar]
- ESDU 86002; Drag and Pressure Recovery Characteristics of Auxiliary Air Intakes at Subsonic Speeds. Item No. 86002. Engineering Sciences Data Unit: London, UK, 2004; p. 204.
- Landau, I.D.; Gianluca, Z. System Identification and Control Design, 1st ed.; Springer: London, UK, 2006; Chapters 6 & 7. [Google Scholar]
- Junghanns, A.; Gomes, C.; Schulze, C.; Schuch, K.; Blaesken, M.; Zacharias, I.; Pillekeit, A.; Wernersson, K.; Sommer, T.; Bertsch, C.; et al. The Functional Mockup Interface 3.0-New Features Enabling New Applications. In Proceedings of the 14th International Modelica Conference, Linköping, Sweden, 20–24 September 2021. [Google Scholar]

Disclaimer/Publisher’s Note: The statements, opinions and data contained in all publications are solely those of the individual author(s) and contributor(s) and not of MDPI and/or the editor(s). MDPI and/or the editor(s) disclaim responsibility for any injury to people or property resulting from any ideas, methods, instructions or products referred to in the content. |
© 2025 by the authors. Licensee MDPI, Basel, Switzerland. This article is an open access article distributed under the terms and conditions of the Creative Commons Attribution (CC BY) license (https://creativecommons.org/licenses/by/4.0/).