Abstract
The aim of this work is to present how the Life Cycle Assessment (LCA) tool can support sustainability reporting. A comprehensive analysis enables organizations to generate precise and quantitative data, e.g., on resource consumption, thus aligning with sustainability goals outlined in the reports. By pinpointing these areas, organizations can prioritize efforts to improve environmental performance where it matters most, ensuring that sustainability initiatives are focused and effective. Overall, the LCA serves as a valuable tool for organizations seeking to comply with sustainability reporting by providing robust data, insights, and guidance for improving environmental performance and fostering sustainable practices.
1. Introduction
The EU Directive 2022/2464, also called the Corporate Sustainability Reporting Directive (CSRD), came into force in 2023 as part of the European Green Deal. It requires large companies to disclose information on social and environmental aspects according to new mandatory standards, called European Sustainability Reporting Standards (ESRSs) [1].
However, companies are facing some challenges due to the complexity and resource intensity needed for this reporting, such as the diversity of environmental assessment methodologies, methods and standards, data collection procedures, assurance of the data quality, and their availability.
The Life Cycle Assessment (LCA), which is the indicated standard method to assess the environmental impacts of products, processes, or services throughout their entire life cycle, can support companies in overcoming some of these challenges, as business. They can use LCA results to provide quantifiable data on environmental impacts, supporting the requirements of ESRSs. Therefore, integrating an LCA into sustainability reporting can enhance the quality and depth of disclosures, and combining LCA with European Sustainability Reporting allows companies to provide detailed, transparent, and standardized information on their environmental impact, supporting broader sustainability goals and regulatory compliance within the European Union. This approach not only benefits stakeholders but also drives companies towards more sustainable and responsible business practices. When applied to supply chain data traceability, LCA can provide significant support in ensuring transparency, accountability, and sustainability.
This work intends to illustrate how an LCA can support the sustainability reporting by giving an example from the polymer industry. The Fraunhofer ICT developed, within the Clean Aviation EU program [2], an innovative polyurethane material for applications in aircraft seats. The new formulation is both flame-resistant (halogen-free) and made partly from bio-based renewable materials that replace traditional primary materials, and its global environmental footprint was calculated using an LCA.
Clean Aviation is the largest European research program for the development of the aeronautic industry, aiming to be the main contributor to the European Commission’s Flightpath 2050 goals set by the Advisory Council for Aviation Research and Innovation in Europe (ACARE). Fraunhofer took the lead of the Eco-Design Transversal Activity (ECO-TA) [3].
This work presents an overview of the methods and how they are correlated with an example from the aviation industry.
2. Methods and Context
The mission of the Clean Aviation Joint Undertaking (JU) is to develop new aircraft technologies and materials to support the European Green Deal and achieve climate neutrality by 2050 [4]. Thus, Clean Aviation is a “tool” of the EU Green Deal for the aviation industry. According to the European Green Deal, vast amounts of investments in the EU must be redirected towards sustainable activities. However, it has proven challenging to investors to identify which activities are truly sustainable or simply engaging in greenwashing. The main goal of the CSRD is precisely to introduce mandatory reporting standards for sustainability information, the ESRS, ensuring consistent and comparable disclosures [5].
In this regard, the new directive strengthens and extends the existing requirements for corporate sustainability reporting that existed under the Non-Financial Reporting Directive (NFRD). It aims to improve robustness, transparency, accountability, and comparability of the sustainability information disclosed by companies. This will align corporate practices with the EU’s broader sustainability goals, including the Green Deal and net-zero emissions targets [6]. Before the CSRD, non-financial reports were not very useful, as companies reported what and how they chose. Now, with the CSRD in place, companies are required to report their environmental performance according to the ESRS.
Hence, the CSRD is a crucial step in the EU’s efforts to promote sustainable finance, to ensure that investors and stakeholders have reliable, comparable information to assess companies’ sustainability performance.
The ESRS and LCA are closely linked in their approach to assessing environmental impacts, as both emphasize a comprehensive, science-based understanding of a company’s sustainability performance. Both share a common goal of improving sustainability reporting and decision making. While the ESRS sets the framework for corporate sustainability disclosures, the LCA provides the scientific and methodological foundation for assessing and quantifying impacts across a company’s value chain. Together, they create a comprehensive and actionable approach to sustainability in the EU.
2.1. European Sustainability Reporting Standards (ESRSs)
The ESRSs are categorized into different thematic areas and disclosure topics to address a wide range of Environmental, Social, and Governance (ESG) issues. The Environmental Standards are structured as follows [7]:
- ESRS E1—Climate Change: Covers Greenhouse Gas (GHG) emissions, climate-related risks, mitigation strategies, and adaptation.
- ESRS E2—Pollution: Addresses emissions to air, water, and soil, including pollutants and harmful substances.
- ESRS E3—Water and Marine Resources: Covers water consumption, quality, and marine ecosystems.
- ESRS E4—Biodiversity and Ecosystems: Focuses on impacts on biodiversity, deforestation, and ecosystem restoration.
- ESRS E5—Resource Use and Circular Economy: Addresses resource efficiency, waste management, and circular practices.
2.2. Life Cycle Assessment (LCA)
An Life Cycle Assessment addresses environmental aspects and potential environmental impacts throughout a product or service’s life cycle from raw material production through product manufacturing and use to disposal or recycling of the product. An LCA provides a comprehensive, systematic approach to understanding and improving environmental sustainability by analyzing the hotspots and consequences of every stage in the life cycle. The structure of a Life Cycle Assessment study is based on four phases: (1) Goal and scope definition; (2) Life Cycle Inventory Build-up and Analysis; (3) Life Cycle Impact Assessment; and (4) Interpretation [8].
2.3. Product Environmental Footprint (PEF)
The European Commission proposed the Product Environmental Footprint (PEF) and Organization Environmental Footprint methods as a common way of measuring the environmental performance of products. The PEF method, an LCA-based framework, defines system boundaries, databases and functional units, and it provides standardized methodologies to calculate and report environmental impacts across 16 impact categories (EF 3.1), such as carbon footprint, water use, toxicity, and eutrophication effects. The PEF is the most referred method by EU initiatives, recommended by the European Commission, and most used in LCA scientific studies [9,10].
2.4. Link Between ESRS, LCA, and EF
The ESRS requires companies to provide detailed environmental information about their operations and value chains. The LCA and PEF, which both emphasize a comprehensive and science-based understanding, are complementary tools to the ESRS that together help EU companies to assess and report their environmental impacts. The PEF provides detailed methodologies for product-level assessments that can be reported at company level under the ESRS, thereby fostering a more harmonized approach to sustainability across the EU. Table 1 presents an overview on how they are connected.

Table 1.
Link between ESRS, LCA, and PEF.
The ESRS adopts a life cycle perspective and applies the LCA method to ensure comprehensive sustainability reporting by requiring companies to assess impacts across their entire value chain. This aligns directly with the LCA approach, which considers the following:
- ○
- Upstream stages (“cradle-to-gate”): Pre-manufacturing activities (extraction, processing, and transportation of raw material, energy production), i.e., supply chain impacts.
- ○
- Core stage: Direct operational emissions and resource use during product manufacturing.
- ○
- Downstream stages (“cradle-to-grave/cradle”): Activities after product manufacturing (product use, end-of-life treatment).
3. Example from Clean Aviation
In this section, an example from Clean Aviation is presented to illustrate the link between ESRS reporting, the LCA, and PEF, with the innovative polyurethane bio-based material developed for aircraft seating cushions within Clean Aviation. The new material consists of polyol based on 70% fossil-based polyol and 30% bio-based polyol with the added benefit of the avoidance of hazardous substances, such as flame retardant. The foam used in the seats derives from biogenic origin are highly flame-resistant.
The structure of this study is based on the four phases of the LCA, which supports the understanding, approach, and assessment of the environmental impact of the product.
3.1. Innovative Bio-Based Material
Five bio-based materials have been studied, and the most prominent one, based on technical and environmental aspects, for the foam production, was the soybean. The transportation of different origins and further processing of the bio-oil to bio-based polyol were investigated. A screening of the environmental results with the most promising soybean oil compared to the fossil-based state of the art polyol showed advantages in the global warming potential and primary energy demand; nevertheless, other burdens such as water pollution and land use-related impacts were also identified. The general use of soybean polyol for seat foams, especially for aircrafts, can be an advantageous substitute for flame retardants [16].
3.2. Scope Definition
The scope defined for this study is fictive but based on the information of Fraunhofer ICT’s project (within Clean Aviation). The assumed scenario is that a European chemical company, which produces polymers from both fossil and biological resources must report the environmental impact along its supply chain illustrated in Figure 1. In practical terms, it must fill in the ESRS reports. For this example, the focus will be on the biopolymer production line, where the raw material required is soybean oil, which was purchased from a producer located in North America. The chemical industry sells polyols, which are intermediate products produced through the synthesis of flexible, rigid, and elastomeric material, to various countries worldwide. One of its clients is a European company that purchases biopolymers for producing aircraft seat cushions. Hence, the cradle-to-gate approach related to Scope 3 is assumed for the European bio-polyols sourced from the chemical industry.
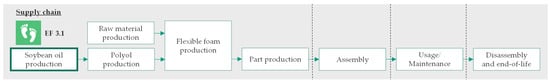
Figure 1.
Example: Life cycle of aircraft seat including supply chain.
3.2.1. System Boundary
The system boundary of this study includes mass (from, e.g., raw materials, water, chemicals), energy flows (inputs), and emissions to the environment (outputs) for each of the stages covered in the scope. In these stages, the processes considered are starting from the preparation of the land for the crop production; through cultivation and harvest of the raw material and oil production; and up to the delivery of soybean oil in Europe. The cultivation stage considers the seed sewing, cultivation period, plant protection (e.g., with herbicidal treatment), irrigation, and fertilization usage. Land use change emissions involving the transformation process of the natural land into an agricultural field is considered.
In the oil production site, the process steps of the beans involve the following: drying, the removal of their shells, heating, crushing, and pressing. Then, the solids are separated from the oil in a centrifuge. Lastly, the raw soybean oil is degummed.
All relevant transport processes—such as in-field for the cultivation and harvest, as well as ocean-going and inland of resources (through rail, truck or ship) and gases/fuel (through pipeline and/or tanker)—are covered. The process steps are presented in Figure 2, where the key data inputs and outputs can be seen per each process unit.

Figure 2.
System boundary and data required—example of soybean oil production.
All steps after the transport to Europe, related to polyol and polymer production, cushion and product manufacturing, product use, and its end of life are out of scope.
3.2.2. LCA Dataset
The foreground and background data to be prepared and collected for the modeling are defined based on the system boundary. The American company needs to identify and quantify the relevant parameters in each process step, and the flows are represented by the arrows in Figure 1. The specific information that is directly controlled and measured by the company (e.g., the quantity of pesticide and electricity) refers to the foreground database. Once these parameters are set and quantified, the background database has to be prepared. This information is not under the company’s control (e.g., chemical composition of the pesticide and North American electricity grid data). There are free and commercial LCA databases available that are provided by different institutions, such as Agribalyse, Agri-footprint, and Bioenergiedat [17].
For the environmental assessment of bio-based oil, the definition of the location of the crop, the land use history and type of crop are important factors that influence the land use change, eutrophication, acidification, and climate change indicators. The type and amount of pesticide and fertilizers affect the climate change, eutrophication, toxicity, and water pollution indicators. The location, type (e.g., from surface or groundwater), and amount of water consumption influence the indicator related to water use and on marine ecosystems.
The logistic steps and type of transport mainly have an impact on acidification, eutrophication, and climate change indicators as well as the industry maturity, e.g., the application of fertilizer and pesticide manually or with airplanes, harvesting with vehicles, animals, or manually.
For the example, the process dataset used is “Soybean oil, conditioned; technology mix; production mix, at plant; conditioned” from the Sphera database. The Sphera dataset, valid until 2026, covers all relevant process steps along the supply chain of the cradle-to-gate inventory, representing sufficient overall data quality. For the transport across the ocean, the dataset considered is “Sea transport of goods in containers with a payload of up to 27,500 dead weight tons” [18].
In order to provide a better understanding of the environmental impact of the production of bio-oil, a comparison to the benchmark, crude oil production in North America, has also been assessed. The system boundary includes the extraction of the raw material, oil production, and its transport to Europe. The data are also from Sphera database.
3.3. Results
For example, the American company can use an LCA tool (e.g., software, Excel) for the calculation of the environmental assessment of 1 kg of soybean oil and insert the results in its ESRS reports. The results of the example are calculated with the “LCA for Experts” software (Sphera 10.9) and presented in Table 2, including the comparison with the benchmark chosen.
Table 2.
EF results linked to the ESRS—example.
The results indicate that the overall environmental impact of crude oil is lower than that of bio-oil. Most indicators show reduced environmental effects for crude oil, except for ‘Eco-toxicity, freshwater’ and ‘Resource use, fossils’. This can be explained by the toxic substances from crude oil, such as hydrocarbons and heavy metals that can severely impact freshwater ecosystems. Crude oil is a fossil resource, so its production directly consumes non-renewable reserves. As a matter of fact, crude oil has been extensively refined and optimized over decades, which means that its extraction and processing generally follow highly efficient industrial processes. The conversion factors or yields from the crude oil processing chain to naphtha and light hydrocarbons, as well as the processing of substances, i.e., ethylene oxide and propylene oxide, to produce fossil-based polyol, are not considered.
3.4. Conclusions and Discussion
Indeed, the LCA is a structured and robust tool for environmental assessment. Companies should actively increase awareness and implement Life Cycle Thinking to foster sustainability. However, there are still some challenges and issues that companies need to face and overcome when dealing with environmental reporting.
Taking the example in this paper, the American company delivers to the European company only the EF results in the aggregated format of its oil production. The chemical industry cannot identify the origin of the impacts and how the biogenic carbon flows have been considered. An important aspect of bio-based materials is their biogenic carbon content related to the plant growth and released back into the atmosphere. The consideration of burden or credits of the biogenic carbon content in the bio-based material on the climate change indicator depends on the timeframe of the carbon storage in the forest system and the final product. Long-term effects should be considered when assessing the climate benefits of bio-based materials. It takes time for newly planted biomass to mature and absorb significant amounts of CO2. In the short term, the amount of captured and emitted carbon varies.
Different methods and approaches may be adopted, which lead to different LCA results. According to the ISO 14067:2018 [14], biogenic GHG emissions and removals should be included in the carbon footprint as two separate indicators. Meanwhile, the PEF guidance divides the climate change indicator into three sub-categories: ‘Climate change—biogenic, land use and land transformation’, which should be reported separately if the screening study shows a contribution of more than 5% each to the total score. An important aspect is that the indicator of EF 3.1 ‘Climate change—biogenic’ models only the methane (biogenic) emissions, and carbon dioxide emissions are excluded. The PEF defines the term ‘limited amount of time’ as 100 years, same as ISO 14067. Permanent carbon storage refers to carbon emissions after 100 years of its uptake, including the years of carbon storage in a forest system and final product. PEF guidance indicates that credits from ‘temporary carbon storage’ should be excluded and, if calculated, should be documented separately. These emissions are released within a limited amount of time after the carbon uptake (in a forest) and should be considered as emitted “now”, i.e., no credits should be given.
Therefore, if only the indicator “EF 3.1 Climate Change—total” is delivered, it is not possible to identify the calculation of biogenic GHG emissions/removal. There are some bio-polymer companies that communicate negative GHG emissions of a cradle-to-gate assessment, and mention that it was performed based on the PEF method. However, the PEFCR guidance states that, if the lifetime of the final product is not known, no carbon credit should be modeled at the “gate”.
The type of transport along all steps and land use change are other two important aspects when assessing the environmental impact of bio-based materials.
In general, all assumptions and biogenic GHG flows should be clearly communicated, as defined in the LCA tool. By adopting this approach, organizations can demonstrate their commitment to transparency and provide stakeholders with credible information on their environmental performance.
Another challenge could be in accessing the background database. Issues may arise from technical, financial, and contextual constraints related to the availability, quality, and relevance of the data. Many databases rely on generalized or outdated information due to a lack of region-specific data, especially for developing countries. Access to high-quality databases requires an expensive license, making them inaccessible to small organizations or researchers on a limited budget. Background databases are often based on generic datasets that may not reflect the specific characteristics of the product or the local conditions.
As a consequence, with the requirement of legislation, tools and databases are being improved to support companies in disclosing their environmental impact.
Author Contributions
Conceptualization, A.C.N.d.S. and P.B.; methodology, A.C.N.d.S.; validation, A.C.N.d.S. and P.B.; formal analysis, A.C.N.d.S.; investigation, A.C.N.d.S. and P.B.; data curation, A.C.N.d.S. and P.B.; writing—original draft preparation, A.C.N.d.S.; writing—review and editing, A.C.N.d.S. and P.B.; visualization, P.B. and A.C.N.d.S.; supervision, A.C.N.d.S.; project administration, A.C.N.d.S.; funding acquisition, A.C.N.d.S. All authors have read and agreed to the published version of the manuscript.
Funding
These research activities received supporting funding from the Clean Aviation Joint Undertaking under the European Union’s Horizon 2020 research and innovation program under grant agreement No. 945549 (ECO-TA), No. 945521 (Airframe ITD) and No. 101101955 SMR-ACAP. This publication reflects only the authors’ views, and the European Union is not liable for any use that may be made of the information contained therein.
Institutional Review Board Statement
Not applicable.
Informed Consent Statement
Not applicable.
Data Availability Statement
Data are contained within the article.
Conflicts of Interest
The authors declare no conflicts of interest.
References
- European Commission. Corporate Sustainability Reporting. Available online: https://finance.ec.europa.eu/capital-markets-union-and-financial-markets/company-reporting-and-auditing/company-reporting/corporate-sustainability-reporting_en#:~:text=On%205%20January%202023%2C%20the,that%20companies%20have%20to%20report (accessed on 2 December 2024).
- Clean Aviation. Mission and Values. Available online: https://www.clean-aviation.eu/mission-and-values (accessed on 2 December 2024).
- Clean Sky 2. 2020 Consolidated Annual Activity Report. Available online: https://www.clean-aviation.eu/sites/default/files/2021-10/Consolidated-AAR-2020_en.pdf (accessed on 2 December 2024).
- SRIA, 2nd Revision of the Strategic Research and Innovation Agenda (SRIA) of the Clean Aviation Joint Undertaking. Towards Disruptive Technologies for New Generation Aircraft by 2035. Available online: https://clean-aviation.eu/sites/default/files/2024-09/2024-Clean-Aviation-SRIA.pdf (accessed on 2 December 2024).
- European Parliament and Council. Directive (EU) 2022/2464 of the European Parliament and of the Council of 14 December 2022 Amending Regulation (EU) No 537/2014, Directive 2004/109/EC, Directive 2006/43/EC and Directive 2013/34/EU, as Regards Corporate Sustainability Reporting. Available online: https://eur-lex.europa.eu/legal-content/EN/TXT/PDF/?uri=CELEX:32022L2464 (accessed on 2 December 2024).
- European Commission. 2050 Long-Term Strategy. Available online: https://climate.ec.europa.eu/eu-action/climate-strategies-targets/2050-long-term-strategy_en (accessed on 2 December 2024).
- EFRAG. [Draft] European Sustainability Reporting Standards. ESRS 1 General Requirements, 2022. Available online: https://www.efrag.org/sites/default/files/sites/webpublishing/SiteAssets/08%20Draft%20ESRS%20E1%20Climate%20Change%20November%202022.pdf (accessed on 2 December 2024).
- ISO 14040:2006; Environmental Management—Life Cycle Assessment—Principles and Framework. International Organization for Standardization (ISO): Geneva, Switzerland, 2006.
- EU-Commission Recommendation. Commission Recommendation (EU) 2021/2279 of 15 December 2021 on the Use of the Environmental Footprint Methods to Measure and Communicate the Life Cycle Environmental Performance of Products and Organizations, Official Journal of the European Union. 2021. Available online: https://eur-lex.europa.eu/eli/reco/2021/2279/oj (accessed on 2 December 2024).
- European Platform on LCA (EPLCA). Product Environmental Footprint Category Rules Guidance. 2018. Available online: https://eplca.jrc.ec.europa.eu/permalink/PEFCR_guidance_v6.3-2.pdf (accessed on 2 December 2024).
- ISO 14067:2018; Greenhouse Gases—Carbon Footprint (CFP) of Products—Requirements and Guidelines for Quantification. International Organization for Standardization: Geneva, Switzerland, 2018.
- DIN EN 15804:2022-03; Sustainability of Construction Works-Environmental Product Declarations-Core rules for the Product Category of Construction Products. DIN Deutsches Institut für Normung: Berlin, Germany, 2022.
- LANCA. LANCA® Characterization Factors for Life Cycle Assessment; Version 2.0; Fraunhofer Verlag: Stuttgart, Germany, 2016. [Google Scholar]
- SALCA. Recommended impact assessment method within Swiss Agricultural Life Cycle Assessment (SALCA): v2.01. Agroscope Sci. 2024, 183. [CrossRef]
- ISO 21930: 2017; Sustainability in Buildings and Civil Engineering Works—Core Rules for Environmental Product Declarations of Construction Products and Services. International Organization for Standardization: Geneva, Switzerland, 2019.
- Höhne, C.-C.; Salles, A.; Brantsch, P.; Reichert, T.; Hanich-Spahn, R. Environmental Improvement Potential of Flexible Polyurethane Foam for Aviation Applications—A Case Example Analysis. J. Phys. Conf. Ser. 2023, 2526, 12053. [Google Scholar] [CrossRef]
- OpenLCA. Available online: https://www.openlca.org/lca-data/ (accessed on 2 December 2024).
- Sphera Managed LCA Content Databases (Website); Sphera Solutions GmbH: Stuttgart, Germany. Available online: https://lcadatabase.sphera.com/ (accessed on 2 December 2024).


Disclaimer/Publisher’s Note: The statements, opinions and data contained in all publications are solely those of the individual author(s) and contributor(s) and not of MDPI and/or the editor(s). MDPI and/or the editor(s) disclaim responsibility for any injury to people or property resulting from any ideas, methods, instructions or products referred to in the content. |
© 2025 by the authors. Licensee MDPI, Basel, Switzerland. This article is an open access article distributed under the terms and conditions of the Creative Commons Attribution (CC BY) license (https://creativecommons.org/licenses/by/4.0/).